RUHR ECONOMIC PAPERS - Supporting Carbon Taxes: The Role of Fairness - RWI Essen
←
→
Page content transcription
If your browser does not render page correctly, please read the page content below
RUHR
                                           ECONOMIC PAPERS

Stephan Sommer
 Linus Mattauch
  Michael Pahle

                  Supporting Carbon Taxes: The Role of
                  Fairness

                                                         #873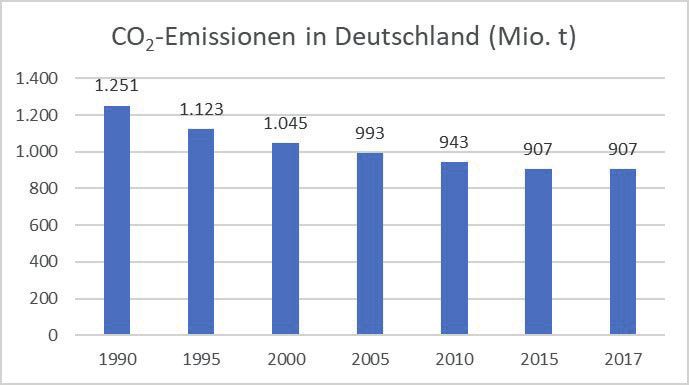
Imprint

Ruhr Economic Papers
Published by
RWI – Leibniz-Institut für Wirtschaftsforschung
Hohenzollernstr. 1-3, 45128 Essen, Germany
Ruhr-Universität Bochum (RUB), Department of Economics
Universitätsstr. 150, 44801 Bochum, Germany
Technische Universität Dortmund, Department of Economic and Social Sciences
Vogelpothsweg 87, 44227 Dortmund, Germany
Universität Duisburg-Essen, Department of Economics
Universitätsstr. 12, 45117 Essen, Germany

Editors
Prof. Dr. Thomas K. Bauer
RUB, Department of Economics, Empirical Economics
Phone: +49 (0) 234/3 22 83 41, e-mail: thomas.bauer@rub.de
Prof. Dr. Wolfgang Leininger
Technische Universität Dortmund, Department of Economic and Social Sciences
Economics – Microeconomics
Phone: +49 (0) 231/7 55-3297, e-mail: W.Leininger@tu-dortmund.de
Prof. Dr. Volker Clausen
University of Duisburg-Essen, Department of Economics
International Economics
Phone: +49 (0) 201/1 83-3655, e-mail: vclausen@vwl.uni-due.de
Prof. Dr. Ronald Bachmann, Prof. Dr. Manuel Frondel, Prof. Dr. Torsten Schmidt,
Prof. Dr. Ansgar Wübker
RWI, Phone: +49 (0) 201/81 49 -213, e-mail: presse@rwi-essen.de

Editorial Office
Sabine Weiler
RWI, Phone: +49 (0) 201/81 49-213, e-mail: sabine.weiler@rwi-essen.de

Ruhr Economic Papers #873
Responsible Editor: Manuel Frondel
All rights reserved. Essen, Germany, 2020
ISSN 1864-4872 (online) – ISBN 978-3-96973-010-2

The working papers published in the series constitute work in progress circulated to stimulate
discussion and critical comments. Views expressed represent exclusively the authors’ own opinions
and do not necessarily reflect those of the editors.
Ruhr Economic Papers #873
       Stephan Sommer, Linus Mattauch, and Michael Pahle

Supporting Carbon Taxes: The Role of
                           Fairness
Bibliografische Informationen der Deutschen Nationalbibliothek The Deutsche Nationalbibliothek lists this publication in the Deutsche Nationalbibliografie; detailed bibliographic data are available on the Internet at http://dnb.dnb.de RWI is funded by the Federal Government and the federal state of North Rhine-Westphalia. http://dx.doi.org/10.4419/96973010 ISSN 1864-4872 (online) ISBN 978-3-96973-010-2
Stephan Sommer, Linus Mattauch, and Michael Pahle1

Supporting Carbon Taxes: The Role of
Fairness

Abstract
We conduct a discrete choice experiment with a sample of 6,000 German household heads to examine
how fairness preferences influence the support for carbon taxes and revenue-recycling options. While it
is well-known that carbon taxes are effective in reducing emissions and can be made progressive, they
remain fairly unpopular with German citizens. Consequently, best practice to build public support for them
remains a relevant question for which there is no consensus. We obtain two major results: First, while green
spending is more popular in general, it is significantly more popular among those who are pro-environment
and trust the government. Second, when restricted to options for direct revenue redistribution, Germans
prefer lump-sum payments over directing payments to the poorest or the most affected. Importantly, choices
over these options depend both on genuinely different conceptions of fairness and respondents’ economic
circumstances. Our findings have implications for building support for effective climate change mitigation
policies with those who are not yet convinced.

JEL-Code: A13, H23, Q54

Keywords: Carbon pricing; climate change mitigation; fairness; redistribution; environmental tax reform

December 2020

1 Stephan Sommer, RWI; Linus Mattauch, University of Oxford; Michael Pahle, Potsdam-Institute. – We thank Johanna
Arlinghaus, Simon Dietz, Franziska Funke, David Klenert, Christina Roolfs, Benjamin Tereick, as well as seminar audiences
in Berlin, Leipzig, and Oxford for useful discussions. We gratefully acknowledge financial support by the German Federal
Ministry for Economic Affairs and Energy (BMWi, grant 03EI5213) and the German Federal Ministry for Education and
Research (BMBF) in the framework of the Kopernikus project Ariadne (grant 03SFK5C0). The experiment in this paper
was pre-registered in the AEA RCT Registry (AEARCTR-0004829; http://www.socialscienceregistry.org/trials/4829).-
All correspondence to: Stephan Sommer, RWI, Hohenzollernstr. 1-3, 45128 Essen, Germany, e-mail:
stephan.sommer@rwi-essen.de
1    Introduction

    Many governments currently struggle to regulate the carbon emissions of their
economies so that their national climate targets are met. One hundred years after
the publication of Pigou’s “The Economics of Welfare” (Pigou, 2013), there can be no
question that pricing carbon is the most efficient way to reduce emissions. Recent
work in environmental public economics additionally has clarified that carbon pric-
ing, when the revenue is recycled progressively, has better distributional implications
than regulations by efficiency standards (Fullerton and Muehlegger, 2019; Levinson,
2019; Davis and Knittel, 2019) . So if carbon pricing is both efficient and can be made
equitable, why does the public – which does demand more climate action by large
majorities in many countries – not strongly support carbon pricing? We introduce a
novel approach to examining carbon pricing design by studying it from the premise
of what citizens think is fair. We find fairness is crucial for political support, which
implies that a broader understanding of fairness is an important piece of solving this
“Pigouvian puzzle”.

    In normative social science, different conceptions of fairness exist, which lead to
diverging positions about recommended policies (Fleurbaey and Maniquet, 2011). For
example, these different conceptions imply that fair allocations could be based on
equality, equity, merits, needs or still further principles (Deutsch, 1975; Folger et al.,
1995). Moreover, empirical research has established that different groups in society
entertain alternative views about morality (Haidt, 2007; Greene, 2013). Surprisingly,
real differences about fairness conceptions have not been connected so far to policy
evaluations of environmental tax reforms. Instead, the focus has mostly been on de-
signing policies to be progressive in their impact on income inequality, taking the en-
tailed fairness conception as given and ethically desirable.

    To wit, a large body of literature has studied the effects of taxation on income
equality (Atkinson and Stiglitz, 1976; Piketty, 2003). Specifically, in environmental eco-
nomics, the distributional effects of energy taxes (Fullerton, 2011; Jacobs and van der

                                            1
Ploeg, 2019; Pizer and Sexton, 2019), the optimal carbon tax (Nordhaus, 1992; Gerlagh
and Liski, 2018; Sallee, 2019), and the trade-off between income equality and efficiency
(Goulder et al., 2019) are well studied. However, research about the fairness percep-
tions of environmental tax reforms by citizens is scarce (see Dietz and Atkinson, 2010
for an exception), even though the perception of a tax reform could be decisive for its
political feasibility (Goulder, 2020). Furthermore, a nascent strand of environmental
economics has found that many policies are viewed widely as normatively desirable
by economists, but are unpopular with the public and unsuccessful in the policy pro-
cess (Douenne and Fabre, 2019; Carattini et al., 2017; Kallbekken et al., 2011; Maestre-
Andrés et al., 2019). The extent to which this hinges on different fairness conceptions
beyond income inequality is unclear.
In this paper, we analyze the importance of fairness preferences for the support of
carbon prices and its interaction with revenue recycling schemes. Guided by theoret-
ical motivation on fairness in political theory and behavioral economics to rationalize
policy choices, we conduct a survey and embed a discrete-choice experiment with ran-
domized information treatments. In the experiment, we explain different fairness con-
ceptions and their distributional implications to respondents in the treatment group
and measure the effect on the support for a carbon tax in a representative sample cov-
ering about 6,000 German household heads.
Research on public support for carbon taxes (Douenne and Fabre, 2019; Carattini
et al., 2017; Kallbekken et al., 2011; Maestre-Andrés et al., 2019) has not conclusively
settled two debates of high policy relevance: First, on the one hand, scholars advocate
for forms of direct redistribution to alleviate fairness concerns. On the other hand,
some studies suggest that green spending, at least in a European context, is the best
option for policy-makers to increase public support of environmental pricing. This
emphasizes that citizens find the idea of reducing pollution by a price so unintuitive
that green spending is needed to convince them of the environmental policy’s impact.
In other words, carbon pricing is not perceived as a mean in itself, but rather as a
source of financing for other measures to reduce emissions. Second, if the tax revenue
2is used for redistribution, there is disagreement whether a lump-sum payment to all
citizens (popularized as carbon dividend by the Climate Leadership Council; Akerlof
et al., 2019) or more targeted transfers to either the poorest or the most affected by a
higher carbon price should be applied. The role of fairness motives on this choice have
not been disentangled so far.
We find the following specific results to address these debates: Only carbon prices
of EUR 10 / t CO2 would be generally supported by a majority of respondents: Unsur-
prisingly, the support decreases with higher carbon taxes and this decrease is particu-
larly strong for respondents who are more affected. Our experimental design permits
to shed new light, however, on the two debates about revenue redistribution: First,
we show that while green spending is indeed the most popular revenue recycling op-
tion overall, it is significantly more popular with those who have pro-environmental
attitudes, believe climate change is real, trust the government, and are on the political
left. It is more unpopular among residents who would financially suffer most from
carbon prices. This has important implications: Green spending, while popular, might
thus run the risk of “preaching to the converted” rather than building societal support
with the groups that tend to oppose climate action. As such, it may lead to further
polarization of an already polarized issue. Moreover, respondents who support green
spending are more likely to support carbon taxes as well. Yet, their willingness to
accept a carbon tax drops particularly sharply when the tax rate increases. In con-
trast, the acceptance rate of a carbon tax is ultimately unaffected by higher tax rates if
respondents are in favor of social cushioning, i.e. directing the revenues to the poorest.
Second, when restricting the choice to options for revenue-neutral direct redistri-
bution, most of our respondents prefer lump-sum payments over channelling tax rev-
enue to the poorest or the most affected. Those on the political left tend to prefer re-
distribution to the poorest and those personally most affected by higher carbon prices
have a preference for being compensated. A lump-sum transfer is preferred by an ab-
solute majority of our subjects. This finding may be partially explained by the fairly
well developed German welfare system: giving a small amount to the rich is dwarfed
3by their large tax payments. Accordingly, in fairness terms, the already pre-existing
state of fairness in terms of income distribution is only marginally distorted.
Third, our treatment of explaining the fairness consequences to respondents in-
duces some individuals to rethink their fairness preferences. In particular, respondents
are steered away from their preference for the lump-sum payment and rather prefer
channeling revenues to the poorest or the most affected individuals. When the pre-
ferred revenue-recycling scheme is implemented, the support rate increases by some
16%. Nevertheless, this implies that household’s genuine fairness views are fairly sta-
ble and perhaps not as closely associated with their views about specific policy instru-
ments as one might think. Increasing public support may be necessary for passage and
preservation of carbon prices – and fairness views matter to understand support, but
beyond that might not be a good guide for designing policies creating a just society.
Our article builds upon a sizeable recent literature on public support for carbon
pricing, mostly in a European context: In a recent meta-study, Maestre-Andrés et al.
(2019) propose three fairness-related aspects regarding carbon taxation: (1) personal,
i.e. related to individual consequences, (2) distributional, i.e. related to others or every-
one, and (3) procedural, i.e. related to the application of rules relevant to a procedure.
Most of the literature has focused on distributional fairness, i.e. regarding the conse-
quences to others for which the scheme to redistribute carbon pricing revenues is a
well-known policy lever (e.g. Klenert et al., 2018a). There is already an extensive and
growing literature on the distributional effects of carbon taxes (Rausch et al., 2011;
Klenert and Mattauch, 2016; Klenert et al., 2018b; Douenne, 2020) and the willingness-
to-pay (WTP) for carbon taxes. For instance, Alberini et al. (2018a) show that the mean
WTP to avoid one ton of CO2 emissions amounts to EUR 94 and EUR 133 in the Czech
Republic and Italy, respectively. Similiary, Kotchen et al. (2017) find that the average
American citizen is willing to pay USD 144 for a tax on fossil fuels. Recently, Douenne
and Fabre (2020) document a large rejection for carbon taxes in France.
Furthermore, the literature has established a great deal of heterogeneity with re-
spect to individual characteristics and policy attributes (Alberini et al., 2018b; Thal-
4mann, 2004; Svenningsen and Thorsen, 2019), the interaction with nudges (Hagmann
et al., 2019), cultural worldviews (Cherry et al., 2017), and pereceived environmen-
tal (Baranzini and Carattini, 2017; Kallbekken and Sælen, 2011) as well as monetary
effects (Douenne and Fabre, 2019). In addition, the support for carbon taxes may de-
pend on how the revenues are used. For instance, Kotchen et al. (2017) detect that
Americans are most supportive of using the revenues to invest in clean infrastructure
(so-called green spending), while less than half of the respondents support an equal
redistribution to all citizens (lump-sum payment). Similarly, Baranzini and Carattini
(2017) show that public support for a carbon tax increases with green spending, while
Kallbekken et al. (2011) find that recycling the revenues to more narrowly targeted
groups seems to increase the support for taxation. In an international survey, Carattini
et al. (2019) show that lowering income taxes, redistributing revenues domestically,
and green spending receive majority support. Carattini et al. (2017) find that mak-
ing distributional effects of revenue recycling schemes more salient increases the de-
mand for progressive designs. Inquiring about the acceptability of a carbon tax among
US and German citizens, Beiser-McGrath and Bernauer (2019) detect that it increases
when other countries introduce a similar carbon tax.
However, this line of research has so far paid little attention to the fact that different
conceptions of fairness exist and preferences for them vary across people. Participants
in surveys are typically informed about the distributional impacts of different policy
choices and asked to choose between compensatory measures. The influence of both
factors (distributional impacts and compensatory measures) on the support is inter-
preted as being due to perceived fairness (Maestre-Andrés et al., 2019). But different
conceptions of fairness exist, and correspondingly people differ in what they think is
fair. Accordingly, our methodical contribution is to extend the empirical approach to
public support for carbon pricing by taking into account that a given distributional
impact or compensatory measure may be judged both as fair and unfair depending on
the person’s fairness preferences.
Our study is of policy-relevance for anyone concerned with building higher sup-
5port for Pigouvian pricing. Politicians are well-advised to not use all environmental
tax proceeds for green spending purposes, as it could leave those disengaged about
the environment outside of the conversation. A lump-sum payment appears to have
broadest appeal because it seems to address a wide variety of fairness motives and
own economic interests.1 Rich countries that enacted a major carbon price reform in
the past used the revenue for several modes of spending at the same time (see Klenert
et al., 2018a). Our study underlines that such revenue use to make carbon pricing work
for all citizens is an essential feature, rather than a political bug of political successful
environmental taxation, which is not the case for naïve double dividend proposals
that entail the reduction of other taxes for instance. What is more, with increasingly
ambitious climate policies in the future both the distributional impacts as well as the
revenues are bound to grow. Sooner or later the question of recycling will thus become
conflated with questions of broader societal redistribution. If anything, this will make
the issue of fairness only more relevant.
2 Theoretical Motivation
Our study draws on three different theoretical frames: (i) properties of carbon price
reforms, (ii) political philosophy of different fairness conceptions, and (iii) behavioral
economics of social preferences. Here we propose an overarching framework for con-
necting these three frames when analyzing public support for climate policy propos-
als.
First, regarding inequality implications of carbon price designs, it is theoretically
well-established that a carbon tax is regressive because of subsistence consumption,
i.e. poorer households spend a larger share of their income on carbon-intensive goods
to fulfill their basic needs, such as heating. However, high-income households spend
more on carbon-intensive goods in absolute terms (Grainger and Kolstad, 2010; Flues
and Thomas, 2015). These properties of a carbon price imply that it can be made pro-
1 Interestingly, Germans are more in favor of this kind of policy than the French (Douenne and Fabre,
2020), more on a par with Americans (Kotchen et al., 2017).
6gressive by both lump-sum transfers or directed transfers to poor households (Klenert
and Mattauch, 2016; Klenert et al., 2018b). However, recent empirical work has ob-
served that beyond such vertical inequalities also horizontal inequalities matter: in the
same income percentile, some citizens are hit harder by higher carbon prices because
they have more expensive heating systems or commute longer distances (e.g. see
Farrell, 2017; Douenne, 2020). For example, Fischer and Pizer (2019) show that such
horizontal inequalities, especially when evaluated in combination with loss aversion,
are difficult to address through typical redistribution schemes and might dominate ag-
gregate social cost. Recently, Douenne and Fabre (2019) show that people’s perception
of these mechanisms is not accurate and, moreover, subject to motivated reasoning.
Second, there is no definitive or exhaustive list of fairness principles considered in
political philosophy (but see Deutsch, 1975; Folger et al., 1995; Sen, 2009; Miller, 2017;
Gosepath, 2011, for extensive discussions). Our survey elicits the established general
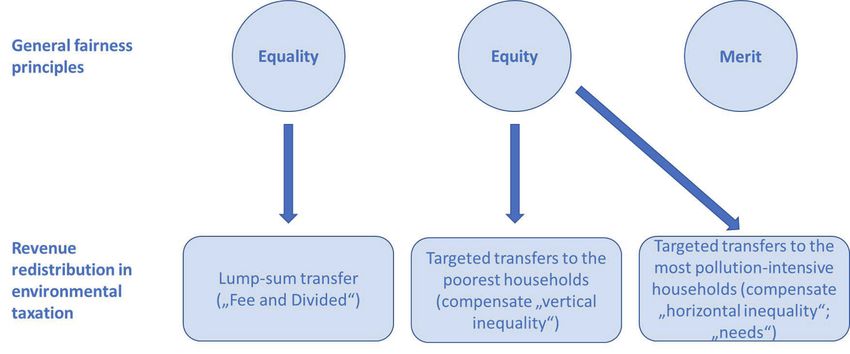
fairness principles of equality, equity, and merit as established for instance by Schmitt
et al. (1995). These denote allocations in which resources to be distributed should
be given to everyone, to the poorest or most vulnerable or to those who create most
value for society. However, the most commonly suggested revenue-recycling options
for environmental taxation do not fit established principles one-to-one. We associate a
lump-sum transfer (fee and dividend), i.e. the same payment to all citizens, with equal-
ity and attribute both targeted transfers to the poorest (vertical inequity) or to the most
pollution-intensive (horizontal inequity) households with the equity principle, relating
to the nuanced choices for environmental tax design highlighted above. Compensat-
ing the most-pollution-intensive households could also be associated with a “needs”
view on fairness.2 Figure 1 summarizes the correspondence between general fairness
principles and revenue redistribution options.
Third, social preferences, i.e. motives, such as altruism and reciprocity (Bowles and
2 In discussions on climate change mitigation policy, it is sometimes mentioned that an advantage of
a carbon tax over an emission trading scheme is that there is an individual incentive for climate-friendly
behavior when a tax is imposed, but that this does not exist for an emissions trading system. However, a
merit-based allocation of carbon price revenues would mean to give tax proceeds to those with the most
climate-friendly lifestyle. This has not been proposed in the context of climate policy to our knowledge,
perhaps because carbon pricing happens against a background of high income inequality.
7Figure 1: General fairness principles elicited by the survey and their correspondence to
revenue-recycling schemes
Polania-Reyes, 2012), have been extensively theorized by behavioral economics in the
past. For example, in their seminal contribution Fehr and Schmidt (1999) show that
a simple formulation of choice behavior as utility explains a wide variety of fairness
motives by positing that subjects are inequity-averse, but more so if they are personally
affected. To fix ideas, let there be n individuals and a vector of a consumption good
x = ( x1 , . . . xn ). Then utility of individual i is given by
Ui ( x ) = xi − 1/(n − 1) ∑ αi max | x j − xi , 0| − β i max | xi − x j , 0| , (1)
j =i
with β i ≤ αi and 0 ≤ β i < 1 (Fehr and Schmidt, 1999, p. 822).
However, as Fehr and Schmidt (1999) acknowledge themselves, this formulation
may be too limited to apply to a setting of support for real-world policy proposals,
such as discussed in this paper. To explain, an inequity-averse individual dislikes out-
comes that are perceived as inequitable: “This definition raises, of course, the difficult
question of how individuals measure or perceive the fairness of outcomes. [. . . ] In a
laboratory it is usually much simpler to define what is perceived as an equitable allo-
cation by the subjects. [. . . ] Thus, it is natural to assume that [. . . ] the reference point,
i.e. the equitable outcome, is given by the egalitarian outcome” (Fehr and Schmidt,
1999, p. 820ff., emphasis added).
8As we shall show below and in line with the second strand of theory just ex-
pounded, disagreements about fairness positions are real among our subjects. Fur-
thermore, as we are considering hypothetical choices primarily about policy options
that only indirectly lead to monetary payoffs, these disagreements are compounded
by the fact that policies imply different reference points for different subjects. When
eliciting fairness views and support for policy design options of individuals below, we
apply the following setting. Let P = ( p1 , . . . , pn ) be specific policy designs, including
the level of the carbon price and the redistribution option. We study how individual
support for policy choices increases or decreases. Given significant concern about the
state of the climate itself, we compare individuals’ utility of policy choices, where x
is the perceived change in income. The justification for merely considering the change,
rather than total income, is that in considering the effects of a policy reform, citizens
take the status quo as a reference point – in line with Prospect Theory (Kahneman
and Tversky, 1979).3 Climate protection in itself is important for some – but not all –
citizens and thus y is the perceived improvement to the state of the climate (measured
e. g. in emission reductions). Citizen i prefers policy pl over policy pm if
Ui ( x ( pl ), y( pl )) > Ui ( x ( pm ), y( pm )). (2)
Here
Ui ( x ( pl ), y( pl )) = xi ( pl )−
1
∑
( n − 1) j =i
αi max | x j ( pl ) − xi ( pl ), 0| − β i max | xi ( pl ) − x j ( pl ), 0| + f i (y( pl ), (3)
where U is in monetary terms and αi , β i , and f i translate factors unrelated to own mon-
etary payoff into monetary units (and these can differ for different individuals). The
difference to a standard public economics model of a government acting on house-
holds’ choices is as that we are subsequently interested in a positive understanding
3 Since the sums involved in our scenarios are small compared to total annual income and income tax
payments in Germany, we believe a setting akin to Fehr and Schmidt (1999) is appropriate to understand
relevant effects.
9of how Equation 3 represents a citizen’s view on policy. We note the following four
attributes of Equation 3, which we examine empirically below: (1) Individuals sup-
port policies both from an egoistic and an altruistic motive (Fehr and Schmidt, 1999),
(2) individuals’ perception of the effects of the policy may not be accurate (Douenne
and Fabre, 2019), (3) for some, but not all, individuals climate protection is impor-
tant, varying with f , which can be 0 (Diederich and Goeschl, 2014), and (4) similarly
citizens’ disagreements on fairness are genuine, varying with α and β.
This is so far an entirely positive approach to policy design. From a normative per-
spective, because the economic case for protecting the climate by some form of carbon
pricing is so strong, it should be the empirical question of which design increases the
chance for passage and preservation of carbon pricing that significantly determines
which carbon pricing design is introduced (see Goulder, 2020, for a related point).
This implies that understanding empirically which carbon pricing design receives the
greatest public support seems a high priority.
3 Experimental Design
Our analysis aims at identifying how fairness preferences influence the support for
different carbon pricing and revenue recycling schemes. To this end, we designed a
discrete-choice experiment that consists of several steps.4 We first asked the respon-
dents whether they generally support the idea of higher energy prices to contribute to
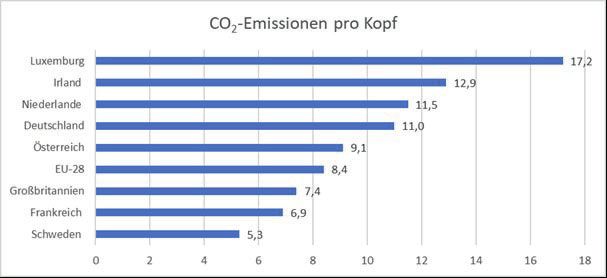
climate protection. Afterward, we informed the participants about the carbon emis-
sions per capita in several countries and the carbon intensity of different activities.
Subsequently, we asked them whether they are willing to accept the introduction of a
carbon tax where we randomly assigned a tax rate of EUR 10, 50, 100 per ton CO2 to
each participant.
Next, we informed the participants about three different revenue-recycling schemes
heavily discussed in Germany – a lump-sum payment to all citizens, a payment exclu-
4 See the appendix for a translation of the experiment.
10sively to poor households, and a payment exclusively to households with high energy
costs. These three schemes reflect two different fairness conceptions – equality and
equity, which can be designed to compensate vertical or horizontal inequity (Deutsch,
1975; Folger et al., 1995; see also Figure 1). After mentioning the concepts, we asked
the respondents to rank the three fairness conceptions according to their preferences.
As a next step, we randomly split the participants into a control and a treatment
group. In the control group, we merely informed the participants about the temporal
evolution of the level of carbon emissions in Germany. Respondents in the treatment
group received the same information, but in addition, they received an extensive ex-
planation of the fairness conceptions of the three revenue recycling schemes. After-
ward, we asked the respondents in both experimental conditions again to rank the
revenue recycling schemes according to their preferences and whether they would
accept the introduction of a carbon tax conditional on the implementation of their
preferred revenue recycling scheme. Last, we inquired about the respondents’ belief
about whether they would benefit from the application of the equity principle, i.e.
reducing vertical or horizontal inequity.
Our main hypothesis of the treatment is that communicating the different fairness
conceptions raises the support for a carbon tax because respondents have a deeper
understanding of these conceptions – or more generally by actively acting the fairness
frame (World Bank, 2018) – and pay more attention to fairness-related issues, poten-
tially counteracting pre-existing scepticism. Moreover, we hypothesize that the will-
ingness to support a carbon tax is lower among respondents who perceive that they
would be adversely affected by it, but that it increases when it is designed according
to the respondent’s preferences. In general, as motivated by the theoretical framing,
we will analyze the trade-off between fairness perceptions and selfish policy choices.
114 Data
Our experiment was incorporated in an online survey that was conducted in col-
laboration with the German survey institute forsa using its panel that is representative
for German population aged 14 and above (information on the panel is available at
http://www.forsa.com/ ). The survey addressed the household heads who are de-
fined as those individuals who are responsible for financial decisions at the household
level. A pre-test including around 125 participants served to prepare the survey and
indicated that it is well understood.
Subsequently, the survey was sent out to a total of 9,842 individuals between Oc-
tober 9 and November 6, 2019 and we retrieved 6,549 answers, resulting in a response
rate of 66.5%, which is comparable to other studies that use forsa’s household panel
(e.g. Andor et al., 2018a, 2020). The respondents could interrupt and continue the sur-
vey at any time, but 432 respondents (6.6%) discontinued the survey at some point.
Along with our experiment, we gathered data on a plethora of socio-economic
characteristics and attitudes (Table 1). For instance, the mean age of the respondents is
54.5 years and around 42% of the respondents are female. Moreover, about a quarter
of the respondents have a college degree. Almost two thirds of the participants have
children and around 57% live in their own property. About two thirds of the respon-
dents live in rural areas, which are characterized by a population density of less than
100 inhabitants per km2 . Overall, the socio-economic characteristics are in line with
the official statistics, with some exceptions as indicated by Table A1 in the appendix.
For instance, our sample contains less single and more two person households and is
somewhat more affluent.
Besides socio-economic characteristics, we also elicited characteristics related to
the introduction of a carbon tax (Panel (B) of Table 1). Objectively, households that
own a car and heat with oil will be particuclarly hit by a carbon tax. In our sample,
almost 90% of the households have at least one car and about a quarter heats with
oil. Moreover, we elicited the subjectively perceived consequences. About 40% of the
12Table 1: Summary statistics
Control Treatment Difference t-Statistic
(A) Socioeconomic characteristics
Age 54.624 54.422 0.202 0.427
Female 0.421 0.413 0.008 0.624
College degree 0.252 0.259 -0.007 -0.626
Household size 2.105 2.084 0.021 0.913
Household net income (e) 3,088 3,077 11.857 0.306
Has kids 0.629 0.608 0.021 1.704
Homeowner 0.574 0.568 0.006 0.486
East Germany 0.231 0.240 -0.009 -0.865
Rural 0.634 0.653 -0.019 -1.542
(B) Carbon tax related characteristics
Car owner 0.894 0.898 -0.004 -0.545
Gas heating 0.492 0.503 -0.011 -0.880
Oil heating 0.224 0.221 0.003 0.267
Other heating 0.285 0.276 0.008 0.732
Benefit from vertical equity 0.177 0.176 0.002 0.157
Benefit from horizontal equity 0.133 0.143 -0.010 -1.081
Incur high energy cost 0.394 0.403 -0.009 -0.726
(C) Attitudes
Climate change exists 0.794 0.782 0.012 1.157
Pro-environmental attitudes 0.726 0.725 0.001 0.303
Rather left 0.640 0.660 -0.021 -1.647
AfD voter 0.069 0.070 -0.001 -0.107
Equality principle 10.334 10.167 0.167 2.167*
Equity principle 10.639 10.486 0.153 1.920*
Merit principle 8.937 8.874 0.063 0.835
Trust in government 0.381 0.381 0.000 0.018
* and ** denote statistical significance at the 5% and 1% level, respectively.
respondents indicate that they currently incur high energy costs. Moreover, 18% and
13%, respectively, report that they would benefit from a recycling scheme that aims at
generating vertical and horizonal equity.
Regarding attitudes (Panel (C) of Table 1), 80% of our sample believe that climate
change is currently happening, which is in line with Andor et al. (2018b). On a discrete
scale running from one to ten, about two thirds of the respondents classify themselves
as rather left. About 7% are inclined toward to Germany’s populist party (AfD). We
also elicited the general fairness perceptions (see Figure 1) of respondents using three
different hypothetical situations based on Schmitt et al. (1995), Schmitt et al. (1997),
and Fischer et al. (2017): On a five-point Likert scale, respondents could indicate how
much they agreed with a fairness principle (equality, equity, merit) in three different
13domains, welfare, friendship, and work. The values in Table 1 represent the sum of
the respective Likert scale. Accordingly, we find that respondents exhibit the highest
score for the equity principle.
Pro-environmental attitudes are measured by a shorter variant of the Diekmann-
Preisendörfer (1998) scale, covering all its three spheres – affectitve, cognitive, and
conative – yielding a Cronbach’s (1951) Alpha of α=0.785, which is very similar to
the mean Alpha for measuring attitudes in the meta analysis conducted by (Peterson,
1994). Note that for the estimations, we normalize the scores reported in Table 1 for
both fairness conceptions and pro-environmental attitudes by substracting the mean
and dividing by the standard deviation of the respective variable.
As a result of randomization, the means of most covariates are virtually indis-
tinguishable across experimental conditions (Table 1): using t tests for differences
in means, we cannot reject the null hypothesis of no difference across groups at the
5% significance level for all socio-economic characteristics and attitudinal variables.
Solely regarding the general fairness conceptions, we find that respondents in the
treatment group exhibit slightly lower scores for supporting the equality and the eq-
uity principle.
Because of successful randomization, we start our analysis by taking the simple
difference in outcomes across treatment groups, as this captures the average treatment
effect (Angrist and Pischke, 2009). We obtain the difference in means between treat-
ment and control groups from linear regression models. To obtain further insights into
the determinants of carbon taxes and preferences for revenue recycling schemes, we
incorporate further covariates (from Table 1) into the regression model. When we ask
the respondents to rank revenue recycling schemes according to their preferences, we
estimate a standard multionomial logit model (MNL) and display the marginal effects
(Greene, 2003, p. 843ff.).
145 Results
In this section, we first analyze the support for carbon taxation in general (Sub-
section 5.1). Subsequently, we delve deeper into the support for different revenue
recycling schemes (Subsection 5.2). Lastly, we analyze how the support for a carbon
tax changes in response to different revenue recycling schemes (Subsection 5.3) and
additional information on fairness (Subsection 5.4). Table 2 summarizes our main re-
sults. Note that the options lump sum, social cushioning, and needs principle from
the central panel are conceptually congruent with fee and dividend, vertical equity,
horizontal equity from the lower panel of Table 2. For the sake of clarity, we distin-
guish them verbally where the latter constitute the options from the discrete choice
experiment.
In a nutshell, we detect that more than half of the respondents express a general
willingness to bear higher cost to prevent climate change, but this percentage shrinks
when we ask for the more specific policy of a carbon tax. Moreover, using revenues for
green spending (energy or transport infrastructure) is the most popular choice when
giving participants a broad range of options.5 However, when restricted to options for
direct revenue redistribution, our respondents prefer lump-sum payments (fee and
dividend) over directing payments to the poorest (vertical equity) or the most affected
(horizontal equity).6 Last, we detect that the introduction of a carbon tax would re-
ceive higher support if it was implemented conditional on the respondent’s prefer-
ences.
5.1 Carbon Taxation
Our results show that 57% of the respondents are principally willing to bear higher
cost for fuel and gas to help prevent climate change (Table 2). Yet, when we ask for a
more specific measure, namely a carbon tax, we detect that the support drops to 47%.
5 SeeQuestion 8 in the appendix for the exact wording of the redistribution schemes.
6 Inour analysis, we focus only on the first preference of the respondents. For the full distribution
of the preferences, see Table A2 in the appendix.
15Table 2: Support of a carbon tax and revenue recycling schemes
Variable All 10 EUR / 50 EUR / 100 EUR /
t CO2 t CO2 t CO2
Support of increasing energy cost
Higher cost 0.571 – – –
– – – –
Carbon tax 0.469 0.572 0.451 0.384
– – (7.565**) (11.943**)
Support for recycling schemes
Green energy 0.725 0.730 0.716 0.729
– – (0.996) (0.103)
Green transport 0.759 0.755 0.753 0.770
– – (0.136) (-1.089)
Fiscal revenue 0.107 0.114 0.095 0.113
– – (1.912) (0.044)
Lump sum 0.460 0.454 0.456 0.470
– – (-0.234) (-0.998)
Social cushioning 0.363 0.368 0.361 0.360
– – (0.514) (0.553)
Double dividend 0.237 0.240 0.232 0.238
– – (0.580) (0.119)
Needs principle 0.401 0.397 0.397 0.408
– – (-0.025) (-0.692)
Preferred direct redistribution schemes
Fee and dividend 0.520 0.507 0.523 0.529
– – (-1.020) (-1.418)
Vertical equity 0.379 0.397 0.387 0.365
– – (0.151) (1.451)
Horizontal equity 0.101 0.106 0.092 0.106
– – (1.459) (0.019)
Conditional carbon tax 0.619 0.673 0.617 0.564
– – (3.626**) (7.016**)
Results from a two-sided t-test for equal means compared to the EUR 10 group are reported in parentheses. ** denotes statistical
significance at the 1% level.
This finding of a lower support when asking about a specific measure is in line with
Cherry et al. (2017). As expected, the support decreases with the amount of the carbon
tax. Precisely, 57% of the respondents are willing to pay a carbon tax of EUR 10 / t
CO2 , while only 38% support a carbon tax of EUR 100 EUR / t CO2 . Hence, only a rel-
atively low carbon tax of EUR 10 / t CO2 yields a support by the majority. Compared
to Beiser-McGrath and Bernauer (2019), who have conducted the only study on the
16public support for a carbon tax in Germany so far, our numbers are slightly higher.7
To shed light on the support for a carbon tax, we investigate response heterogene-
ity by controlling for several socio-economic characteristics and attitudes (Table 3).
Column (1) of Table 3 demonstrates that the descriptive results from Table 2 hold once
we control for socio-economic characteristics. In addition, we find that respondents
with higher incomes, women, as well as college graduates exhibit a higher support
for a carbon tax, while residents of East Germany and in rural areas tend to be less
supportive.
In line with Baranzini and Carattini (2017), the opposition to a carbon tax is higher
if the personal financial burden is higher as indicated by the ownership of a car, heat-
ing by oil, and incuring high energy cost (Column (2) of Table 3). Further controlling
for attitudes (Column (3) of Table 3) indicates that respondents who trust the govern-
ment (see also Baranzini and Carattini, 2017), believe that climate change is happen-
ing, identify themselves as rather left, and have pro-environmental attiudes exhibit a
higher propensity to support a carbon tax.
To dig deeper into the mechanims underlying the support for a carbon tax, we
estimate a model specification that involves interaction terms between the amount
of the carbon tax and the individual financial burden. Figure 2 illustrates that the
negative effect of higher carbon taxes is particularly pronounced among car owners
and respondents who heat with oil.
5.2 General support for revenue recycling schemes
Using the revenues from a carbon tax for green spending receives the largest sup-
port (Table 2), as around three quarters of the respondents support the idea of financ-
ing the deployment for renewables or climate-friendly transport infrastrucutre. Less
than half of the respondents (45%) support a lump sum payment to all citizens. The
7 During our survey period, on October 23, 2019, the German government stipulated a new climate
package that entailed a carbon price of EUR 10 for the transport and buildung sector. Splitting the
sample according to this date indicates that the support of higher carbon prices is somewhat lower
after the stipulation of the climate package, but the differences are not statistically different (Table A4).
17Table 3: OLS results for the support of a carbon tax
(1) (2) (3)
Coeff. Std. Err. Coeff. Std. Err. Coeff. Std. Err.
50 Euro -0.110** (0.017) -0.117** (0.017) -0.113** (0.016)
100 Euro -0.185** (0.017) -0.187** (0.017) -0.188** (0.017)
Age 0.001 (0.001) 0.001 (0.001) 0.000 (0.001)
Female 0.031* (0.014) 0.032* (0.015) -0.019 (0.015)
College degree 0.159** (0.016) 0.116** (0.017) 0.059** (0.016)
Household size = 2 -0.064** (0.020) -0.026 (0.021) -0.026 (0.020)
Household size = 3 -0.072* (0.028) -0.038 (0.029) -0.034 (0.028)
Household size > 3 -0.080** (0.031) -0.035 (0.032) -0.052 (0.030)
ln(Net income) 0.109** (0.017) 0.071** (0.020) 0.078** (0.019)
Has kids -0.010 (0.017) 0.005 (0.018) -0.009 (0.017)
Homeowner 0.006 (0.016) 0.019 (0.017) 0.039* (0.016)
East Germany -0.129** (0.016) -0.112** (0.017) -0.063** (0.016)
Rural -0.086** (0.015) -0.047** (0.016) -0.032* (0.015)
Car owner – – -0.137** (0.027) -0.079** (0.027)
Gas heating – – -0.000 (0.017) -0.012 (0.016)
Oil heating – – -0.109** (0.021) -0.095** (0.020)
Benfit from vertical equity – – 0.062** (0.021) 0.032 (0.020)
Benefit from horizontal equity – – 0.022 (0.021) 0.039* (0.020)
Incur high energy cost – – -0.273** (0.016) -0.185** (0.015)
Climate change exisits – – – – 0.102** (0.018)
Pro-environmental attitudes – – – – 0.148** (0.007)
Rather left – – – – 0.069** (0.016)
AfD voter – – – – -0.067** (0.022)
Equality principle – – – – -0.010 (0.008)
Equity principle – – – – 0.034** (0.009)
Merit principle – – – – -0.018* (0.008)
Trust in government – – – – 0.125** (0.015)
Constant -0.239 (0.135) 0.230 (0.154) -0.021 (0.144)
No. of observations 4,873 4,191 3,851
Note: Robust standard errors are reported in parentheses. ** and * denote statistical significance at the 1 % and 5 %, level,
respectively.
redistribution based on the needs concept (to households that suffer particularly from
a carbon tax) and social cushioning (support low-income households) are supported
by about 36% and 40%, respectively. Finally, the respondents least support lowering
other taxes (23%) or raising fiscal revenues (10%). The low support of reducing other
taxes and increasing fiscal revenues is in line with, for intance, Kotchen et al. (2017),
Beiser-McGrath and Bernauer (2019), and Carattini et al. (2017).
Next, we analyze the support to different recycling schemes by including the same
covariates as in the previous analysis (Table 4). The results suggest, for instance, that
college graduates and respondents who trust the government are more likely to sup-
18Figure 2: Marginal effects of car ownership and heating system on the support of a carbon tax
.1
.1
0
0
Marginal effect
Marginal effect
-.1
-.1
-.2
-.2
10 Euro 50 Euro 100 Euro
-.3
10 Euro 50 Euro 100 Euro Gas Oil
(a) Car ownership (b) Heating system
Note: The dependent variable is a binary indicator that is unity if the respondents are willing
to support a carbon. Thus, the height of the bars indicates the additional support in percentage
points for a tax rate of 10, 50 or 100 Euro. The whiskers represent the 95% confidence interval.
port earmarking the revenues for investments in cleaner transport infrastructure as
well as adding them to the fiscal budget. Furthermore, respondents who tend to vote
rather left and have strong pro-environmental attitudes show a higher preference for
green spending.
Table 4: OLS results for the support of recycling schemes
Green Green Fiscal Lump Social Double Needs
energy transport revenue sum cushion dividend
Coeff. Std. Err. Coeff. Std. Err. Coeff. Std. Err. Coeff. Std. Err. Coeff. Std. Err. Coeff. Std. Err. Coeff. Std. Err.
50 Euro -0.017 (0.016) -0.013 (0.015) -0.023 (0.012) 0.005 (0.019) -0.005 (0.018) -0.008 (0.016) 0.005 (0.018)
100 Euro -0.005 (0.015) 0.010 (0.015) -0.011 (0.012) 0.022 (0.019) -0.015 (0.018) 0.011 (0.016) 0.014 (0.018)
Age -0.001** (0.001) 0.001 (0.001) 0.001* (0.000) 0.000 (0.001) 0.002** (0.001) -0.002** (0.001) 0.003** (0.001)
Female -0.014 (0.013) 0.006 (0.013) 0.001 (0.010) 0.026 (0.017) -0.060** (0.016) 0.041** (0.014) -0.029 (0.016)
College degree 0.018 (0.014) 0.040** (0.014) 0.034** (0.012) -0.035 (0.019) -0.049** (0.017) -0.032* (0.015) -0.049** (0.017)
Household size = 2 -0.030 (0.019) -0.001 (0.018) -0.009 (0.014) -0.024 (0.023) -0.006 (0.022) -0.009 (0.019) -0.014 (0.022)
Household size = 3 -0.020 (0.027) -0.028 (0.027) -0.023 (0.020) -0.070* (0.033) 0.019 (0.031) 0.018 (0.028) 0.003 (0.031)
Household size > 3 0.004 (0.028) -0.002 (0.028) 0.010 (0.023) -0.080* (0.035) -0.007 (0.033) 0.029 (0.030) 0.012 (0.033)
ln(Net income) 0.035 (0.018) 0.034 (0.018) 0.001 (0.014) 0.021 (0.023) -0.082** (0.021) 0.017 (0.018) -0.080** (0.021)
Has kids -0.001 (0.017) 0.011 (0.016) 0.006 (0.012) 0.040* (0.020) -0.020 (0.018) -0.027 (0.016) -0.000 (0.019)
Homeowner 0.007 (0.015) -0.004 (0.015) -0.049** (0.012) -0.009 (0.019) -0.020 (0.017) -0.006 (0.016) -0.007 (0.018)
East Germany -0.067** (0.017) 0.004 (0.015) 0.016 (0.013) 0.009 (0.020) -0.012 (0.018) 0.037* (0.016) -0.015 (0.019)
Rural -0.021 (0.014) 0.019 (0.014) -0.000 (0.011) -0.005 (0.018) -0.025 (0.016) 0.021 (0.014) -0.018 (0.017)
Car owner -0.030 (0.023) -0.070** (0.021) 0.026 (0.018) -0.037 (0.030) -0.016 (0.028) 0.009 (0.024) 0.023 (0.028)
Gas heating 0.022 (0.015) 0.032* (0.014) 0.007 (0.012) -0.000 (0.019) -0.028 (0.017) 0.002 (0.015) 0.001 (0.018)
Oil heating 0.020 (0.019) -0.014 (0.019) 0.007 (0.014) -0.007 (0.023) -0.023 (0.021) 0.003 (0.019) 0.033 (0.022)
Benfit from vertical equity -0.012 (0.020) 0.004 (0.018) 0.006 (0.014) 0.088** (0.023) 0.089** (0.022) 0.017 (0.020) 0.050* (0.022)
Benefit from horizontal equity 0.011 (0.018) -0.045* (0.019) 0.030* (0.015) -0.032 (0.022) 0.027 (0.020) 0.022 (0.020) 0.104** (0.022)
Incur high energy cost -0.064** (0.015) -0.057** (0.014) -0.014 (0.011) 0.017 (0.018) 0.018 (0.016) 0.033* (0.015) 0.064** (0.017)
Climate change exisits 0.080** (0.019) 0.058** (0.018) -0.014 (0.013) -0.006 (0.021) 0.016 (0.019) -0.089** (0.019) -0.021 (0.020)
Pro-environmental attitudes 0.100** (0.008) 0.107** (0.007) -0.009 (0.006) 0.006 (0.009) 0.039** (0.008) -0.050** (0.008) 0.003 (0.008)
Rather left 0.060** (0.015) 0.063** (0.015) 0.005 (0.011) -0.037* (0.018) 0.079** (0.017) -0.078** (0.016) 0.066** (0.017)
AfD voter -0.150** (0.032) -0.085** (0.032) 0.004 (0.022) -0.049 (0.033) 0.056 (0.030) 0.020 (0.032) 0.072* (0.032)
Equality principle 0.017* (0.008) 0.006 (0.008) 0.000 (0.006) 0.049** (0.010) -0.007 (0.009) 0.021** (0.008) 0.002 (0.009)
Equity principle 0.016 (0.009) 0.032** (0.008) -0.020** (0.007) 0.016 (0.011) 0.106** (0.010) -0.018* (0.009) 0.090** (0.010)
Merit principle 0.015* (0.008) -0.001 (0.007) 0.013* (0.006) -0.005 (0.010) -0.048** (0.009) 0.025** (0.008) -0.022* (0.009)
Trust in government 0.082** (0.013) 0.065** (0.013) 0.023* (0.011) 0.021 (0.017) -0.028 (0.016) -0.051** (0.013) -0.000 (0.016)
Constant 0.491** (0.143) 0.400** (0.140) 0.043 (0.107) 0.303 (0.178) 0.918** (0.163) 0.289* (0.144) 0.763** (0.167)
No. of observations 4,013 4,014 3,977 3,959 3,988 3,975 3,980
Note: Robust standard errors are reported in parentheses. ** and * denote statistical significance at the 1 % and 5 %, level,
respectively.
19Regarding the alternatives where revenues are redistributed to the citizens, we de-
tect that women show reluctance to social cushioning. College graduates are more
skeptical toward all options, while more affluent respondents tend to reject directing
the revenues from a carbon tax to households with low incomes (social cushioning)
or high energy costs (needs). In line with their general fairness principles, respon-
dents who tend to favor the equality principle have a higher propensity to support
the lump sum payment, while respondents who prefer the equity principle tend to
support social cushioning and the needs-based redistribution as hypothesized by Fig-
ure 1. Respondents who report to incur high energy cost tend to reject green spending,
but rather prefer redistribution based on the needs principle. Moreover, respondents
who report that they would benefit from reducing vertical inequity strongly support
social cushioning and respondents who report that they would benefit from horizontal
equity tend to support the needs-based principle. Thus, the main take-away from our
analysis so far is that people tend to support revenue recycling schemes that benefit
themselves individually and that overlap with their general fairness perceptions.
Next, we link our results so far by testing whether the support of a specific revenue
recycling scheme is correlated with the support of a carbon tax (Table 5). The results
suggest that respondents who support green spending (energy or transport) have a 20
percentage points higher probability of supporting the introduction of a carbon tax.
In contrast, respondents who support a reduction of other taxes (double dividend) are
less likely to support a carbon tax. Following Kallbekken et al. (2011) and Dresner
et al. (2006), it might be that respondents view taxes solely as a means to raise revenue
rather than an incentive to reduce emissions. This view could be particularly prevalent
among respondents with pro-environmental attitudes as they more likely support a
carbon tax if it is coupled with green spending (Figure A1 in the appendix).
In contrast to Carattini et al. (2017), we do not find that supporting a lump sum
payment is associated with a higher support for a carbon tax. Moreover, contrasting
Beiser-McGrath and Bernauer (2019), we detect that using the revenues from a carbon
tax to support citizens with high energy cost (needs principle) decreases the support
20Table 5: OLS results for the association of supporting a carbon tax and revenue recycling
schemes
(1) (2)
Coeff. Std. Err. Coeff. Std. Err.
50 Euro -0.117** (0.015) -0.116** (0.017)
100 Euro -0.193** (0.015) -0.187** (0.017)
Green spending 0.226** (0.016) 0.101** (0.018)
Traffic infrastructure 0.199** (0.016) 0.063** (0.019)
Fiscal revenue 0.017 (0.021) 0.001 (0.023)
Lump sum 0.019 (0.013) 0.022 (0.014)
Social cushioning 0.075** (0.015) 0.040* (0.016)
Double dividend -0.172** (0.015) -0.096** (0.017)
Needs principle -0.037** (0.014) -0.009 (0.016)
Age – – 0.000 (0.001)
Female – – -0.011 (0.015)
College degree – – 0.053** (0.016)
Household size = 2 – – -0.016 (0.020)
Household size = 3 – – -0.037 (0.028)
Household size > 3 – – -0.041 (0.030)
ln(Net income) – – 0.071** (0.019)
Has kids – – -0.009 (0.017)
Homeowner – – 0.040* (0.016)
East Germany – – -0.054** (0.016)
Rural – – -0.026 (0.016)
Car owner – – -0.070** (0.027)
Gas heating – – -0.022 (0.016)
Oil heating – – -0.100** (0.020)
Benfit from vertical equity – – 0.034 (0.021)
Benefit from horizontal equity – – 0.045* (0.020)
Incur high energy cost – – -0.169** (0.016)
Climate change exisits – – 0.088** (0.018)
Pro-environmental attitudes – – 0.123** (0.008)
Rather left – – 0.052** (0.016)
AfD voter – – -0.046* (0.022)
Equality principle – – -0.011 (0.009)
Equity principle – – 0.023* (0.010)
Merit principle – – -0.018* (0.008)
Trust in government – – 0.106** (0.015)
Constant 0.290** (0.018) -0.063 (0.147)
No. of observations 5,259 3,679
Note: Robust standard errors are reported in parentheses. ** and * denote statistical significance at the 1 % and 5 %, level,
respectively.
for a carbon tax. These results can be confirmed once we control for socio-economic
characteristics, albeit the point estimates shrink notably (Column (2) of Table 5).
Interestingly, we find heterogeneous effects depending on the amount of the carbon
tax by interacting it with the revenue recycling schemes (Figure 3). With increasing tax
levels, the positive effect of green spending on the support of a carbon tax diminishes
21particularly strongly. We observe the same pattern (but less clear) among respondents
who support the needs-based principle. In contrast, the negative effect of higher car-
bon taxes shrinks for respondents who are in favor of lump-sum payments or social
cushioning. This result could become more important with increasingly ambitious cli-
mate policy: in the future both the distributional impacts of carbon pricing as well
as the amonunt of revenues will increase. It is likely that the question of carbon tax
design will thus become conflated with questions of broader societal redistribution,
highlighting the importance of perceived fairness. Therefore, in the following, we re-
strict ourselves to options that directly channel the revenues generated from a carbon
tax back to the citizens.
Figure 3: Marginal effects of redistribution schemes conditional on amount of carbon tax
.1
.2
.15
.05
Marginal effect
Marginal effect
.1
0
.05
0
-.05
10 Euro 50 Euro 100 Euro 10 Euro 50 Euro 100 Euro
(a) Green energy (b) Lump sum
.15
.1
.05
.1
Marginal effect
Marginal effect
.05
0
0
-.05
-.05
-.1
10 Euro 50 Euro 100 Euro 10 Euro 50 Euro 100 Euro
(c) Social cushioning (d) Needs
Note: The dependent variable is a binary indicator that is unity if the respondents are willing
to support a carbon. Thus, the height of the bars indicates the additional support in percentage
points for a tax rate of 10, 50 or 100 Euro. The whiskers represent the 95% confidence interval.
225.3 Support for redistribution-based revenue recycling
One shortcoming of the previous analysis is that the respondents could indicate
a high support for all options of revenue recycling. To overcome this, we designed
an experiment outlined in Section 3 that starts out with the task to rank three redis-
tribution schemes (fee and dividend, vertical equity, and horizonal equity) according
to individual preferences, that is, from fair to unfair. We focus on direct redistribu-
tion schemes to households as identifyfing their determinants constitutes our main
research question.
Table 2 shows that the fee and dividend scheme, which coincides with the equal-
ity conception in Figure 1, is the most popular of these three measures as 52% of the
respondents rank it first. Furthermore, 38% of the respondents prioritize enhancing
vertical equity and the remainder reports enhancing horizontal equity as the preferred
option. Interestingly, the amount of the carbon tax does not seem to have a bearing
on the preference map. Hence, the support of a revenue recycling scheme seems to be
independent from the amount that is required to be paid. Morever, although respon-
dents slightly prefer the equity principle when asked how fair these are in general
(Table 1), for a carbon tax design, respondents tend to prefer the equality principle,
expressed as a fee and dividend scheme Table 2.
In this set up, we find that women, respondents from East Germany, and respon-
dents with high incomes are more likely to rank redistribution based on the equal-
ity concept (fee and dividend) first and are less inclined toward the equity concept
expressed by reducing vertical inequity (Table 6). Moreover, respondents with high
pro-environmental attitudes and who identify themselves as rather left on the politi-
cal spectrum tend to reject the fee and dividend scheme. These respondents in turn are
more likely to support social cushioning (vertical equity). We do not find many deter-
minants for ranking the goal of horizontal equity first, not even among respondents
who would benefit from it, namely car owners and respondents who heat with oil or
report to incur high energy cost. A potential explanation is that these respondents do
not link these activities with being entitled to it.
23You can also read