UC Davis Research Reports
←
→
Page content transcription
If your browser does not render page correctly, please read the page content below
UC Davis
Research Reports

Title
Adding Carbon to the Equation in Online Flight Search

Permalink
https://escholarship.org/uc/item/5n53672m

Authors
Amenta, Nina
Sanguinetti, Angela

Publication Date
2020-02-01

DOI
10.7922/G2KD1W4N

Data Availability
The data associated with this publication are within the manuscript.

 eScholarship.org                                  Powered by the California Digital Library
                                                                   University of California
Adding Carbon to the
           Equation in Online
           Flight Search
February   A Research Report from the National Center
  2020     for Sustainable Transportation

           Nina Amenta, University of California, Davis
           Angela Sanguinetti, University of California, Davis
TECHNICAL REPORT DOCUMENTATION PAGE
1. Report No.                                2. Government Accession No.                 3. Recipient’s Catalog No.
NCST-UCD-RR-20-06                            N/A                                         N/A
4. Title and Subtitle                                                                    5. Report Date
Adding Carbon to the Equation in Online Flight Search                                    February 2020
                                                                                         6. Performing Organization Code
                                                                                         N/A
7. Author(s)                                                                             8. Performing Organization Report No.
Nina Amenta, PhD, https://orcid.org/0000-0002-4441-2328                                  UCD-ITS-RR-20-09
Angela Sanguinetti, PhD, https://orcid.org/0000-0002-9008-7175
9. Performing Organization Name and Address                                              10. Work Unit No.
University of California, Davis                                                          N/A
Institute of Transportation Studies                                                      11. Contract or Grant No.
1605 Tilia Street, Suite 100                                                             USDOT Grant 69A3551747114
Davis, CA 95616
12. Sponsoring Agency Name and Address                                                   13. Type of Report and Period Covered
U.S. Department of Transportation                                                        Final Report (October 2017–September
Office of the Assistant Secretary for Research and Technology                            2019)
1200 New Jersey Avenue, SE, Washington, DC 20590                                         14. Sponsoring Agency Code
                                                                                         USDOT OST-R
15. Supplementary Notes
DOI: https://doi.org/10.7922/G2KD1W4N
Dataset DOI: https://doi.org/10.25338/B81S5M; https://doi.org/10.25338/B8FS5B
16. Abstract
This study explores the potential to promote lower-emissions air travel by providing consumers with information about the
carbon emissions of alternative flight choices in the context of online flight search and booking. Researchers surveyed over 450
UC Davis faculty, researchers, and staff, asking them to choose among hypothetical flight options for university-related business
trips. Emissions estimates for flight alternatives were prominently displayed alongside cost, layovers and airport, and the lowest-
emissions flight was labeled “Greenest Flight”. The researchers found an impressive rate of willingness to pay for lower-
emissions flights: around $200/ton of CO2E saved, a magnitude higher than that seen in carbon offsets programs. They also
found that displaying carbon information encouraged Davis employees to choose nonstop (lower-emissions) flights, when
available, from a more distant airport over indirect flights from their preferred airport for medium-distance flights. In a second
step of analysis, they estimated the carbon and cost impacts for UC Davis business travel if the university were to adopt a flight-
search interface that prioritizes carbon emissions information and displays alternatives from multiple regional airports in their
employee travel-booking portal. Based on the choice models from the survey data, a year’s worth of actual employee air travel
data, and data collected on flight alternatives with respect to the flights chosen by employees, they estimated potential annual
savings of more than 79 tons of CO2E, and a more impressive $56,000 reduction in airfare costs, due to an increased willingness
of travelers to take advantage of cheaper (often nonstop) flight options out of SFO. Broader university policies encouraging
lower-emissions flights and enhanced public transportation within the multi-airport mega-region would likely support much
greater carbon savings. Institutionalizing this “nudge” within organizations with large travel budgets, like the UC system, could
have an industry-wide impact in aviation.
17. Key Words                                                              18. Distribution Statement
Carbon emissions, air travel, flight search, online travel booking,        No restrictions.
eco-feedback
19. Security Classif. (of this report)                     20. Security Classif. (of this page)    21. No. of Pages    22. Price
Unclassified                                               Unclassified                            34                  N/A
Form DOT F 1700.7 (8-72)                                                                    Reproduction of completed page authorized
About the National Center for Sustainable Transportation
The National Center for Sustainable Transportation is a consortium of leading universities
committed to advancing an environmentally sustainable transportation system through cutting-
edge research, direct policy engagement, and education of our future leaders. Consortium
members include: University of California, Davis; University of California, Riverside; University
of Southern California; California State University, Long Beach; Georgia Institute of Technology;
and University of Vermont. More information can be found at: ncst.ucdavis.edu.

Disclaimer
The contents of this report reflect the views of the authors, who are responsible for the facts
and the accuracy of the information presented herein. This document is disseminated in the
interest of information exchange. The report is funded, partially or entirely, by a grant from the
U.S. Department of Transportation’s University Transportation Centers Program. However, the
U.S. Government assumes no liability for the contents or use thereof.

Acknowledgments
This study was funded, partially or entirely, by a grant from the National Center for Sustainable
Transportation (NCST), supported by the U.S. Department of Transportation (USDOT) through
the University Transportation Centers program. The authors would like to thank the NCST and
the USDOT for their support of university-based research in transportation, and especially for
the funding provided in support of this project. The authors would also like to thank the student
research assistants who contributed to the project: Andrew Allen, David Haddad, Jamie Oka,
and Jonathan Wessel.
Adding Carbon to the Equation in Online
            Flight Search
           A National Center for Sustainable Transportation Research Report

                                    February 2020

   Nina Amenta, Consumer Energy Interfaces Lab, Department of Computer Science,
                          University of California, Davis
Angela Sanguinetti, Consumer Energy Interfaces Lab, Institute of Transportation Studies,
                           University of California, Davis
[page intentionally left blank]
TABLE OF CONTENTS
EXECUTIVE SUMMARY ....................................................................................................................iii
Introduction .................................................................................................................................... 1
Background ..................................................................................................................................... 3
   Economic valuation of carbon offsets ........................................................................................ 5
   Valuation of other flight attributes ............................................................................................. 6
Present Research ............................................................................................................................ 8
Flight Choice Experiment ................................................................................................................ 9
   Methodology............................................................................................................................... 9
   Results ....................................................................................................................................... 14
Modeling Potential Carbon and Cost Impacts .............................................................................. 20
   Methodology............................................................................................................................. 20
   Results ....................................................................................................................................... 21
Discussion...................................................................................................................................... 23
   Limitations ................................................................................................................................ 25
   Conclusions and Research Opportunities ................................................................................. 26
References .................................................................................................................................... 28
Data Management ........................................................................................................................ 30
Appendix ....................................................................................................................................... 31

                                                                                                                                                    i
List of Figures
Figure 1. The query interface for flight search in GreenFLY. .......................................................... 2
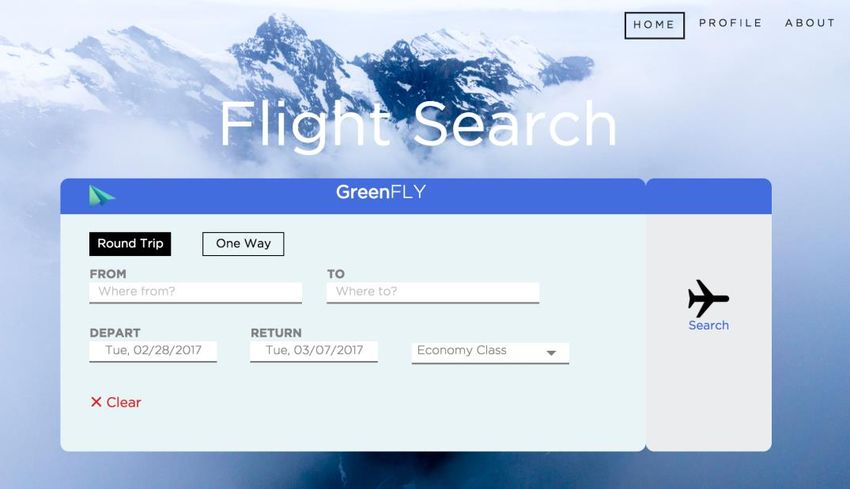
Figure 2. Flight results in GreenFLY. ............................................................................................... 2
Figure 3. Flight results in ConnexUC. .............................................................................................. 5
Figure 4. AFS History trip summary by distance, frequency and total carbon impact. ................ 10
Figure 5. Example of flight choice question response options, with prompt: “Which flight would
you choose?”........................................................................................................................... 13
Figure 6. Showing emissions savings during flight search (yellow) encourages travelers to fly out
of SFO instead of Sacramento, often to get a nonstop instead of a layover flight. ............... 22
Figure 7. The predicted change in behavior from Figure 6 corresponds to a modest emissions
savings of 3.8%, mostly on medium- and long-distance flights.............................................. 23
iiAdding Carbon to the Equation in Online Flight Search
EXECUTIVE SUMMARY
Different flight itineraries with the same origin and destination can vary greatly in terms of their
carbon emissions, depending mainly on the number and location of connections and aircraft
type (Jardine 2009). Taking advantage of the potential savings of lower-emissions flights is an
appealing approach to air travel emissions reductions (Lee et al. 2009, Carmichael 2019). This
study explores the potential to promote lower-emissions air travel by providing consumers with
information about the carbon emissions of alternative flight choices in the context of online
flight search and booking.
We surveyed over 450 faculty, researchers, and staff at the University of California, Davis, and
asked them to choose among hypothetical flight options for domestic and international
university-related business trips. Emissions estimates for different flight alternatives were
presented prominently alongside price, with the lowest-emissions option labeled “greenest
flight.” We based the survey’s hypothetical flight choice scenarios (destinations, costs and
carbon levels) on an analysis of one year’s worth of UC Davis employee travel data. The survey
data were analyzed using discrete choice modeling, yielding an estimate of participants’
willingness to pay for lower-emissions flights.
We found an impressive rate of willingness to pay to reduce the carbon impact of flying: around
$200/ton of CO2E saved. This rate is much higher than that seen in carbon offsets programs
(Brower 2008; Lu et al. 2012; van Birgelen et al. 2011). Note that we use willingness to pay as a
measure of the value of reducing emissions to our research subjects; it is not the potential cost
to the university for the emissions savings.
Davis employees fly out of both Sacramento and Bay Area airports, with about 90% of our
survey respondents preferring to fly out of Sacramento. Travelers at other UCs face similar
choices, e.g., San Jose vs SFO, Orange County vs LAX, etc., and in general departing from multi-
airport regions is quite common across the U.S. (Van Dender 2006). Our survey offered flights
out of both Sacramento and San Francisco in order to study the effect of emissions information
on travelers’ valuation of a nonstop (generally lower-emissions) flight out of a more distant
airport versus an indirect flight from a closer airport. When holding carbon emissions constant
across flight options, we found that these two alternatives were nearly equally desirable.
Emissions information can “break the tie” in this situation, encouraging travelers to choose the
nonstop flight.
In a second step of analysis, we estimated the effect that changing the flight-search interface
and showing alternative departure airports could have on the emissions and costs of business-
related air travel at UC Davis. We used our survey-based models of UC Davis employees’
willingness to pay for lower-emissions flights, and the actual employee travel data. We also
used another dataset that we collected, on the flight options available for the most frequent UC
Davis employee air travel destinations and emissions estimates for each of these options.
iiiBased on this analysis, we estimate potential annual savings for Davis of more than 79 tons of
CO2E (or 4% of emissions associated with all air travel booked on the university portal) if
employees could see emissions information prominently. While this estimate of the potential
for emissions savings might be disappointing, we found that it was combined with a $56,000
reduction in airfare costs, due to an increased willingness of travelers to take advantage of
cheaper (often also nonstop) flight options out of SFO when incentivized with reduced
emissions. The UC system has an overall goal of reducing transportation emissions, including
those of business travel, by 20% from 2010 levels by 2020 (Annual Report on Sustainable
Practices, 2018). In this context, an easily achieved 4% emissions savings for air travel is clearly
worthwhile. Broader University policies encouraging the use of lower-emissions flights, as well
as enhanced public transportation within the SFO–SMF multi-airport mega-region, would likely
support much greater carbon savings.
Institutionalizing this “nudge” within organizations with large travel budgets, like the UC
system, could have an industry-wide impact in aviation. Many consumers making lower-carbon
flight choices would encourage airlines to invest in more efficient aircraft and biofuels.
Highlighting emissions information during flight search also has an educational benefit and may
increase personal awareness of air travel emissions, which could reduce the total number of
trips. Increasing public awareness of the environmental costs of air travel could also ultimately
influence government regulation and public investment in transportation. These could include
better regional transportation options to alternative airports, the use of biofuels, and the
optimization of airline schedules and routes to further prioritize fuel efficiency.
ivIntroduction
Air travel is estimated to contribute as much as 2.5% of worldwide greenhouse gas emissions
(EPA 2016), and this proportion is expected to grow (Lee et al. 2009). Furthermore, for those of
us who fly, air travel makes up a significant proportion of our individual carbon footprint.
Annual greenhouse gas emissions in the U.S. are about 20 tons per person, and a single round-
trip coach flight from San Francisco to Miami is responsible for about one ton of emissions. This
makes reducing emissions due to air travel an important goal.
Although generally high relative to other travel modes, emissions for different flight itineraries
with the same origin and destination can vary greatly, depending mainly on the number and
location of connections and on aircraft type (Jardine 2009). For example, different itineraries
for the San Francisco–Miami trip can vary by 0.7 tons of carbon dioxide equivalent (CO2E;
aircraft emissions are measured in CO2E, which takes into account the environmental impact of
all emitted greenhouse gasses in terms of the equivalent weight of CO2 only). Taking advantage
of these potential savings is an appealing approach to air travel emissions reductions (Lee et al.
2009), and the focus of this project.
Specific and relevant information provided at the purchase decision point has been suggested
as the most effective strategy to help consumers to make environmentally beneficial choices
(Fogg 2009). Online flight searching presents an excellent opportunity to promote lower-
emissions flights at the point of purchase. Someone making an air travel purchase is already
carefully examining a website that presents detailed information on many possible itineraries,
and choosing a flight based on a variety of factors (cost, number and length of layovers, airline,
etc.). Displaying a CO2E emissions estimate for each flight would allow the consumer to
consider emissions among these other factors.
If online travel agencies (e.g., Expedia, Kayak, Google Flights) adopted this practice, they could
enable or even encourage consumers to choose lower-emissions flights. Corporations and
institutions could further leverage these tools by requiring or encouraging their employees to
use them for booking flights for business trips. Business travel is responsible for a large fraction
(25–65%) of airline emissions (Coogan 2000), and accounts for most frequent flyers. Influencing
business-related air travel could thus have large impacts on air travel emissions.
In an earlier project, we developed GreenFLY, a demonstration flight search website that
emphasizes emissions (Figure 1). GreenFLY’s design attempts to make emissions information
both salient and persuasive (Figure 2). By default, the output sorts flight options by emissions
(lowest to highest) and provides contextual information for the magnitude of the potential
emissions savings—specifically, a CO2E emissions range summary meter at the top of the flight
search output page, indicating the minimum, maximum, and average emissions of the available
flight options. The meter uses a gradient of yellow-orange-red to imply that higher emissions is
negative and undesirable. A green dot on the far left of the meter marks the flight option(s)
with the lowest emissions. Lowest emissions flight(s) are also labeled as “Your GreenFLY” in
green text, with the emissions number also in green text to imply that these are the most
positive and desirable flights.
1Figure 1. The query interface for flight search in GreenFLY. The background is meant to
suggest cleanliness and nature as well as flight, while the form resembles a ticket.
Figure 2. Flight results in GreenFLY. Emissions estimates appear on the left, and price on the
right; flights can be expanded to show details.
We then embarked on a research program to measure the degree to which a GreenFLY-style
interface (i.e., prominently displaying and comparing emissions information for flight
alternatives) could influence consumer flight choices. The present research is the second study
2in a series of online discrete choice experiments. In these experiments, participants choose
among hypothetical flight alternatives presented in GreenFLY-style. Our first study (Sanguinetti
et al. 2017) involved a convenience sample of over 1,400 U.S. citizens recruited via Amazon
Mechanical Turk. Based on their hypothetical flight choices among alternatives that varied in
terms of carbon emissions, cost, and number of layovers, participants demonstrated a
willingness to pay more for lower-emissions flights at a rate of $192/ton of CO2E saved.
The present research extended our prior work in several ways. First, we studied flight choice in
the context of business travel, which is responsible for a large fraction of airline emissions and
accounts for most frequent flyers. Influencing business-related air travel could thus have large
impacts on air travel emissions. If large institutions required or encouraged the use of
GreenFLY-style travel booking sites it could potentially substantially reduce the carbon footprint
of their business travelers.
Specifically, we surveyed University of California, Davis, employees and asked them to choose
among hypothetical flight alternatives for business travel. We calculated their willingness to pay
for lower-emissions flights, also taking into consideration airport choice and nonstop versus
indirect options. Based on the results and actual historical travel data for UC Davis employees
we modeled the potential aggregate emissions and cost implications for the university if they
adopted GreenFLY-style interface in their employee travel-booking site. Before presenting our
study, we provide background on the concept of providing emissions information in the context
of online flight searching, and summarize relevant literature on consumer flight choice and
carbon valuation.
Background
The idea of displaying greenhouse gas emissions estimates during flight search was pioneered,
as far as we know, by a company called Brighter Planet, whose main business was carbon
accounting for industrial and institutional clients. They developed an air travel emissions
calculator, and a plug-in, Careplane, that worked with the major web browsers. Careplane
could be downloaded and used in conjunction with Expedia, Orbitz, Kayak, and a few other
online travel sites, decorating them with emissions estimates during flight search.
Unfortunately, when Brighter Planet went out of business neither their calculator nor the plug-
ins were supported, so they no longer give correct results.
Calasi, a later start-up, has a business model in which they market an emissions calculator and
information on other flight details, such as in-flight entertainment options, to online travel
agencies. Unfortunately, we are not aware of any sites currently using their emissions data.
Calasi also developed a browser plug-in, but again maintenance is a problem. A site called
Glooby offered “sustainable travel” including links to low-emissions flights, but they also do not
appear to be maintained.
Flight search is a competitive, low-margin industry. Flight search engines, services which
provide the data on flight schedules, prices and availability, are expensive, so it is difficult to
build a profitable custom flight search website based on a commercial flight search engine.
3While Web plug-ins do not incur the cost of a flight search engine, they are difficult to build and
even more difficult to maintain, since both browsers and flight search websites change
frequently. In addition, decorating existing flight search pages can add clutter instead of
providing a sense of consistency, clarity and purpose, and plug-ins do not allow for more
complex functions (e.g., allowing the user to sort flights by carbon emissions).
While a stand-alone emissions-centric flight-search site like GreenFLY might not be
commercially viable, there are market niches where a similar approach might work well. In
particular, institutions committed to reducing emissions could highlight emissions in their in-
house flight search portals. As an example, the University of California (UC) system (our
employer) provides a travel-booking service through a portal called ConnexUC (formerly
Connexxus). The portal is provided and supported by two companies: SAP Concur and BCD
Travel. The University of California is also committed to becoming carbon neutral by 2025.
At UC Davis, the ConnexUC portal currently allows users to sort by emissions (Figure 3); this was
not the case when we began the GreenFLY project or this study. However, it is the last option
on a menu that may not be well-used, rather than the default output organization.
Furthermore, sorting by emissions does not add any other cues to help guide the user in
selecting the lowest emissions flights; for example, GreenFLY labels all of the lowest emissions
flights and provides a summary of the range of emissions for all flight alternatives at the top of
the output. In ConnexUC, emissions information for each flight alternative remains hidden in
the initial output and is revealed (sometimes) when the user clicks a link to see “More
fares/details” (for one flight alternative at a time). It is to the university’s credit that emissions
information is included at all, since most popular online travel-booking sites do not include it.
However, it is unlikely that this format is effective in nudging users to consider emissions.
4Figure 3. Flight results in ConnexUC.
Economic valuation of carbon offsets
There have been a number of studies attempting to quantify air travelers’ willingness to pay
(WTP) for carbon offsets for their flights (Brouwer, Brander, & Van Beukering 2008, Choi &
Ritchie 2014, Lu & Shon 2012, MacKerron, Egerton, Gaskell, Parpia, & Mourato 2009, van
Birgelen, Semeijn, & Behrens 2011). The purchase of carbon offsets is distinct from the goals of
GreenFLY and similar tools that integrate emissions information into online flight searching.
Carbon offsets provide the consumer with an opportunity to pay for activities that combat
climate change in order to offset the carbon they are responsible for producing with their air
travel. In contrast, the idea behind GreenFLY and similar tools is to provide the consumer with
an opportunity to avoid some emissions entirely. To our knowledge, our studies (the present
study and Sanguinetti et al. 2017, which found a WTP of $192 per ton of CO2E saved) are the
first to focus on consumer WTP for carbon in this context. However, previous studies on WTP
for carbon offsets are relevant as a point of comparison.
5Brouwer et al. (2008) recruited 400 air travelers (mostly European) at Amsterdam Schiphol
Airport in 2006 to participate in a contingent valuation (CV) study of WTP for carbon offsets.
After receiving an explanation of the concept of a carbon tax, participants were asked if, in
general, they were willing to pay such a tax on their plane ticket. Those who said yes (75%)
were then asked if they were willing to pay a specific amount of money for that tax. Using the
CV method, if the response was no, the interviewer asked about a second amount that was
lower; if the initial response was yes, the interviewer asked about a second amount that was
higher. This process continues until an interval is reached between an amount the consumer is
willing to pay and an amount they are not willing to pay. Mean WTP for a flight carbon tax was
23.1 Euros (equivalent to 25 Euros per ton of CO2E).
Similar CV studies were subsequently conducted by Jou and Chen (2015), Lu and Shon (2012),
and MacKerron et al. (2009). MacKerron et al. asked 321 UK adults aged 18–34 to imagine flying
from New York to London and having the opportunity to purchase a carbon offset for the flight.
Mean WTP was GBP £24. Lu and Shon interviewed 1,339 air travelers at Taoyuan International
Airport in Taiwan. They found that passengers flying to China, Northeast Asia, Southeast Asia,
and western countries were willing to pay $5, $8.80, $10.80, and $28.60, respectively, to offset
their flight carbon emissions (amounting to 1–1.5% of participant flight cost).
Overall, studies have shown that most air travelers say they are willing to pay some amount to
offset flight carbon emissions, and often at rates higher than standard carbon offset prices.
However, as Jou and Chen (2015) caution, stated valuation is an easier commitment than
actually making the donation. In Brouwer et al. (2008), when participants were asked how likely
they would be to pay their stated WTP amount if it were a voluntary tax, only 37% percent of
North American participants, 47% of European participants, and 50% of Asian participants said
they were likely to pay. In Choi and Ritchie (2014), most participants agreed that voluntary
offset payments must be “a convenient thing to do”, and they talked about the importance of
the position of the offset option during online booking as well as convenient payment
procedures. Providing salient information in a flight search tool about the range of carbon
emissions for flight alternatives could be the most convenient strategy, as users could simply
purchase a lower emissions flight without any additional donation and payment procedure.
Valuation of other flight attributes
There is also a literature on understanding consumer preferences for flight choices based on
the variety of attributes generally presented in the context of a purchase decision, e.g., on
travel-booking sites. These attributes include the airfare, airport and airline, and timing
considerations such as flight durations, departure and arrival times, and number and length of
layovers. Most of these studies are stated preference (SP) experiments using discrete choice
analysis, in which participants are presented with a set of flight alternatives that vary in terms
of the different attributes and are asked to choose which they would hypothetically purchase.
The analyses typically focus on establishing the value of the different attributes in terms of cost,
called the willingness to pay (WTP) metric (e.g., WTP higher purchase price to avoid a layover,
take preferred airline, etc.). Choice experiments enable the researcher to examine whether and
to what degree specific attributes, or attribute combinations, influence the value of an
6economic good, i.e., the consumers’ willingness to pay for those attributes (Louviere et al.
2000). Discrete choice is a common method in marketing research as it resembles real purchase
situations. Revealed preference (RP) studies, in which actual flight purchases are analyzed in
order to infer the preferences of consumers, have also been conducted—sometimes in
conjunction with SP work.
Although some SP flight choice studies consider the potential influence of attributes that are
less commonly provided in reservation and ticketing services (such as on-time performance;
Adler, Falzarano & Spitz 2005), none that we could find, besides our own earlier study
(Sanguinetti et al. 2017) considered the value of carbon emissions. Although carbon emissions
information has not been considered as a factor in these studies, a brief review of this research
provides some context for the possible value of carbon emissions information as another choice
attribute in the flight purchase decision.
Overall, past SP studies tell us that airfare is typically the most important determinant of flight
choice (e.g., Hess, Adler, & Polak 2007), and confirm all the above-named factors as influential.
However, no one attribute outweighs all others (Ishii, Jun, & Ven Dender 2009); thus, there
tend to be trade-offs consumers are willing to make between attributes. Particularly relevant to
the present research are trade-offs between cost and layovers, since number of layovers for an
itinerary is highly positively correlated with emissions. A recent report from the MIT
International Center for Air Transportation (Ennen, Florian Allroggen, & Malina, 2019) found
that in general consumers are willing to pay $140 more to avoid a layover, and $168 more for
the most convenient nonstop flight compared to the most convenient flight with a layover.
Our prior research showed a much lower rate of willingness to pay (WTP) to avoid a layover:
$51 without carbon emissions in the model and $83 with carbon included. This finding was
taken to suggest that consumers will pay more to avoid a layover when information that the
nonstop flight is also less carbon intensive is presented. The discrepancy between our earlier
finding on WTP and that of Ennen et al. (2019) might be partly attributable to the lower income
of our convenience sample of participants from Amazon Mechanical Turk. The present study
replicates the WTP evaluation for UC Davis employees, and we indeed found a higher WTP,
comparable to Ennen et al.
Prior research also highlights the importance of airport as a factor in flight choice, with
consumers showing a strong preference for airports with faster access time (generally those
closest to them). Understanding this factor is particularly relevant for multi-airport regions, in
which consumers may choose between multiple reasonably accessible airports. Van Dender
(2007) reported that 40% of U.S. flight passengers depart from multi-airport regions, and that
number is likely higher now with disproportionate population growth in urban cores.
Furthermore, airport access time seems to be more important for business travel compared to
leisure (Hess & Polak 2005, Koster, Kroes, & Verhoef 2011).
The findings regarding airport preference are relevant to the present stated preference study,
which focuses on business travel and includes flight options from Sacramento International
Airport (SMF) and San Francisco International Airport (SFO). Davis is located in a multi-airport
7region, or perhaps more accurately a multi-airport mega-region (Hess, Ryley, Davison, & Adler,
2013): SMF is 22 miles away and SFO is 85 miles away; Oakland International Airport is 82 miles
away.
SFO offers nonstop flights to many destinations for which SMF only offers indirect flights. This
might nudge some employees toward choosing an SFO flight even though they prefer SMF (if
they value nonstop flights more than their preferred airport; e.g., Blackstone, Buck, and Hakim
2006). Furthermore, a nonstop flight from SFO will in many cases be less carbon intensive than
a flight with layovers from SMF, even after taking ground transportation into account. For
example, the 170-mile roundtrip drive between Davis and SFO in an efficient vehicle (30 mpg)
produces about 40kg CO2E, much less than the typical difference between a nonstop flight and
a flight with a layover. Granted, some travelers will take more efficient and some less efficient
modes to the airport. We hypothesized that prominently displaying emissions information may
nudge some employees toward choosing SFO flights even though they prefer SMF.
Present Research
Our primary research question was:
1. Are UC Davis employees willing to pay (i.e., allocate from university funding sources)
more to take a flight with lower emissions, and if so at what rate?
As in our earlier study, this issue is complicated by the fact that itineraries with fewer layovers
typically have significantly lower emissions, and many consumers will pay more for a flight with
fewer layovers, regardless of emissions. Therefore, a second question is:
2. What additional encouragement (i.e., value) do emission reductions contribute to
choosing a flight with fewer layovers?
We also wanted to consider access to airport since it is an important factor in flight choice,
particularly for business travel. SFO, though further from Davis, offers nonstop flights to many
destinations for which SMF only offers flights with layovers. Even accounting for emissions from
ground transportation to and from SFO, a nonstop flight from SFO will typically be more
efficient than an indirect flight from SMF. Thus, our third question was:
3. What additional encouragement (i.e., value) do emission reductions contribute to
choosing a roundtrip direct flight out of SFO over a flight with layovers out of SMF?
Finally, we wanted to extrapolate from the study findings to estimate the impact that adopting
a GreenFLY-like interface in the UC Davis travel portal might have on the University’s Scope 3
GHG emissions and at what financial cost:
4. How much CO2E might be spared campus-wide by prioritizing emissions information in
the campus travel portal and at what, if any, additional cost?
8Flight Choice Experiment
The first three research questions were addressed through a stated preference choice
experiment, similar to those reviewed in the Background section of this paper, and similar to
our earlier study (Sanguinetti et al., 2017).
Methodology
The flight choice experiment involved an online survey in which UC Davis employees were
asked to make a series of discrete choices between roundtrip flight alternatives, that varied in
terms of cost, carbon emissions, layovers (0 or 2: one layover each way), and airport (SMF or
SFO), for hypothetical UC Davis-related business trips. We based these hypothetical scenarios
(trip destinations and attribute levels of flight alternatives) on data about actual UC Davis
employee air travel. This was intended to increase the social and statistical validity of the
resultant choice models by making the scenarios seem realistic to participants, and by building
the models in the range in which they would be applied (rather than extrapolating to untested
contexts). The following sections describe the use of actual travel data, the experimental design
and survey instrument, and survey recruitment and participants.
Using historical employee travel data to create realistic trip scenarios
UC Davis Accounting and Financial Services (AFS) shared data with us for one complete year
(2017) of UC Davis business travel booked through the university travel portal (hereafter called
the AFS History dataset). According to AFS, roughly 50% of reimbursed air travel is booked
though the university portal, and thus represented in the AFS History dataset. The AFS History
dataset includes 7,593 trips, both roundtrip and one-way, to over 300 different destinations.
For each flight leg, data include origin and destination city and airport, airline and ticket class;
and at the trip level: cost, distance, and emissions estimates (computed in ConnexUC).
Our first task with these data was to identify common business trip destinations that represent
a significant portion of total air travel emissions for UC Davis employee travel, to inform the
hypothetical trip destinations in the choice experiment. We focused on roundtrip and one-way
flights originating from SMF and SFO (65%), omitting one-way flights into SMF or SFO, flights
from Oakland, and flights between two other cities. We divided the resulting flights into short
(up to 1,400 miles roundtrip), medium (1,400 to 6,000 miles), and long trips (more than 6,000
miles). Figure 4 shows the contributions of each group to total emissions. While there are many
short trips, their impact on emissions is small. Medium-length trips account for most of the
emissions, and long trips have a disproportionately large impact given their low frequency. For
this reason, we decided to include two hypothetical trip scenarios in our choice experiment:
one medium-length (domestic) and one long (international) trip.
Ordered by total emissions for all trips to each destination city (regardless of specific airport),
Washington, DC and London were the most frequent domestic and international destinations. It
was also important that each of these destinations were reasonably accessible by each SMF and
SFO since we planned to vary the choices on those two airports. The top 23 destinations
departing from Sacramento (SMF) were all domestic, followed by London, while the top seven
9destinations departing from SFO were all international, followed by Washington, DC Thus,
although SMF is more popular among UCD employees for domestic flights, flights to London are
not uncommon. Similarly, although international flights are most common out of SFO, flights to
DC are not uncommon. Based on this, the two hypothetical trips in the choice experiment were
to Washington DC and London.
Figure 4. AFS History trip summary by distance, frequency and total carbon impact. Medium
distance is between 700–3000 miles from Sacramento to the destination city, so it includes all
destinations on the North American continent.
We also used the AFS history data to determine realistic cost and carbon levels for flight
alternatives in the choice experiment. This was done by analyzing the distributions of cost and
emissions for employees’ roundtrip flights to each Washington, DC and London in 2017. For
cost, we calculated the mean and standard deviation for each city (Table 1). There were a few
very expensive flights to each destination, which we removed as outliers (over $100 more than
the next most expensive flight). For carbon, we calculated the mean and standard deviation
separately for nonstop flights and flights with layovers. Emissions for nonstop flights did not
vary much at all.
Table 1. Distributions of cost and carbon emissions for DC and London flights in AFS history.
Destination Cost Emissions, layover Emissions, nonstop
mean (sd) mean (sd) mean
Washington, DC $502 ($109) 2127lbs (204lbs) 1645
London $1135 ($375) 4084lbs (165lbs) 3638
10For layover flights to both destinations, we selected four price levels and four carbon levels. We
distributed the prices from –1 standard deviation below the mean to .5 standard deviation
above the mean, each separated by half a standard deviation. We distributed the four carbon
emissions levels around (but not including) the mean, also separated by half a standard
deviation. We wanted nonstop flights to be more expensive in our hypothetical choices, to give
respondents the opportunity to demonstrate WTP for nonstop. We assigned four price levels by
increasing each of the four layover price levels by .25 standard deviations, and used the single
mean emissions value since there was little variation.
Experimental design and survey instrument
With four price levels, four carbon levels, two airport levels (SMF or SFO) and two layover levels
(0 or 2: one layover each way), there were too many possible combinations to include and
compare all possible flights in the choice experiment. Instead of randomly sampling from all
possible attribute combinations, we chose a set of flight alternatives, and then a set of pairs of
flight alternatives for the choice questions, which would sample the part of the hypothesis
space in which we expected our model to fall. The literature reviewed above, our own previous
survey work, and common sense tells us that respondents will prefer nonstop to layover flights,
cheaper to more expensive flights, and flights with lower emissions, and that most of our
respondents would prefer to leave out of SMF rather than SFO. We designed specific flight
alternatives, and questions pairing flight alternatives, to explore the trade-offs between these
different benefits, and to avoid questions for which the response was “obvious”.
For the layover flight alternatives, we created eight possible cost-carbon combinations, using
each cost level and each carbon level twice, and not repeating any pairing. There are many
ways to do this, and we chose one which tended to pair high cost with low carbon, to create
trade-offs. Our eight layover flights from SMF to London appear in Table 2. The same cost-
carbon pairings were used for layover flight alternatives from SFO.
Table 2. Hypothetical layover flights from SMF to London used in questionnaire.
F1 F2 F3 F4 F5 F6 F7 F8
Carbon 4331 4331 4167 4167 4002 4002 3837 3837
Cost $761 $948 $948 $1322 $761 $1135 $1322 $1135
We also created four nonstop flights from each departure airport, with the four nonstop prices
and the single nonstop emissions level. This gave us 12 possible flights from SMF and 12 from
SFO, for a total of 24 possible flights to London. Using the same methods, we created 24
possible flights to Washington, DC.
We organized the flight alternatives into sets of two for the choice experiment questions. We
chose to do questions based on pairs rather than, say, triples, since more, cognitively easier
questions seemed more likely to produce good data than fewer, more difficult choices. Criteria
for pairing flight alternatives were as follows:
111. Every flight alternative should appear the same number of times in the survey,
2. The distribution in the questions of pairs of flights (eg. layover out of SFO vs layover out
of SMF) should match the distribution of all possible pairs,
3. Avoid questions in which the two flights had the same cost, or the same carbon, and
4. Focus on pairs that might have competitive utility (e.g., an alternative that is lower cost,
lower carbon, nonstop and out of SMF is likely to be selected in most cases, so not as
useful for understanding potential trade-offs).
With these criteria, we developed a solution of organizing questions into seven buckets for
each of the two destinations (14 buckets total), representing different kinds of questions (Table
3). Each respondent was asked a randomly chosen question from each bucket. Due to a survey
programming error, one DC flight bucket was omitted (at random) for each participant. Thus,
each participant received six questions with DC flight choices and seven questions with London
flight choices. The full list of questions is included as an Appendix.
Table 3. Logic of flight choice question “buckets”.
No. of
Bucket Flight Alternative A Flight Alternative B (relative to A)
Items
1 SMF layover SMF layover (lower carbon, higher cost) 8
2 SFO layover SFO layover (lower carbon, higher cost) 8
3 SMF layover SFO layover (mixed carbon and cost) 8
4 SFO layover SMF layover (mixed carbon and cost) 8
5 SMF or SFO nonstop Opposite airport layover (higher carbon, mostly 8
lower cost)
6 SMF or SFO nonstop Same airport layover (higher carbon, lower cost) 8
7 SMF nonstop SFO nonstop (same carbon, mixed cost) 2
The choice experiment was conducted using an online survey instrument programmed in
Qualtrics survey software. Prior to the choice questions, the survey asked four questions to get
participants thinking about business-related air travel and their experience with both SMF and
SFO:
1. How do you typically arrange flights for UCD-related work travel?
2. What airport do you prefer to use for your business travel?
3. When flying out of Sacramento International Airport (SMF), how would you typically get
to the airport and back home? (select all that apply)
4. When flying out of San Francisco International Airport (SFO), how would you typically
get to the airport and back home? (select all that apply)
12Following these questions, a prompt to consider the DC trip scenario preceded the seven
questions for DC flight choices, and then a similar prompt followed by the seven London flight
choice questions. The DC prompt read: “Imagine you are searching for a flight to Washington,
DC for UCD business (perhaps a conference or training). The flight will be paid for from a
University account. You will be shown a series of flight alternatives, with different prices and
levels of carbon emissions. Some depart from Sacramento and some from San Francisco, and
some have layovers while others are nonstop. Each time, please pick the one you would choose
if you were actually taking this trip.”
The flight choice questions were programmed with image files as the response options, to
mimic the look of a flight-search interface, but with prominent information about emissions
(Figure 5).
Figure 5. Example of flight choice question response options, with prompt: “Which flight
would you choose?”
At the end of the survey, two questions asked participants if they would be interested in seeing
more prominent carbon emissions information about flight alternatives when they search for
flights, and how seeing that information might affect their choices. Some basic demographic
information (age, position on campus) and frequency of air travel, generally and work-related
air travel in particular, were also collected at the end of the survey.
Survey recruitment and participants
The survey was deployed from June–August 2019. We collected contact information for
administration (department chairs and coordinators) at each university department and
research center we could identify from university website searches. The final list of contacts
included at least one email address for 90 different departments. A mailmerge email was
generated to these contacts with a request to forward a survey participation invitation to
faculty, staff, post-docs, and graduate students in their respective departments. Participants
had the option to enter their email address at the end of the survey to be entered in a raffle to
win a $250 Amazon gift card.
13The survey had a 92% completion rate; 488 people initiated and 447 completed it. Of these,
40% were grad students, 33% were faculty, 17% were staff, and were 9% post-docs (a few were
undergraduate researchers). Participants ranged in age from 20 to 80, with a mean age of 38
(standard deviation = 13 years). Participants reported a range of recent air travel (in the past 12
months), from 0 to more than 10 of each work-related and other trips, with a mean of 2.3 work
trips (sd = 2.6) and 2.8(2.3) other trips (more than 10 trips counted as 11 for mean calculations).
About one-third (31%) reported that they typically use the university portal (AggieTravel) to
book their work-related air travel; Google Flights was also popular (21%); 12% reported they
book directly from airlines; 9% each Expedia and Kayak; 5% said their administrative staff
arranges. Others named Skyscraper, Orbitz, Travelocity, Hipmunk, and other sites, with some
noting that they use multiple tools—like searching on one site and buying on another. About
90% of participants reported that SMF was their preferred airport for business trips; 8%
preferred SFO and 2% preferred Oakland. Driving to the airport in one’s own private car was
the most common mode for both SMF (55%) and SFO (41%) access, however taxi/ride-hailing
was also common for SMF (53%), and using AMTRAK + BART (31%) and/or airport shuttle
services (23%) was relatively common for SFO (another 17% reported driving or being driven to
BART).
Results
Following the standard discrete choice model (e.g., Louvier et al., 2000), we used the survey
data to compute a utility model of traveler behavior. Our utility model is a linear formula of the
form:
utility = a * carbon + b * cost + c * nonstop + d * airport
Here, “utility” is a function that describes the desirability of a particular itinerary. We assume
that given a choice between itineraries, the traveler will choose the one of greatest utility.
“Carbon” is an estimate of CO2 equivalent emissions in pounds, and “nonstop” is equal to 1 for
a nonstop flight and 0 for a flight with a layover. The “airport” variable is equal to 1 if the flight
leaves from the traveler’s preferred airport, and 0 if it leaves from the other airport. Recall that
we asked participants which airport they preferred, and that 90% of respondents preferred
flying out of Sacramento; the 2% who preferred Oakland were treated as if they preferred San
Francisco.
We computed these models in R, using the mlogit package for logistic regression of discrete
choice data. This package is based on the assumption that the probability that a flight will be
chosen from some set of alternatives is proportional to exp[utility(A)]; that is, flights with
greater utility are exponentially more likely to be chosen. Given the empirical probabilities with
which one flight is chosen over another, the software “works backwards” to the best
coefficients for the utility function using a maximum likelihood optimization procedure.
We computed several different pairs of D.C. and London models from the survey data. Separate
models were created for the two trips because combining them in a single model would not
make sense (if the traveler is going to London, the utility of a Washington flight is zero, and visa
14versa). We computed a pair of models with emissions as a factor and another excluding the
emissions factor, in order to compare the difference. We also computed normalized versions of
the models with all factors, to give some idea of the relative importance of the different factors
to the respondents.
All models appear in Table 4. A row in the table represents a utility function supported by the
data. The coefficients (a, b, c, d) in the utility equation on the previous page are the columns
Carbon, Cost, Nonstop and Airport. WTP is the willingness-to-pay to save one ton of CO2E,
according to the model (calculated as 2000*Carbon/Cost). The mlogit software provides both a
log-likelihood score for each model, as well as a p-value on every coefficient; the coefficient p-
values on the other input variables were all vanishingly small.
Table 4. Models of utility computed from survey data
Carbon Cost Non- Airport WTP Log- p-val
stop Likelihood carbon
Washington -.0012 -.013 1.54 1.60 $184 -1086 3xe-9
London -.00064 -.0051 1.76 1.33 $250 -1218 7xe-3
Washington -.010 1.87 1.48 -1104
no emissions
London no -.0048 1.94 1.28 -1221
emissions
Washington -1.25 -4.56 1.54 1.60 -1086 3xe-9
normalized
London -0.65 -1.79 1.76 1.33 -1218 7xe-3
normalized
We see that traveler’s behavior is significantly different for the two destinations, with
respondents strongly preferring nonstop flights to London while taking cost and the departure
airport into account more strongly for the Washington trip.
In addition to WTP to avoid emissions, we can also use the models to get a sense of how willing
travelers were to avoid layovers, and how strongly they preferred one departure airport over
another. The model for Washington predicts as WTP of $115 to avoid a layover and $123 to fly
from the preferred airport, while the model for London predicts $352 to avoid a layover, and
$255 to fly out of the preferred airport. These larger numbers, as well as the larger WTP to
avoid emissions on the London trip, are probably just a function of the overall higher prices on
the London options.
The WTP to avoid CO2E emissions in this context is surprisingly large; typical carbon offset costs
are $20–$25 per ton. To check and make sure that it is not biased by the strong correlation
15between nonstop flights and low emissions (both in reality and in the scenarios we presented in
the survey), we computed models based only on the questions involving two layover flights.
From those models, we found a similar WTP of $187 for the flight to Washington and $325 for
the flight to London. This very large WTP to reduce emissions on the London flight shows that, if
anything, the lower emissions on the nonstop flights makes the London model over-value a
nonstop, rather than nonstops making it over-value the emissions savings.
We can also use these models to predict how much showing emissions information for
alternative flights during flight search could encourage travelers to use a less-convenient airport
to avoid a layover. We can see from the similarities of the coefficients on “nonstop” and
“airport” that there is a near-tie between a flight from the preferred airport with a layover as
opposed to a nonstop flight from the less desirable airport. This gives an opportunity for lower
cost and lower emissions to change traveler’s behavior. For a flight to Washington, the layover
flight from the preferred airport is more desirable, but a savings of only $8, or 87 lbs of carbon
emissions, tips the balance the other way. For the trip to London, the nonstop is already the
preferred option (we also found in the AFS History data that UCD employees often go to SFO to
get nonstop flights to London); according to the model, employees are willing to pay $97 more
for a nonstop from their non-preferred airport over a layover flight from their preferred airport.
According to the AFS history data, the real difference in emissions between a layover flight and
a nonstop is about 450 lbs, for which the model predicts a $56 difference in willingness to pay
(at $0.125/lb of carbon for London). That is, when shown the emissions estimates, a traveler
who likes to fly out of SMF will prefer a nonstop from SFO even if a layover flight from SMF is
$97+$56 = $153 cheaper. The main point here is that for either trip, the emissions savings of a
nonstop flight are sufficient to encourage travelers to use a less convenient airport (typically,
departing from SFO instead of SMF).
To get a rough sense of the relative importance of the factors in travelers’ decisions, we can
normalize the carbon and cost variables so that the mean is zero and one standard deviation
each way falls at –1 and 1. This kind of estimate involves the somewhat arbitrary rescaling,
especially relative to the 0–1 variables, and is less favored by statisticians than describing
tradeoffs using WTP. That said, the two “normalized” models in the table illustrate the
importance of nonstops to the London travelers, and the lower (but still significant) importance
that they attach to emissions.
To test the significance of carbon emissions in these models, and to be able to predict the
difference in consumer behavior when booking flights on a website interface that emphasizes
emissions compared to a standard one that does not, we also computed models that do not use
carbon emissions as a prediction variable. Since the models are computed using maximum
likelihood, we can measure how much including the carbon emissions variable improves the
model by comparing the likelihoods of the models with and without emissions as an input. For
Washington, the difference between the model without emissions (noELL - no-emissions log
likelihood) and the model considering emissions (ELL) is:
Log-likelihood ratio = 2(ELL - noELL)
16You can also read