Market and Trade Profile: Southeast Asia - Focus on Singapore, Malaysia, Indonesia, Thailand, and other Southeast Asian countries March 2020 ...
←
→
Page content transcription
If your browser does not render page correctly, please read the page content below
Market and Trade Profile Southeast Asia

 Market and Trade Profile:
 Southeast Asia

Focus on Singapore, Malaysia,
Indonesia, Thailand, and other
Southeast Asian countries

March 2020
Market and Trade Profile Southeast Asia
Overview
• This market profile provides topline statistics about visitors from Southeast Asia, and more
details about VisitBritain’s main markets in that area: Singapore, Malaysia, Thailand, Indonesia,
and also the Philippines and Vietnam for some sections.
• Chapter 1: Inbound market statistics provides insights on key statistics about Southeast Asian
travellers and who they are. It compares Britain with its competitive set as well as activities of
Southeast Asian visitors in the UK.
• Chapter 2: Experiences and perceptions features details about what visitors from Southeast
Asia are likely to do in the UK, how they felt during their visit and whether they would
recommend others to travel there. Perceptions of Britain held by Southeast Asians are also
highlighted.
• Chapter 3: Understanding the market profiles Southeast Asian consumer trends, booking
patterns, how they plan travel and additional travel behaviour.
• Chapter 4: Market access and travel trade highlights how Southeast Asians travel to the UK,
how suppliers can best cater to the market during their stay as well as offer insights on how to
work with Southeast Asian travel trade. Additional ways of working with VisitBritain in Southeast
Asia and useful research resources are also shared.
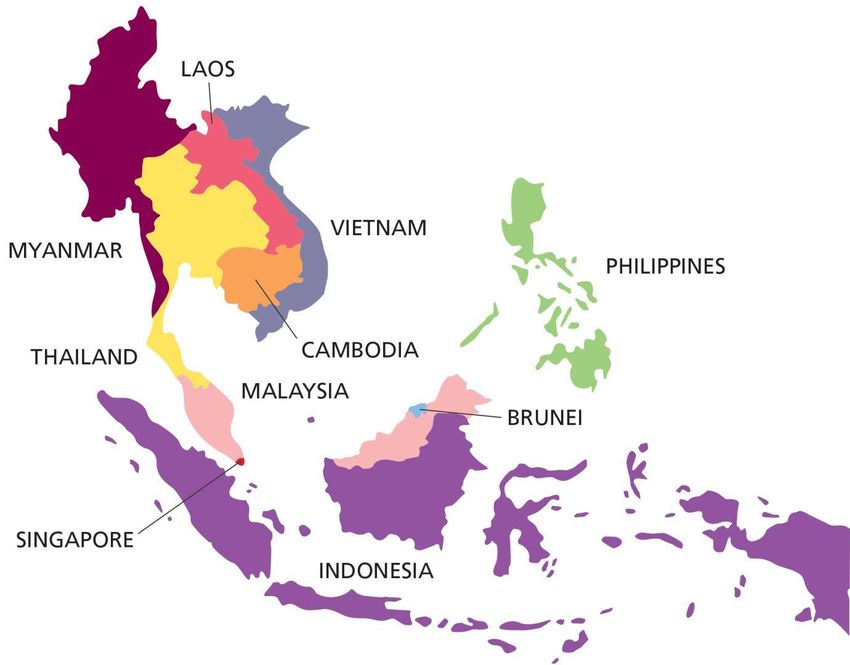
*Southeast Asia refers to Brunei, Cambodia, Indonesia, Laos, Malaysia, Myanmar (Burma), Philippines, Singapore, Thailand, Timor Leste (East Timor) and Vietnam. Data on inbound
visits to the UK from Southeast Asia aggregates these markets together unless otherwise stated.
2
Market and Trade Profile Southeast Asia

Contents (1)
Executive summary (page 6)

Chapter 1: Market statistics
 1.1 Key statistics (page 11)
 Tourism context, UK inbound overview, key figures on journey purpose, seasonality, duration of stay and
 accommodation trends, repeat visits, and visit types
 1.2 Getting around Britain (page 19)
 Where visitors stayed in the UK, places they visited, and internal modes of transport
 1.3 Visitor demographics (page 23)
 Demographic profile of Southeast Asian visitors (age, gender)
 1.4 The UK and its competitors (page 26)
 How visits to the UK compare to main competitor destinations, and long-term trend and forecasts

Chapter 2: Experiences and perceptions
 2.1 Inbound activities (page 31)
 What activities Southeast Asian visitors undertook in the UK
 2.2 Welcome and recommending Britain (page 37)
 How welcome departing visitors felt in Britain, and how likely they were to recommend a visit
 2.3 Perceptions of Britain (page 38)
 How people in this source market see Britain, and how it compares to other destinations

                                                                                                                         3
Market and Trade Profile Southeast Asia

Contents (2)
Chapter 3: Understanding the Market
3.1 Structural drivers (page 46)
Key demographic, social, economic indicators and exchange rates influencing the outbound travel market
3.2 Consumer trends (page 50)
General and travel-related trends in this source market
3.3 Booking and planning (page 55)
How Southeast Asian travellers plan and book their trips to the UK, and their holidays in general
3.4 Reaching the consumer (page 60)
An overview of the media landscape in this source market, and main sources of influences for people
planning a holiday

Chapter 4: Access and Travel Trade
4.1 Access (page 66)
How visits to the UK were made, and an overview of the air connections between this source market and
the UK
4.2 Travel trade (page 70)
What the travel trade in market looks like and useful tips to work with travel agents and other main players
4.3 Caring for the consumer (page 77)
Tips to understand Southeast Asian travellers and best cater to their needs

Appendix:
Working with VisitBritain (page 86)
Useful resources (page 88)
Definitions, sources and information on this report (page 90)

                                                                                                                        4
Market and Trade Profile Southeast Asia
Executive summary
5Market and Trade Profile Southeast Asia
1: Inbound market statistics
Chapter summary
Southeast Asia is a valuable source market for the UK’s tourism.
This region is diverse, though, and some of its differences can
show up in visits to the UK. For example, around a fifth of visits
from residents of Thailand and Singapore were made by British 2018:
nationals coming back to the UK, which influences the journey
purpose pattern.
Visitors from Southeast Asia stay longer than the all-market
£668m
average, and boast relatively good regional spread. The summer
months from July to September are still the most popular season,
spent in
and London remains the most visited city.
The United Kingdom is overall the most visited country in Europe
the UK
from Southeast Asia. However, despite good growth prospects for
visits, the UK’s share of total outbound visits is forecast to
decrease slightly among our key competitors, as India’s share is
forecasted to increase significantly in the period to 2028. Visits
from one Southeast Asian country to another accounted for more
than 6 in 10 outbound visits from this region in 2018.
Source: International Passenger Survey by ONS, Oxford Economics (outbound overnight trips)
6Market and Trade Profile China
2: Experiences and perceptions
Chapter summary
Going shopping is the most popular activity for Southeast
Asian inbound visitors, with 74% shopping during their trip. Top activities done by
Southeast Asian visitors are also more likely than the all Southeast Asians in the
UK
market average to attend the theatre, a musical, opera or
ballet, as well as visit literary, music, TV or film locations.
Going shopping,
dining in
Singaporeans seek holiday destinations that offer good value restaurants and
for money, and provide fun and laughter. In contrast,
visiting parks or
Indonesians are most motivated by the opportunity to feel
gardens
physically healthier and experience peace and quiet. Key
areas of strength for Britain as a destination for these two
markets are our historic sites and sporting events.
97% of visitors from Southeast Asia felt welcome during their
trip, and 98% would recommend Britain to others.
Singaporeans are most likely to feel satisfied with the UK’s
attractions when they visit, compared to other aspects of their
trip.
Source: Arkenford 2013, International Passenger Survey by ONS
Note: for activities, only Indonesia, Malaysia, Philippines, Singapore and Thailand considered
7Market and Trade Profile Southeast Asia
3: Understanding the market
Chapter summary
The Southeast Asian travel market is indeed quite dynamic: this region has Consumers in
seen many transformations in the last few years, and its young population is Southeast Asia have
very curious; ready to embrace new travel trends. between
Previously strongly growing economies in Southeast Asia have been 12-26 days
negatively hit by the US-China trade war in 2019. However, some countries in off per year including
the region have been beneficiaries, with Vietnam and Cambodia enjoying public holidays
increased exports to the US as investment moves away from China.
Key consumer trends in the region include studying in an English-speaking
country, physical activity whilst on holiday, trying new, local food, and also new
activities such as going on a cruise, travelling alone and going shopping. The
latter is interesting as more and more women travel abroad from Southeast
Asian countries to treat themselves, which adds to the existing luxury traveller
segments but also constitutes a new trend in comparison to the family
segment, who will prefer destinations that fit the family’s values.
Recommendations and value for money are very important in the planning and
decision process. Booking of accommodation and flights are often separate,
with half of the flight bookings made only within two months of departures.
Source: Trip Advisor‘s Trip Barometer, Oxford Economics, Statista.com, The ‘Journey of Me’ 2017 study by Amadeus, Public Holidays, ForwardKeys 2019
8Market and Trade Profile Southeast Asia
4: Access and travel trade
Chapter summary
Most visits from Southeast Asia to the UK were made by plane in
2018 (89%, compared to 77% across all markets). In the same year,
propensity to take the tunnel between the UK and Europe was similar
to the all-market average (10% vs. 11% respectively).
95%
of the direct seat
Direct seat capacity from Southeast Asia to the UK has increased by capacity in 2018
31% from 2014 to 2019, with the largest growth being seen from between South East
emerging source markets Indonesia, the Philippines and Vietnam. In Asia and the UK is
2018, there were 13 airports with direct routes to the UK in Southeast concentrated in
London Heathrow
Asia.
Connecting routes are important for this region, suggesting that
overall growth in connectivity may be significantly larger. In the last
five years, the Gulf carriers have gained more importance and
connecting routes through hubs in the UAE or Qatar have soared,
providing more regional options for arrival in the UK.
The Southeast Asian travel trade landscape is still very fragmented,
even within the main countries. The growing FIT segment and online
players are progressively changing the trade landscape.
Source: Apex Rdc 2020, International Passenger Survey by ONS
9Market and Trade Profile Southeast Asia
Chapter 1:
Inbound market
statistics
10Market and Trade Profile Southeast Asia
1.1: Key statistics
Inbound visits, spend and nights from Southeast Asia to the UK
showed strong growth from 2008 to 2017, but all metrics
dropped in 2018. However, the number of visits to the UK in the
first three quarters of 2019 from this region improved on those
in the same period in 2018, suggesting that this trend may
rebound.
10th
Considered all together as one source market, Southeast Asian most valuable
countries would be in the top 10 most valuable inbound markets inbound market for
to the UK in 2018. These are valuable visitor markets, with the UK (2018)*
spend per visit almost twice the all-market average in 2018.
Most Southeast Asians who visit the UK come for holidays
(over 4-in-10 visits in 2016-2018), or for visiting friends and
relatives (over 3-in-10 in the same period). Business visitors
tend to spend more per night than visitors with any other
journey purpose.
Visits to the UK from Southeast Asia tend to be well spread
between April and December primarily. They are also more
likely to explore around the UK than the all-market average,
spending more time than the all-market average in Northern
England and the East of England, although London is still the
most visited city in the UK.
Source: International Passenger Survey by ONS, Oxford Economics (outbound overnight trips)
*If considered as a single market (as standard, inbound rankings do not consider Southeast Asia as a single market)
11Market and Trade Profile Southeast Asia
1.1 Key statistics: global context
Global context (2018)
Measure Southeast Singapore Malaysia Thailand Indonesia Philippines Vietnam
Asia
International tourism
n/a 25.3 12.2 12.4 8.0 10.3 5.7
expenditure (US$bn)
Global rank for
international tourism n/a 13 27 26 34 28 45
expenditure
Number of outbound
82.6 22.8 13.2 11.2 10.4 7.9 6.7
overnight visits (m)
Most visited
outbound destination Malaysia Malaysia Thailand Malaysia Singapore China China
overall
Most visited
United United United
destination in Switzerland Netherlands Spain France
Kingdom Kingdom Kingdom
Europe
Source: UNWTO, Oxford Economics
Southeast Asia refers to Brunei, Cambodia, Indonesia, Laos, Malaysia, Myanmar (Burma), Philippines, Singapore, Thailand, Timor Leste (East Timor) and Vietnam
12Market and Trade Profile Southeast Asia
1.1 Key statistics: 10 year trend
Inbound travel to the UK overview
Measure Visits Nights Spend
(000s) (000s) (£m)
10 year trend +84% +58% +153%
2008 303 4,271 264
2009 355 5,936 438
2010 386 6,029 457
2011 407 6,304 486
2012 416 6,283 523
2013 473 6,269 683
2014 526 6,753 643
2015 564 7,402 786
2016 570 7,752 768
2017 636 8,736 782
2018 559 6,764 668
Share of UK total in 2018 1.5% 2.5% 2.9%
Source: International Passenger Survey by ONS
Data includes Brunei, Cambodia, Indonesia, Laos, Malaysia, Myanmar (Burma), Philippines, Singapore, Thailand, Timor Leste (East Timor) and Vietnam
13Market and Trade Profile Southeast Asia
1.1 Key statistics: latest figures
Inbound travel to the UK overview
Measure Southeast Singapore Malaysia Thailand Indonesia Philippines Vietnam***
Asia* **
Visits (000s, 2018)
559 178 165 93 45 45 19
• Rank out of UK top
• 17th* • 35th • 38th • 49th • 57th • 58th • >67
markets
Nights (000s, 2018)
6,764 1,668 1,729 1,689 458 784 281
• Rank out of UK top
• 13th* • 39th • 37th • 38th • 56th • 50th • >70
markets
Spend (£m, 2018)
668 219 168 147 54 46 14
• Rank out of UK top
• 10th* • 28th • 30th • 34th • 52nd • 54th • >70
markets
Nights per visit (2018)
• 12 • 9 • 10 • 18 • 10 • 18 • 15
• Overall
• 9 • 8 • 8 • 9 • 8 • 13 • 14
• Holiday
Spend per night (2018)
• £99 • £131 • £97 • £87 • £117 • £58 • £51
• Overall
• £139 • £171 • £130 • £135 • £153 • £99 • £72
• Holiday
Spend per visit (2018)
• £1,195 • £1,233 • £1,018 • £1,584 • £1,195 • £1,026 • £745
• Overall
• £1,186 • £1,433 • £1,486 • £1,167 • £1,263 • £1,314 • £992
• Holiday
Source: International Passenger Survey by ONS
Southeast Asia refers to Brunei, Cambodia, Indonesia, Laos, Malaysia, Myanmar (Burma), Philippines, Singapore, Thailand, Timor Leste (East Timor) and Vietnam
*If considered as a single market (as standard, inbound rankings do not consider Southeast Asia as a single market)
**Treat with caution as sample is below 100 ***Treat with caution as sample is below 30
14Market and Trade Profile Southeast Asia
1.1 Key statistics: journey purpose
Journey purpose (2016-2018) Journey purpose trend (visits 000s)*
Share of Holiday Business VFR Study Misc. 300
visits for… 250 258
Singapore 41% 22% 31% 1% 5% 200
Malaysia 50% 7% 33% 3% 7% 150 157
Thailand 44% 12% 33% 3% 7% 100
75
Indonesia 54% 12% 26% 2% 6% 50
27
Southeast 0 9
45% 14% 32% 2% 6%
Asia 2009 2010 2011 2012 2013 2014 2015 2016 2017 2018
All markets 39% 23% 31% 1% 6% Holiday Business VFR Study Misc.
More visits to the UK from Southeast Asia are made for Overall, visits have increased over the last ten years for every
holidays than for any other purpose, and this pattern is main journey purpose, apart from business visits. However,
consistent across the four key Southeast Asian markets. holiday visits have grown the most in volume.
Overall, visiting friends and relatives is the second most In 2011, holiday visits overtook visits to friends and relatives as
frequent reason why Southeast Asian visitors came to the UK, the reason why most visits from Southeast Asia to the UK were
followed by business visits in third. made.
Shares of holiday visits from Southeast Asia to the UK are Visits from this region for business decreased slightly in 2016,
higher than the all-market average, while there are and visits to visit friends and relatives decreased in 2017.
proportionally fewer business visits from Southeast Asia than Business visits have been challenged over the last ten years,
the global average. with visits decreasing between 2009 and 2010, and then since
2015.
Source: International Passenger Survey by ONS
*Includes Indonesia, Malaysia, Singapore, Phillipines, Thailand. Otherwise, Southeast Asia refers to Brunei, Cambodia, Indonesia, Laos, Malaysia, Myanmar (Burma), Philippines, Singapore, Thailand, Timor
Leste (East Timor) and Vietnam
15Market and Trade Profile Southeast Asia
1.1 Key statistics: seasonality
Seasonality 2018 The summer season is the most popular time for Southeast
Asian residents to visit the UK: in 2018, 29% of all visits from
35%
29%
Southeast Asia took place between July and September.
28%
30% 28% 27% The April-June season is also marginally more popular for
Share of visits
24% 24%
25% 21% these visitors than the all-market average, with 28% of visits in
20% 18%
2018 made in this quarter.
15%
Looking at trends over the last 10 years, we can see the
10%
5%
largest growth in popularity took place for April-June and July-
0% September; however, visits in all seasons declined from 2017
Jan-Mar Apr-Jun Jul-Sep Oct-Dec to 2018. January-March has consistently been the least
Southeast Asia All markets popular quarter, but saw a peak in 2017 after steady growth
from 2011 onwards.
Seasonality trend (visits 000s)
250
200
150
100
50
0
2007 2008 2009 2010 2011 2012 2013 2014 2015 2016 2017 2018
Jan - Mar Apr - Jun Jul - Sep Oct - Dec
Source: International Passenger Survey by ONS
Southeast Asia refers to Brunei, Cambodia, Indonesia, Laos, Malaysia, Myanmar (Burma), Philippines, Singapore, Thailand, Timor Leste (East Timor) and Vietnam
16Market and Trade Profile Southeast Asia
1.1 Key statistics: length of stay and accommodation
Accommodation stayed Duration of stay trend
(2016-2018 average % share of nights spent in the UK) (visits 000s, average on 3 rolling years ending 2018)
All markets Singapore Malaysia Thailand 200
187
All staying visits 100% 100% 100% 100% 158
150
Hotel/guest house 29% 35% 24% 24% 138
Free guest with 100 103
44% 39% 35% 40%
relatives or friends
Rented house/flat 8% 4% 5% 5% 50
Bed & Breakfast 3% 4% 3% 1%
4
Hostel/university/school 7% 16% 30% 7% 0
Paying guest family or
2% 0% 0% 12%
friends house
Own home 2% 2% 1% 3% Nil nights 1-3 nights 4-7 nights
Other 4% 0% 2% 9% 8-14 nights 15+ nights
Visitors from Singapore, Malaysia and Thailand all spent Since 2010, there have been some changes to the
more nights as a free guest with relatives or friends than in a pattern of length of stay of visits from South East Asia to
hotel or a guest house in the UK in 2016-2018. the UK. Visits of 4 to 7 nights were the most popular in
The latter type of accommodation is the second most 2016-2018, and these types of visits almost doubled
common by share of nights spent there for Singapore and compared to 2011.
Thailand, and third for Malaysia. Volumes of visits of 1-3 nights and of 8-14 nights to the
Both Singapore and Malaysia over index on the all-market UK are usually similar; however, the popularity of 8-14
average for the number of nights spent in a hostel, university night stays drew ahead in 2016-2018, reaching 158,000
or school; this is particularly the case for Malaysia, with 30% visits per year on average. Volumes of 15+ night stays
of visitors staying in this type of accommodation. have remained quite steady since 2011.
Source: International Passenger Survey by ONS
Southeast Asia refers to Brunei, Cambodia, Indonesia, Laos, Malaysia, Myanmar (Burma), Philippines, Singapore, Thailand, Timor Leste (East Timor) and Vietnam
17Market and Trade Profile Southeast Asia
1.1 Key statistics: repeat holiday visits and package tours
Proportion of overnight holiday visitors to Proportion of visits that are bought
the UK that have visited the UK before* as part of a package or all-inclusive
tour (2016-2018)***
63%
60%
13%
48% 48%
9%
8%
6%
5%
3%
3%
1%
Business Holiday VFR All journey
All markets Singapore Malaysia Thailand** purposes
Southeast Asia All markets
International Passenger Survey by ONS; *Excluding British nationals, 2015 data
Southeast Asia refers to Brunei, Cambodia, Indonesia, Laos, Malaysia, Myanmar (Burma), Philippines, Singapore, Thailand, Timor Leste (East Timor) and Vietnam
***See definition of package holiday in appendix
18Market and Trade Profile Southeast Asia
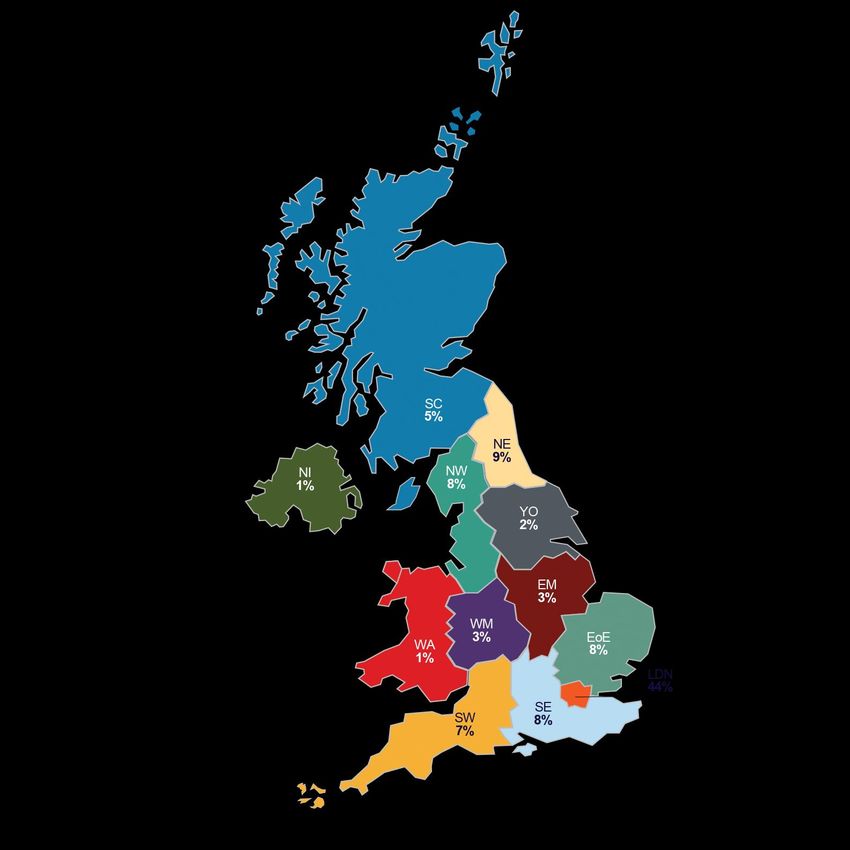
1.2 Getting around Britain: regional spread
Visits to the UK (2018)
Nights Visits Spend
Nights
Region
stayed (000) (000) (£m) (% share, 2018)
Total 6,764 559 668
Scotland (SC) 333 58 48
Wales (WA) 86 13 11
Northern Ireland (NI) 55 3 3
London (LDN) 2,967 392 401
North East (NE) 620 17 35
North West (NW) 555 48 31
Yorkshire (YO) 111 12 6
West Midlands (WM) 323 38 35
East Midlands (EM) 186 15 8
East of England (EoE) 543 30 14
South West (SW) 451 36 40 5%
South East (SE) 553 59 45
Nil nights (Nil) N/A 5 3
Source: International Passenger Survey by ONS. Visits data for nations and regions includes overnight stays, not day trips.
Data includes Brunei, Cambodia, Indonesia, Laos, Malaysia, Myanmar (Burma), Philippines, Singapore, Thailand, Timor Leste (East Timor)
and Vietnam
19Market and Trade Profile Southeast Asia
1.2 Getting around Britain: regional spread and top towns and cities
Top towns and cities visited (2013-2018)
Town Average yearly overnight visits (000s)
Almost 1-in-2 nights spent by Southeast Asian visitors in the
UK on average in 2016-2018 was spent in regional England
London 446 (outside of London), which slightly over indexes compared to
Edinburgh 40 the all-market average (49% vs. 47%).
Manchester 36 However, London is still the most visited city for Southeast
Glasgow 16 Asians. Other popular cities include Edinburgh, Manchester,
Glasgow and Birmingham.
Birmingham 15
Overall in 2016-2018, visitors from Southeast Asia spend
more nights on average in Northern England and the West
Regional spread 2016-2018 Midlands than the all-market average, but fewer in the South
Share of Scotland Wales London Rest of Northern
East.
nights… England Ireland Visitors from Southeast Asia are more likely to go to British
villages and countryside than to the coast and beaches whilst
Singapore 14% 1% 46% 38%Market and Trade Profile Southeast Asia
1.2 Getting around Britain: visits to coast, countryside and villages
Propensity to visit coast, countryside and villages
7%
Holiday: Went to the coast or beaches
14%
23%
Holiday: Went to countryside or villages
18%
9%
All journey purposes: Went to the coast or beaches
10%
22%
All journey purposes: Went to countryside or villages
13%
Southeast Asia All markets
Source: International Passenger Survey by ONS 2016
Note: Southeast Asia includes Indonesia, Malaysia, Philippines, Singapore, Thailand
21Market and Trade Profile Southeast Asia
1.2 Getting around Britain: use of internal modes of transport
Propensity to use internal modes of transport
Car/vehicle you/group brought 0.3%
to the UK 1%
8%
Hired self-drive car/vehicle
5%
Private coach/minibus (for 4%
group only) 2%
Public bus/coach (outside 4%
town/city) 5%
16%
Uber or similar app
9%
34%
Taxi
27%
27%
Train (outside town/city)
23%
Bus, Tube, Tram or Metro Train 61%
(within town/city) 48%
5%
Domestic flight
1%
Southeast Asia All markets
Source: International Passenger Survey by ONS, 2013; Southeast Asia includes Indonesia, Malaysia, the Philippines, Singapore, and Thailand.
22Market and Trade Profile Southeast Asia
1.3 Visitor demographics
Visitor characteristics
Slightly more visits from Southeast Asia to the UK are
made by men than women (56% vs. 43% respectively
in 2018). This pattern also holds true for holiday and
business visits. 32%
45% of Southeast Asian visitors in 2018 were between of visits from six key
25 and 44 years old. Southeast Asian markets
come from Singapore
Looking at the age group trend, there has been little
growth in the 0-15 cohort over the last several years.
This hints at fewer families visiting the UK from
Southeast Asia, as a proportion of all visits. The 65+
age group grew the most in percentage terms from
2007 to 2018: retirees therefore account for a bigger
share of visits to the UK than before.
Source: International Passenger Survey by ONS
23Market and Trade Profile Southeast Asia
1.3 Visitor demographics: gender and age groups
Gender ratio of visits (2018) Age group trend (visits in 000s)
Southeast 2018 9 49 133 118 122 81 24 22
56% 43%
Asia
2017 15 51 160 159 149 69 28 5
2016 14 64 125 136 130 73 28 0
All markets 57% 41%
2015 12 51 125 155 125 68 26 2
Male Female
2014 12 45 113 133 137 62 23 0
Gender ratio of visits from Southeast Asia 2013 14 41 103 116 111 65 22 1
by journey purpose (2018)* 2012 7 42 93 104 100 57 12 1
2011 13 38 98 100 94 48 17 1
VFR 50% 50%
2010 12 41 79 97 93 50 14 1
Holiday 55% 45% 2009 14 39 69 87 86 48 11 0
2008 10 23 71 86 59 41 13 0
Business 78% 22% 2007 11 20 75 87 82 45 7 0
0 -15 16-24 25-34 35-44 45-54 55-64 65+ Not Known
Male Female
Source: International Passenger Survey by ONS
Southeast Asia refers to Brunei, Cambodia, Indonesia, Laos, Malaysia, Myanmar (Burma), Philippines, Singapore, Thailand, Timor Leste (East Timor) and Vietnam
24Market and Trade Profile Southeast Asia
1.3 Visitor demographics: origin
Visits to the UK
Most visits from Southeast Asia come from
Singapore, closely followed by Malaysia, at
33% and 30% respectively.
Thailand is the next largest source of UK
Vietnam visits from Southeast Asia, with 93,000 visits
19 | 3%
Philippines
coming from this market in 2018.
45 | 8% Of the major Southeast Asian countries,
Thailand Indonesia, the Philippines and Vietnam yield
93 | 17% the lowest number of UK visits, at less than 1
Malaysia in 10 each.
165 | 30% Other Southeast Asian countries (Brunei,
Visits in 000s | % share of visits Cambodia, Myanmar and Laos) were the
source of 14,000 visits to the UK in 2018,
Singapore
accounting for 2% of all UK visits across this
178 | 32% High Indonesia region when combined.
Medium 45 | 8%
Low
Visits in 000s | Percentage of UK visits within these six countries
Source: International Passenger Survey by ONS (2018)
25Market and Trade Profile Southeast Asia
1.4 The UK and its competitors
Market size, share and growth potential
A large proportion of outbound trips from Southeast Asian
countries are within Southeast Asia. This pattern is
forecast to be maintained in the next few years.*
Other popular destinations include China, other Northeast
Asian countries, India and the Gulf destinations (mainly Britain
Saudi Arabia and the UAE).
The UK is forecasted to lose some share in Southeast ranks 1st
Asian overnight visits among key competitors up to 2023. among SE Asia outbound
This pattern is also seen for the US. India is the only of the destinations by volume of
selected competitors that is predicted to see significant overnight stays in Europe
growth in visits over the same period, with forecasted
growth of 6 percentage points within the competitor set.
Looking ahead to 2023, visits from Singapore and
Malaysia to the UK are forecasted to grow the most from
this region, at 26% and 24% growth respectively.
Southeast Asian travellers are more than two times more
likely than the all-market average to come to the UK as
part of a multi-country trip.
Source: Oxford Economics, Southeast Asia includes Brunei, Cambodia, Indonesia, Lao, Malaysia, Myanmar, Philippines, Singapore, Thailand, Vietnam.
*Note: these forecasts do not take the potential impact of COVID-19 on inbound tourism from the region into account
26Market and Trade Profile Southeast Asia
1.4 The UK and its competitors
Britain’s market share of total Southeast Britain’s market share of total Southeast
Asian outbound overnight visits Asian outbound visits among competitor set
compared to other destinations (2018)
4%
3% New Zealand 4%
1% 3%
6% 6%
Switzerland 6%
7%
6%
Turkey 7%
5%
8%
United Kingdom 9%
11%
29%
United Arab 15%
15%
Emirates 13%
61% 14%
United States 16%
18%
22%
India 16%
17%
26%
Australia 26%
26%
Intra South East Asia Other Asia Pacific
UK Other Europe
2023 2018 2013
Other destinations
Source: Oxford Economics, based on overnight visits
Southeast Asia refers to Brunei, Cambodia, Indonesia, Laos, Malaysia, Myanmar (Burma), Philippines, Singapore, Thailand, Timor Leste (East Timor) and Vietnam
27Market and Trade Profile Southeast Asia
1.4 The UK and its and competitors
Historic and potential visits to the Historic and potential visits to the UK by
UK (000s)* market in share of total outbound visits (%)
900
0.8%
800 771
Thailand 0.8%
700 1.0%
600 0.7%
Singapore 0.8%
500 0.7%
400 0.3%
300 Philippines 0.5%
0.4%
200 1.3%
100 Malaysia 1.2%
1.7%
0 0.3%
1998 2003 2008 2013 2018 2023 2028
Indonesia 0.4%
0.3%
Note: these forecasts do not take the potential impact of
COVID-19 into account. As of March 3rd 2020, COVID-
0.6%
19 cases are present in Cambodia, Indonesia, Malaysia, Southeast Asia
0.6%
the Philippines, Singapore, Thailand, and Vietnam. The (overall)
0.7%
future effect of this on UK inbound tourism from the
region is unknown at present.
2023 2018 2013
Source: Oxford Economics, based on overnight visits
*Note: includes Indonesia, Malaysia, Philippines, Singapore, and Thailand. Otherwise, data includes Brunei, Cambodia, Indonesia, Laos, Malaysia, Myanmar (Burma), Philippines, Singapore, Thailand, Timor
Leste (East Timor) and Vietnam
28Market and Trade Profile Southeast Asia
1.4 The UK and its competitors
Propensity for Southeast Asian travellers to visit the UK as part of a multi-country trip
% visits which included at least a night in another country…
Southeast Asia 10% 11% 9%
All markets 4% 4% 5%
Before visiting the UK only After visiting the UK only Before and after visiting the UK
Source: International Passenger Survey by ONS, 2016
Note: Southeast Asia includes Indonesia, Malaysia, Philippines, Singapore & Thailand
29Market and Trade Profile Southeast Asia
Chapter 2:
Experiences and
perceptions
30Market and Trade Profile Southeast Asia
2.1 Inbound activities
Top 10 activities for Southeast Asian visitors
Among visitors from Southeast Asian during their visit to the UK
countries, going shopping is the most
1. Going shopping
popular activity when they are in the UK,
followed by dining in restaurants, visiting 2. Dining in restaurants
parks or gardens and visiting castles or
historic houses. Sightseeing famous 3. Visiting parks or gardens
monuments/buildings also features in
visits from this area to the UK. 4. Visiting castles or historic houses
Southeast Asian visitors are more likely
than the all-market average to attend the 5. Sightseeing famous monuments/buildings
theatre, a musical, opera or ballet, as
6. Visiting museums or art galleries
well as visit literary, music, TV or film
locations. 7. Going to the pub
In contrast, Southeast Asian visitors are
less likely than the all-market average to 8. Socialising with the locals
take part in sports activities or walk
along the coast or in the countryside. 9. Visiting religious buildings
10.Walking in the countryside
For more information on activities, please consult our
activities page.
Source: International Passenger Survey by ONS, rankings based on 2007-2017 data, only Indonesia, Malaysia, Philippines, Singapore and Thailand considered
31Market and Trade Profile Southeast Asia
2.1 Inbound activities
Propensity to visit museums and art Propensity to visit built heritage sites
galleries
32%
Holiday: visited religious buildings
50% 35%
Holiday: visited
museums and art
galleries Holiday: visited castles/historic 48%
48% houses 48%
All journey purposes: visited 26%
All journey 37% religious buildings 20%
purposes: visited
museums and art
galleries All journey purposes: visited 39%
28%
castles/historic houses 28%
Southeast Asia All markets
Southeast Asia All markets
Source: International Passenger Survey by ONS, 2016
Note: Southeast Asia includes Indonesia, Malaysia, Philippines, Singapore, Thailand
32Market and Trade Profile Southeast Asia
2.1 Inbound activities
Propensity to attend the performing arts Propensity to visit literary, music, TV or
film locations
21% 8%
Holiday: went to the VFR: visited literary, music, TV
theatre/musical/opera/ballet 14% or film locations
5%
4%
Holiday: attended a festival 12%
4% Holiday: visited literary, music,
TV, or film locations
9%
All journey purposes: went to the 16%
theatre/musical/opera/ballet 10%
All journey purposes: visited 9%
literary, music, TV, or film
All journey purposes: attended a 4% locations 5%
festival 9%
Southeast Asia All markets
Southeast Asia All markets
Source: International Passenger Survey by ONS, 2017 (live music, visiting literary, music, TV or film loations), 2016 (other performing arts)
Note: Southeast Asia includes Indonesia, Malaysia, Philippines, Singapore, Thailand
33Market and Trade Profile Southeast Asia
2.1 Inbound activities
Propensity to take part in sports activities Propensity to visit a park/garden
or a national park
Holiday: took part in sports 1%
activities 3%
Holiday: visited a National 11%
All journey purposes: took part 1%
Park 11%
in sports activities 2%
Southeast Asia All markets Holiday: visited parks or 50%
gardens 50%
Propensity to walk in the countryside or 11%
All journey purposes: visited a
walk along the coast National Park 7%
Holiday: Walking along the 11% All journey purposes: visited 43%
coast 8% parks or gardens 32%
Holiday: Walking in the 26%
countryside 21%
All journey purposes: 8%
Walking along the coast 9% Southeast Asia All markets
All journey purposes: 20%
Walking in the countryside 22%
All markets Southeast Asia
Source: International Passenger Survey by ONS, 2016 (visiting a park/garden and visiting a national park), 2011 (sports activities), 2007 (walking in the countryside)
Note: Southeast Asia includes Indonesia, Malaysia, Philippines, Singapore, Thailand
34Market and Trade Profile Southeast Asia
2.1 Inbound activities
Propensity to go to a pub, and Propensity to go dining in restaurants, or
socialise with the locals to go to bars or night clubs
46%
VFR: socialising with the locals 18%
45% VFR: went to bars or night clubs
14%
46%
VFR: went to pub 75%
49% VFR: dining in restaurants
62%
24%
Holiday: socialising with the locals 9%
32% Holiday: went to bars or night clubs
15%
24%
Holiday: went to pub 72%
48% Holiday: dining in restaurants
70%
17%
Business: socialising with the locals Business: went to bars or night 12%
15% clubs 6%
30%
Business: went to pub 74%
24% Business: dining in restaurants
49%
All journey purposes: socialising 30%
All journey purposes: went to bars 12%
with the locals 32% or night clubs 12%
32%
All journey purposes: went to pub All journey purposes: dining in 71%
42% restaurants 61%
Southeast Asia All markets Southeast Asia All markets
Source: International Passenger Survey by ONS, 2008 (dining in restaurants), 2017 (other activities)
Note: Southeast Asia includes Malaysia, Singapore, Thailand
35Market and Trade Profile Southeast Asia
2.1 Inbound activities
Propensity to go shopping Propensity to purchase selected items
Business: went 48%
shopping 21% Clothes or shoes 41%
61%
Holiday: went 80% 10%
shopping 69% Personal accessories e.g. jewellery 15%
9%
80% Bags, purses etc
VFR: went shopping 27%
61%
12%
Cosmetics or toiletries e.g. perfume 22%
All journey purposes: 74%
went shopping 54% 13%
Books or stationery 22%
Southeast Asia All markets 9%
Games, toys or gifts for children 14%
24%
Propensity to go to a spa or beauty centre Food or drink 29%
5%
CDs, DVDs, computer games etc 10%
Holiday: went to a spa 4% Electrical or electronic items e.g. 3%
or beauty centre 3% camera 5%
3%
Items for your home e.g. furnishing 6%
All journey purposes: 3%
went to a spa or 16%
2% Other holiday souvenir 21%
beauty centre
38%
None of these
VFR: Went to a spa or 3% 24%
beauty centre 3%
All markets Southeast Asia
Southeast Asia All markets
Source: International Passenger Survey by ONS, 2017 Source: International Passenger Survey by ONS, 2013
Note: Southeast Asia includes Malaysia, singapore, Thailand
36Market and Trade Profile Southeast Asia
2.2 Welcome and recommending Britain
Feeling of ‘welcome’ in Britain Likelihood to recommend Britain
82% 81% 82%
74%
23%
15% 17%
15%
3% 2% 2% 2%
0% 0% 0% 0% 0% 0% 0% 0%
Very Welcome Neither Unwelcome Very Extremely Likely Neutral Unlikely Not likely at
Welcome Unwelcome likely all
Southeast Asia All market average Southeast Asia All market average
Leisure visitors from Southeast Asia are less likely than the all-market average to feel ‘very welcome’ in Britain, however
74% did feel this way. They are more likely than the all-market average to feel ‘welcome’.
Southeast Asian visitors are similarly likely to recommend Britain to friends and family after their trip compared to other
global markets, with 98% likely to do so.
Source: IPS 2017
Note: Southeast Asia includes Indonesia, Malaysia, Philippines, Singapore, Thailand
37Market and Trade Profile Southeast Asia
2.3 Perceptions of Britain
Overall, the travel trade reports that perceptions of Britain in
Southeast Asia are favourable.
Looking at Singapore and Indonesia, though, we can see some
differences between what they expect from a holiday trip and their Areas of strength for Britain:
perceptions of Britain compared to other destinations.
historic sites and
For example, Singaporeans would prefer destinations that offer sports events
good value for money, and provide fun and laughter, while
Indonesians rank higher their need to feel physically healthier, and
for peace and quiet in a holiday destination. Australia ranks quite
well in each case, compared to Britain.
However, both markets rank Britain highly for the possibility to
watch some sporting events live while visiting. Both clearly have a
higher interest in the Premier League football matches than in other
top European football leagues.
Singapore in particular ranks the UK highly for the historic and
iconic sites they might be able to visit there.
Source: Arkenford 2013, Statista.com from YouGov 2014
38Market and Trade Profile Southeast Asia
2.3 Perceptions of Britain: Singapore
Holiday wants and % saying destination is best place for…
Importance Attribute (20 most important) UK France Italy Australia US Germany
5.87 Offers good value for money 14% 17% 17% 28% 22% 12%
5.84 Have fun and laughter 14% 12% 9% 31% 26% 8%
5.81 Enjoy the beauty of the landscape 39% 42% 45% 50% 33% 30%
5.75 See world famous sites and places 46% 48% 51% 28% 37% 31%
5.70 Enjoy peace & quiet 21% 24% 23% 42% 14% 20%
5.70 Enjoy local specialities (food and drink) 12% 39% 34% 18% 18% 19%
5.66 Explore the place 28% 33% 32% 37% 27% 20%
5.66 Easy to get around by public transport 31% 21% 17% 26% 28% 18%
5.66 The people are friendly and welcoming 21% 18% 20% 29% 25% 14%
5.66 It offers unique holiday experiences 31% 36% 37% 37% 33% 27%
5.64 Do something the children would really enjoy 27% 23% 20% 53% 50% 17%
5.64 Provides a wide range of holiday experiences 29% 30% 29% 41% 43% 22%
5.63 Experience things that are new to me 18% 28% 29% 27% 25% 23%
5.60 Chill/ slow down to a different pace of life 15% 24% 23% 39% 17% 12%
5.56 Broaden my mind/ Stimulate my thinking 28% 29% 31% 31% 31% 27%
Experience activities/places with a wow
5.51 26% 27% 24% 32% 28% 20%
factor
5.48 Do what I want when I want spontaneously 9% 6% 18% 23% 25% 11%
5.48 A good place to visit at any time of year 20% 22% 21% 31% 25% 15%
5.46 Have dedicated time with my other half 34% 46% 42% 39% 29% 26%
Source: VisitBritain/Arkenford 2013
39Market and Trade Profile Southeast Asia
2.3 Perceptions of Britain: Singapore
Holiday wants and % saying destination is best place for…
Importance Attributes (20 least important) UK France Italy Australia US Germany
5.44 Feel connected to nature 28% 27% 33% 55% 33% 22%
5.44 Be physically healthier 22% 21% 23% 34% 17% 18%
5.41 Enjoy high quality food and drink (gourmet food) 21% 55% 43% 30% 30% 22%
5.39 Soak up the atmosphere 39% 35% 44% 45% 24% 23%
5.24 Good shopping 20% 30% 30% 27% 46% 12%
5.19 Visit a place with a lot of history/historic sites 53% 49% 51% 25% 30% 39%
5.15 Feel special or spoilt 17% 36% 26% 27% 20% 17%
5.15 Revisit places of nostalgic importance to me 22% 27% 22% 21% 22% 16%
4.86 Meet the locals 12% 19% 37% 30% 30% 7%
4.83 Get off the beaten track 19% 29% 19% 40% 25% 11%
4.76 Do something environmentally sustainable/ green 9% 19% 17% 44% 9% 24%
4.75 Experience adrenalin filled adventures 5% 18% 13% 49% 41% 17%
4.73 Get some sun 23% 25% 26% 52% 38% 12%
4.62 Fashionable destination 28% 51% 45% 22% 39% 18%
4.53 Meet and have fun with other tourists 10% 31% 32% 48% 54% 15%
4.52 To participate in an active pastime or sport 29% 24% 21% 38% 27% 26%
4.51 Visit places important to my family's history 22% 27% 27% 27% 23% 21%
Go somewhere that provided lots of laid on
4.45 32% 29% 33% 33% 46% 25%
entertainment/nightlife
Do something useful like volunteering to help on
4.26 16% 35% 18% 23% 33% 28%
a project
4.18 Party 32% 25% 14% 47% 33% 24%
3.87 Watch a sporting event 41% 14% 22% 21% 28% 23%
Source: VisitBritain/Arkenford 2013
40Market and Trade Profile Southeast Asia
2.3 Perceptions of Britain: Indonesia
Holiday wants and % saying destination is best place for…
Importance Attributes (20 most important) UK France Italy Australia US Germany
6.35 Be physically healthier 32% 41% 37% 45% 29% 32%
6.34 Enjoy peace & quiet 24% 39% 43% 40% 16% 21%
6.32 Enjoy the beauty of the landscape 37% 46% 45% 61% 30% 23%
6.31 See world famous sites and places 50% 70% 59% 42% 49% 43%
6.29 Broaden my mind/ Stimulate my thinking 43% 60% 53% 45% 45% 44%
6.26 The people are friendly and welcoming 36% 44% 42% 43% 28% 27%
6.24 Have dedicated time with my other half 37% 74% 63% 47% 34% 34%
6.23 It offers unique holiday experiences 44% 61% 60% 50% 40% 38%
6.21 Experience activities/places with a wow factor 29% 63% 53% 42% 30% 29%
6.21 Enjoy local specialities (food and drink) 28% 59% 68% 34% 25% 32%
6.20 Experience things that are new to me 30% 52% 41% 40% 47% 28%
6.15 Provides a wide range of holiday experiences 42% 58% 57% 50% 47% 38%
6.13 A good place to visit at any time of year 33% 53% 48% 51% 38% 27%
6.10 Have fun and laughter 33% 45% 31% 41% 36% 28%
6.10 Feel connected to nature 24% 25% 21% 65% 16% 19%
6.06 Explore the place 30% 46% 49% 46% 26% 27%
6.06 Do something the children would really enjoy 35% 41% 39% 58% 48% 30%
6.01 Chill/ slow down to a different pace of life 29% 47% 37% 37% 25% 23%
5.99 Easy to get around by public transport 47% 52% 46% 47% 50% 44%
5.93 Revisit places of nostalgic importance to me 26% 49% 45% 35% 21% 26%
Source: VisitBritain/Arkenford 2013
41Market and Trade Profile Southeast Asia
2.3 Perceptions of Britain: Indonesia
Holiday wants and % saying destination is best place for…
Importance Attributes (20 least important) UK France Italy Australia US Germany
5.89 Offers good value for money 33% 56% 50% 33% 36% 30%
Do something environmentally sustainable/
5.88 34% 43% 34% 33% 39% 42%
green
5.85 Visit a place with a lot of history/historic sites 50% 67% 67% 28% 27% 48%
5.80 Good shopping 29% 51% 43% 36% 40% 19%
5.75 Enjoy high quality food and drink (gourmet food) 20% 77% 65% 31% 33% 26%
5.64 Do what I want when I want spontaneously 25% 48% 36% 45% 30% 45%
5.57 Visit places important to my family's history 17% 30% 25% 29% 25% 24%
5.55 Get off the beaten track 31% 21% 50% 33% 21% 25%
5.46 Feel special or spoilt 19% 47% 45% 34% 21% 14%
5.41 To participate in an active pastime or sport 43% 34% 44% 42% 36% 30%
5.38 Meet the locals 39% 26% 28% 73% 32% 41%
5.38 Meet and have fun with other tourists 28% 27% 35% 54% 27% 5%
5.29 Experience adrenalin filled adventures 28% 36% 31% 44% 30% 28%
5.29 Get some sun 16% 37% 36% 51% 25% 19%
5.17 Fashionable destination 29% 79% 67% 19% 38% 19%
5.04 Soak up the atmosphere 67% 45% 45% 22% 55% 0%
Do something useful like volunteering to help on
4.97 37% 39% 33% 21% 38% 26%
a project
Go somewhere that provided lots of laid on
4.76 42% 67% 52% 49% 62% 31%
entertainment/nightlife
4.62 Party 51% 68% 42% 56% 47% 34%
4.61 Watch a sporting event 44% 41% 47% 26% 33% 32%
Source: VisitBritain/Arkenford 2013
42Market and Trade Profile Southeast Asia
2.3 Perceptions of Britain: focus on football
Interests in British Premier League compared to other similar European offers (2014)
87%
74%
62% 62%
59%
52%
50%
29%
24%
14% 15%
12%
Singapore Indonesia China
Premier League (England) La Liga (Spain) Bundesliga (Germany) Serie A (Italy)
Source: Statista.com from YouGov 2014
43Market and Trade Profile Southeast Asia
2.3 Visitor experience: Singapore
Trip satisfaction (% very satisfied)
63%
55% 58%
48%
38% 39%
11% 14%
Attractions Transport Food & drink Value for money
Singapore All market average
When it comes to trip satisfaction, visitors from Singapore are generally less satisfied with their trip
when compared to the all market average. Across attractions, transport, food and drink, they
demonstrate lower satisfaction scores than other global markets. They are most likely to feel very
satisfied with the UK’s attractions (55%) and least likely to be satisfied with value for money (11%).
Source: IPS 2015, overnight visitors, excluding UK nationals
44Market and Trade Profile Southeast Asia
Chapter 3:
Understanding
the market
45Market and Trade Profile Southeast Asia
3.1 Structural drivers
Southeast Asian countries are mostly linked together by ASEAN; the Association of
Southeast Asian Nations, an intergovernmental organisation created in 1967 to
promote economic, politic, security, military, social-cultural and educational
cooperation in the area. It is headquartered in Jakarta, Indonesia, and gathers this
country and Malaysia, the Philippines, Singapore, Thailand, Brunei, Cambodia,
Laos, Myanmar, and Vietnam. Only Timor-Leste (East Timor) is not part of the
4th
most populated
association. country in the
All these countries have been marked by colonialism and the Cold War. Vietnam world:
and Laos are communist states, while Timor-Leste, Indonesia, Myanmar, and Indonesia
Singapore are republics. Brunei is an absolute monarchy and the other nations are
parliamentary constitutional monarchies.
Southeast Asian culture is diverse, with Asian, Arabic as well as European heritage.
Indonesia is the most populated country in the region and has the largest Muslim
population in the world, which greatly influences travel trends. The urbanisation rate,
demographics and economies of these countries also affect travel patterns.
Singapore has, proportionately, the largest migrant population in this region as well
as (Brunei aside) the highest GDP per capita in the area by far. It also has the most
mature outbound market with people willing to escape the mega city they live in by
travelling abroad.
Economic growth in some markets across the region has been significantly
impacted by the US-China trade war in 2019.
Source: Oxford Economics, CIA World Factbook 2019
46Market and Trade Profile Southeast Asia
3.1 Structural drivers: demographic and social indicators
Population dynamics
Measure – 2019 estimates Singapore Malaysia Thailand Indonesia Philippines Vietnam
(unless otherwise stated)
Total population (m) 5.8 32.0 69.7 271.0 108.3 96.4
Median age (years, 2020 est.) 35.6 29.2 39.0 31.1 24.1 31.9
Population growth rate between
+3.6 +5.1 +0.8 +4.1 +5.4 +3.3
2019-2023 (%)
Proportion of international migrants
37.1% 10.7% 5.2% 0.1% 0.2% 0.1%
(% of total population)
Indonesia is the most populated country in Southeast Asia, and the 4th most populated country in the world.
Overall, the population in Southeast Asia is quite young, with all markets’ median age at around 30 years old or less,
aside from Singapore and Thailand. Southeast Asian populations are forecast to grow.
All inhabitants in Singapore live in an urban area, about 3-in-4 in Brunei and Malaysia, and just above 1-in-2 in Indonesia
and Thailand. Thus the main visitor source markets to the UK have the highest urbanisation rates in the region.
Apart from Brunei, Singapore and Malaysia, immigrants constitute fewer than 1-in-10 inhabitants in Southeast Asian
countries (the global average is 3.5%). However, different cultures still cohabite in this area where Christians, Muslims,
and Buddhists are all well represented. For example, in Malaysia alone, the population is an estimated 61% Muslim, 20%
Buddhist, 9% Christian, and 6% Hindu, among other religious groups.
The population of HNWIs* in Indonesia grew between 2017 and 2018, and Indonesia is currently ranked 23rd for
population of HNWIs globally; the only country in the region to rank in the top 25.
Source: Oxford Economics, CIA World Factbook 2020, UN Migration report 2019 Highlights, Capgemini Asia Pacific Wealth Report 2019
*HNWIs: stands for High Net Worth Individuals, people whose liquid assets are worth US$1m or over
47Market and Trade Profile Southeast Asia
3.1 Structural drivers: economic indicators
Previously strongly growing economies in Southeast However, Southeast Asian economies have been seen to
Asia have been negatively hit by the US-China trade war remain resilient in the face of economic challenges, and
in 2019. increased domestic demand may buffer these markets
Singapore and Thailand’s economies slumped in 2019 against global headwinds.
due to a drop in Chinese exports, as well as welcoming Rising GDP per capita is set to boost the middle class in
fewer tourists from China. the region’s main markets, who will look to travel more and
However, some countries in the region have been further than before to enjoy their holiday allowance
beneficiaries, with Vietnam and Cambodia enjoying (between 12 and 26 days, including public holidays).
increased exports to the US as investment moves away
from China.
GDP per capita PPP (US$) GDP yearly growth rate (real, %) Consumer spending growth rate (real, %)
2019 2019 2020 2021 2019 2020 2021
Singapore 78,760 Singapore 0.7 1.0 2.7 Singapore 4.2 2.3 3.8
Malaysia 26,292 Malaysia 4.5 3.9 4.4 Malaysia 7.3 5.2 4.5
Thailand 15,360 Thailand 2.3 2.0 3.7 Thailand 4.4 3.4 3.4
Indonesia 10,695 Indonesia 5.0 4.9 5.3 Indonesia 5.2 5.2 5.4
Philippines 7,390 Philippines 5.9 5.9 6.0 Philippines 5.8 5.8 5.4
Vietnam 6,262 Vietnam 7.0 6.5 6.5 Vietnam 7.31 6.62 6.26
Source: Oxford Economics, CIA World Factbook 2019, McKinsey ‘Urban World: Global Consumers to watch’ April 2016 report, Public Holidays
48Market and Trade Profile Southeast Asia
3.1 Structural drivers: exchange rate trends
Exchange rate trends (cost of GBP in SGD, MYR, THB, and IDR)
Singapore Dollar Malaysia Ringgit
2.5 7
2.0 6
1.5 5
1.0 4
2011 2012 2013 2014 2015 2016 2017 2018 2019 2011 2012 2013 2014 2015 2016 2017 2018 2019
Thai Baht Indonesian Rupiah
60 26,000
22,000
50
18,000
40
14,000
30 10,000
2011 2012 2013 2014 2015 2016 2017 2018 2019 2011 2012 2013 2014 2015 2016 2017 2018 2019
Please find the most up-to-date exchange rate trend based on monthly averages at visitbritain.org/visitor-economy-facts.
Source: Bank of England
49Market and Trade Profile Southeast Asia
3.2 Consumer trends
Southeast Asia is a diverse area where trends, and more precisely
travel trends, can be quite varied. However, some commonalities exist
across the region.
As the region has been developing, travel needs have been changing 3
too. Higher education can be an important draw for some parents who Southeast Asian
want to send their children to English-speaking countries in order to markets are in the top
improve their employability in the future. Malaysia, Singapore and
Thailand are among the top 10 non-EU source countries of students
10 non-EU source
attending higher education courses in the UK. This trend is becoming countries for higher
more prominent in Indonesia too. education
In those source markets, and in Indonesia in particular, cultural
heritage is also determinant in terms of holiday trends. In 2020,
Muslims represent two thirds or more of the population in Malaysia,
Brunei and Indonesia. Therefore destinations that are seen as Muslim-
friendly are among the top preferred destinations in the region as
people know those will be able to better cater for their needs and suit
their values, which is especially important for families travelling
together.
Finally, as wealth grows in this region, the appetite for luxury travel
grows too, including a particular segment of female sole travellers.
Sources: UKCISA/HESA, Pew Research Center, Oxford Economics, Capgemini Asia-Pacific World Wealth Report, Foresight Factory
50Market and Trade Profile Southeast Asia
3.2 Consumer trends: the UK as a key destination for studying
HE student enrolments from top 10 non- Focus on education
European countries Studying in English is often seen as a way to
improve employability, and English tests are
120,000 often taken at high school level to improve
students’ chances of being able to study
100,000 abroad in an English-speaking country. Britain
is one of the favourite destinations to study
80,000 English or in English abroad.
Three main Southeast Asian markets are in
60,000 the top non-EU source countries by volume of
students sent to the UK to attend higher
40,000 education courses: Malaysia, Singapore and
Thailand. As a consequence it is not rare to
20,000 see families visiting their children at university
in Britain, or sending them to visit before
0 applying for those courses, or even coming to
find accommodation all together. Education is
thus an important way to promote visits to the
UK in those markets.
2017-18 2013-14
Source: Foresight Factory (local perspective), UKCISA/HESA
51Market and Trade Profile Southeast Asia
3.2 Consumer trends: Muslim-friendly destinations
Indonesia has the largest Muslim population in Muslim population in Southeast Asia
the world by country in 2020
Saudi Arabia is Southeast Asia’s first destination by
volume of outbound overnight visits outside of the
immediate region.
The Muslim culture has a great influence in much of
Southeast Asia, especially in Malaysia, Brunei and
Indonesia (Muslims are forecast to constitute 66%,
75%, and 87% of their respective populations in 2020).
Islam’s main celebrations are public holidays in some
Southeast Asian countries such as Indonesia and
Malaysia, but also in Singapore and Thailand.
When it comes to travel, many would prefer going to
destinations that cater for their specific food
requirements and other religious obligations such as
praying. So even outside of pilgrimage, going to other
Muslim-majority country or Muslim-friendly destination is
popular, most of all for families. On their way to Mecca
for pilgrimage, Southeast Asians are also likely to make
stopovers to Istanbul or Dubai.
Indonesia Malaysia Philippines Thailand Myanmar Other
Source: Oxford Economics, Pew Research Center, Public Holidays, Google Top Travel Trends
52Market and Trade Profile Southeast Asia
3.2 Consumer trends: luxury travel and shopping
A growing market for luxury goods and experiences
Thanks to economic growth in these markets, and also thanks to the growth of the High Net Worth Individual
(HNWI) population in the area, the appetite for luxury goods and experiences is growing in Southeast Asia,
especially in Indonesia and Thailand. Singapore also boasts the highest GDP per capita of all Southeast Asian
countries by far, and has been a key market for luxury for a long time already.
The desire for experiential luxury, compared to more material luxury, in these markets is shifting slowly, with the
exception of Singapore, which is already a mature luxury market. Long-haul travel is a key aspiration for many,
but is still often linked to retail experiences. Many travellers would travel to explore the culture of their
destination, and to see the most famous sites, but also to shop for iconic brands abroad. Shopping, as much
as relaxing away from a stressful life in a busy city, can also be a strong motivator for travel.
Southeast Asians are no stranger to luxury travel offers: the region itself boasts some key destinations for
luxury travel and shopping. As a consequence, Southeast Asians can be quite assertive in the type of luxury
goods and experiences they want to enjoy.
Most would be attracted to Europe for its culture, and for some brands to an extent. Some would also have had
the possibility to fly to Europe for work and might have been able to extend a business trip there for leisure.
Some might have studied there or sent their children there, so visiting them is an important draw, as well as
key sites and destinations within the continent.
Source: Capgemini Asia-Pacific Wealth Report, Oxford Economics, Foresight Factory
53Market and Trade Profile Southeast Asia
3.2 Consumer trends: other travel trends
Growing health concerns and influence on travel trends
Influenced by Eastern philosophies, but also thanks to the standard of living of the growing middle class, more and
more people have a growing interest in healthy living. It is not just about maintaining appearance or fitness, but also
taking part in sports to feel well and relax, as well as eating well and using organic products to take care of oneself.
This might influence travellers to turn to more active holidays, or destinations that can accommodate their lifestyle,
offering visits of local food markets for instance. A regional example of how travel is impacted by this trend is the Airport
Wellness Oasis at Changi Airport which includes a fish spa, manicure and massage services.
Interests in cruises
There is a growing interest in cruise trips in Southeast Asia. Indonesia saw a 55% growth in demand for cruises from
2017 to 2018, and other markets in the region also demonstrated strong growth in the same period (54% from Vietnam,
50% from the Philippines, 15% from Thailand, and 40% from Singapore).
Royal Caribbean also revealed that Malaysia is their fastest-growing market. The company deployed 3 ships in the area
to accompany the growth in cruise demand. CLIA explains that Asian passengers recognise cruising as an easy,
relaxing holiday choice which is great value for money.
Family vs. solo travellers
Family is a very important value which affects travel in the region. However, in the last few years, demand for solo
travel has been growing.
Solo women travellers are often looking for safe, pampering holidays away from their busy, stressful city life. Safety is a
very important element for this segment, as they want travel to be stress-free, but the thought of going to a long haul
destination can be quite stressful on its own. They need reassurance that what they are booking will make them feel
safe and secure enough, address any special requirements and be convenient for them to truly enjoy it.
Source: Foresight Factory (Local perspectives, and other reports), TTG Asia, CLIA, Statista.com, TravelMarketReport
54You can also read