Market and Trade Profile China - China - November 2019
←
→
Page content transcription
If your browser does not render page correctly, please read the page content below
Market and Trade Profile China

Market and
Trade Profile China

China – November 2019
Market and Trade Profile China

Overview
•   Chapter 1: Inbound market statistics provides insights on key statistics about
    Chinese travellers and who they are. It takes a look at Britain and its competitive
    set as well as activities of visitors from China in the UK.
•   Chapter 2: Experiences and perceptions features details about what visitors
    from China are likely to do in the UK, how they felt during their visit to the UK, and
    whether they would recommend a stay there to their acquaintances. Perceptions
    of Britain held by the Chinese in general are also highlighted.
•   Chapter 3: Understanding the market takes a close look at consumer trends in
    China, and the booking, planning and further travel behaviour of this source
    market. Some details on how to best reach consumers in China are indicated too.
•   Chapter 4: Access and travel trade shows how people from China travel to the
    UK, how to best cater for their needs and wants during their stay and gives
    insights into the Chinese travel trade. Further ways of working with VisitBritain and
    other useful research resources are pointed out.

                                                                                                     2
Market and Trade Profile China

Contents (1)
Executive summary (page 6)

Chapter 1: Market statistics
 1.1 Key statistics (page 11)
 Tourism context, UK inbound overview, key figures on journey purpose, seasonality, duration of stay and
 accommodation trends, repeat visits, and visit types
 1.2 Getting around Britain (page 18)
 Where visitors stayed in the UK, places they visited,
  and internal modes of transport
 1.3 Visitor demographics (page 23)
 Demographic profile of Chinese visitors (age, gender)
 1.4 The UK and its competitors (page 26)
 How visits to the UK compare to main competitor destinations, and long-term trend and forecasts

Chapter 2: Experiences and perceptions
 2.1 Inbound activities (page 30)
 What activities Chinese visitors undertook in the UK
 2.2 Welcome and recommending Britain (page 36)
 How welcome departing visitors felt in Britain, and how likely they were to recommend a visit
 2.3 Perceptions of Britain (page 37)
 How people in this source market see Britain, and how it compares to other destinations

                                                                                                                       3
Market and Trade Profile China

Contents (2)
Chapter 3: Understanding the Market
3.1 Structural drivers (page 45)
Key demographic, social, economic indicators and exchange rates influencing the outbound travel market
3.2 Consumer trends (page 51)
General and travel-related trends in this source market
3.3 Booking and planning (page 54)
How Chinese travellers plan and book their trips to the UK, and their holidays in general
3.4 Reaching the consumer (page 59)
An overview of the media landscape in this source market, and main sources of influences for people
planning a holiday

Chapter 4: Access and Travel Trade
4.1 Access (page 68)
How visits to the UK were made, and an overview of the air connections between this source market and
the UK
4.2 Travel trade (page 72)
What the travel trade in market looks like and useful tips to work with travel agents and other main players
4.3 Caring for the consumer (page 76)
Tips to understand Chinese travellers and best cater to their needs

Appendix:
Working with VisitBritain (page 79)
Useful resources (page 82)
Definitions, sources and information on this report (page 84)

                                                                                                                       4
Market and Trade Profile China

Executive summary

                                                     5
Market and Trade Profile China
1: Inbound market statistics
Chapter summary
China is the most valuable market for international tourism expenditure,
spending over US$277bn abroad in 2018.
The Chinese outbound market is booming. Visits abroad have more than
tripled in 10 years; from almost 27m overnight stays in 2008, to 100m in
In 2018 China was the
2018. The growth rate of outbound visits has slowed in recent years, but
they are still forecast to exceed 160m trips overseas by 2028. most
Hong Kong and Macao are usually the most visited destinations by
Chinese travellers. However, with more now venturing further away, the valuable
USA, France, Germany, Australia and the UAE remain the most popular
outbound market
destinations outside of Asia and neighbouring Russia for Chinese visitors
in 2018.
China was the 22nd largest inbound source market for the UK in 2018,
and the 10th for spend, with new records set for both visits and nights
spent in the UK.
NB there is evidence that the International Passenger Survey has
underestimated the numbers of Chinese visitors to the UK in recent
years, based on comparisons with other data sources. Estimates of
visitors from China may be subject to change.*
Source: International Passenger Survey by ONS, Oxford Economics, UNWTO
*Note: Official IPS visit figures are issued by the Office for National Statistics.
6Market and Trade Profile China
2: Experiences and perceptions
Chapter summary
Chinese people usually have a good opinion of Britain. In 2018
they ranked Britain 2nd among 50 nations overall, and also for
tourism, culture and people. Comparatively, Britain’s natural Main reasons why
Chinese people visited
beauty ranked lower (15th). Britain:
France (strongest on historic sites) and Australia (strongest on Cultural
sun) are usually perceived by the Chinese as places that would attractions, local
better suit their holiday needs than the UK before travelling. food/drinks,
However, the French tourism sector has warned of negative natural beauty
impacts resulting from Yellow Vest protests – so perceptions of
safety may be affected among Chinese travellers.
In contrast, once they visit Britain, almost 3-in-4 holidaymakers
would be ‘extremely likely’ to recommend a holiday to Britain.
Both cultural attractions and natural beauty feature in the most
common reasons why Chinese leisure travellers visit Britain.
When on holiday in Britain, they are also more likely to partake in
cultural and nature-related activities than the all-market average.
Source: Anholt Nation Brands Index 2018 (powered by Ipsos), Arkenford 2013, International Passenger Survey by ONS, VisitBritain/IPSOS 2016, France24
7Market and Trade Profile China
3: Understanding the market
Chapter summary
China has a population of 1.4 billion; the largest in the world, with
growing young middle and affluent classes. However, the population
has started to age. TV/Film
Most Chinese visitors live in large urban areas (30% from Beijing and can be important
18% from Shanghai), despite a low urbanisation rate in the country factors of influence
overall when compared to neighbouring countries. among Chinese
travellers
There are 10 Chinese public holidays per year, and going away is a
strong aspiration: it is an opportunity to display your social status and
learn more about the world.
Chinese visitors have a very short lead-in time: 75% of visitors to
Britain booked their trip within 2 months of their departure.
Word-of-mouth is the most important influence on destination choice.
Chinese middle and upper classes now explore destinations further
away than ever before, and this trend is set to grow. Mobile travel
apps and platforms allow them to be more independent in planning
their travels. Culture is still an important draw to travel for most, but
interests in niche destinations and unique experiences is growing too.
Source: CIA World Factbook 2018, Goldman Sachs 2015, VisitBritain/IPSOS 2016, Anholt Nation Brands Index 2017, Resonance Consultancy/ China Luxury Advisors 2018, officeholidays
8Market and Trade Profile China
4: Access and travel trade
Most Chinese visitors will reach Britain by air. Only 5% of visits from
China to the UK in 2018 were made through the tunnel or by sea in
total. Looking at Chinese holiday visitors in 2016, 24% paired a visit
to the UK and to another country as part of the same trip.
Airline seat capacity from China to Britain has grown significantly in +123%
the past ten years. Chinese carriers have increased their capacity Growth in seat capacity on
to the UK, creating new routes or converting seasonal routes into direct, non stopping flights
year-round services. from China to Britain from
2008 to 2018
The Chinese travel market is still very much dominated by offline
bookings, especially for long haul trips. However, online travel
agents (OTAs) are making progress year on year: almost 1-in-2
netizens made a travel booking online in China by the end of 2017,
and millennials are more likely to use OTAs than those aged 37
plus.
The online travel agent (OTA) market also tends to be less
fragmented than the traditional travel trade. Ctrip dominates this
online travel market, but the “BATs” (Baidu, Alibaba, Tencent) are
major players too. Five OTAs command 80% market share.
Source: International Passenger Survey by ONS, Apex Rdc, CNNIC‘s 41st report (January 2018), Analysys.cn, Resonance Consultancy/ China Luxury Advisors 2018, ChinaDaily.com
9Market and Trade Profile China
Chapter 1:
Inbound Market
Statistics
10Market and Trade Profile China
Chapter 1.1: Key statistics
Key insights
China was the 22nd largest inbound source market for the UK in
2018, and the 10th for spend.
2018 was a record year for the Chinese inbound market to the UK,
with new records set for visits and nights. And this is no surprise: the
Chinese outbound market is booming, and with only 30% of Chinese
holiday visitors to the UK having been before (vs. 63% across
£657m
markets), this should only grow further. spent in the UK in 2018
In 2018, 57% of Chinese visits to the UK were made by
holidaymakers. 9% of visits are made by students*, which is
considerably higher than the all market average of 1%, and due to
longer stays, students make up 41% of the nights spent by Chinese
visitors in the UK. This demonstrates that China is a key market for
study tourism.
In 2018, visits from China were still very seasonal with 41% taking
place between July and September. Regional spread is more
pronounced: Chinese visitors spent 58% of their nights in the UK
outside of London.
Source: International Passenger Survey by ONS, Oxford Economics. Repeat visitors data from 2015.
*To be included in IPS figures as an overseas study visitor, students must be staying in the UK for less than one year
11Market and Trade Profile China
1.1 Key statistics
Global context Inbound to UK overview
Measure 2018 Measure Visits Nights Spend
(000s) (000s) (£m)
International tourism 10 year trend (08-18) +262% +165% +380%
277.3
expenditure (US$bn) 2008 108 2,312 137
Global rank for international 2009
1 89 1,166 117
tourism expenditure
2010 109 2,303 184
Number of outbound visits (m) 97.7 2011 149 2,906 240
Number of outbound visits, 2012 179 4,000 300
65.8
excl. Hong Kong and Macao (m) 2013 200 4,918 503
Hong 2014 185 4,486 497
Most visited destination overall
Kong
2015 270 3,929 586
Most visited destination overall
Thailand 2016 260 5,166 513
(excl. Hong Kong and Macao)
Most visited destination in 2017 337 5,988 694
France
Western Europe 2018 391 6,124 657
UK’s ranking by number of 9th in Share of UK total in
1% 2.3% 2.9%
outbound visits from China Europe 2018
Source: International Passenger Survey by ONS, Oxford Economics, UNWTO
12Market and Trade Profile China
1.1 Key statistics – volume and value
Inbound volume and value Nights per visit, spend
Measure 2018 Change Rank out of Averages by Nights Spend Spend
vs. 2017 UK top journey purpose per per per
markets in 2016-2018 visit night visit
Visits (000s) 391 +16% 22 Holiday 10 £152 £1,488
Nights (000s) 6124 +2% 13 Business 9 £205 £1,930
Visiting Friends/
Spend (£m) 657 -5% 10 18 £66 £1,189
Relatives
Average nights Study* 88 £71 £6,228
16 -12% 11
per visit
Average spend
1680 -18% 6 All visits 17 £108 £1,884
per visit (£)
Source: International Passenger Survey by ONS
*Sample size below 100 respondents. Student travellers include all types of formal and informal study who stay less than one year.
13Market and Trade Profile China
1.1 Key statistics: journey purpose
Journey purpose 2018 Journey purpose trend (visits 000s)
57%
250
Share of visits
224
40% 200
31% 150
22%
18% 100 70
11% 43
9% 50 35
5% 5%
1% 0 19
Holiday Business VFR Study Misc.
Holiday Business VFR Study Misc.
China All markets
57% of all visits to the UK from China were made for Holiday visits have led the volume growth in the Chinese
holiday purposes. This is above the all-market average, market since 2012, with a dip in 2016 followed by strong
40%. growth in 2017 and 2018.
It also means that there were more Chinese holiday The relative importance of business visits has dropped in the
visits than all other purposes added together. last 10 years due to the rise of holiday travellers, but the
The second most popular reason why people visited the number of business visits has remained relatively stable.
UK from China in 2018 was to visit friends and relatives There was also a new record for study visits set in 2018.
(VFR). This is a change since 2017, which was the only Visitors from China are much more likely to be visiting the UK
year since 2014 that there were more visits from China for study than the all-market average. In 2018, 41% of Chinese
to the UK for business than visiting friends or relatives. nights in the UK were spent on a study trip.
Source: International Passenger Survey by ONS, sample size for individual year and journey purpose may be below 100 respondents
14Market and Trade Profile China
1.1 Key statistics: seasonality
Seasonality 2018
Visits from China are very seasonal: in 2018 41% of all visits
41% from China were made in July-September.
Share of visits
27% 28% Visits during the summer started driving the growth in 2012,
24% 24%
21%
18%
around the same time as holiday visits started growing more
17%
than other journey purposes. Seasonal direct flights between
China and the UK also support this trend.
Chinese visitors are less likely to visit in Q2 (April-June) than
Jan-Mar Apr-Jun Jul-Sep Oct-Dec
the all-market average (18% vs 27% in 2018 respectively). The
Chinese New Year Golden Week and National Day Golden
China All markets
Week happen in the first and last quarter of the year, and might
be driving some more visits in those months.
Seasonality trend (visits 000s)
200
160
94
100
69
68
0
2005 2006 2007 2008 2009 2010 2011 2012 2013 2014 2015 2016 2017 2018
Jan - Mar Apr - Jun Jul - Sep Oct - Dec
Source: International Passenger Survey by ONS
15Market and Trade Profile China
1.1 Key statistics: length of stay and accommodation
Accommodation stayed in (average nights in Duration of stay trend (average annual visits in
2018, % share) 000s, rolling 3 years ending in year shown)
0.9% 0.3% 140
4% 2% 120
100
80
13% 60
34% 40
20
0
22%
Nil nights 1-3 nights 4-7 nights
8-14 nights 15+ nights
25% As a long haul destination, Chinese travellers tend to stay for a medium
or long trip, and are less likely to stay 1-3 nights.
Hotel/guest house
Hostel/university/school
Trips of 15+ nights are also quite popular, especially for VFR and study
Free guest with relatives or friends visits but also 14% of holiday trips.
Rented house/flat In 2018, the most popular accommodation type among the Chinese
Bed & Breakfast
visitors was hotels and guest houses, with 34% of all nights spent in the
Paying guest family or friends house
Other UK spent there.
Own home Hostel/university/school or a rented house/flat (25% and 13% of all
Source: International Passenger Survey by ONS nights respectively) may be boosted by the number of nights spent by
study visitors from China in Britain overall.
16Market and Trade Profile China
1.1 Key statistics: repeat visits and package tours
Proportion of overnight holiday Proportion of visits that are bought as
visitors to the UK that have visited part of a package or all-inclusive
the UK before* tour** (2016-2018 average)
63% 13% 13%
52%
49% 10%
9% 9%
7%
7%
30%
21% 4% 4%
2%
2% 2%
Hong Kong Japan South Korea China All markets Business Holiday VFR Study Misc. All journey
purposes
China All markets
China is still a growing market: in 2015, only 30% of holiday visits from Chinese residents (excluding British expats) to
the UK were made by repeat visitors, compared to 63% across all markets. On average a Chinese holidaymaker
came 1.6 times to the UK in the past 10 years.
Holiday visits are most likely to be bought as a package tour, similar to the pattern we see globally.
Source: International Passenger Survey by ONS. *2015, excluding British nationals; * 2015 data
**See definition of a package holiday in appendix
17Market and Trade Profile China
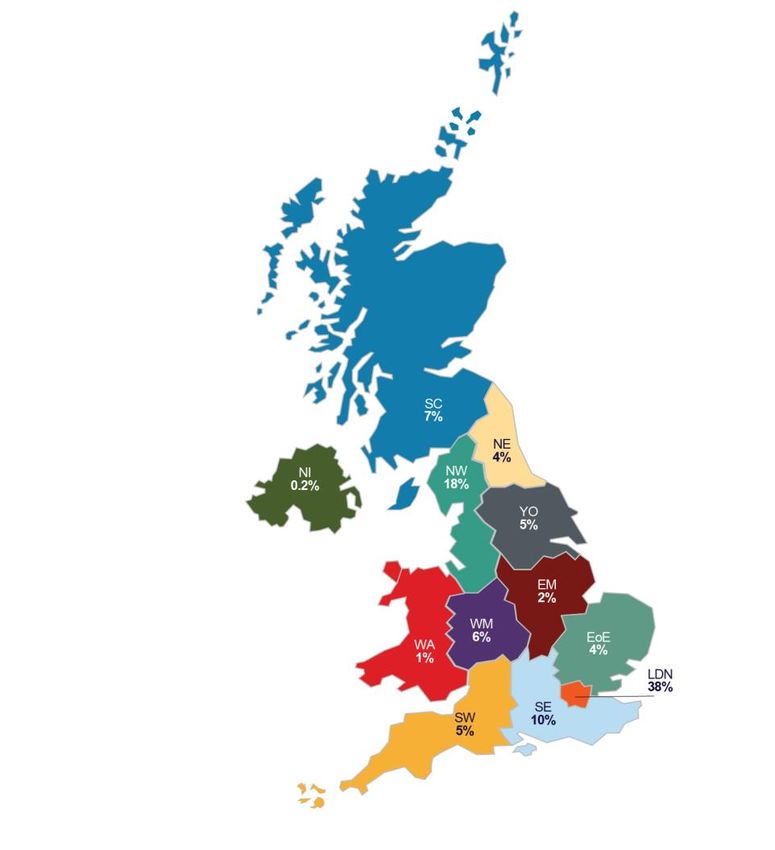
1.2 Getting around Britain: regional spread
Annual visits to the UK (2016-2018 average) Nights
Region Nights stayed Visits Spend (% share, 2016-2018)
(000) (000) (£m)
Total 5,760 330 621
Scotland (SC) 400 53 43
Wales (WA) 67 8 10
Northern Ireland (NI) 13 2 1
London (LDN) 2,206 221 310
North East (NE) 239 7 23
North West (NW) 1010 56 90
Yorkshire (YO) 298 26 32
West Midlands (WM) 345 24 25
East Midlands (EM) 108 13 10
East of England (EoE) 204 20 17
South West (SW) 286 24 20
South East (SE) 583 45 40
Nil nights (Nil) N/A 1Market and Trade Profile China
1.2 Getting around Britain: regional spread and top towns and cities
Top towns and cities visited (2016-2018 average) Chinese visitors show an above-average spread
across the UK‘s nations and regions. London is the
Town Overnight visits (000s) leading overnight destination whilst in Britain, but
Scotland, the North West and South East of England
London 221 are also popular.
Edinburgh 45 Indeed, 61% of all nights spent by Chinese visitors in
the UK in 2016-2018 were spent outside of London,
Manchester 41
compared to 58% for the all-inbound all market
Cambridge 15 average.
Oxford 15 Although, if we consider the regional spread by
purpose of visit, 61% of nights spent in the UK by
Chinese holidaymakers were spent in London in
Regional spread (2016-2018) 2016-2018. However, close to or over 6-in-10 nights
for each of the other visit purposes were spent in the
53%
rest of England.
Share of nights
47%
38% 41%
On average in 2016-2018, the proportion of nights
spent overall in Scotland by Chinese visitors was on
7% 8%
0.9%
par with the all-market average. That is also true
1% 2% 0.2%
when looking at holiday visits only, with 12% of
Scotland Wales London Rest Of Northern nights spent in Scotland for both in 2016-2018.
England Ireland
Visits from China have an above average propensity
China All markets
to feature rural and coastal areas of Britain.
Source: International Passenger Survey by ONS
19Market and Trade Profile China
1.2 Getting around Britain: visits to coast, countryside and villages
Propensity to visit coast, countryside and villages
18%
VFR: Went to the coast or beaches
13%
23%
VFR: Went to countryside or villages
17%
3%
Business: Went to the coast or beaches
2%
13%
Business: Went to countryside or villages
2%
15%
Holiday: Went to the coast or beaches
14%
26%
Holiday: Went to countryside or villages
18%
15%
All journey purposes: Went to the coast or beaches
10%
22%
All journey purposes: Went to countryside or villages
13%
China All markets
Source: International Passenger Survey by ONS 2016
20Market and Trade Profile China
1.2 Getting around Britain: use of internal modes of transport
Propensity to use internal modes of transport
0%
Car/vehicle you/group brought to the UK
1%
3%
Hired self-drive car/vehicle
5%
6%
Private coach/minibus (for group only)
2%
8%
Public bus/coach (outside town/city)
5%
15%
Uber
9%
31%
Taxi
27%
31%
Train (outside town/city)
23%
66%
Bus, Tube, Tram or Metro Train (within town/city)
48%
3%
Domestic flight
1%
China All markets
Source: International Passenger Survey by ONS, 2018
21Market and Trade Profile China
1.2 Getting around Britain: purchase of transport within Britain
Transport services purchased Chinese visitors are more likely than the
before or during trip (%) average to take taxis or to take public transport
when staying in a town or a city, with 31% and
54% 66% respectively doing so, compared to 27%
52%
48%
and 48% respectively for the all-market
47%
44% average.
42%
38% When getting out of a town or city, they are also
36% 36% 35% more likely to get on a train (31%), but also to
31% 29%
29% 30% take a public bus or coach (8%), or even a
26% 27%
24% 25% 27% private bus or coach for a group (6%). However,
they are less likely to drive a car within the UK,
15% compared to other markets.
Usually they also tend to prefer booking those
transport elements before they travel, with more
Chinese holiday visitors booking their airport
Pre During Pre During Pre During Pre During Pre During transfer, train or coach travel, and rental cars
Transport within Train travel Airport transfer Coach travel Car hire before the trip than during.
London
China All markets
Source: International Passenger Survey by ONS, VisitBritain/IPSOS 2016, base: visitors
22Market and Trade Profile China
1.3 Visitor demographics
Visitor characteristics
Chinese visitors tend to be younger compared to other
inbound markets. Only 9% of Chinese visitors are aged 55+,
compared to the all-market average of 20%.
In the last three years, though, about 1-in-2 visits from China 15%
of all 2018 visits from China to
to the UK were made by people aged 25-44.
the UK were made by 16-24
The overall gender ratio of visitors is relatively evenly year olds
balanced. However, when looking at trips by journey
purpose, there are more women than men coming to visit
friends and relatives, to study or take a holiday.
Most inbound visits to the UK from Chinese residents were
made by Chinese nationals (87% of all 2018 visits), but 31%
of VFR visits were made by British nationals in 2018.
Source: International Passenger Survey by ONS
23Market and Trade Profile China
1.3 Visitor demographics: gender and age groups
Gender ratio of visits (2016-2018) Age group trend (average visits in 000s for
rolling 3 years ending in each year shown)
China 51% 49% 2018 12 54 99 70 59 21 8 4
2017 11 47 83 69 53 18 7 0
All markets 56% 44% 2016 12 43 66 54 43 15 5 0
Male Female 2015 13 35 57 53 43 14 4 0
2014 12 33 49 45 35 10 3 0
2013 12 31 46 41 33 8 3 0
Gender ratio of visits from China by
journey purpose* (2016-2018) 2012 10 28 37 34 27 62 0
2011 7 21 30 26 24 5 2 0
Misc. 53% 47% 2010 4 17 28 24 22 6 2 0
Study 46% 54% 2009 4 17 33 29 23 6 2 0
VFR 49% 51% 2008 5 15 34 33 25 6 2 0
Holiday 47% 53% 2007 6 13 32 33 23 7 2 0
Business 2006 6 9 26 29 19 7 3 0
70% 30%
0 -15 16-24 25-34 35-44 45-54 55-64 65+ Not Known
Source: International Passenger Survey by ONS
* Low sample size for Misc. visits (sample =82), and for Study visits (sample = 18), please consider this data with caution
24Market and Trade Profile China
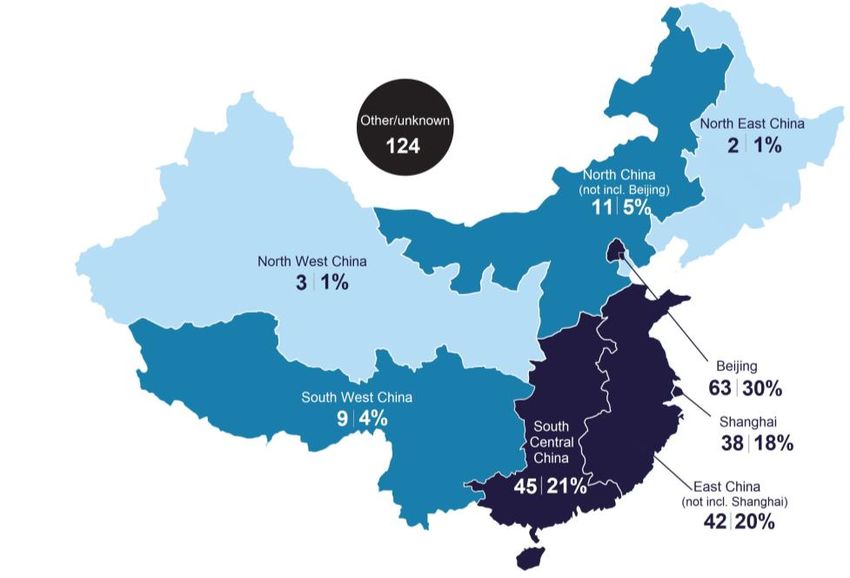
1.3 Visitor demographics: origin
Visits to the UK (in 000) 2017
• Around half of Chinese visitors live in the two major metropolitan areas: Beijing and Shanghai (30% and 18%
respectively of visits to the UK made in 2017, amongst Chinese visitors who stated where they live).
• Other main cities are also represented, some in growing proportions: 11% of 2017 visitors to the UK from China lived in
Guangzhou-Shenzhen-Dongguan, while only 8% of the 2013 visits lived there, for example.
• Other cities and areas that have grown as a proportion of inbound Chinese visitors to the UK include South Central
China (with the Guangzhou-Shenzhen-Dongguan agglomeration, but also with Wuhan (7% in 2017, but 1% only in
2013)) and East China outside of Shanghai, which used to represent only 4% of visits in 2013. Meanwhile, Beijing’s
share of visits fell from 46% in 2013 to 30% in 2017.
Visits in 000s | % share of visits
High
Medium
Low
Source: International Passenger Survey by ONS
25Market and Trade Profile China
1.4 Britain and competitors
Market size, share and growth potential
The UK was the 9th most visited country in Europe by Chinese
residents in 2018 for overnight stays. Forecasts suggest that there
is the potential for steady growth in the number of visits to the UK
during the next decade.
Of those who came to the UK for a holiday, 44% considered
Britain
France, 31% Germany, and 27% Italy as an alternative holiday
destination.
ranks 9th
within Europe for
France is the most visited destination by Chinese travellers in Chinese outbound
Europe, but the USA was the most visited destination outside of destinations by volume
Asia in 2018. Visits to France from China have fallen slightly in the
last few years, but are set to increase again from 2018.
Overall, Chinese travellers are venturing to a wider range of
destinations than before. Within the UK’s competitor set, ‘traditional’
European destinations have lost market share compared to other
European (Switzerland, The Netherlands) and American
destinations (USA, Canada) in the last 10 years, while Australia
and New Zealand have roughly maintained their shares.
Source: Oxford Economics, VisitBritain/IPSOS 2016
26Market and Trade Profile China
1.4 Britain and competitors
UK’s market share of Chinese visits Historic and potential overnight
among competitor set visits to UK (000s)
800
United States 26%
17% 700 714
France 18%
27%
600
Germany 14%
15%
12% 500
Australia
13%
Switzerland 9% 400
5%
Canada 6% 300
6%
Netherlands 5%
5% 200
New Zealand 4%
4% 100
United Kingdom 3%
4%
3%
0
Italy 1997
1998
1999
2000
2001
2002
2003
2004
2005
2006
2007
2008
2009
2010
2011
2012
2013
2014
2015
2016
2017
2018
2019
2020
2021
2022
2023
2024
2025
2026
2027
2028
6%
2018 2008
Source: Oxford Economics
27Market and Trade Profile China
1.4 The UK and its competitors
Propensity for Chinese travellers to visit the UK as part of a multi-country trip
% visits which included at least a night in another country…
All markets 4% 4% 5%
China 7% 11% 6%
Before visiting the UK only After visiting the UK only Before and after visiting the UK
Source: International Passenger Survey by ONS, 2016
28Market and Trade Profile China
Chapter 2:
Experiences and
perceptions
29Market and Trade Profile China
2.1 Inbound activities
Going shopping is the number one activity Top 10 activities for Chinese visitors
which most Chinese visits will feature,
during their visit to the UK
followed by dining in restaurants, visiting 1. Going shopping
parks or gardens, museums or galleries, and
castles or historic houses. However, it is worth 2. Dining in restaurants
noting that consumer trends suggest that
Chinese travellers are becoming less 3. Visiting parks or gardens
interested in shopping over time, compared to
spending on experiences. 4. Visiting museums or art galleries
Built heritage sites are important attractions 5. Visiting castles or historic houses
for many visitors from China, as well getting
more knowledge. About a third of all visits to 6. Going on a guided tour
the UK including following a guided tour;
however, the number is higher for holiday 7. Visiting religious buildings
visitors at 4 in 10.
Chinese visitors also like to enjoy the green 8. Sightseeing famous monuments/ buildings
scenery: they are 6% more likely to visit a
9. Socialising with locals
national park than the all-market average.
The Chinese also have a special interest in 10.Going to the pub
British football teams.
For more information on activities, please consult the
Source: International Passenger Survey by ONS, rankings based on 2008-2017 data
VisitBritain activities page.
30Market and Trade Profile China
2.1 Inbound activities
Propensity to go shopping Propensity to purchase selected items
73% 41%
Holiday: went Clothes or shoes 54%
shopping 10%
69% Personal accessories e.g. jewellery 19%
9%
Bags, purses etc
72% 26%
All journey purposes:
went shopping 12%
54% Cosmetics or toiletries e.g. perfume 19%
13%
Books or stationery 21%
China All markets 9%
Games, toys or gifts for children 11%
24%
Food or drink 28%
Propensity to go to a spa or beauty 5%
CDs, DVDs, computer games etc
centre 6%
3%
Electrical or electronic items e.g. camera 6%
5% 3%
Holiday: went to a Items for your home e.g. furnishing
spa or beauty centre 3%
3% 16%
Other holiday souvenir 18%
All journey purposes: 5% 38%
went to a spa or None of these 24%
beauty centre 2%
China All markets
All markets China
Source: International Passenger Survey by ONS, 2017 Source: International Passenger Survey by ONS, 2013
31Market and Trade Profile China
2.1 Inbound activities
Propensity to go to a pub, and socialise Propensity to go dining in restaurants, or to go to
with the locals bars or night clubs
Holiday: socialising with the 23% 8%
Holiday: went to bars or night
locals 32% clubs 15%
17% 58%
Holiday: went to pub Holiday: dining in restaurants
48% 70%
Business: socialising with the 18% Business: went to bars or night 5%
locals 15% clubs 6%
14% 69%
Business: went to pub Business: dining in restaurants
24% 49%
26% All journey purposes: went to 10%
All journey purposes: socialising
with the locals 32%
bars or night clubs 12%
23% All journey purposes: dining in 65%
All journey purposes: went to
pub restaurants 61%
42%
China All markets
China "All markets"
Source: International Passenger Survey by ONS, 2008 (dining in restaurants), 2017 (other activities)
32Market and Trade Profile China
2.1 Inbound activities
Propensity to visit museums and art Propensity to visit built heritage sites
galleries or go on a guided tour
24%
VFR: visited religious buildings
18%
Holiday: went on a 40%
39%
guided tour VFR: visited castles/historic houses
29% 23%
41%
Holiday: visited religious buildings
Holiday: visited 56% 35%
museums and art 55%
galleries 48% Holiday: visited castles/historic houses
48%
7%
Business: visited religious buildings
All journey 31% 4%
purposes: went on
Business: visited castle/historic 18%
a guided tour 15% houses 6%
All journey All journey purposes: visited religious 29%
purposes: visited 44% buildings 20%
museums and art All journey purposes: visited 43%
28%
galleries castles/historic houses 28%
China All markets
China All markets
Source: International Passenger Survey by ONS, 2017 (‘went on a guided tour’), and 2016 (other activities)
33Market and Trade Profile China
2.1 Inbound activities
Propensity to visit literary, music, Propensity to visit a park/garden or a
TV or film locations national park
Holiday: visited literary, 6% 18%
music, TV, or film Holiday: visited a
locations 9% National Park
11%
All journey purposes: 7% 54%
visited literary, music, Holiday: visited
TV, or film locations 5% parks or gardens
50%
China All markets
All journey 13%
purposes: visited a
Propensity to take part in National Park 7%
sports activities
All journey 44%
Holiday: took part in 3% purposes: visited
sports activities 3%
parks or gardens 32%
All journey purposes: 2%
took part in sports
activities 2%
China All markets China All markets
Source: International Passenger Survey by ONS, 2017 (top chart), 2011 (bottom chart) Source: International Passenger Survey by ONS, 2016
34Market and Trade Profile China
2.1 Inbound activities
Propensity to attend the performing arts Number who went to watch football live
during trip (000s)
Holiday: went to the 15%
theatre/musical/opera/ballet 14% 2.2
4%
Holiday: attended a festival
4% 1.8
1.7
5%
Holiday: attended a live music event
10%
All journey purposes: went to the 12%
theatre/musical/opera/ballet 9%
5%
All journey purposes: attended a festival
3%
All journey purposes: attended a live 7%
music event 7%
China All markets VFR Business Holiday
Source: International Passenger Survey by ONS, 2017,(live music), 2016 (other performing arts), and 2013 (watching live football)
35Market and Trade Profile China
2.2 Welcome and recommending Britain
Feeling of ‘welcome’ in Britain Likelihood to recommend Britain
80% 82%
73%
69%
26%
18% 23%
15%
2% 2% 3% 4%
0% 0% 0% 0% 1% 1% 0.2% 0.4%
Very Welcome Neither Unwelcome Very Extremely Likely Neutral Not likely Not likely at all
Welcome Unwelcome likely
China All market average China All markets
Chinese holiday visitors are slightly less likely than the average all-market visitor to feel ‘very’ welcome in Britain, but
none felt unwelcome either.
They would also be slightly more ‘extremely’ likely to recommend Britain for a holiday or a short break to people around
them once back at home, than the average across all markets.
Source: CAA 2016 Source: International Passenger Survey by ONS, 2015
36Market and Trade Profile China
2.3 Perceptions of Britain
The Chinese rate Britain highly overall: they ranked the UK nation
brand second overall among 50 nations in 2018, as well as second
for tourism, its culture, and its people. Chinese people also ranked
Britain 3rd for its cultural and built heritage, its contemporary culture, Main reason why Chinese
its vibrant city life, and country they would like to visit if money were people visited Britain:
no object. However, their perceptions of the British scenic natural Cultural attractions,
beauty is weaker: they ranked Britain 15th out of 50 nations on this local food/drinks,
attribute. natural beauty
Chinese travellers would be most likely to expect a trip to Britain to
be ‘educational’ and ‘fascinating’.
They are interested in famous cultural symbols: the Royal Family,
Shakespeare, Sherlock Holmes, Harry Potter and Downton Abbey.
Australia and France are the destinations that the Chinese consider
the ‘best place’ for delivering many of the aspects they want from a
holiday destination. Areas of strength for Britain include the ease of
getting around the country as well as its historic sites.
Cultural attractions are the top motivation for Chinese visitors to
come to Britain.
Source: Anholt Nation Brands Index 2018 (powered by Ipsos), VisitBritain/Olive Insight 2015, Arkenford 2013
37Market and Trade Profile China
2.3 Perceptions of Britain
Britain’s ranking (out of 50 nations)
Measure Chinese All
respondents respondents
Overall Nation Brand 2 3
Culture (overall) 2 4
The country has a rich cultural heritage 3 7
The country is an interesting and exciting place for contemporary culture such as
3 4
music, films, art and literature
The country excels at sports 5 5
People (overall) 2 6
If I visited the country, the people would make me feel welcome 5 15
Tourism (overall) 2 4
Would like to visit the country if money was no object 3 5
The country is rich in natural beauty 15 24
The country is rich in historic buildings and monuments 3 5
The country has a vibrant city life and urban attractions 3 4
Source: Anholt Nation Brands Index 2018 (powered by Ipsos)
38Market and Trade Profile China
2.3 Perceptions of Britain
Cultural associations Adjectives describing a potential trip to
Britain
Museums 40% 28%
47% Educational
35%
Music 26% 25%
39% Fascinating
31%
Films 30% 21%
39% Exciting
31%
Sports 29% 21%
37% Romantic
17%
Modern Design 27% 22%
30% Relaxing
17%
Pop videos 20% 20%
29% Spiritual
8%
Opera 25% 7%
25% Boring
7%
Sculpture 19% 11%
Stressful
25% 7%
Street Carnival 16% Risky 6%
15% 6%
14% Depressing 4%
Circus
13% 5%
China All markets China All markets
Source: Anholt Nation Brands Index 2018 (powered by Ipsos)
39Market and Trade Profile China
2.3 Perceptions of Britain
Holiday wants and % saying destination is best place for…
Importance Attribute (20 most important) UK France Italy Australia US Germany
6.44 Enjoy the beauty of the landscape 25% 48% 47% 64% 35% 23%
6.42 Feel connected to nature 15% 26% 22% 66% 34% 20%
6.40 Have fun and laughter 15% 35% 15% 70% 23% 18%
6.38 Chill/ slow down to a different pace of life 26% 50% 33% 62% 30% 16%
6.38 Be physically healthier 30% 44% 35% 66% 40% 27%
6.35 See world famous sites and places 46% 62% 58% 49% 46% 29%
6.32 Soak up the atmosphere 23% 44% 35% 55% 23% 26%
6.24 It offers unique holiday experiences 39% 56% 50% 63% 43% 34%
6.23 Enjoy peace & quiet 28% 40% 28% 66% 24% 24%
6.23 Offers good value for money 36% 52% 43% 60% 42% 32%
6.21 Experience activities/places with a wow factor 33% 47% 35% 54% 46% 21%
6.19 Experience things that are new to me 29% 55% 45% 59% 37% 24%
6.17 Enjoy local specialities (food and drink) 29% 70% 69% 39% 28% 28%
6.15 Get some sun 31% 48% 37% 73% 34% 20%
6.14 Visit a place with a lot of history/historic sites 48% 73% 64% 22% 21% 28%
Enjoy high quality food and drink (gourmet
6.14 23% 67% 61% 24% 38% 19%
food)
6.14 Provides a wide range of holiday experiences 37% 54% 45% 59% 52% 31%
6.09 The people are friendly and welcoming 33% 49% 42% 54% 40% 32%
6.08 Do what I want when I want spontaneously 28% 26% 17% 27% 15% 11%
6.08 Broaden my mind/ Stimulate my thinking 32% 61% 40% 48% 51% 33%
Source: VisitBritain/Arkenford 2013
40Market and Trade Profile China
2.3 Perceptions of Britain
Holiday wants and % saying destination is best place for…
Importance Attribute (20 least important) UK France Italy Australia US Germany
6.07 Do something the children would really enjoy 37% 45% 36% 63% 54% 30%
6.07 Have dedicated time with my other half 35% 54% 37% 60% 38% 30%
6.00 Easy to get around by public transport 54% 56% 43% 48% 63% 51%
5.96 Explore the place 15% 50% 37% 49% 48% 23%
5.88 Good shopping 38% 66% 48% 41% 64% 24%
5.87 Feel special or spoilt 31% 56% 37% 53% 37% 19%
5.82 Do something environmentally sustainable 40% 53% 66% 44% 33% 40%
5.80 A good place to visit at any time of year 26% 45% 40% 60% 41% 24%
5.79 Revisit places of nostalgic importance to me 21% 37% 39% 12% 24% 14%
5.66 Get off the beaten track 21% 57% 39% 36% 34% 46%
5.63 Meet and have fun with other tourists 30% 72% 42% 59% 45% 31%
5.56 Fashionable destination 37% 66% 49% 49% 49% 25%
5.47 Meet the locals 43% 45% 32% 51% 33% 22%
5.46 Visit places important to my family's history 30% 43% 25% 34% 31% 13%
Do something useful like volunteering to help
5.42 34% 28% 29% 57% 38% 27%
on a project
5.41 Experience adrenalin filled adventures 46% 37% 36% 36% 28% 29%
5.36 Party 39% 57% 36% 34% 49% 28%
Go somewhere that provided lots of laid on
5.35 45% 53% 47% 38% 66% 30%
entertainment/nightlife
5.29 Watch a sporting event 42% 33% 58% 40% 44% 40%
5.18 To participate in an active pastime or sport 26% 54% 51% 35% 31% 28%
Source: VisitBritain/Arkenford 2013
41Market and Trade Profile China
2.3 Perceptions of Britain
Motivations for choosing Britain as a holiday destination
Cultural attractions 41%
42%
Wide variety of places to visit 21%
25%
Wanted to go somewhere new 17%
23%
Vibrant cities 20%
22%
Countryside/natural beauty 34%
22%
Easy to get around 15%
22%
Somewhere English-spoken 11%
22%
Visiting friends or relatives 9%
22%
Ease of getting to the country 16%
21%
A culture different from own 25%
19%
A mix of old and new 9%
19%
Contemporary culture 24%
18%
Try local food and drink 37%
18%
A good deal 25%
18%
Security / safety 22%
17%
Accommodation (variety & quality) 22%
16%
Easy to get plan/organise 8%
16%
Meeting locals 7%
13%
Wide range of holiday activities 10%
13%
The climate / weather 18%
12%
Cost of staying in the destination 17%
12%
Watching sport 14%
10%
Visit a film/TV location 8%
9%
Easy to visit with children 7%
8%
Source: VisitBritain/IPSOS 2016, base: visitors (Market scores have been adjusted so that the sum of all influences for each market is equivalent to the global total, to enable meaningful comparisons)
China All markets
42Market and Trade Profile China
2.3 Perceptions of Britain
Sought-after Britain activities
A food tour of one of London's best foodie markets 50%
52%
Take a canal boat tour through the waterways of England 49%
53%
Ride the scenic ‘Hogwarts Express' (Harry Potter train) through the Scottish Highlands 49%
47%
Relax in Bath spa's rooftop pool 47%
36%
Stay the night in a fairy-tale castle 46%
47%
A wine tour in the vineyards of England 46%
36%
Enjoy a traditional afternoon tea 45%
50%
Drive through the countryside of England 44%
53%
Shop for quirky gifts in a seaside town 44%
41%
Climb one of Britain's highest mountains for epic views 42%
31%
Hunt for The Loch Ness Monster with a boat cruise on Loch Ness 41%
32%
Go hiking on the South West coast 41%
41%
Take a street art tour in one of Britain's modern cities 41%
40%
Go punting (pole boating) on the rivers of Oxford or Cambridge 40%
30%
Walk along Hadrian's wall in Northern England 39%
38%
Visit Madame Tussauds 38%
42%
Share stories over a pint with locals in a cosy rural pub 37%
38%
Visit Windsor Castle where Harry and Meghan got married 37%
40%
Explore Britain's history using a historic cities app to uncover the stories 36%
38%
Spot wildlife in the Scottish Highlands 35%
42%
China All markets
Source: Anholt Nation Brands Index, powered by Ipsos 2018; Rankings based on market-level scores that have been adjusted so that the sum of all activities for each market is equivalent to the all-market total,
to enable meaningful comparisons, including across markets. Top 20 activities shown; for full list please see report at understanding international visitors page
43Market and Trade Profile China
Chapter 3:
Understanding
the market
44Market and Trade Profile China
3.1 Structural drivers
The Chinese economy is still growing rapidly. In 2018, the number of
High Net Worth Individuals (HNWIs, those with investable assets worth
more than US$1million) was 1.19m.
With a population of around 1.4 billion, China is still the most populated
country in the world. However, with an ageing population, it is set to be
overtaken by India by 2030, and the population will start to decline.
1.4bn
The rapid increase of Chinese urban income is expected to drive overall Chinese
income growth. Spending is broadening beyond consumer staples: population
Chinese people now spend around 9.2% of their personal spending on
“Fun”, which includes travelling (vs. 17.3% in the US).
In 2018, it was estimated that 8% of the Chinese population had a
passport. By 2025, this number is expected to reach 12%.
Standard Chinese or Mandarin is the nationwide official language.
Some regions may use others though, such as Cantonese (or Yue)
which is Guangdong’s official language. China is the 4th largest country
in the world: cultures in the different regions and cities vary, as do
languages.
Source: Oxford Economics, UN 2019 World Population Prospects, Capgemni World Wealth Report 2019, Goldman Sachs‘ 2015 Chinese consumer
profile & 2015 ‘The Chinese Tourism Boom‘ report, CIA World Factbook 2018
45Market and Trade Profile China
3.1 Structural drivers: general market overview
General market conditions
China is the most populated country in the world with 1.4 billion The EU is China’s largest trading partner, and so
people. It is also the second largest economy in the world, after European destinations benefit from a good exposure in
the USA (in real GDP). The growing white collar ‘Urban Middle’ the market. Tourism is a key part of their bilateral
class* (compared to the blue-collar ‘Urban Mass’) is taking more relationship. In 2018, this was reinforced with the EU-
trips abroad: travelling is high on the wish list of this segment. China Tourism Year which enhanced travel promotion
Ctrip CEO, Jane Sun, predicted at the 2018 Word Economic between the two via simpler visa procedures, increased
Forum in Davos that the number of Chinese passport holders air connectivity and specific tourism offer for Chinese
could double to reach 240 million by 2020. travellers to Europe.
Today, 153 destinations hold the ‘Approved Destination Status’ As travel becomes more and more popular in China,
(ADS), which the UK received in 2005, making it possible for more initiatives and regulations have been launched,
Chinese nationals to travel more easily. such as those yearly partnership with a popular
destination. The Chinese currency is the yuan, CNY or
Key demographic and economic data RMB. Recently, the Chinese government limited how
much Chinese people can withdraw abroad (capped at
Measure (2018) China RMB100,000 per year), or change to a foreign currency
(capped at USD50,000 per year).
Population (m) 1,428
There are 10 Chinese public holidays per year,
GDP per capita PPP (US$) 16,817 including three days for the Spring Festival (in January
Annual average GDP growth over past decade (%) 7.9 or February) and three days for the National day (in
October). It is customary to work through weekends
Annual GDP growth in 2018 (%) 6.6
around these three day holidays and attach days in lieu
Source: Oxford Economics, Goldman Sachs‘ 2015 Chinese consumer profile, Jing Travel, UNWTO/GTERC Asia to form ‘Golden Weeks’.
Tourism Trends 2018 Edition, Office Holidays *Note: McKinsey defines upper middle class as annual disposable
income from 106,000RMB to 229,000RMB, mass middle class as annual disposable income from 60,000RMB to
106,000RMB
46Market and Trade Profile China
3.1 Structural drivers: demographic and social indicators
Population dynamics
The Chinese population is set to increase slightly until
Measure 2018 estimate 2030 when it is forecast to start decreasing. The fertility
rate in China is indeed under the threshold for
population renewal, as a consequence of the one-child
Overall growth rate vs. 2017 +0.5% policy, which was changed in October 2015 for a two-
child policy. The Chinese population is also showing
Urban population 59.2% signs of ageing, with a median age above the global
average since 2015.
Urbanisation rate (2015-2020) 2.4% per annum Capgemini’s World Wealth Report suggests that in
2015 Chinese HNWIs (High Net Worth Individuals)
surpassed 1 million people for the first time, and
Indicator 1980 2015 2030 2050 continued growing to 1.189 million HNWIs by 2018.
Along with Japan, China leads the wealth growth in
Asia Pacific. In terms of HNWI volume, it ranks in 4th
Fertility rate (live births per woman, 3.00 1.60 1.69 1.75 place behind the US, Japan and Germany.
over 5 years ending in year shown)
Urban population rate is still quite low (59% in 2018).
Median age (in years) 21.7 37.0 43.2 49.6 However, it is still increasing. According to the
Academy of Social Sciences of China, the middle
class* accounts for about 19% of the Chinese people.
Source: Oxford Economics, UN revised 2019 World Population Prospects
CIA World Factbook 2018, Capgemni World Wealth Report 2019, Santander’s ‘China: reaching the consumers’ profile
*Note: McKinsey defines upper middle class as annual disposable income from 106,000RMB to 229,000RMB, mass middle class as annual disposable income from 60,000RMB to 106,000RMB
47Market and Trade Profile China
3.1 Structural drivers: economic indicators
Economic indicators The Chinese economy has dramatically changed
(% growth unless stated) over recent decades and the economy of the world’s
most populated country keeps growing.
Indicator 2017 2018 2019 2020 In recent years economic growth has slowed down
from previous highs. This slowdown is monitored
and paced to achieve a more sustainable growth,
Real GDP 6.8 6.6 6.1 5.7 driven by domestic consumption and promotion of
the service industry (as opposed to manufacturing,
Consumer spending 6.7 7.2 6.8 6.5 exports and investment).
The UK ranks second for both imports and exports
Unemployment rate 3.9 3.8 3.6 3.6 of merchandise from and to China among European
countries in 2017 respectively.
McKinsey predicts that Beijing and Shanghai are set to have among the largest rates of consumption growth between
2015 and 2030. Chongqing, Guangzhou and Shenzhen are on McKinsey’s top cities list in terms of household
consumption of services in China. Tianjin, which also offers direct, stopping flights to the UK, is also quoted as a key
city for urban consumption growth.
The development of communication technologies also benefit to the economic growth of some cities, such as
Shenzhen, nicknamed the Chinese silicon valley.
In the first half of 2019, six Chinese cities exceeded a GDP exceeding 1 trillion yuan – Shanghai, Beijing, Shenzhen,
Guangzhou, Chongqing and Tianjin.
Source: Oxford Economics, UNWTO/GTERC Asia Tourism Trends 2018 Edition, McKinsey ‘Urban World: Global Consumers to watch’ April 2016 report, China.org.cn, ChinaDaily.com
48Market and Trade Profile China
3.1 Structural drivers: exchange rate trends
Exchange rate trends (cost of GBP in CNY/RMB)
18
16
14
12
10
9.00
8
6
2001 2002 2003 2004 2005 2006 2007 2008 2009 2010 2011 2012 2013 2014 2015 2016 2017 2018
Please find the most up-to-date exchange rate trend based on monthly averages at visitbritain.org/visitor-economy-facts.
Source. Bank of England
49Market and Trade Profile China
3.2 Consumer trends
More and more Chinese people have access to travel thanks to
economic growth and the rise of Chinese purchasing power,
especially in the main cities. Today, the Chinese State Council
estimate there are 120 million passport holders in China, and
85%
of Chinese luxury
some think that this might double by 2020. travellers would say that
As Chinese travellers are getting more like their Western ‘authentic
counterparts, new trends emerge. With new visa-free experiences/activities’
destinations or easier application processes, the FIT segment is are an essential
element of their luxury
growing (only 20% of the outbound market is composed of
trips
package tourists). Family travel, experiences and winter sports
are also gaining momentum.
Tour groups and organised trips are still dominant though:
residents of lower tier cities are newer to travelling abroad, and
still need more guidance. But mobile/digital capabilities has
significantly impacted travel behaviours, including a shorter
planning phase and greater tendencies to make bookings on the
spot or during the journey.
Source: Goldman Sachs‘ 2015 Chinese consumer profile, UNWTO/GTERC Asia Tourism Trends 2018 Edition, Euromonitor‘s ‘Cracking the Chinese Consumer Code‘ 2018, Resonance
Consultancy/ China Luxury Advisors ‘The Future of Chinese International Travel‘ 2018, VB/Kantar Millward Brown 2017 research, China-Outbound 2017. Chinese Gov website
50Market and Trade Profile China
3.2 Consumer trends: overall travel trends
Motivation and attitudes to holidays
China’s outbound market is booming. There should be about 100 Tier-3 and tier-4 cities are gaining greater access to
million overnight visits from China overseas in 2018, making it the overseas travel: 66 new airports were under construction or
third largest market in volume of international arrivals after the US planned for across China in 2018. The government plays a
and Germany. It is forecast to overtake Germany in the next 5 key role in the development of the Chinese outbound
years. market, supporting the development of new infrastructure,
The rising urban middle class in China is primarily responsible for granting destinations access to the ADS (‘Approved
the growth of the outbound travel market. In 2013, about 11% of Destination Status’) scheme, or launching tourism initiatives,
China’s population could be considered as part of the middle such as the bilateral tourism years.
class. With 9% of Chinese personal spending going on 2018 was the EU-China tourism year. This helped draw both
recreational activities, spending on ‘fun’ activities, which includes markets closer in terms of tourism and investment, with
travel, is much lower than in other countries. However, the young European countries, including the UK, Italy and France,
urban mass affluent segment, which is set to grow in the coming lowering the threshold for the approval of certain visas and
years, are spending more on these activities, creating a sizeable simplifying the visa issuing procedure to attract more
growth opportunity for the Chinese outbound market. Overall, Chinese tourists. The Belt and Road initiative has also
Chinese millennials are more likely than previous generations to benefitted some lesser know destinations in Europe,
spend rather than save. highlighting them to Chinese travellers.
Millennials and Gen Z Chinese, often only children of increasingly As those in the top tier cities are becoming more mature
affluent tier-1 cities’ residents, are usually educated and often travellers, they are looking for more unique experiences and
have a higher disposable income than their parents had. They destinations. They also become more and more
might still live with their parents, and thus would have more to independent in the planning of their trip, thanks to the
spend on travel. information available on their smartphones.
Source: Oxford Econmics, Goldman Sachs‘ 2015 Chinese consumer profile, UNWTO/GTERC Asia Tourism Trends 2018 Edition,
Resonance Consultancy/ China Luxury Advisors ‘The Future of Chinese International Travel‘ 2018, Resonance 2018
51Market and Trade Profile China
3.2 Consumer trends: rise of the FIT travellers
Millennials and Gen Z are leading growth
In China, VisitBritain focuses on two
Millennials and Gen Z travellers are highly represented in China. The country’s audience segments among the
birth rates were higher in 1985-1995, and it boasts the second largest Gen Z international travellers. Buzzseekers are
group in the world. Both groups live in top-tier Chinese cities and tend to be most likely to be aged 25-34, and so their
experienced travellers as they have more disposable income than previous attitudes and behaviours reflect the
generations, some having even studied abroad. Chinese Gen Z’s households Millennial market:
have a higher average income than their Indian counterparts. They spend more
on entertainment and travel than other age groups in China. 70% of bookings on
Chinese travel giant Ctrip are made via mobile, which may be linked to this Buzzseekers in China:
audience’s influence. affluent and seasoned
travellers; opinion leaders of
Technology solutions to which their parents did not have access to enable those
their friends and social
travellers to fulfil their desire for more control and ownership of their trips. Thus,
contacts, who prefer premium
they can be more adventurous whilst reassured, having all information just in a
experiences and adventures.
few clicks.
Across China, 28% of all international travellers will still prefer to ‘purchase a pre-
planned tour to handle all accommodation and tour guides’. However, millennials
would mostly pick ‘purchase a package, but travel on my own without a guide’,
‘purchase my travel arrangements on my own, but hire a tour guide or driver’, or
‘completely on my own with no package tour or tour guide’
Mobile technologies also allow millennials to be more confident travelling on their
own, or picking more adventurous, unique destinations and experiences.
Source: Euromonitor‘s ‘Cracking the Chinese Consumer Code‘ 2018, Resonance Consultancy/ China Luxury Advisors ‘The Future of Chinese International Travel‘ 2018,
ChinaTravelNews.com, Kubi Kalloo, 2017
52Market and Trade Profile China
3.2 Consumer trends: luxury travel trends
Travel trends among the more affluent travellers Top 10 experiences in a luxury holiday
China is the most valuable outbound market in the world: Chinese
travellers spent a total US$277.3 billion abroad in 2018. When in the 69%
Scenic rides
UK, they spend over 3 times the all-market average per visit. 65%
The luxury travel segment is key in this market, with Mass Affluent 64%
Iconic cultural experiences
49%
and HNWI* people being an important group among Chinese
Experiences that match their 62%
travellers. Chinese luxury travellers tend to be younger than the passions 58%
global profile, and so their trends are similar to trends of millennials
50%
travellers, such as the importance of experiences. Shopping
47%
50% or more of Chinese luxury travellers would define a ‘luxury trip’ 49%
Cruises
by a trip including ‘premium/exclusive food and drinks experiences’, 41%
‘VIP treatment/excellent service from all touch points’, and Wellness experiences
47%
‘accommodation in a location that will astonish’. It is followed by 36%
‘unique and exclusive experiences’ and ‘time to enjoy and lose Guided tours
35%
29%
oneself in the place visited’.
Cooking classes or other 34%
Shopping is no longer the prime motivation to travel, but most would food-related experiences 35%
still be likely to search for a bargain at a luxury outlet village. 24%
Self driving tours, road trips
Chinese luxury travellers associate Britain with classic and royal 29%
attributes, so they would enjoy visiting royal buildings in a unique way, Adventure trips
22%
36%
or staying at historic houses or stately homes. British university cities
(Oxford, Cambridge) also hold a luxury appeal for them. All Chinese luxury travellers
18-34 Chinese luxury travellers
Source: UNWTO, International Passenger Survey by ONS, VB/Kantar Millward Brown 2017 research
* See definitions in appendix
53You can also read