Impact of Transitways on Travel on Parallel and Adjacent Roads and Park-and-ride Facilities - Transitway Impacts Research Program
←
→
Page content transcription
If your browser does not render page correctly, please read the page content below
Transitway Impacts Research Program
 Report #20 in the series

 Impact of Transitways on Travel on
 Parallel and Adjacent Roads and
 Park-and-ride Facilities
 Alex Webb, Tao Tao, Alireza Khani,
 Jason Cao, Xinyi Wu
 January 2021

 CTS Report 21-03
 MnDOT Report 2021-03
To request this document in an alternative format, such as braille or large print, call 651-366-4718 or 1-
800-657-3774 (Greater Minnesota) or email your request to ADArequest.dot@state.mn.us. Please
request at least one week in advance.
Technical Report Documentation Page
1. Report No. 2. 3. Recipients Accession No.
MN 2021-03
4. Title and Subtitle 5. Report Date
Impact of Transitways on Travel on Parallel and Adjacent Roads January 2021
and Park-and-ride Facilities 6.

7. Author(s) 8. Performing Organization Report No.
Alex Webb, Tao Tao, Alireza Khani, Jason Cao, Xinyi Wu
9. Performing Organization Name and Address 10. Project/Task/Work Unit No.
Department of Civil, Environmental, and Geo- Engineering CTS#202003
The University of Minnesota 11. Contract (C) or Grant (G) No.
500 Pillsbury Dr. SE
 (C) 1003325 (WO) 111
Minneapolis, MN 55455-0116
12. Sponsoring Organization Name and Address 13. Type of Report and Period Covered
Minnesota Department of Transportation Final Report
Office of Research & Innovation 14. Sponsoring Agency Code
395 John Ireland Boulevard, MS 330
St. Paul, Minnesota 55155-1899
15. Supplementary Notes
http://mndot.gov/research/reports/2021/202103.pdf
16. Abstract (Limit: 250 words)
Transitways such as light rail transit (LRT) and bus rapid transit (BRT) provide fast, reliable, and high-capacity
transit service. Transitways have the potential to attract more riders and take a portion of the auto mode share,
reducing the growth of auto traffic. Park-and-ride (PNR) facilities can complement transit service by providing a
viable choice for residents who are without walking access to transit or those who prefer better transit service
such as LRT or BRT. In this study, we conducted two research tasks on Transitways services in the Twin Cities
region in Minnesota; 1) to examine the impact of the operation of the Green Line LRT on the annual average daily
traffic (AADT) of its adjacent roads, and 2) to estimate a PNR location choice model in the Twin Cities
metropolitan area.

17. Document Analysis/Descriptors 18. Availability Statement
light rail transit, bus rapid transit, Park and ride, Surveys, No restrictions. Document available from:
Choice models National Technical Information Services,
 Alexandria, Virginia 22312

19. Security Class (this report) 20. Security Class (this page) 21. No. of Pages 22. Price
Unclassified Unclassified 55
IMPACT OF TRANSITWAYS ON TRAVEL ON PARALLEL AND
ADJACENT ROADS AND PARK-AND-RIDE FACILITIES

FINAL REPORT

Prepared by:

Alex Webb
Alireza Khani
Department of Civil, Environmental, & Geo- Engineering
University of Minnesota

Tao Tao
Jason Cao
Xinyi Wu
Humphrey School of Public Affairs
University of Minnesota

January 2021

Published by:

Minnesota Department of Transportation
Office of Research & Innovation
395 John Ireland Boulevard, MS 330
St. Paul, Minnesota 55155-1899

This report represents the results of research conducted by the authors and does not necessarily represent the views or policies
of the Minnesota Department of Transportation, the University of Minnesota, or the sponsoring organizations of the Transitway
Impacts Research Program. This report does not contain a standard or specified technique.

The authors, the Minnesota Department of Transportation, the University of Minnesota, and the sponsoring organizations of
the Transitway Impacts Research Program do not endorse products or manufacturers. Trade or manufacturers’ names appear
herein solely because they are considered essential to this report.
ACKNOWLEDGEMENTS Funding for this study was provided by the Minnesota Department of Transportation Contract No. 1003325 Work Order No. 111 and was facilitated by The University of Minnesota's Transitway Impacts Research Program (TIRP). The authors would like to thank the following organizations for their assistance in providing the data necessary to make this research possible: Minnesota Department of Transportation Metropolitan Council
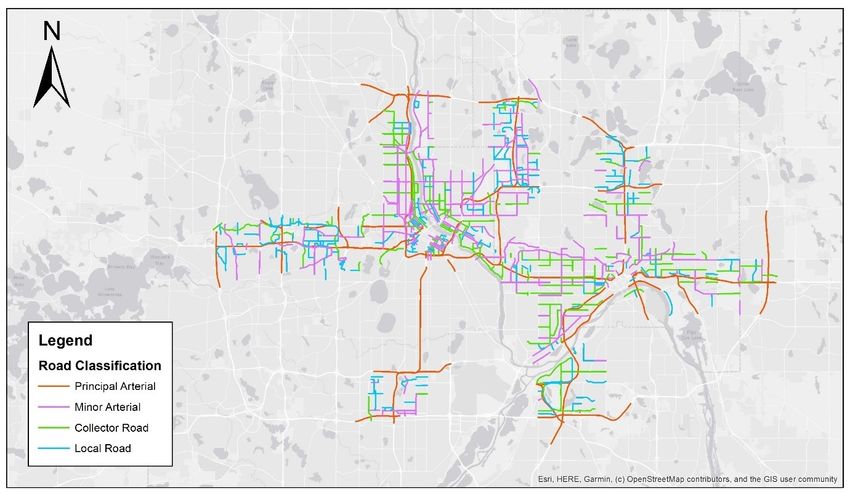
TABLE OF CONTENTS
CHAPTER 1: Introduction...................................................................................................................... 1

CHAPTER 2: Literature Review ............................................................................................................. 4

 2.1 Literature on the Impact of Rail Transit on Travel Demand ............................................................... 4

 2.2 Literature on Park-and-Ride Location Choice ..................................................................................... 5

CHAPTER 3: AADT Analysis before and after LRT Opening .................................................................... 8

 3.1 Method ............................................................................................................................................... 8

 3.1.1 Research design........................................................................................................................... 8

 3.1.2 Data ............................................................................................................................................. 9

 3.1.3 Models ....................................................................................................................................... 12

 3.2 Results............................................................................................................................................... 13

 3.2.1 Model 1: Before and after comparison ..................................................................................... 13

 3.2.2 Model 2: Trend over time ......................................................................................................... 14

 3.2.3 Models without control variables ............................................................................................. 15

 3.3 Limitation .......................................................................................................................................... 16

CHAPTER 4: Park-and-ride location choice model Estimation ............................................................. 17

 4.1 Method ............................................................................................................................................. 17

 4.1.1 Origin-destination data ............................................................................................................. 17

 4.1.2 Park-and-ride facility attributes ................................................................................................ 17

 4.1.3 Street network shortest path .................................................................................................... 19

 4.1.4 Schedule-based transit shortest path ....................................................................................... 19

 4.1.5 Choice set generation ............................................................................................................... 21

 4.1.6 Model construction ................................................................................................................... 22

 4.1.7 Overlapping routes .................................................................................................................... 24

 4.2 Results............................................................................................................................................... 25
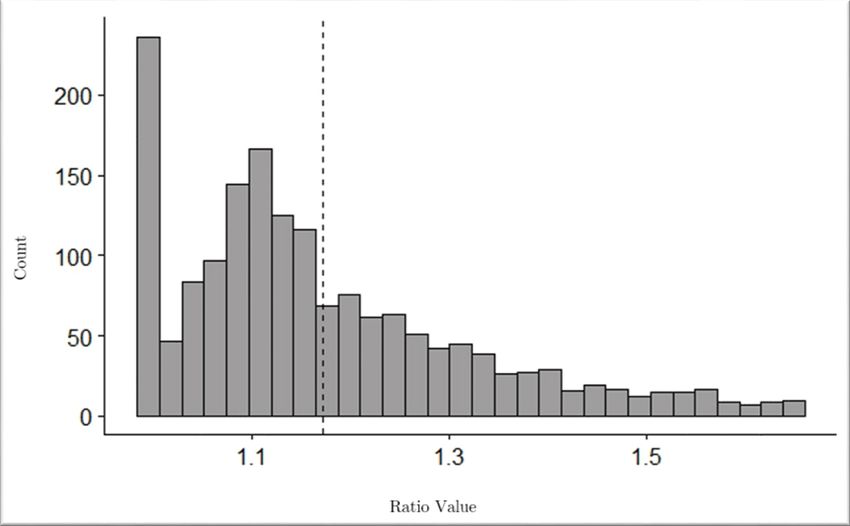
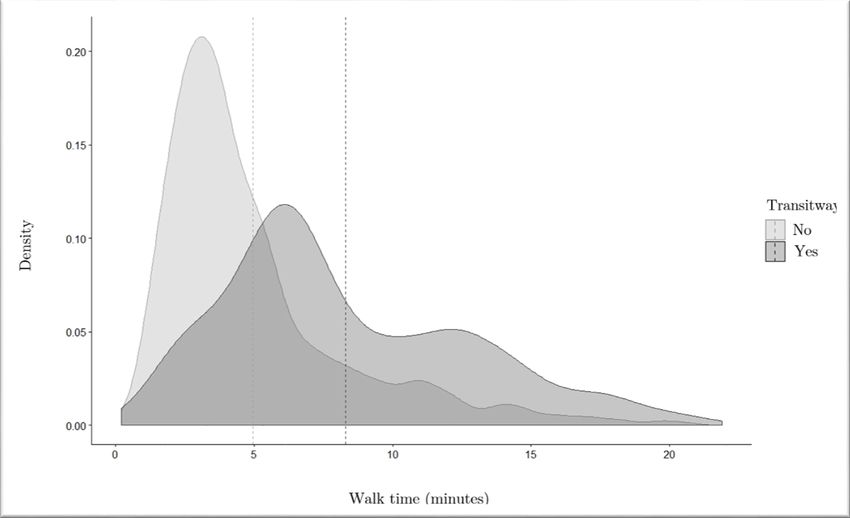
4.2.1 Model results............................................................................................................................. 25

 4.2.2 Multimodal behavior ................................................................................................................. 27

 4.2.3 Same route, different station .................................................................................................... 29

 4.3 Application: Travelshed analysis....................................................................................................... 30

 4.3.1 Objective ................................................................................................................................... 30

 4.3.2 Data and methods ..................................................................................................................... 30

 4.3.3 Choice set generation ............................................................................................................... 31

 4.3.4 Results ....................................................................................................................................... 31

 4.3.5 Park-and-ride facility comparison ............................................................................................. 34

 4.4 Limitations ........................................................................................................................................ 36

CHAPTER 5: Conclusion ...................................................................................................................... 37

REFERENCES....................................................................................................................................... 39

APPENDIX A: Road Segments Used in the LRT Impact Analysis

LIST OF FIGURES
Figure 1. Twin Cities park-and-ride facilities ................................................................................................. 3

Figure 2. LRT-influence area and non-influence areas ................................................................................. 9

Figure 3. Conceptual framework of this study ............................................................................................ 12

Figure 4. Relative change of AADT in the LRT-influence area ..................................................................... 15

Figure 5. Distance ratio ............................................................................................................................... 22

Figure 6. Nested logit structure .................................................................................................................. 24

Figure 7. Total travel time (dashed line shows the mean travel time) ....................................................... 27

Figure 8. Time ratio for chosen routes (dashed line shows the mean ratio value) .................................... 28

Figure 9. Walk time on chosen routes (dashed line shows the mean walk time) ...................................... 29

Figure 10. Alternative choice probabilities ................................................................................................. 30
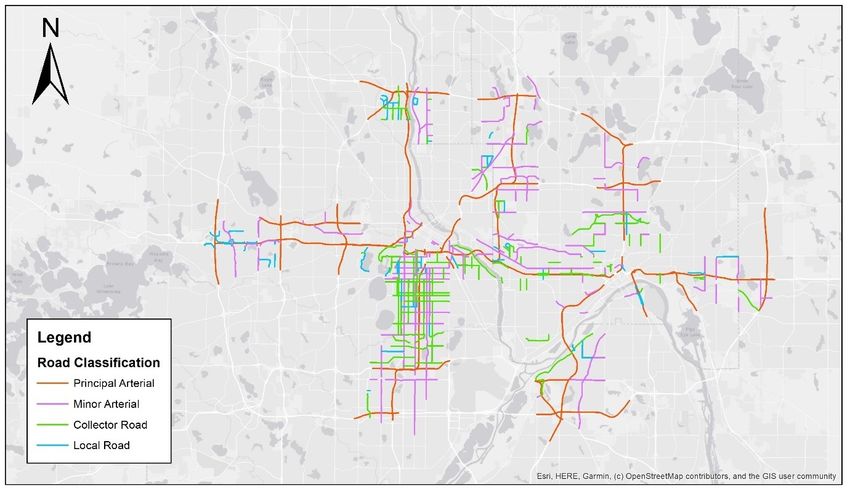
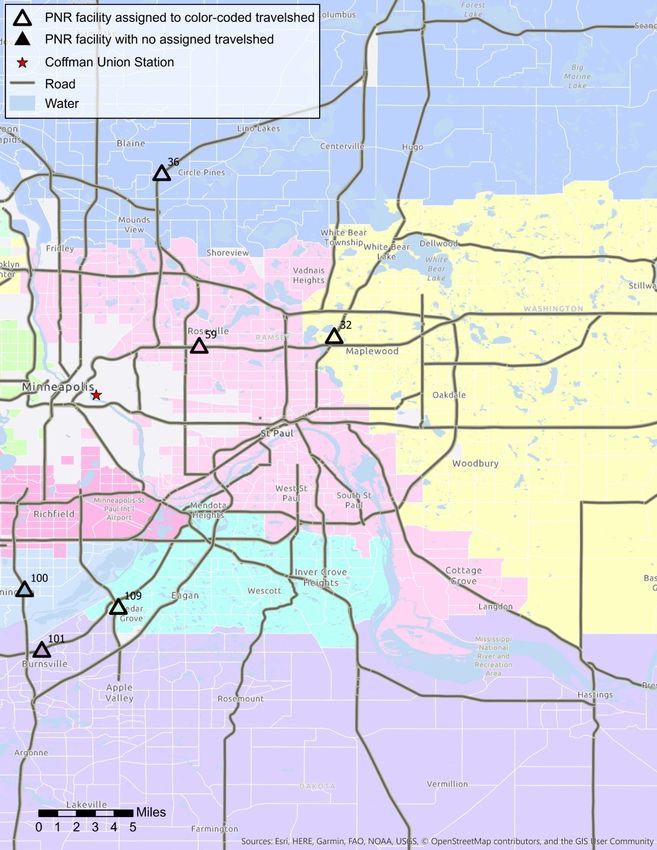
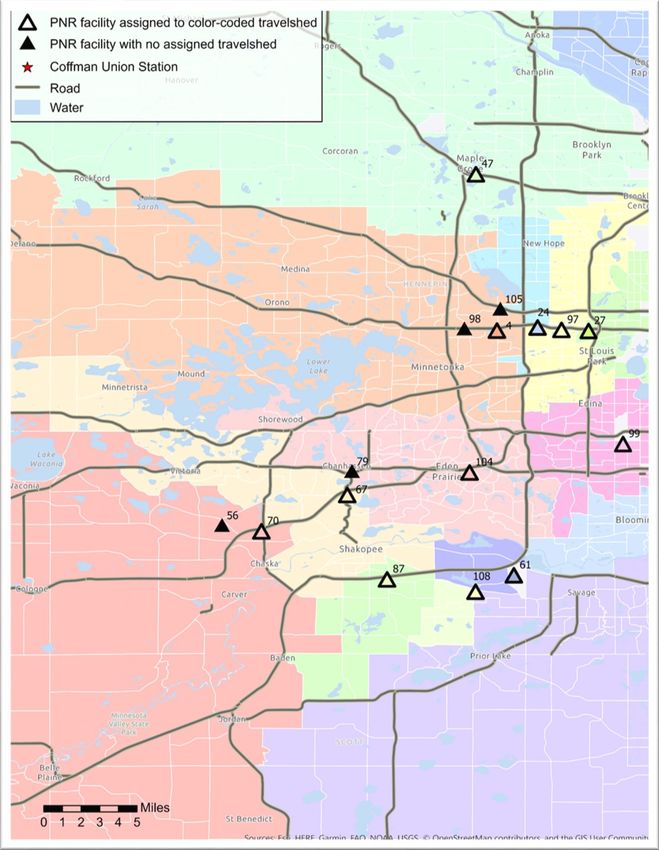
Figure 11. Travelshed for PNR facilities serving the University of Minnesota, West Metro Area .............. 32

Figure 12. Travelshed for PNR facilities serving the University of Minnesota, East Metro Area ............... 33

Figure 13. All road segments .................................................................................................................... A-1

Figure 14. Road segments in 2009-2010................................................................................................... A-2

Figure 15. Road segments in 2015-2016................................................................................................... A-2

Figure 16. Road segments in 2017-2018................................................................................................... A-3

LIST OF TABLES
Table 1. Variable Definition ........................................................................................................................ 10

Table 2. Variable Statistics .......................................................................................................................... 11

Table 3. Model Results ................................................................................................................................ 13

Table 4. Model Results without Controlling for Confounders .................................................................... 16

Table 5. Explanatory Variables .................................................................................................................... 21

Table 6. Logit model results ........................................................................................................................ 25

Table 7. Travelshed results ......................................................................................................................... 34

Table 8. Number of road segments for each study period ....................................................................... A-1
EXECUTIVE SUMMARY
Transitways such as light rail transit (LRT) and bus rapid transit (BRT) provide fast, reliable and high-
capacity transit service, mostly for longer trips. Transitways have the potential to attract more riders and
take a portion of the auto mode share, reducing the growth of auto traffic. Studying such an effect and
validating it with real data are crucial for future transit planning and evaluation. Park-and-ride (PNR)
facilities can complement transit service by providing a viable choice for residents who are without
walking access to transit or those who prefer better transit service such as LRT or BRT. Little is known
about how PNR users choose the location where they park and take transit, or whether they consider
network topology, PNR types, daily activities, etc. In this study, we conduct two research tasks. One is to
examine the impact of the operation of the Green Line LRT on the annual average daily traffic (AADT) of
its adjacent roads, and the other is to estimate the PNR location choice model in the Twin Cities
metropolitan area in Minnesota.

In the first task, we examined the impact of the Green Line LRT on road traffic. Using traffic data before
and after its opening, we applied a quasi-experimental design to compare AADT on the roads within and
outside of the LRT-influence areas. We employed multivariate analyses to control for confounding
factors such as transit service, land-use variables, and road-function classes. We found that compared
with the roads outside the influence area, the Green Line reduced AADT on the roads within its
influence area by about 22% in the first two years of operation. In the next two years, the AADT
bounced back by about six percentage points. These findings suggest that rail transit can reduce traffic
on adjacent roads, but there is a rebound effect.

In the second task, we provided insight into the travel behavior and preferences of PNR users in the
Twin Cities. From an on-board survey conducted by Metro Transit in 2016, we used 1,690 PNR users’
route choices to estimate a discrete choice model. We applied the precise coordinates of their origin,
destination, and parking location to calculate travel time experienced by each PNR user, as well as
aspects of their transit path, such as walking time, waiting time, and required number of transfers.
Further, we used attributes of each PNR facility to model preferences for quality of service. We
considered route overlap and measured it with a path size factor and a nested logit model. The
estimated models showed significant evidence that travel time with a car is perceived as approximately
four times more costly/burdensome than the same amount of time traveled by transit. We also found
that PNR users do not strictly minimize total travel time when choosing their commute route.
Ultimately, the best-fitting model correctly predicted the PNR choice for 64% of users in a test sample.
We extended this study to define travelsheds for people commuting to the University of Minnesota
using the previously estimated multinomial logit model. After assigning each travel analysis zone (TAZ) in
the Twin Cities metropolitan area to a given PNR travelshed, the total population served by each PNR
facility was inferred.

The contribution of this study to the literature is threefold. First, it uses a quasi-experimental design and
controls for confounding factors to study the causal relationship between rail transit deployment and
vehicular travel demand. Thus, it produces more accurate estimates of rail transit effects than previous
studies. Second, our empirical model shows that the Green Line reduced road traffic, but its effect
decreased over time. These findings suggest that both induced demand and induced development could
be at work. Third, we consider overlapping routes in studying PNR choice. While previous literature on
station choice has investigated the relationship between routes that share a transit path, no studies
specific to PNR choice have considered the matter.
CHAPTER 1: INTRODUCTION
Rail transit has been deployed to mitigate vehicular travel demand and stimulate transit-oriented
development in the US. Total vehicle miles traveled (VMT) in the US were 3.25 trillion in 2019, 20% more
than 20 years ago (FHWA, 2020). The increase in vehicular travel lessons various transportation-related
issues, such as traffic congestion and air pollution. For example, the average daily congestion time1
among the 52 largest metropolitan areas in the US exceeded four hours in 2018 (FHWA, 2019). To
promote transit use and slow the growth in VMT, many regions have built rail transit systems that offer
better quality of service (such as, higher reliability and frequency) than traditional buses. In 2017, the
number of rail transit systems in the US totaled 88, 70% more than 20 years before (APTA, 2019). The
total length was 11,498 miles in 2017, among which light rail transit (LRT) accounted for 17.7% (BTS,
n.d.).

Because rail transit requires high subsidies, quantifying its effectiveness is critical for policymakers to
garner public support for rail transit investment. For example, the Blue Line LRT commenced in the
Minneapolis-St. Paul (Twin Cities) metropolitan area in 2004 and the capital cost of this 12-mile route
was greater than $700 million (Metropolitan Council, 2011). Furthermore, rail transit is becoming more
expensive. The Green Line extension, a 14.5-mile route under construction, has an initial budget of
about $2 billion (Metropolitan Council, 2020). Given this, planners and policymakers must assess the
benefits of rail transit to justify their investment.

To evaluate its transportation impact, many scholars have examined the influence of rail transit on road
traffic (Bhattacharjee & Goetz, 2012; Ewing, Tian, Spain, & Goates, 2014; Giuliano, Chakrabarti, &
Rhoads, 2016). For example, Bhattacharjee and Goetz (2012) compared VMT on highway road segments
before and after the opening of three light rail lines in Denver, CO, between 1992 and 2008. They
suggested that the three lines reduced the increase in highway traffic.

Previous studies, however, often have two limitations. First, they do not account for the effects of
confounding factors (such as transit supply and land use along the roads) on road traffic, and omitting
these important confounders leads to biased estimates of the rail transit effects. In particular, when a
rail transit line is deployed in a corridor, transit agencies adjust bus routes as necessary in and/or near
the corridor to optimize the benefits of the transit system. For instance, the Green Line LRT in the Twin
Cities completely replaced Route 50 bus service and substantially reduced the service frequency of
Route 16 (Metro Transit, 2014). Changes in bus supply may alter the vehicular travel demand in the
corridor. In addition, individual responses to rail transit depend on land-use patterns within its vicinity
(Huang, Cao, Yin, & Cao, 2019). For example, commercial and industrial uses may generate different
travel outcomes. Second, few studies test whether the impact of rail transit on road traffic changes over

1
 Congestion time is the number of hours “when freeways operate less than 90% of free-flow freeway
speeds” (FHWA, 2019, p. 2). It is measured from 6 am to 9 pm on weekdays.

 1
time. Rail transit can generate new development along the corridor (Cervero, 1994; Guthrie & Fan,
2013), resulting in an increase in trips to the corridor (Cervero, 2003).

Park-and-ride (PNR) facilities can complement transit service by providing a viable choice for residents
who are without walking access to transit or those who prefer better transit service such as LRT or BRT.
Little is known about how PNR users choose the location where they park and take transit, or whether
they consider network topology, PNR types, daily activities, etc. The Twin Cities metropolitan area offers
more than 100 PNR facilities served by express bus, heavy rail, and light rail that give commuters a
variety of ways to reach their destination. Between 2004 and 2015, PNR usage in the Twin Cities grew by
nearly 60% but has decreased slightly since 2015 (Nelson, 2017). As parking becomes more difficult to
find in downtown Minneapolis and Saint Paul, improving PNR service will be essential to the region’s
pursuit of mobility and environmental goals.

To address these gaps, we conduct two research tasks in this study. In the first task, we examine the
impact of the Green Line LRT on road traffic in the Twin Cities using traffic data before and after its
opening. This task applies a quasi-experimental design to compare the annual average daily traffic
(AADT) on the roads within and outside of the LRT-influence areas. We employ multivariate analyses to
control for confounding factors including transit service, land-use variables, and road-function classes.
This task attempts to answer the following two research questions: (1) How does LRT influence AADT of
the road segments within its service area? And (2) how does the influence change over time?

In the second task, we provide insight into the travel behavior and preferences of PNR users in the Twin
Cities. From an on-board survey conducted by Metro Transit in 2016, we use 1,690 PNR users’ route
choices to estimate a discrete choice model. We apply the precise coordinates of their origin,
destination, and parking location to calculate the travel time experienced by each PNR user, as well as
aspects of their transit path, such as walking time, waiting time, and required number of transfers.
Further, we use the attributes of each PNR facility to model preferences for quality of service. Given the
PNR that each user chose to use, we generate a choice set of reasonable alternatives from the facilities
shown in Figure 1. We consider route overlap and measure it using a path size factor and a nested logit
model. Finally, we conclude this task with an application of the estimated choice model to determine
PNR travelsheds for those commuting to the University of Minnesota. For each travel analysis zone (TAZ)
in the metropolitan region, commuters are assigned to the most likely PNR based on the previously
estimated choice model, resulting in a spatial understanding of the areas and populations served by
each PNR facility.

 2
Figure 1. Twin Cities park-and-ride facilities

The rest of the report is organized as follows. Chapter 2 reviews the current literature about the impact
of rail transit on travel demand and PNR location choice. Chapter 3 introduces the method and results of
the first task. Chapter 4 then introduces method, results, and application of our second task. And finally,
we conclude our research in Chapter 5.

 3
CHAPTER 2: LITERATURE REVIEW
2.1 LITERATURE ON THE IMPACT OF RAIL TRANSIT ON TRAVEL DEMAND

Many studies examine the influence of rail transit on vehicular travel demand. Scholars address this
issue through both disaggregate and aggregate studies. Disaggregate studies focus on travel demand of
individuals or households (Cao and Ermagun 2017; Spears, Boarnet, and Houston 2017; Jiang and
Mondschein 2019). For example, Spears, Boarnet, and Houston (2017) surveyed 285 households near
the Exposition light rail in Los Angeles, CA and compared their daily VMT before and after its opening.
They found that households living within one-kilometer of the rail transit drove approximately ten miles
fewer than those living farther away.

Disaggregate studies unveil how rail transit influences vehicular travel demand at the individual level,
such as mode choice, trip frequency, and VMT. They have a few limitations. First, respondents may
underreport their daily travel or vehicle use (Wolf, Oliveira, & Thompson, 2003). For example,
individuals may misunderstand the meaning of trips in travel diaries or forget to record short trips. This
underreporting results in inaccurate estimates. Second, although travel behavior analysis provides
information on the impact of rail transit on individuals, it often does not consider complementarity and
competition among travelers in a constrained transportation system (Levinson & Krizek, 2018, p. 11).
People make trade-offs when facing constraints. However, once the constraints are relaxed, latent
demand is unleashed. For example, after individuals switch from driving to rail transit after its opening,
road congestion (and travel cost) decreases, making room for new vehicular trips that would have not
occurred otherwise or the trips shifting from other routes, times, and modes. Third, by using travel
diaries, transportation engineers and planners do not know when and where individual trips occur in the
transportation system. However, understanding temporal and geographical distributions of vehicular
travel is essential to effective transportation system management and travel demand management.

Aggregate studies explore the influence of rail transit on vehicular demand in the transportation system
(Bhattacharjee & Goetz, 2012; Giuliano et al., 2016). Compared with disaggregate studies, they do not
suffer from those aforementioned issues. In aggregate studies, variables of interest are attributes of
road segments or specific areas, such as travel speed, VMT, and AADT. For example, Giuliano and her
colleagues (2016) compared rush-hour travel speeds of highway segments adjacent to the Exposition
light rail before and after its opening finding that it has no significant effect. By contrast, Bhattacharjee
and Goetz (2012) concluded that LRT in Denver reduced the growth in VMT on the highways in its
influenced areas. Ewing et al. (2014) compared AADT of road segments before and after the opening of
two extensions of the TRAX line at the University of Utah. They found that the extensions reduced
AADT. These studies provide insights on rail transit effects on the performance of transportation
systems and thus offer technical evidence for policymaking.

Another way to assess the role of transit is to examine the impact of a transit strike, an immediate shock
to the transportation system (Adler & van Ommeren, 2016; Lo & Hall, 2006). Adler and van Ommeren
(2016) measured the performance of transportation systems during transit strikes in Rotterdam,
Netherlands and compared it with that during regular days. They found that the strike substantially

 4
increased the travel time on the roads in the inner city, but marginally affected the performance of ring
roads. This study illustrates the role of transit in mitigating traffic by examining traffic conditions
without transit. However, since transit strikes are scarce events, studies on their effect are limited.
More importantly, as a response to short-lived transit strikes, individuals choose lower-cost strategies to
mitigate the impacts (Mokhtarian, Raney, and Salomon 1997; Cao, Wongmonta, and Choo 2013). This
incorrectly estimates the importance of transit in the transportation system.

The divergent impacts of the transit strike in Rotterdam on traffic in different areas suggest that
individuals’ responses are confounded by third-party variables. Urban areas have better transit services
and are more densely developed than suburban areas, so urban residents use transit more often than
suburbanites. Once transit becomes unavailable, urban residents are more likely than suburbanites to
switch travel modes. Therefore, it is plausible that a more substantial impact was observed in the inner
city. Similarly, the impact of rail transit on road traffic may be confounded by transit supply and land
uses. For example, feeder buses help connect rail transit with riders outside of its catchment areas.
More feeder buses attract more auto drivers to use rail transit (Ding, Cao, & Liu, 2019; Gan, Yang, Feng,
& Timmermans, 2020). Moreover, rail transit increases property values (Cao and Lou 2017; Mathur
2020) and stimulates new development (Cao and Porter-Nelson 2016) along the corridor. Land use
changes likely alter travel demand. However, few studies control for confounding variables when
examining the effects of rail transit.

The influence of rail transit on road traffic may change over time, but few studies examine how the
change evolves. Firstly, the traffic in the vicinity of rail transit is likely to rebound gradually. Downs
(1992) proposed the principle of triple convergence: capacity increase or reduced vehicular demand
attributable to policy interventions (e.g., telecommuting or transit-oriented development) will be offset
by the demand switched from other modes, times, and routes. After the opening of a rail transit line,
some individuals switch from driving to transit. As a result, roads adjacent to the rail line become less
congested. Because it is more convenient to use these roads, individuals who use alternative roads
change their routes. Similarly, some transit users switch back to driving and those who change their trip
departure time to beat the traffic may also switch back. Sooner or later, the roads will become
congested again. Second, transit investments, particularly rail transit, can bring about changes in
population, employment, and land uses around transit station areas (Baker & Lee, 2019; Cervero, 1994).
Induced development will attract more traffic to the corridor (Cervero, 2003). Therefore, the effect of
rail transit on vehicular travel demand in its vicinity should be dynamic. Some studies discuss this in
their results. Giuliano, Chakrabarti, and Rhoads (2016) speculated that the insignificant effect of the
Exposition light rail was due to the large latent travel demand in the corridor. Bhattacharjee and Goetz
(2012, p. 262) claimed that rail transit could slow down the increase of highway travel demand “for a
short period of time.” However, most studies do not differentiate the impacts of rail transit in the after-
opening period.

2.2 LITERATURE ON PARK-AND-RIDE LOCATION CHOICE

Station choice modeling first appeared in academic literature in the mid-1970s, and is now an
established application of discrete choice modelling (Young & Blainey, 2018). Most often, researchers

 5
have used revealed preference data to frame station choice as a utility maximization process. Among
the most common findings in station choice modelling is a negative effect of distance from origin to
station on station choice (Chakour & Eluru, 2014; Debrezion, Pels, & Rietveld, 2009; Kastrenakes, 1988).
In the earliest study to report this finding the researcher created a binary variable indicating if a station
was ”local” to a given user, and found this variable along with access time to be the most influential
factors in station choice (Kastrenakes, 1988). Another study modeled Dutch Railway station choice as a
share of postcode area demand, and not only found a negative effect of access distance, but found a
steeper negative effect of access distance on non-motorized access modes compared to motorized
access modes (Debrezion et al., 2009). Finally, a study of commuter train station choice around
Montreal validated these results, showing a negative effect of access time by mode on station choice
(Chakour & Eluru, 2014). Transit frequency has also commonly been found to have a positive effect on
station choice (Chakour & Eluru, 2014; Debrezion et al., 2009). Due to differences between transit
networks, some of these key findings should be interpreted with caution. For example, studies that
found a positive effect of transit frequency on station choice were conducted on rail transit systems with
regular headways. In the Twin Cities, PNR facilities are largely served by express buses with irregular
headways, and therefore station choice may have a different relationship with transit frequency.

The relatively limited body of literature specific to PNR station choice may offer the most relevant
findings to this study. A study from Perth, Australia used a stated preference survey to estimate a
multinomial logit model for PNR station choice along a rail network (Olaru, Smith, Xia, & Lin, 2014). The
findings indicate that quality of facilities and surrounding land-use most significantly influence PNR
station choice. Similar to station choice literature which found access distance to be significant, this
study observed 60% of PNR users boarding at the nearest station to their origin. These results may not
be widely applicable, however, as each PNR user is assumed to face a choice between exactly two PNR
locations. This limitation is partially addressed by a study of PNR station choice in Toronto, in which train
riders face a choice between the five nearest stations and subway riders choose between the three
nearest stations (Mahmoud, Habib, & Shalaby, 2014). The study found that access distance and the
direction of the station from their origin were the strongest predictors of station choice. The study is
further limited by a lack of driving and transit path attributes. A study from Austin, Texas provides the
most relevant framework for analyzing PNR station choice in the United States (Pang & Khani, 2018).
The authors used on-board survey data to estimate passenger’s travel path, using a street network
representation to model shortest-path access times, and a schedule-based shortest path algorithm to
model transit paths (Khani, Hickman, & Noh, 2014). Among the findings are preferences for higher
transit frequency, transit in-vehicle time less than ten minutes, and shorter walking times. This recent
study is significant for including detailed transit path information, as well as its application of choice
modelling to a transit system where express buses are the dominant service.

Across the literature, several methodological themes exist. First, most studies define a choice set such
that each user’s station choice is between a fixed number of stations (Debrezion et al., 2009; Mahmoud
et al., 2014; Olaru et al., 2014; Sharma, Hickman, & Nassir, 2017), while a minority of studies define a
more flexible choice set (Chakour & Eluru, 2014; Pang & Khani, 2018). Fixed choice sets are easy to
define and manage, but may also be highly influential in a model’s understanding of choice behavior.

 6
Flexible choice sets are formed using some criteria to determine which stations are reasonable or
unreasonable alternatives for a given user. For example, one study defines a reasonable alternative path
as one whose total travel time does not exceed the shortest total travel time plus 50 minutes (Pang &
Khani, 2018). This type of choice set definition is preferable to a fixed definition as it does not dictate the
size of a choice set, but rather eliminates extreme alternatives based on observed behavior. Second,
most studies use Euclidean distance to measure the distance between a user’s origin and each
reasonable station (Debrezion et al., 2009; Kastrenakes, 1988; Mahmoud et al., 2014). One study
improved upon this methodology by using a network representation of the roads in Austin, Texas to
approximate each user’s experiences driving time (Pang & Khani, 2018). A variety of methods are used
to estimate transit travel times including a Google Maps based algorithm (Chakour & Eluru, 2014) and a
schedule-based shortest path algorithm proposed by Khani (Khani et al., 2014). These methods are
preferable to simple measures of travel time, because they include more detailed information about the
experienced walking time, waiting time, and number of transfers on a transit path. Finally, the studies
reviewed in this section were selected for their application of discrete choice modelling. More
specifically, each study estimates a multinomial logit model, and some estimate a mixed logit or nested
logit model for station choice. The mixed logit model provides a more flexible framework than the
multinomial logit model, allowing random taste variation, unrestricted substitution patterns, and
correlation in unobserved factors over time (Train, 2009). These benefits only carry the burden of
increased computation time. In the context of station choice, the nested logit model has only been used
for situations where a traveler has a two-stage choice between stations and station access mode
(Debrezion et al., 2009). In this study, the nested logit will be adapted to capture substitution patterns
between the different transit modes available throughout the Twin Cities PNR system.

Literature on PNR station choice has yet to consider similarities between routes or overlapping routes.
When two different routes share part of a transit route, there exists a statistical correlation between the
alternatives that should be accounted for when estimating a discrete choice model. The most related
work in the context of PNR station choice comes from a study in Brisbane, Australia which uses a
modeling framework called Random Regret Minimization (RRM) that is notable for its accommodation
of the “Compromise Effect” (Sharma et al., 2017). A compromise alternative is one with generally
intermediate performance across several attributes, in contrast to an alternative with extreme
performance. For example, a PNR facility that is an average driving distance from a user’s origin and
provides average transit speed would be a compromise alternative. The popularity of compromise
alternatives has been well-documented in many decision-making contexts, but is often overlooked in
transportation applications (Chorus & Bierlaire, 2013). While this framework acknowledges a trade-off
relation between alternatives, it does not explicitly account for or measure route overlap. Outside of
PNR choice literature, a multimodal path size factor has been developed to measure subroute overlap,
and will be adapted for this study. Three different path size factor formulations are proposed by
Hoogendoorn-Lanser and Bovy, each accommodating a slightly different multimodal path scenario.
Ultimately, the study finds that the inclusion of a path size factor in their discrete choice model
significantly improves model performance (Hoogendoorn-Lanser & Bovy, 2007).

 7
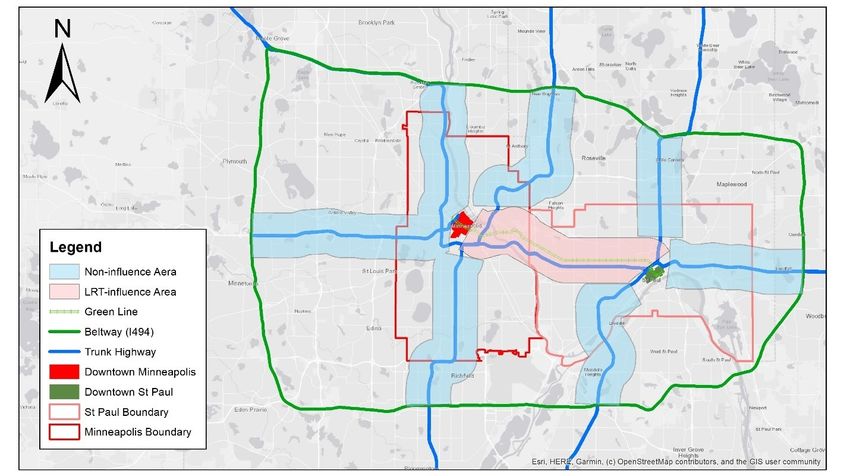
CHAPTER 3: AADT ANALYSIS BEFORE AND AFTER LRT OPENING
3.1 METHOD

3.1.1 Research design

This study applied a quasi-experimental (before-after and treatment-control) design to explore the
impact of rail transit on vehicular travel demand on adjacent road segments. The treatment is the
Green Line light rail in the Twin Cities. It connects downtown Minneapolis and downtown Saint Paul,
along University Avenue and Washington Avenue. The 11-mile route has 18 new stations and five
stations shared with the Blue Line. The Green Line replaced limited stop service Route 50, which had an
average weekday ridership of 6,886 in 2010. The parallel Route 16, a high-frequency local service with
an average weekday ridership of 16,880 in 2010, was reduced to a low-frequency service (Metro Transit,
2012, p. 52). In 2019, the average weekday ridership of the Green Line was 44,004, exceeding the
projected ridership in 2030 by 10% (Metro Transit, 2020). These statistics imply that about 40-50% of
Green Line riders are new to transit.

We defined treatment and control groups as follows. We selected the one-mile buffer along the Green
Line as the LRT-influence area (the pink area shown in Figure 2). The treatment group constitutes all
road segments within the LRT-influence area (see Figure 13 in the Appendix). Non-influence areas
include one-mile buffers along the interstate highways within the beltway (the blue areas shown in
Figure 2). The control group constitutes all road segments within these non-influence areas. We used
the control group to account for the influences on vehicular travel demand of third-party variables, such
as gasoline prices and region-wide transportation policies. We excluded the road segments within the
two downtown areas from our analysis because they were affected by road traffic in both LRT-influence
and non-influence areas.

 8
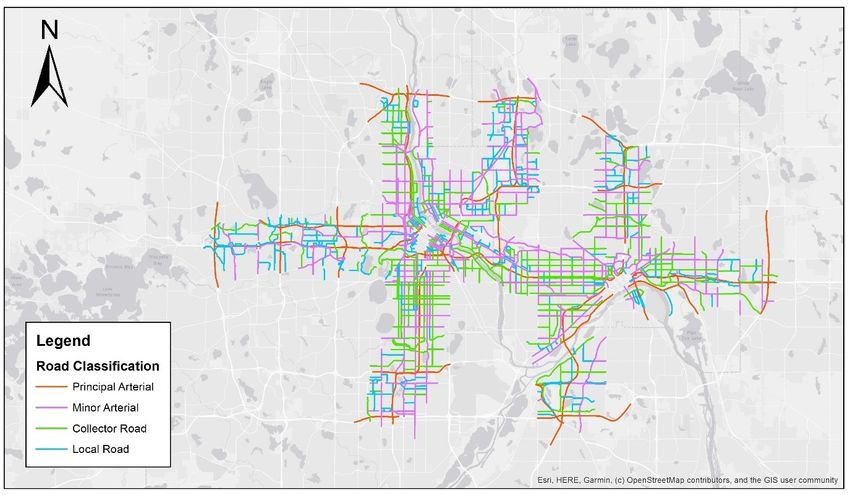
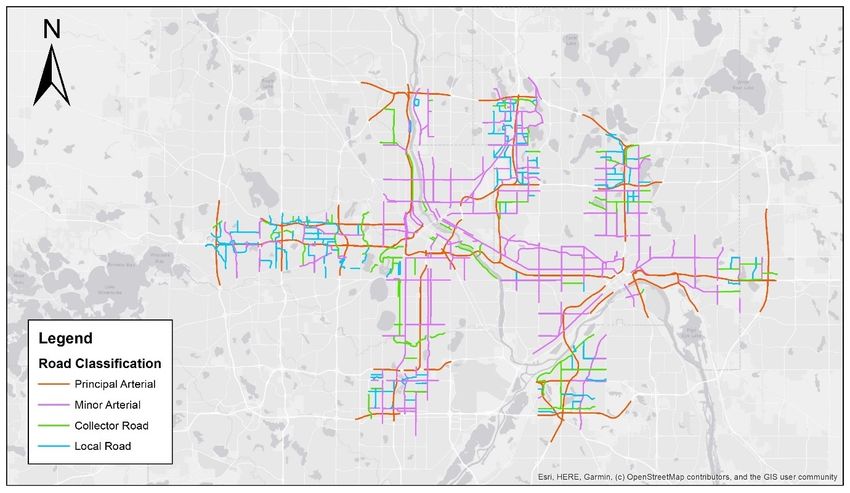
Figure 2. LRT-influence area and non-influence areas

We defined before and after periods as follows. We chose years of 2009-2010 as the before period and
years of 2015-2018 as the after period. The Green Line started construction in late 2010 and began
revenue service in June 2014. We excluded the years of 2011-2014 from our analysis because the
construction of the Green Line could disrupt the performance of adjacent road networks.

3.1.2 Data

We used annual average daily traffic to measure vehicular travel demand. AADT is an index to estimate
vehicular traffic within road segments for both directions on any given day during a year (MnDOT, 2020).
This information can be used to calculate annual VMT, helping the Federal Highway Administration
(FHWA) for travel analysis and funding (MnDOT, 2020). We obtained AADT data during 2009-2018 from
the Minnesota Department of Transportation (MnDOT). It is worth noting that not all road segments
have AADT data in a given year. The frequency of collecting AADT of a road segment depends on its
importance in the transportation network. MnDOT collects AADT of the road segments in the state
trunk highway system biennially (MnDOT, 2020). The AADT data of other roads are collected at a lower
frequency. To obtain traffic data of all trunk highways, we integrated AADT data of two consecutive
years. Accordingly, we produced AADT data for three periods: 2009-2010, 2015-2016, and 2017-2018.
Figure 13-Figure 16 in the Appendix illustrate the road segments with AADT data at different periods.
Appendix Table 2 presents the number of road segments for each period.

We also acquired datasets of road classification from MnDOT, land use from the Metropolitan Council,
and transit supply from the Metro Transit. MnDOT classifies road segments into four categories:
principal arterial, minor arterial, collector roads, and local road. In general, a higher road classification is
associated with a larger volume. Land uses along a road segment affect its travel demand. To capture

 9
the influence of land uses, we computed the areas of commercial uses, industrial uses, institutional uses,
and residential uses within the half-mile buffer of the segment. Transit supply measures the average
number of transit service trips per hour in the quarter-mile buffer of the segment. Table 1 defines the
variables used in this study and Table 2 presents their descriptive statistics.
Table 1. Variable Definition

 Variables Definition
 Dependent variable
 Travel
 AADT Normalized AADT in number of vehicles for both directions of the road segment1
 Demand
 Independent variables
 LRT Dummy variable indicating the road segment intersects the LRT influence area
 Opening Dummy variable indicating AADT is collected after the opening of the Green Line
 Year1718 Dummy variable indicating AADT is collected in 2017 or 2018
 Period Year1516 Dummy variable indicating AADT is collected in 2015 or 2016
 Dummy variable indicating AADT is collected in 2009 or 2010, the reference
 Year0910
 category for the other two periods
 Principal
 Dummy variable indicating the road segment is classified as principal arterial
 Arterial
 Minor
 Road Dummy variable indicating the road segment is classified as minor arterial
 Arterial
 Classificat
 Collector
 ion2 Dummy variable indicating the road segment is classified as collector road
 Road
 Dummy variable indicating the road segment is classified as local road, the
 Local Road
 reference category for the other three types of road classification
 Commercial
 Commercial area in acres in the half-mile buffer of the road segment
 Area
 Industrial
 Industrial area in acres in the half-mile buffer of the road segment
 Land Area
 Use3 Institutional
 Institutional area in acres in the half-mile buffer of the road segment
 Area
 Residential
 Residential area in acres in the half-mile buffer of the road segment
 Area
 Transit Transit Daily average number of transit service trips per hour in the quarter-mile buffer of
 Supply4 Frequency the road segment5

Notes:
1. As wider roads tend to accommodate larger volumes, we normalized AADT of a road segment (dividing AADT by
 travel width). Travel width measures the drivable surface from shoulder to shoulder of a road segment. It does
 not consider passing lanes, turn lanes, auxiliary lanes, or shoulders.
2. Road classification is consistent within the study period.
3. We applied land use data in 2010 for the period of 2009-2010, 2016 for 2015-2016, and 2018 for 2017-2018.
4. We applied transit supply data in autumn 2010 for the period of 2009-2010, autumn 2016 for 2015-2016, and
 autumn 2017 for 2017-2018. We chose the data in autumn 2017 for the last period because transit data in
 autumn 2018 are unavailable.
5. We counted only the transit service with stops in the quarter-mile buffers. Transit service includes urban local
 bus, suburban local bus, express bus, the North Star commuter rail, and the Blue Line light rail.

 10
Table 2. Variable Statistics

 Total (N = 2,718) Year0910 (N = 943) Year1516 (N = 657) Year1718 (N = 1,118)
 Variables
 Mean SD Min Max Mean SD Min Max Mean SD Min Max Mean SD Min Max
 AADT 393.43 524.78 0.42 2,652.78 387.35 482.59 3.54 2,652.78 483.69 602.28 7.68 2,569.44 345.52 503.30 0.42 2,416.67
 LRT 0.18 0.38 0 1 0.15 0.35 0 1 0.18 0.39 0 1 0.21 0.41 0 1
 Opening 0.65 0.48 0 1
 Year1718 0.41 0.49 0 1
 Year1516 0.24 0.43 0 1
 Year0910 0.35 0.48 0 1
 Principal Arterial 0.17 0.37 0 1 0.16 0.37 0 1 0.23 0.42 0 1 0.14 0.34 0 1
 Minor Arterial 0.40 0.49 0 1 0.47 0.50 0 1 0.39 0.49 0 1 0.34 0.48 0 1
 Collector Road 0.21 0.41 0 1 0.14 0.35 0 1 0.26 0.44 0 1 0.23 0.42 0 1
 Local Road 0.23 0.42 0 1 0.23 0.42 0 1 0.12 0.33 0 1 0.29 0.45 0 1
 Commercial Area 152.83 102.35 0.08 576.96 146.59 104.14 0.28 564.41 158.24 102.21 2.45 576.96 154.91 100.72 0.08 530.51
 Industrial Area 61.03 81.26 0 502.04 51.16 73.12 0 502.04 60.21 87.36 0 435.34 69.84 83.12 0 486.68
 Institutional Area 31.93 51.72 0 431.29 40.77 56.84 0 429.46 27.74 49.23 0 431.29 26.93 47.52 0 408.47
 Residential Area 336.91 164.95 3.00 1,266.57 339.43 164.69 5.75 1,251.40 372.48 174.90 3.00 1,266.57 313.90 155.13 3.00 1,245.14
 Transit Frequency 3.84 5.20 0 41.81 3.11 4.55 0 37.43 4.22 4.63 0 37.91 4.24 5.91 0 41.81
Notes:
N = Sample Size; SD = Standard Deviation; Min = Minimum; Max = Maximum

 11
3.1.3 Models

As presented in Figure 3, we assume that while the operation of LRT influences AADT in a given year,
other factors, such as land use, transit supply, and road classification, also contribute to the AADT.
Therefore, we need to account for their influences in the model.

 Figure 3. Conceptual framework of this study

We applied negative binomial regression to analyze the assembled data based on the conceptual
framework. The dependent variable is AADT of road segments and the other variables in Table 1 are
independent variables. We chose negative binomial model because AADT is skewed to the right and its
variance is larger than its mean.

We constructed two models: Model 1 examines the difference in vehicular travel demand before and
after the opening of the Green Line. Model 2 shows the changes in vehicular travel demand over the
study period. Besides measures of road classification, land use, and transit supply, Model 1 (shown in
Equation 1) includes the treatment variable , the period variable , and their interaction
term:

 = ( , , × ,
 (1)
 , , ).

In a difference-in-difference model like Equation 1, the interaction term is the policy variable (Billings,
Leland, & Swindell, 2011; Hurst & West, 2014). A significantly negative coefficient suggests that the
opening of the Green Line reduces vehicular travel demand of the road segments in the LRT-influence
area, compared with those in the non-influence areas. All else being equal, the effect of an independent
variable on vehicular travel demand can be calculated as:
 ̂
 Δ = ( − 1) × 100%, (2)

where Δ is the relative change in percentage, and ̂ is the estimated coefficient of the independent
variable.

Model 2 (shown in Equation 3) includes the treatment variable , two period variables ( 1516 and
 1718), and two interaction terms and controls for the same three types of variables as Model 1:

 = ( , 1516, 1718, × 1516,
 (3)
 × 1718, , , ).

 12
A significantly negative coefficient of the interaction term implies that the Green Line reduces travel
demand of the road segments in the LRT-influence area during the corresponding period (years 2015-
2016 or years 2017-2018), compared with those in the non-influence areas during the years 2009-2010.
The relative change in AADT could be calculated using Equation 2.

3.2 RESULTS

Table 3 presents two model results. Model 1 focuses on the change in vehicular travel demand after the
opening of the Green Line, and Model 2 emphasizes how this change evolves over time. These two
models have a similar fitness to the dataset based on the pseudo adjusted R squared: both are around
0.1.

Table 3. Model Results

 Model 1 Model 2
 Variable Relative Relative
 Coefficient P-value Coefficient P-value
 Change (%) Change (%)
 Opening 0.04 0.194
 × -0.20 0.003 -18.23
 LRT 0.33 0.000 0.33 0.000
 × -0.25 0.003 -22.18
 × -0.18 0.015 -16.19
 Year1516 0.04 0.275
 Year1718 0.03 0.264
 Principal Arterial 2.81 0.000 1,562.65 2.81 0.000 1,564.32
 Minor Arterial 1.19 0.000 227.72 1.19 0.000 227.72
 Collector Road 0.45 0.000 56.31 0.45 0.000 56.30
 Commercial Area 8.60 × 10⁻⁴ 0.000 0.09 8.53 × 10⁻⁴ 0.000 0.09
 Industrial Area −7.22 × 10⁻⁴ 0.000 -0.07 −7.09 × 10⁻⁴ 0.000 -0.07
 Institutional Area 1.19 × 10⁻³ 0.000 0.12 1.18 × 10⁻³ 0.000 0.12
 Residential Area 1.66 × 10⁻⁴ 0.051 0.02 1.67 × 10⁻⁴ 0.052 0.02
 Trip Frequency -0.02 0.000 -1.91 -0.02 0.000 -1.90
 Constant 4.25 0.000 4.25 0.000
 Dispersion Factor 2.6937 2.6947
 Pseudo Adjusted R2 0.1015 0.1014
 Sample Size 2,718 2,718

3.2.1 Model 1: Before and after comparison

Model 1 shows that the coefficient of the interaction term between LRT and opening is -0.20 and
significant, after controlling for other variables. This means that after the opening of the Green Line, the
AADT of the road segments in the LRT-influence area decreases by approximately 18%, compared with
that in the non-influence areas. Therefore, the Green Line reduces vehicular traffic of adjacent road

 13
segments. This result is consistent with the literature (Bhattacharjee & Goetz, 2012; Ewing et al., 2014)
and the rising transit ridership in the corridor.

All, but one, of the control variables have significant relationships with vehicular travel demand at the
5% level, while residential area is marginally significant. Road classification variables show significant
associations with AADT. Specifically, principal arterials, minor arterials, and collector roads carry
approximately 1,563%, 228%, and 56% more vehicles than local roads, respectively. This pattern is
logical as the volumes of different service levels of the roads follow their importance hierarchy in the
transportation system. Regarding land use variables, commercial area, institutional area, and residential
area are positively associated with AADT. Among the three, institutional area has the largest effect. In
particular, for each one-acre increase in institutional use, AADT grows by about 0.12%. By contrast,
industrial area is negatively associated with AADT. The negative relationship might be because land-
intensive industrial uses generate lower traffic than other types of land uses. Transit frequency has a
negative correlation with AADT. This relationship is plausible because transit competes with personal
vehicles. An increase of one transit trip per hour is associated with an approximate 2% reduction in
AADT.

3.2.2 Model 2: Trend over time

All control variables in Model 2 have the same relationships with AADT as those in Model 1. The two
interaction terms between the period variables and LRT are both negative and significant. The
coefficient of the interaction term between year1516 and LRT is -0.25, showing that the AADT of the
road segments in the LRT-influence area decreases by about 22% in the period of 2015-2016, compared
with the period of 2009-2010. The coefficient of the interaction term between year1718 and LRT is -
0.18. It means that the decrease in the AADT of the road segments in the LRT-influence area is around
16% in the period of 2017-2018, compared with the period of 2009-2010. These results suggest that the
opening of the Green Line reduces vehicular travel demand on adjacent roads during the first two years
of operation, but vehicular traffic rebounds during the following two years (Figure 4). This finding is
likely attributable to the principle of triple convergence, as discussed in the literature review. Transit-
induced development is another cause.

 14
0 0

 Relative change of AADT (%)
 -5

 -10

 -15
 -16.19

 -20
 -22.18
 -25
 Year0910 Year1516 Year1718
 Time

 Figure 4. Relative change of AADT in the LRT-influence area

The Green Line increases property values and attracts real estate development along its route, such as
apartments, retail stores, and restaurants. Cao and Lou (2017) found that the commencement of the
Green Line improved housing values by $13.7 per square foot. Cao and Porter (2016) also showed that
the funding announcement of the Green Line increased building activities in the station areas by
approximately 24%. The Metropolitan Council (2018) reported that outside of downtown Minneapolis,
new developments of $2.9 billion have been announced, under construction, or in use along the Green
Line corridor by February 2018. New development induces more people to travel to and from this area.

3.2.3 Models without control variables

We also estimated the effects of the Green Line on AADT using models without controlling for
confounding variables. These models illustrate the magnitude of omitted variable bias. The effects of
the Green Line would be substantially overestimated if we did not account for the influences of the
confounding variables. As shown in Table 4, the estimated reduction in AADT in the after-opening
period is 35.8%, which almost doubles the effect (18.2%) when controlled for the confounding variables
(Table 3). Therefore, when quantifying the independent effect of rail transit on vehicular travel demand,
it is necessary to include confounding variables in the model to account for their influences.

 15
Table 4. Model Results without Controlling for Confounders
 Model 1 Model 2
 Variable Relative Relative
 Coefficient P-value Coefficient P-value
 Change (%) Change (%)
 Opening 0.10 0.038
 × -0.44 0.000 -35.81
 LRT 0.41 0.000 0.41 0.000
 × -0.46 0.002 -37.12
 × -0.41 0.002 -33.38
 Year1516 0.30 0.000
 Year1718 -0.04 0.410
 Constant 5.89 0.000 5.89 0.000
 Dispersion Factor 0.8204 0.8294
 Pseudo Adjusted R2 0.0003 0.0013
 Sample Size 2718 2718

3.3 LIMITATION

This research has some limitations that are avenues for future research. First, although AADT illustrates
where individual trips aggregate in the transportation network, it cannot show when the trips occur.
Therefore, we are unable to examine the effect of rail transit on traffic congestion. Future research
could use travel speed of road segments to compute congestion time and use it as the dependent
variable. However, the concern remains regarding how to choose critical travel speeds for different
types of roads, such as principal arterials and local roads. Secondly, because of a lack of archived data,
we could not include information on regional road construction projects in the models, although it is
desirable to capture their influence on AADT. Third, we used four years of data to examine the effect of
rail transit over time. While four years may be adequate to capture the influence of induced traffic and
triple convergence, it takes a much longer time to observe the effect of induced development.
Therefore, future studies should test the dynamics of rail transit effects over an extended time frame.

 16
You can also read


