THE ECONOMIC VALUE OF REGIONAL STRATEGIES TO IMPROVE TRANSPORTATION OUTCOMES
←
→
Page content transcription
If your browser does not render page correctly, please read the page content below
METROLINX

THE ECONOMIC VALUE OF REGIONAL
     STRATEGIES TO IMPROVE
  TRANSPORTATION OUTCOMES:
   MANAGED HIGHWAY LANE NETWORK
           AND TRANSIT USE
  ECONOMIC AND FINANCIAL PERSPECTIVE

         Background Paper to the
  Draft 2041 Regional Transportation Plan

          Prepared for Metrolinx
 by CPCS and David Kriger Consultants Inc.
                   2016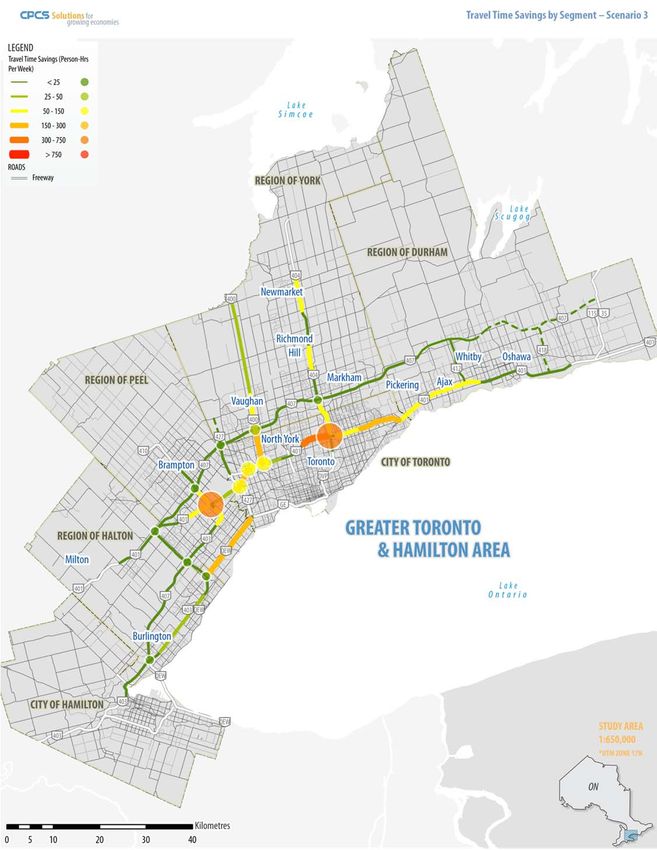
THE ECONOMIC VALUE OF
REGIONAL STRATEGIES TO
IMPROVE TRANSPORTATION
OUTCOMES
MANAGED HIGHWAY LANE NETWORK AND TRANSIT USE
ECONOMIC AND FINANCIAL PERSPECTIVE
FINAL REPORT

PREPARED BY

IN ASSOCIATION WITH

DECEMBER 2016 (REV.)
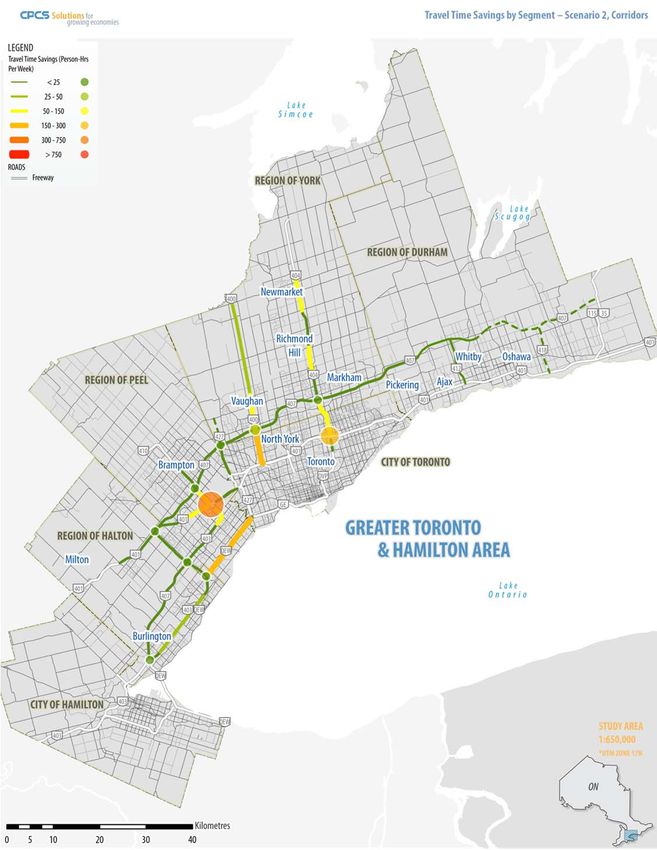
TABLE OF CONTENTS
1.0 Executive Summary ................................................................................................... 1
2.0 Introduction................................................................................................................. 5
3.0 Approach .................................................................................................................... 8
4.0 Network Description ................................................................................................. 14
5.0 Method for Estimation of Travel Time Savings ......................................................... 19
6.0 Definition of Network Options ................................................................................... 26
7.0 Estimation of Benefits ............................................................................................... 35
8.0 Sensitivity Tests ....................................................................................................... 53
9.0 Benefit Cost Analysis................................................................................................ 64
10.0 Financial Implications ............................................................................................. 68
11.0 Conclusions ............................................................................................................ 69

                                                                                                                          Page i
Acronyms
AADT              Annual average daily traffic
BBS / BSL         Bus bypass shoulders / bus shoulder lane
BCA               Benefit Cost Analysis
BT                Brampton Transit
CAP               Criteria Air Pollutants
EB, NB, SB, WB    Eastbound, northbound, southbound, westbound (directions of travel on expressway
                  lanes and interchange ramps)
Expressway        Controlled access, grade‐separated, high‐capacity and high speed highway
General purpose   Lanes that normally are open to use by all motorized traffic that is eligible to use an
lanes             expressway (some specific restrictions may apply ‐ e.g., height restrictions)
GHG               Greenhouse gas emissions
GO                GO Transit
GRT               Grand River Transit
GTHA              Greater Toronto and Hamilton Area
HOT               High Occupancy Toll (lane)
HOV               High Occupancy Vehicle (lane)
HSR               Hamilton Street Railway
IC                Interchange (on expressways)
KPH               Kilometres per hour (speed)
ML                Managed Lane
MT                Mississauga Transit (MiWay)
NPV               Net present value
OD                Origin‐destination (survey)
P‐HR              Person‐hours (time savings)
PKT               [Transit] Passenger‐kilometres travelled
TTC               Toronto Transit Commission
TTS               Transportation Tomorrow Survey
VKT               Vehicle‐kilometres travelled
YRT               York Region Transit

                                                                                                    Page ii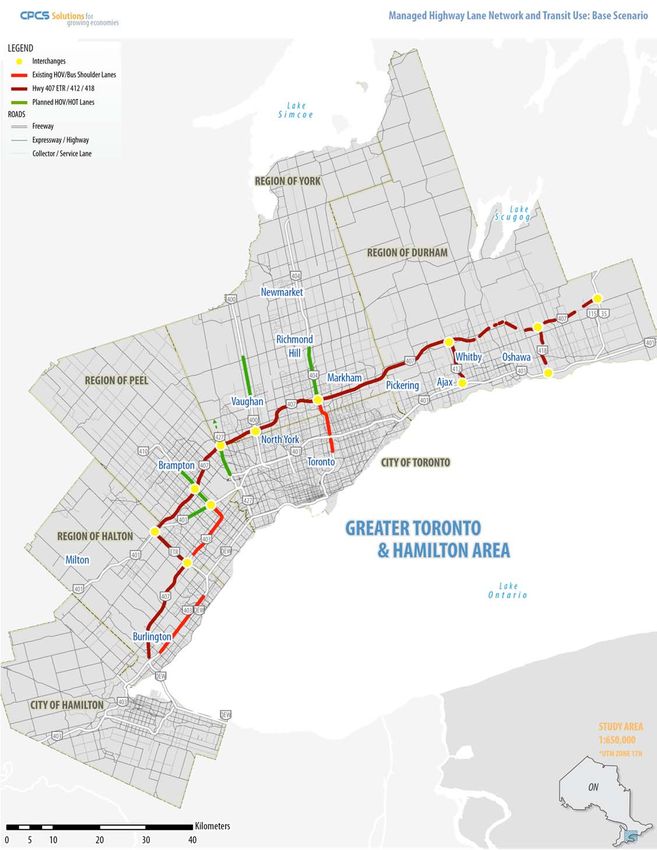
1.0 EXECUTIVE SUMMARY
Overview
This analysis investigates the potential economic value of a network of managed lanes on the Greater Toronto and
Hamilton Area’s (GTHA’s) freeways. The investigation comprised a benefit-cost analysis (BCA) and a financial
impact analysis. The investigation focused on the transit impacts of the managed lanes, thereby distinguishing
itself from, and complementing, other managed lane impact analyses that are being conducted by the Ontario
Ministry of Transportation (MTO). The analysis demonstrates how the transit benefits could add to benefits
experienced by other managed lane users.
Key Findings
Many studies have examined the potential benefit of managed lanes for auto users. This focus is reasonable, given
that auto users are the primary users of the highway network. At the same time, little is said about the benefits of
managed lanes to other users, notably transit.
This study reviewed the potential benefits of several scenarios of managed lane networks for transit users on the
GTHA’s expressways. The study found clear benefits to transit users and operators of routes that currently use the
expressways, because of reduced and more reliable journey times when general purpose lanes are converted to
managed lanes. Moreover, some new riders likely would be attracted from other modes, mainly from the auto.
By design, the study looked only at transit, given the paucity of transit-focused analysis. Further analysis would be
required to consider the impacts on transit benefits from the volumes of other traffic that would share the
managed lane under different operational or tolling schemes.
An assessment of the infrastructure requirements for the different network scenarios was not within the scope of
this study. Nonetheless, it is unlikely that the transit benefits alone could offset the annualized lifecycle costs of
new managed lanes (construction, operations and maintenance), should new infrastructure be required.
Accordingly, the transit benefits should be viewed as incremental benefits that should be added to those derived
from other managed lane users, such as carpoolers in an HOV scheme or even single-occupant vehicles under a
HOT lane regime. For newly constructed managed lanes, the benefits to transit users can add up to 16 basis points
(+ 0.16) to the benefit-cost ratio for multi-user managed lanes, as long as these lanes are designed to support a
high quality of transit service. As such, planners and policymakers should consider the potential benefits for transit
users when making decisions regarding policies, investments, and facility design and operations related to
managed lanes.
Definition of Scenarios
Four managed lane scenarios were examined:
Scenario 1 includes a base scenario (existing and planned managed lanes, and the Highway 407 ETR), plus
potential HOV / HOT initiatives being considered by MTO.
Page 1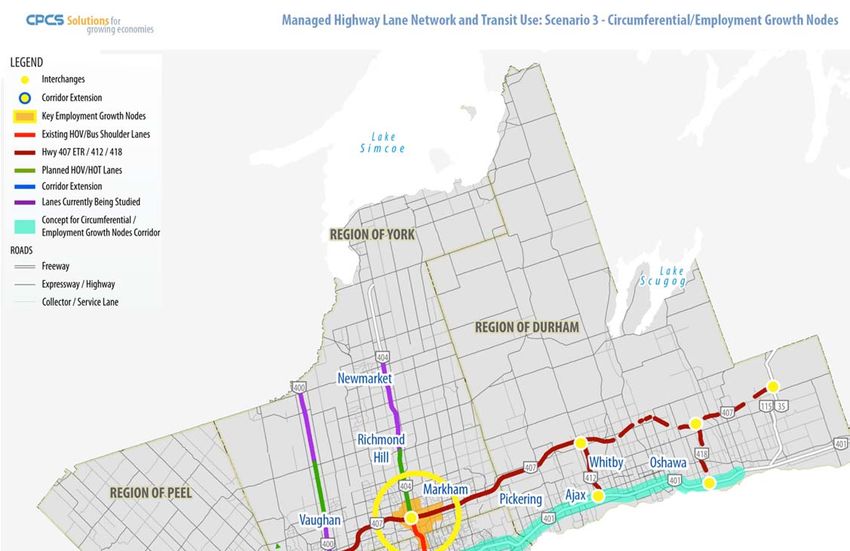
Scenario 2 extends Scenario 1 to make continuous corridors, with managed lanes implemented at two
strategic locations.
Scenario 3 extends Scenario 2 to develop a continuous, circumferential managed lane network that
provides suburb-to-suburb links, while connecting two key suburban employment growth clusters.
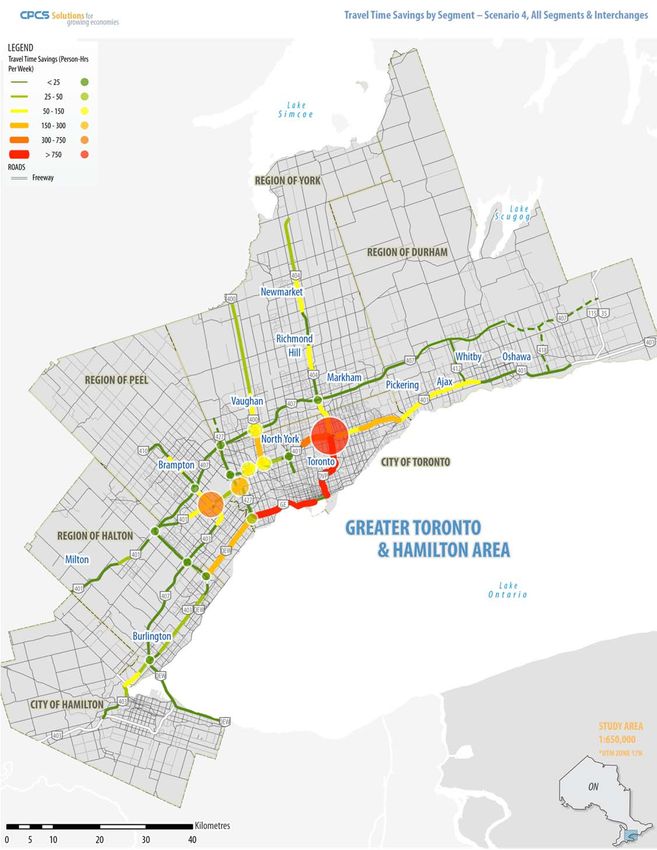
Scenario 4 assumes a continuous managed lane system across the entire GTHA expressway network.
Approach
The analysis was based on estimates of transit travel time savings that could be gained through the
implementation of managed lanes on the 400-series highways as well as the Don Valley Parkway and the Gardiner
Expressway. These savings were derived from GPS-based travel time data that were provided by GO Transit from
its buses. Specifically, achievable time savings were estimated by comparing actual travel speeds and target free-
flow travel speeds. GO travel time data from the 2015 PanAm / Parapan Am Games temporary HOV lanes were
used to calibrate projected time savings, specifically by accounting for the impacts of managed lane length and
discontinuity by applying a merge penalty to reflect delays incurred by buses entering and leaving the lane from
and to mixed traffic. The analysis differentiated travel time savings by time of day, thereby accounting for
congested conditions.
By design, the scope of this analysis did not include carpooling, focusing instead on transit. Nor is this analysis
intended to consider alternate structures and regimes for a managed lane structure, again by design and scope.
However, the aforementioned GO Bus gains, on which this analysis is based, were observed in managed lanes that
mostly were shared with HOV3+ vehicles. Further analysis, beyond the scope of this study, is required to assess the
impacts of alternate managed lane structures on bus travel time savings (e.g., HOT versus HOV usage, or an
HOV2+ regime, and so on).
GO Transit services make up the large majority of eligible bus routes. Where municipal transit agency data were
not available, the GO-generated travel time savings and characteristics such as occupancies were also applied to
the expressway portions of bus routes operated by municipal authorities (Brampton Transit, Mississauga Transit,
TTC and York Region Transit).
The travel time estimates were applied to existing ridership and bus volumes on the eligible routes, in order to
derive vehicle-hours and passenger-hours of savings. Population and employment forecast factors were used to
generate ridership forecasts to 2031. In order to account for the potential attraction of the improved services, an
elasticity of demand with respect to travel time was applied, using an elasticity value of 0.5, as derived from the
literature.
Benefits and Costs
The benefits for each scenario were expressed in terms of travel time saved by transit passengers, accounting for
both existing bus riders and new riders who are attracted from other modes to the improved transit service. Also
taken into account were savings in operator costs and external benefits relating to decongestion, reductions in
traffic accidents, reduced GHGs and reduced CAPs (where the external benefits arise from the diverted new riders
who almost entirely formerly use personal autos). All benefits were monetized for input to the BCA, using values of
time developed by Metrolinx. The BCA covered a fifteen-year period, from 2017 (the first year) through 2031.
Page 2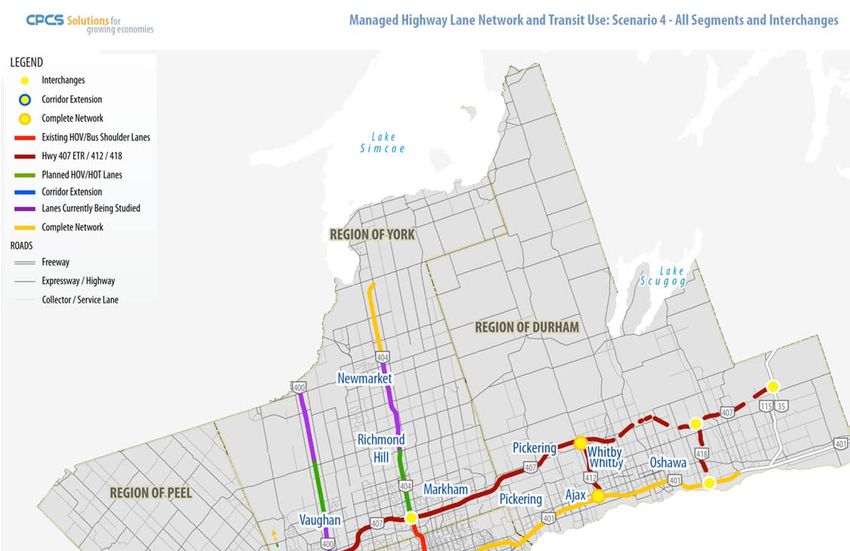
It was recognized that some expressway sections and interchanges have significant geometric, structural or other
existing constraints that limit the type of managed lane that actually could be implemented, or which in practical
terms would preclude the introduction of a managed lane altogether. It also was recognized that some constraints
could be addressed although only at a high, undetermined cost and/or at some undefined time in the future.

Because of the uncertain feasibility of many expressway segments, these geometric and structural constraints were
set aside in order to develop meaningful scenarios for the BCA. Instead, the consultant developed high-level, per-
kilometre “representative” capital and maintenance costs estimates, based on the available information. These
estimates were deemed sufficient for the purpose of this analysis, while acknowledging that the estimates are
generic and that detailed analyses would be required to support the implementation of a lane on any specific
segment.

It should be noted that the scenarios were modelled on the basis of existing bus routes, adjusted for projected
general population and employment growth. Note also that although most of the daily travel time benefits occur
during the two commuter peak, a significant benefit does occur during the midday peak – i.e., the benefit is not
just limited to commuter peak periods. Detailed projections of future bus route networks – for example,
accounting for a potential shift from radial to circumferential bus routes accompanying the implementation of
regional express rail – were not available for this study. Similarly, the elasticity of demand with respect to travel
time is applied to current route configurations. Moreover, it is conceivable that the travel time savings could
increase as highway and road congestion grows across the GTHA. Finally, it can be anticipated that GO Transit and
other transit agencies may adjust their entire networks to make better use of corridors with managed lanes;
however, such shifts are not modelled in this study. The study results may thus represent a conservative estimate of
bus-associated benefits.

A financial case also was developed.

Conclusions

The benefits and costs are compared for each of the four scenarios in Table ES1 below. As noted, only transit
benefits are considered (i.e., no benefits from other potential managed lane users, such as HOT single occupant
vehicles or HOV multi-occupant vehicles), whereas the full annualized lifecycle costs are assessed, assuming new
infrastructure is required. As a result, the benefit-cost ratio remains below 0.2 for each of the scenarios, although
the benefit/cost ratio grows as the expansiveness of the network increases because of the “network benefits”
associated with corridor continuity. This suggests that constructing a network of new managed lanes purely for
bus-associated benefits would not be economically justified, and so the transit benefits are best viewed as an
increment that should be added to those that would accrue from other users, such as carpoolers or HOT users. In
this case, the benefits listed in the table below would supplement any other benefits to non-bus riders.
Furthermore, the cost figures provided in the table apply to the case of new lane construction (i.e. roadway
widening). If managed lanes are implemented in such a way as does not require new lane construction, the
benefit-cost ratio may be more favourable to managed lanes, although such a scenario is not considered in this
study and would have to take into account travel time impacts on other displaced users.

                                                                                                              Page 3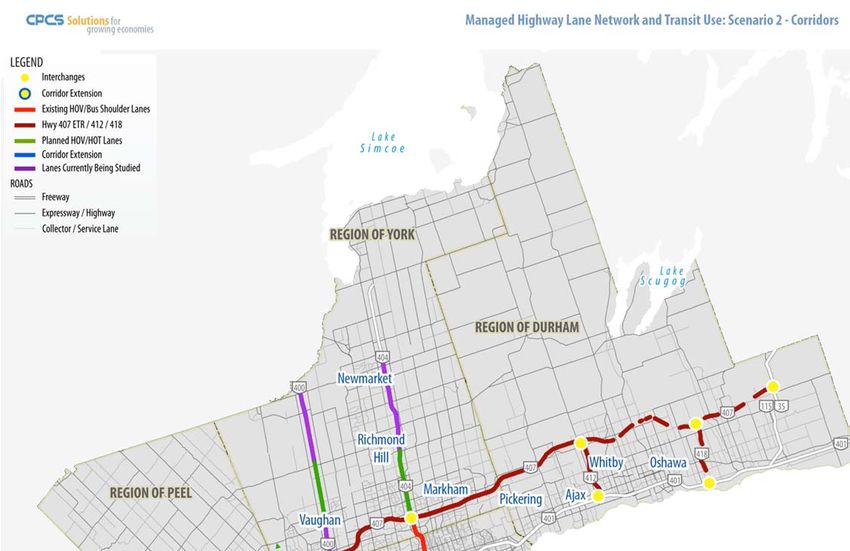
Table ES1: Benefits and Costs by Scenario

                              Kilometres           NPV Benefits to          NPV Costs to              B/C Ratio
                                                       2016                    2016

Scenario 1                              352              $34,985,486           $281,474,635                 0.12

Scenario 2                              377              $40,672,552           $314,770,447                 0.13

Scenario 3                              545              $89,110,005           $534,851,816                 0.16

Scenario 4                            1,066            $203,604,524          $1,220,916,629                 0.16

Note: Only transit benefits are considered, against full annualized lifecycle infrastructure costs.

Many studies that have examined the potential benefit of managed lanes have focused on the benefits for auto
users. The usual focus on auto users is reasonable given that those users are the primary users of the road network.
This study reviewed the potential benefits of a network of managed lanes for transit users in the GTHA and found
that the benefits to transit users can add up to 16 basis points to the benefit-cost ratio. As such, planners and
policymakers should consider the potential benefits for transit users when making decisions regarding policies,
investments, and facility design and operations related to managed lanes.

                                                                                                                  Page 4
2.0              INTRODUCTION
Background

CPCS and DKCI have been retained by Metrolinx to investigate the potential economic value of significant changes
in transportation outcomes as well as the marginal impacts that discrete interventions/strategies would have in
accomplishing these outcomes. As a whole, the research includes four broad types of interventions/strategies:
managed highway lanes, cycling, surface transit amenities and frequent transit corridor improvements.

Objectives

The overall objective of the research is to contribute to the understanding of the relative values of different
outcomes and how to prioritize investment strategies to achieve these outcomes through the identification of
effective goals and support interventions. The research follows the approaches prescribed in Metrolinx’s Business
Case Development Handbook. However, it differs from a ‘standard’ business case in that it does not propose a
specific program or infrastructure. Hence the research focuses on the Economic and Financial cases. As described
in the Metrolinx Handbook, these cases consider the economic impact and the financial implications of the
initiative, respectively. Other components of a ‘standard’ business case accordingly are not considered.

Project Structure

The project is being developed in two parallel phases. Phase 1 investigates the financial and economic implications
of managed highway lanes and cycling interventions/strategies.1 Phase 2 investigates the financial and economic
implications of surface transit amenities and frequent transit corridor improvements. Each phase is broken into the
following four steps with associated deliverables, as shown in Figure 1.

Figure 1: Approach – Economic Value of Regional Strategies to Improve Transportation Outcomes

1
    Note that these are two separate analyses that are conducted within the same Metrolinx project, using the
    same basic approach but having different inputs and methods.

                                                                                                                  Page 5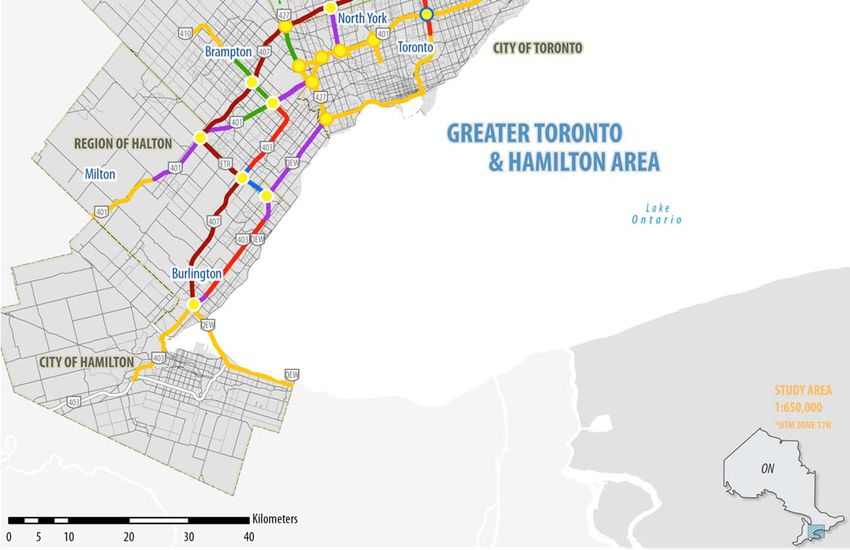
Organization of this Report

This Draft Final Report describes the managed highway lanes analysis.2 The report corresponds to Step 4 of the
project approach.

The report is organized according to the structure used for Metrolinx’s Initial Business Case studies,3 modified to
meet the focus of this project as described in the Objectives section above. It has eleven chapters:

    1.  Executive Summary
    2.  Introduction (this chapter)
    3.  Approach, including key assumptions, parameters, data sources and methodological basis
    4.  Description of the existing and potential future managed lane network
    5.  Method for estimating travel time savings
    6.  Definition of network options (scenarios) for testing
    7.  Estimation of benefits, covering travel time savings, incremental ridership and monetary benefits (value of
        time)
    8. Sensitivity tests
    9. Benefit cost analysis
    10. Financial implications
    11. Conclusions

A spreadsheet, which tabulates the data and the models and calculations upon which this report is based, is
provided under separate cover.

What is a Managed Lane?

For the purposes of this analysis, a “managed lane” is defined as a lane, generally on an expressway, on which
special access restrictions are imposed in order to provide priorities to certain types of traffic. The object is to
improve the overall flow – that is, travel times and variability of the travel time - of expressway traffic. In most
cases the managed lane is intended to operateat a higher speed (and with fewer vehicles) than general purposes
lanes, although truck-only lanes might not operate at a higher speed but the primary benefit would come from the
separation of trucks from automobiles and other vehicles. Depending on the type of managed lane, eligible traffic
can include public transit vehicles, personal vehicles having a minimum number of occupants, single-occupant
personal vehicles whose drives are willing to pay a toll and, in some cases, commercial vehicles.

Managed lanes have become an important component in increasing throughput and the performance of transit
services on highways in many urban areas across North America and beyond. In the GTHA, GO Transit and several
other municipal transit agencies operate scheduled bus services on the region’s expressways – here defined as the
400-series Provincial highways and municipal expressways such as the Don Valley Parkway (DVP) and the Gardiner
Expressway. In the GTHA, these facilities have taken the form of High Occupancy Vehicle (HOV) Lanes, Bus
Shoulder Lanes, dedicated bus-only lanes adjacent to Highway 403 (Mississauga Transitway), and the use of the
407 ETR to increase the speed and reliability of services.

Temporary HOV lanes were introduced on selected GTHA expressways as part of the traffic management schemes
for the 2015 Pan Am / Parapan Am Games. GO Bus users experienced significant reductions in journey times and in
the variability of their trips through many (although not all) of these HOV lanes. The experience of the PanAm

2
    The other three analyses are documented separately. They are not considered further in this report.

3
    Business Case Template, Initial Business Case, provided by Metrolinx, March 2016.

                                                                                                             Page 6
Games suggests that transit users on local buses and GO buses that operate on GTHA highways could see
significant benefits from enabling buses to operate in lanes managed to be congestion-free. The Ontario Ministry
of Transportation (MTO) is now planning to introduce High Occupancy Toll (HOT) lanes, which allow single-
occupant vehicles to use HOV lanes with the payment of a toll.
Note that this analysis focused on transit benefits only, by design. These benefits would complement those
accrued by other users who might share the managed lanes. These users could include multi-occupant vehicles
under an HOV scheme and single-occupant vehicles under an HOT regime.
Managed Lanes Working Group
A special Working Group was convened in order to provide guidance to the analysis, review assumptions and
method, coordinate and provide data, and review the outputs and reports. Importantly, the Working Group also
served as a forum to ensure that the managed lane analysis complemented and did not duplicate work in which
MTO is currently engaged regarding managed lanes.
The Working Group comprised members of several Metrolinx groups and MTO offices:
Metrolinx – GO Planning
Metrolinx - Regional Planning
Metrolinx – Planning Analytics
GO Transit (Metrolinx) – Business Systems
MTO – Passenger Transportation Office
MTO – Transportation Economics Office
MTO – Systems Analysis and Forecasting Office
Four Working Group meetings were held. They were staged strategically to introduce the project and the method
(held on March 29, 2016), discuss proposed assumptions (May 18, 2016), review the preliminary analysis and
scenarios (June 14, 2016) and review the final analysis and the interim Technical Memorandum (August 4, 2016).
The consultants wish to express their appreciation to Metrolinx and to the members of the Working Group for their
inputs, guidance and direction over the course of the study.
The primary authors of this report were David Kriger of DKCI and Veiko Parming of CPCS, under the direction of
and with contributions from Vijay Gill of CPCS. This report does not represent any official policy or position of
Metrolinx, MTO or GO Transit.
Page 73.0 APPROACH
Objective
This chapter documents the approach and method for using benefit-cost analysis (BCA) to identify opportunities
where managed highway lanes could benefit transit users in the GTHA, as well as the magnitude of benefit.
The objective of the analysis is to understand the potential economic value to transit users and agencies of being
able to operate transit services on congestion-free managed lane facilities across the 400-series highways in the
GTHA and on some City of Toronto expressways.
The BCA uses a Metrolinx template that is common to other initiatives. As noted, the BCA focuses primarily on the
economic case, although a high level financial case also is documented in Chapter 10.0.
The economic value is derived from three types of outcomes:
Benefits to existing transit users – the direct impacts to existing transit users associated with a reduction in
journey times and improvements to journey time reliability.
Benefits to new transit users – the direct impacts as a result of new transit users attracted to the reduced
journey times and increased reliability of transit services on highways, including reduced auto operating
costs, improved safety, reduced emissions and road congestion.
Benefits to transit operators – the direct impacts of improved travel times, reliability and changes in
ridership on vehicle operating costs and revenues.
The analysis also considers several types of costs. These comprise the costs associated with delay greenhouse gas
(GHG) emissions, Criteria Air Pollutants (CAPs), fuel use, traffic accidents, vehicle operating costs and passenger
delays. Most of these appear as reductions. However, a high-level, generic cost for new infrastructure also is taken
into consideration. These are discussed in Chapter 7.0.
Premise
GO Transit and many other municipal transit services operate on the Ontario highway network. The province has
committed to implementation of HOT Lanes across the 400 series highways. The experience from the PanAm
Games suggests that transit users on local and GO buses that operate on 400-series highways could see significant
benefits from reduced congestion on managed lanes.
Problem Statement
What is the potential economic benefit of congestion-managed lanes (HOT, HOV, tolled, etc.) on highways in the
GO Transit service area that are designed to support existing/increased transit service? It is recognized that there
are potential broader benefits; however, the focus of this analysis is on transit because that part of the equation is
relatively unexplored. The paper will recognize the potential impacts to other users as well, but the focus of this
assignment will be on impacts to transit users and agencies.
Page 8Key Assumptions and Parameters
The analysis was based on several assumptions and parameters:
The intent of the analysis is to develop scenarios that are realistic while allowing for flexibility.
The research focused on the benefits to transit users. Costs were based on high-level unit costs and the
feasibility of different interventions in each corridor segment, in consultation with the Managed Lanes and
Transit Working Group. The costs are described in Chapter 7.0.
The term “managed lane” is not necessarily intended to refer to any specific improvement, other than to
refer to an expressway lane that allows for free-flow travel by transit buses. Thus, truck-lane only lanes,
which are a type of managed lane, are not considered in this study.
The managed lane network options were defined at a high level. All Provincial expressways and key
municipal roadways, such as the Don Valley Parkway and the Gardiner Expressway, were assumed to be
eligible. The network was defined simplistically; that is, as connections between interchanges. Unless an
obvious constraint was identified that would preclude the use of a section as a managed lane (e.g., a
physical constraint between two interchanges), it was assumed that transit vehicles can enter or exit the
managed lane at any interchange.
Free flow speeds can vary depending on the configuration and length of the managed lane. For the
purposes of this analysis, a single free flow speed was defined as a starting point, with possible
subsequent variations to allow for the type of managed lane. The free-flow speed was determined using a
segment-specific data-driven approach, as discussed in Chapter 5.0.
GO Transit is by far the primary transit user of the existing managed lanes. However, several municipal
transit operators also offer a limited number of services that use the existing managed lanes. These are the
TTC, Brampton Transit, Mississauga Transit and York Region Transit. Their routes also are included in the
analysis. Note that only services (routes) within the GTHA are included in the analysis.
Only transit services (routes) that currently use the expressway system are considered as candidates for
using the managed lane system, and it is assumed that these routes would use a managed lane if one is
available. No reconfiguration of other routes is assumed, with one exception: it is assumed that GO Transit
routes that formerly used the former Highway 7 in Durham have switch or will switch to the newly-opened
Phase 1 extension of the Highway 407 ETR East and also to Phase 2, which is scheduled to open partially in
2017 and completely in 20204.
The analysis is based upon observed data, trends and rates. It uses a spreadsheet, so as to allow quick
updates in the event that a particular parameter value changes. The need to consider the short term and
the focus on individual corridors and on services that have a relatively small mode share mean that the
required analysis is too fine-grained to use the GGH model. Instead, an ‘evidence-based’ approach was
deployed; that is, relying on observed conditions on individual corridors.
4
Phase 1 opened to traffic on June 20, 2016. No information is available yet regarding the treatment of existing
GO Bus service along this corridor.
Page 9 Given that the increase in ridership due to the improved travel conditions in managed lanes is modest
(expected to be less than 10% increase under most conditions), this would generally not require additional
transit vehicles on any route and thus this approach assumes transit headways to remain as they were
prior to the introduction of managed lanes. The overall approach will slightly understate the benefits to
auto drivers in the general purpose lanes given that the remaining volume of traffic will be reduced due to
mode shifting to transit, leaving aside the issue of induced traffic demand.
The ultimate time horizon is assumed to be 2031. Simple growth factors are developed from existing
demographic, employment and travel forecasts, as available from MTO and Metrolinx. The growth factors
assume the Places to Grow population and job distributions.
The research is based on weekly totals, which are extrapolated to annual values for the BCA, by
multiplying by 52 weeks. Time period data from GO Transit and the individual municipal operators were
used to identify commuter peak period and off-peak period average travel speeds, bus service levels and
bus occupants, in order to differentiate conditions by time of day.
Ultimately, the network analysis should aim to identify where providing a congestion-free lane would offer
the greatest benefit to transit users and agencies.
The benefits to transit users are separated into two groups. The first group considers benefits to current
riders. The second group considers benefits resulting from new riders (i.e. diversion of auto trips and the
associated impacts).
The diversions were estimated from elasticities of demand from elsewhere and from the consultants’ and
working group members’ experiences. The elasticities were reviewed to ensure that they reasonably could
be applied to the GTHA.
The reporting for this analysis is being produced for both a technical and a non-technical audience, using
a clear layout and plain language. All assumptions, methodologies and data are stated clearly and
transparently.
Throughout the course of the analysis, key assumptions and research parameters were discussed and
agreed with the Working Group.
Data
The following data were used for this analysis:
GO Bus CAD/AVL Data – primarily for identifying highway segment speeds, ridership, vehicle-kilometres
and fleet requirements / frequencies. These data include ‘with-and-without’ analyses of GO Bus services
on the temporary managed lanes that were put in place for the 2015 PanAm / Parapan Am Games.
Similar tabulations for selected municipal transit routes, provided by Brampton Transit, Mississauga Transit
(MiWay), the Toronto Transit Commission (TTC) and York Region Transit.
PanAm OD Survey Reports – primarily for checking reasonableness of mode shift / elasticity assumptions
as well as contextual information to help interpret analysis.
Page 10 GO Bus Passenger Survey Data and Summary Report – strategic and contextual information for describing
the socio-economic characteristics of bus users, trip purposes and markets served.
GIS files of GO and municipal transit service provider routes, from the respective agencies.
Other reports and data, notably the 2011 Transportation Tomorrow Survey (TTS), were consulted for reference or
context.
The provision of these data sets to the consultant is acknowledged with appreciation, with a special thanks noted
regarding the provision the GO Bus data and the municipal operators’ data, which all required special tabulations,
and for the GO Bus survey data, which similarly required special preparation. Note that the data were used as-is;
that is, the scope of the analysis precluded any detailed review of the data sets.
Methodological Basis
The benefit-cost analysis uses Metrolinx’s template. Accordingly, the key challenge of this analysis was to derive
appropriate and meaningful inputs and assumptions. The methodological approach had the following tasks:
Define key terms and assumptions: for example, “free flowing speeds.”
Identify the relevant (eligible) GO Transit and municipal bus routes that currently use the 400-series
highways, the Gardiner Expressway and the Don Valley Parkway.
Define network options to be tested. Scenarios were developed in consultation with Metrolinx and the
Managed Lanes Working Group, taking into consideration the different managed lane options (HOV, HOT,
Bus Shoulder Lanes, etc.), highway segment constraints that may impact feasibility, highway ownership,
delivery and operating considerations and the relationship to other on-going highway programs and
initiatives. These scenarios are described in Chapter 6.0.
Use GPS travel time data gathered by GO Transit during and prior to the introduction of temporary HOV
lanes during the PanAm and Parapan Am Games in the summer of 2015, in order to estimate [a] changes
in journey time, from end-to-end (i.e., not just the HOV leg of the journey) and [b] changes in trip time
variability (focusing on the HOV leg), hence in trip reliability. We also used GPS data from GO Transit and
the municipal transit operators to define current characteristics.
Estimate the current travel demand (ridership) for the relevant ‘markets’ served by the individual GO Bus
and municipal routes, GO Bus on-board surveys, GO Bus boarding and alighting data, data from the
municipal transit operators and other relevant data. This generated the “base” demand.
Develop a spreadsheet that contains the data and formulae for all the above steps. This allowed each
applicable route and bus run to be tagged with the appropriate highway section, so that individual
sections could be easily switched on and off if a managed lane was added in a given scenario. Note that a
travel demand network model was not intended for use in this analysis - that is, the assumed network
configuration was intended to be at a high level. (i.e., details of the precise configuration of the network,
its operation, locations of entry and exit points, etc., were less important or relevant.)
For each network option, establish the type and length of the relevant improvement – for example, 4.5
kilometres of an HOV lane on Highway 401 between X and Y. This was used to estimate the anticipated
Page 11travel time savings. It also identified sections to which the addition of an entry / exit penalty was needed,
recognizing that some shorter sections would not necessarily achieve their full potential due to
operational constraints.
Using values of time from Metrolinx’s current guidance, estimate how current transit riders benefit with a
managed lane network in place, using the GO Transit and municipal transit operators’ data to estimate the
current travel demand for the relevant ‘markets.’ Associated impacts also are estimated, as applicable, on
fuel use, GHG emissions, CAPs and traffic accidents.
Develop an elasticity of demand with respect to changes in travel time and reliability, using observed rates
from the consultants’ experience and elsewhere. This elasticity was used to estimate the potential mode
shift to GO Bus and potentially municipal buses, based on the assumed managed lane network options
(scenarios). Elasticities were used to estimate changes in ridership, for two reasons: [a] they are most
relevant to the scale of the analysis; and [b] a mode choice model is not available for this analysis in any
event.
Estimate the potential changes in transit ridership by applying the elasticity to the base demand,
according to each option, as well as the associated monetary benefit. The analysis also considered the
associated impacts on decongestion, GHG emissions, CAPs and traffic accidents.
Develop and apply growth factors to estimate forecasts to the 2031 horizon year, using system-wide
demographic or employment forecasts, or travel forecasts from Metrolinx’s GGH model. High level
assumptions regarding the future network, future levels of highway congestion and associated impacts on
bus speeds will be informed by existing GGH modelling outputs where possible.
Review the network options and the current and forecasted estimates of ridership and impacts to
determine the network option of greatest benefit, while also considering the locations within individual
options where the greatest benefits are achieved (e.g., the sections where the greatest travel time
reductions are achieved).
Consider the configurations that the network options could take, and – depending on the available data –
develop high-level cost estimates.
Prepare a benefit-cost analysis using the aforementioned high-level cost estimates, and accounting for the
GHG, CAP, fuel use and other benefits. As noted, the focus will be on an economic BCA, with a high level
financial BCA also being conducted, within the context of Metrolinx’s Business Case Framework. (Note that
the feasibility of conducting this analysis will depend on the usability of the findings of the previous step.)
Conduct sensitivity tests to test the robustness of key factors and assumptions regarding the growth
factors, values of time and/or elasticities, and how they impact the cost, revenue and diversion analysis.
Integrate the findings into Metrolinx’s template and report the findings.
Relationship With Other Studies and Tools
The literature allows for different approaches for benefit-cost analyses of transportation improvements, including
network travel demand forecasting models, such as the one developed by MTO for the Greater Golden Horseshoe.
The approach selected for this analysis is tailored to the scope and scale of the expected transit user and operator
Page 12benefits. The approach takes advantage of the availability of unique short-term ‘before and after’ data from the
PanAm / ParaPan Am Games HOV lanes. For all these reasons, a network travel demand forecasting model was not
used for this analysis.
Other stakeholders might have an interest in assessing a broader range of impacts, according to their needs, and
may wish to use a network travel demand forecasting model or other analytical approaches to meet their needs.
For example, MTO and the City of Toronto are conducting managed lanes analyses of their own. The specific
transit focus of the current initiative and its analytical basis are designed explicitly to complement these other
analyses. However, it is important to acknowledge certain other benefits and costs that are not included in the
current initiative:
There may be additional benefits (and costs) associated with transit services that connect to the buses that
use the managed lanes, if their efficiency improves or if additional local bus service is required to meet
increased demand of the express services.
Reduced auto operating costs and reduced congestion are cited in the Chapter 3.0 Objectives as benefits
to new transit users. However, there also can be time and cost benefits to auto users who do not switch
modes, if more efficient bus service allows for the better flow of automobiles on the managed lane
corridors and the network. The time benefits to auto users can be substantial. In general, there can be
both positive and negative impacts to other highway users. The analysis does consider positive benefits
(specifically, decongestion); however, negative benefits are not considered because these would depend
on specific interventions (see Chapter 9.0).
There also may be benefits for commercial / truck traffic alongside auto users.
Page 134.0 NETWORK DESCRIPTION
Introduction
This chapter describes the components of the existing managed lane system in the GTHA. It also notes planned
and potential managed lanes that are now under study. The chapter also inventories the bus routes that use the
GTHA’s expressway system currently.
This information was used to define and assemble the necessary data and to develop the scenarios for analysis.
Inventory of Managed Lanes
Existing
HOV lanes exist today on Highway 403 in Mississauga, Highway 404 in York Region and Toronto and the QEW in
Burlington and Oakville.5
Highway 403 EB – from west of Winston Churchill IC to Matheson Blvd E (approach to Highway 401 IC).
Highway 403 WB – from south of Highway 401 / 410 (north of Matheson Blvd E) to approach to Winston
Churchill IC WB off-ramp.
Highway 404 SB – from north of Highway 7 to the DVP.
Highway 404 NB – from north of Van Horne Ave (north of Sheppard Ave E IC) to north of Highway 407
ETR (to Highway 7 IC NB off-ramp).
QEW EB – from Guelph Line IC to Trafalgar Road IC.
QEW WB – from Trafalgar Road IC to approach to Guelph Line WB off-ramp.
Temporary HOV Lanes for the PanAm / Parapan Am Games
Several temporary HOV lanes were implemented on Provincial and City of Toronto expressways from late June to
mid August 2015, as part of the traffic management scheme for the 2015 Pan Am / Parapan Am Games. Even
though the lanes no longer are designated for HOV, the Games HOV initiatives are noteworthy for the transit
Managed Lanes study because of the observed benefits they offered to GO Bus trip times. The temporary HOV
lanes were located as follows:6
Don Valley Parkway NB and SB – between Dundas Street E and York Mills Roads.
Gardiner Expressway EB and WB – between Highway 427 and west of York Street.
Highway 401 EB and WB – between Warden Avenue and Westney Road.
5
Source: http://www.mto.gov.on.ca/english/traveller/trip/map.shtml
6
Source: https://www.ontario.ca/page/pan-amparapan-am-games-transit-driving-and-traffic-routes#section-1
Page 14 Highway 401 WB – from Highway 427 to Kennedy Road.
Highway 427 NB and SB – between Highway 401 and terminus at QEW/Gardiner.
QEW EB and WB – between Brant Street in Burlington and Highway 427.
HOT Lanes
In December 2015, MTO announced its intention to convert the existing QEW HOV lanes to High-Occupancy Toll
(HOT) lanes, as a pilot to test the HOT concept. The announcement also noted that HOT lanes would be introduced
on a section of Highway 427 starting in 2021, as part of “broader HOT lanes implementation.” The proposed HOT
sections are as follows:7
QEW EB and WB – between Guelph Line and Trafalgar Road (replacing existing HOV lanes, as above) – to
be implemented in the summer of 2016.
Highway 427 NB and SB – from south of Highway 409 to north of Rutherford Road, starting in 2021. Note
that the section of HOT lanes between Highway 7 and Rutherford Road will be on the Highway 427
expansion to Major Mackenzie Drive, the tendering for which is now underway.
Bus Lanes on Shoulders
Bus bypass lanes (BBL) exist in two locations today:
Mississauga Transit (MiWay) and MTO introduced Bus Bypass Shoulders (BBSs) on Highway 403 in 2003,
between Erin Mills Parkway and Mavis Road. The BBSs have saved up to 10 minutes per trip during peak
times.8
BBLs were introduced on the shoulders of the Don Valley Parkway in 2010, between Lawrence Avenue and
a point 458 metres (approximately 1,500 feet) north of York Mills. The BBLs are open to use by GO Buses
only.
Buses can use the BBLs only when traffic on the general purpose lanes is travelling at 60 kph or less. Note that for
reasons of traffic safety, once on the BBL, they cannot travel at speeds faster than 20 kph greater than that of the
general purpose traffic – meaning the speed on the BBL cannot exceed 80 kph.
Note that the Highway 403 BBLs co-exist with a section of the aforementioned HOV lanes, and GO Bus operators
use the HOV for most trips, except during slow traffic conditions, when they have the option of using the BBLs.
7
Source: https://news.ontario.ca/mto/en/2015/12/ontarios-plan-for-high-occupancy-toll-lanes.html
8
Source: http://www.mississauga.ca/portal/residents/brtbasics?paf_gear_id=9700018&itemId=102600573n
Page 15Planned HOV Initiatives
MTO’s Southern Highways Program 2015-2019 identifies several GTHA HOV initiatives that the Ministry plans to
implement or are now underway. As can be seen in Table 1, four initiatives are new HOV lanes on Highways 400,
401 and 410, one is an extension of the existing Highway 404 HOV lanes, and one is the introduction of a new HOT
lane on Highway 427.
Table 2 lists four potential future (post-2019) HOV expansions that might be considered for future development.
Two are on Highway 400 in York Region, and the other two are on Highway 403 and the QEW in the City of
Hamilton, Halton Region and Niagara Region. None of these initiatives has status currently. All are subject to
further study and prioritization.9
Table 1: Planned HOV Initiatives
Highway Status Location Type of Target
Work Completion
Date*
400 Underway Major Mackenzie Drive to King Road, York Region New HOV 2019
401 Underway Hurontario to Credit River Bridge, Peel Region New HOV 2018
401 Planned Credit River Bridge to Regional Road 25, Halton New HOV Beyond 2021
and Peel Region
404 Planned Highway 407 ETR to Stouffville Road, York Region HOV 2021
expansion
410 Underway Highway 401 to Queen Street, Peel Region New HOV 2018
427 Underway Highway 409 to Rutherford Road, York Region New HOT 2021
* The timing of projects in the following lists is subject to change based on funding, planning, design, environmental approval,
property acquisition and construction requirements.
Table 2: Potential Future HOV Expansions
Highway Location
400 Langstaff Road to Major Mackenzie Drive, York Region
400 King Road to Highway 9, York Region
403 Brant / Hamilton boundary to Highway 403 / QEW interchange, City of Hamilton and Halton
9
Source: Southern Highways Program 2015-2019, Ontario Ministry of Transportation, 2015. See
http://www.mto.gov.on.ca/english/highway-bridges/pdfs/southern-highways-program-2015-2019.pdf.
Information updated per M Brewer (MTO) e-mail to consultant, August 5, 2016.
Page 16Region
QEW Highway 406 to Guelph Line, Niagara Region, City of Hamilton and Halton Region
Inventory of Bus Routes
Table 3 lists the existing bus routes that use the expressways for all or part of their itineraries. This list is important
for the estimation of ridership as well as for informing the development of the network options.
The list comprises GO Transit as well as the six municipal transit operators that are known to operate at least one
route on an expressway.
The list is detailed by expressway. Note that Highway 401 is divided into sections east and west of Yonge Street
(with one route – GO Route 92 – using both sections). Highway 427 is divided into sections north and south of
Highway 401.
GO Transit has by far the greatest number of eligible routes (25), which is consistent with its role as an inter-
regional carrier. Among the municipal operators, Mississauga Transit and York Region Transit have the greatest
number of eligible routes (10 and 9, respectively), followed by the Toronto Transit Commission (4) and Brampton
Transit (1).
Note that Grand River Transit operates two routes on Highway 401. However, these routes operate entirely within
the Region of Waterloo, and so it is not considered further. Hamilton Street Railway has one route that uses only a
short portion of the Red Hill Creek Parkway, and is not considered further.
It can be seen that the expressway network in the western GTHA (that is, west of Yonge Street), especially Highway
401, Highway 403, the Highway 407 ETR and Highway 427, support the greatest number of routes.
Table 3: List of Current Routes that Use Expressways
Highway GO BT * GRT HSR MT * TTC * YRT *
400 60, 66 360
401 (w of 19, 25, 27, 200, 203 ** 57, 70, 108 360
Yonge) 29, 34, 36,
38, 40, 47,
48, 60, 66,
92
401 (e of 51, 67, 88,
Yonge) 92, 93, 96
403 16, 19, 25, 109, 110
29, 40, 45,
46, 47
Page 17404 51, 67 320
407 20, 25, 29, 501A 77A, 300,
32, 36, 40, 301, 302,
45, 46, 47, 303, 304,
48, 51, 52, 760
54
409 34
410 32, 45, 46,
47
427 (n of 36, 40 501A
401)
427 (s of 11, 35, 57, 191, 192,
401) 70, 71, 76, 300A
108, 109
QEW 12, 16, 40, 4, 71
47
DVP 144
Gardiner 16 71
Red Hill 11
* List of routes for BT, MT, TTC and YRT provided by the respective operators.
** Operates on Highway 401 within Region of Waterloo only. No GRT routes operate within the GTHA.
Key: GO = GO Transit (bus), BT = Brampton Transit, GRT = Grand River Transit, HSR = Hamilton Street Railway, MT = Mississauga Transit
(MiWay), TTC = Toronto Transit Commission, and YRT = York Region Transit.
Segments for Data Assembly
The network descriptions and inventories were used to define ‘segments’ for the purposes of data collection and
analysis. Segments normally started and ended at managed lane start and end points or at interchanges. In some
cases, the segments combined groups of interchanges, if buses did not enter or exit the intermediate interchanges.
Over 100 segments were identified, and data were collected in each direction of the segments. As well, the 16
expressway-to-expressway interchanges were identified as separate segments, given their complexity and the fact
that some of these have geometrical or structural constraints that could preclude their ability to support a
managed lane.
Page 185.0 METHOD FOR ESTIMATION OF
TRAVEL TIME SAVINGS
General
Time Periods
To account for temporal variation in speeds and occupancy (loadings), the time savings were computed separately
for five time periods and then summed to yield daily totals. The time periods are defined in Table 4.
Table 4: Definition of Time Periods
Period Definition
AM Peak 6 AM – 9 AM
Midday 9 AM – 4 PM
PM Peak 4 PM – 7 PM
Evening 7 PM – 11 PM
Overnight 11 PM – 6 AM
Estimation of Travel Time Savings
The amount of time that travellers would theoretically save as a result of managed lanes is dependent on the
following factors:
The current travel speeds without the managed lanes (i.e. actual speeds)
The potential achievable travel speeds with the managed lanes (i.e. target speeds)
The number of buses on each highway segment
The occupancy of the buses
Actual Speeds
GPS travel speed data were obtained from GO Transit for all highway segments in the GTHA. The data were
retrieved for a one-week period in October 2015. October is commonly used as a representative month, given the
lack of anomalous factors influencing travel (school breaks, summer vacations, holiday travel patterns, winter
weather and so on). This study focuses on working weekday travel: the “week” was defined as Monday to Friday.
Since the data are from GO Transit, they represent actual bus trips, as distinct from trips by all highway vehicles.
Speeds were calculated using the recorded travel time and segment distances obtained from an accompanying
KML file. Anomalous (low) speeds were rejected a) if they were in the 1st percentile, or b) if they were under 10 kph.
The low speeds were likely caused by extreme incidents or by vehicles exiting and entering the highway within a
Page 19single segment, such as at park & ride lots (though in almost all cases the latter was controlled for through
segment definition). At the high end, speeds were rejected if they exceeded 120 kph, although anomalously high
speeds were not overall a significant concern.
Actual speeds were calculated as the average of all speeds over the week for a given segment, by direction and by
time period.
Target Speeds
Target speeds were initially set at the free flow speed (FFS), which was defined as the 95th percentile speed for the
directional segment (across all observations for the week). However, the target speed was reduced in some cases in
which the FFS seemed inflated compared to the average speeds achieved throughout the day.10 As well, for the
bus bypass shoulder lanes on Highway 403 and the DVP, the maximum allowable speed was set according to the
criteria defined in Chapter 4.0, meaning that this speed could never exceed 80 kph.11
Using free-flow speed alone as the target would imply that the buses are able to make full use of the entire length
of the managed lane. This is not the case where buses must enter and exit the highway to make stops (e.g. at 401-
Yonge Street to access TTC stations), or where managed lanes are discontinuous, such as at highway-to-highway
interchanges (e.g. from the DVP to Highway 401). In such situations buses typically are forced to merge with
general-purpose traffic, creating a “merge penalty.” Although the magnitude of such a penalty depends on a
10
In a few cases, the FFS was well above the average speed in all periods of the day, including the overnight
period when it would generally be expected that FFS could be reached. Thus, in cases where the average travel
speed for each period of the day was less than 90% of the calculated free flow speed, the target speed was
defined as the maximum of the five period-averages, which was deemed to be a more realistic value than the
FFS. This correction was applied for 26 of the 297 directional segments. In addition, as discussed there were a
few cases in which buses exited and entered the highway mid-segment, such as at a park & ride facility,
although most of these were controlled for through segment definition. Using the FFS or even the modified
target for these segments would have posed a problem in situations where some buses travelled express
through the segment (possibly achieving close to FFS), and others stopped, achieving speeds well below the
FFS (though possibly still above the anomaly threshold). This would have led to a false sense of congestion and
achievable time savings. These segments were identified manually; the relevant locations were Allen Road -
Highway 401 interchange, Highway 407 at Trafalgar, and Highway 400 at Major Mackenzie. In the first two
cases an arbitrarily low target speed was set so that no travel time savings are attainable from managed lanes.
This was deemed reasonable because the vast majority of GO buses exit the highway at Yorkdale (thus having
no advantage from managed lanes through the interchange) and buses generally do achieve close to the FFS
elsewhere on the 407. In the third case the target speed was set at the average of the AM peak, midday, and
PM peak period speeds. This is likely conservative but ensures that some travel time savings are attainable for
the peak period and peak direction (e.g. southbound in the AM peak).
11
As noted in Chapter 4.0, on Highway 403 GO buses usually use the HOV lane rather than the BBL. The
consultant reviewed the available GPS data, and found that the speeds on the relevant sections already were
fairly high, with the lowest period’s average speed being 76 kph. This suggests that the HOV lane in fact is
preferred by operators over the BBL. However, the actual choice of lane cannot be determined with complete
certainty. In any event, no improvements are planned or envisioned for this section of Highway 403, and so
none of the scenarios results in any time savings. Accordingly, the choice of lane on this section of Highway 403
does not matter for the purposes of this analysis.
Page 20variety of contextual factors, such as the type of managed lane, its relative location within the highway, and the
frequency of merge points, we use a simplified approach applying a formulaic merge penalty that is a function of
the underlying congestion level.
Merge Penalty
This analysis uses data from the temporary HOV lanes that were in place during the 2015 Pan Am / Parapan Am
Games to generate an estimate of a “merge penalty” applied to buses entering and exiting the managed lanes.
These data were obtained from GO Transit for a three-week period in July 2015 during which the temporary HOV
lanes were in effect. The data were obtained for 14 HOV facilities (7 times two directions), each of which was non-
continuous with others (i.e. required merging with general traffic at both ends).
Many of the facilities achieved speeds close to free-flow speed, but others did not. According to GO Transit, the
primary reason for not achieving FFS was due to having to merge with general-purpose traffic.
For the purpose of estimating a merge penalty, the hypothesis is that the greater the level of congestion on a
corridor, the more time would be lost to merging. The level of congestion was measured as the ratio of actual
speed to FFS (defined as 95th percentile speed over the Games period). The 14 facilities were broken out by time
period to distinguish between variable congestion levels throughout the day.
Through linear regression it was determined that 100% FFS was associated with 0.1 minutes of delay, with an
additional 0.5 minutes of delay for every 10% below FFS (e.g. 90% of FFS – 0.6 min). Implicitly this formulation
assumes that the delay is a function of the number of times the bus has to merge with general purpose traffic (i.e.
twice) and does not depend on the length of the segment. This is intuitively logical, as a longer HOV lane likely has
more efficacy than a short one. Thus, the effect of the penalty is that it dissipates over long segments but takes
away much or all of the benefit of short segments.
The application of the penalty depends on the continuity of bus travel from segment to segment. For any two
successive segments, some buses will travel “straight through” while others will have to exit the highway. The data
retrieved from GO Transit are not arranged by route and thus the exact patterns of bus movements were not
known. Instead, continuity is estimated by analyzing bus volumes on successive segments. For example, if
successive segments A, B, and C have 750, 1,000 and 1,250 buses respectively, the middle segment B is assigned a
25% penalty at its start point (1 – 750 / 1,000) and a 0% penalty at its end point, for an average penalty of 12.5%.12
In other words, it is assumed 75% of the buses on segment B are continuing from segment A (and 25% are
entering anew), and all 100% of the buses are continuing to segment C.
The above application assumes a continuous network of managed lanes. If a managed lane ends (such that the
next segment has no such lane), the end penalty is assumed to be 100% irrespective of bus volumes, as all buses
must exit the managed lane. For simplicity, managed lanes are assumed to be discontinuous for all highway
interchange turning movements (e.g. northbound to eastbound), but are assumed possibly to be continuous
(depending on the scenario) for through movements.
12
In other words, if the highway segment is at 80% of FFS and has a potential 1.1-minute merge delay, only 12.5%
of this delay is assigned to the segment (0.125*1.1 minutes), reflecting the share of traffic that is assumed to
require merging.
Page 21You can also read