EUROPEAN TOURISM APRI2016 - TRENDS & PROSPECTS
←
→
Page content transcription
If your browser does not render page correctly, please read the page content below
EUROPEAN TOURISM
TRENDS & PROSPECTS

APRI2016
EUROPEAN TOURISM:
                                              TRENDS & PROSPECTS

                                                        QUARTERLY REPORT (Q2/2019)
                             A quarterly insights report produced for the Market Intelligence Group
                                                         of the European Travel Commission (ETC)
                                          by Tourism Economics (an Oxford Economics Company)

                                                                             Brussels, July 2019
Copyright © 2019 European Travel Commission (ETC)                        ETC Market Intelligence

EUROPEAN TOURISM: TRENDS & PROSPECTS (Q2/2019)                                                  1
EUROPEAN TOURISM: TRENDS & PROSPECTS (Q2/2019) All rights reserved. The contents of this report may be quoted, provided the source is given accurately and clearly. Distribution or reproduction in full is permitted for own or internal use only. While we en- courage distribution via publicly accessible websites, this should be done via a link to ETC's corporate website (www.etc-corporate.org), referring visitors to the Research/Trends Watch section. The designations employed and the presentation of material in this publication do not imply the ex- pression of any opinions whatsoever on the part of the Executive Unit of the European Travel Com- mission. Data sources: This report includes data from the TourMIS database (http://www.tourmis.info), STR, IATA, Transparent, and UNWTO. Economic analysis and forecasts are provided by Tourism Econom- ics (www.tourismeconomics.com) and are for interpretation by users according to their needs. Published and printed by the European Travel Commission Rue du Marché aux Herbes, 61, 1000 Brussels, Belgium Website: www.etc-corporate.org Email: info@visiteurope.com ISSN No: 2034-9297 This report was compiled and edited by: Tourism Economics (an Oxford Economics Company) on behalf of the ETC Market Intelligence Group. Cover: Boats in a bay near Valletta, Malta Image ID: 285413822 Copyright: In Green EUROPEAN TOURISM: TRENDS & PROSPECTS (Q2/2019) 2
TABLE OF CONTENTS
Foreword ................................................................................................................................................. 4
Tourism Performance Summary 2019 .................................................................................................... 7
Global Tourism Forecast Summary ...................................................................................................... 10
Recent Industry Performance ............................................................................................................... 11
    Air Transport .................................................................................................................................... 11
    Accommodation ............................................................................................................................... 14
Special Feature: The Impact of “Tourism Years” .................................................................................. 16
Key Source Market Performance .......................................................................................................... 23
    Key Intra-European Markets ............................................................................................................ 23
    Non-European Markets .................................................................................................................... 28
Origin Market Share Analysis................................................................................................................ 31
    United States.................................................................................................................................... 32
    Canada ............................................................................................................................................. 33
    Mexico .............................................................................................................................................. 34
    Argentina .......................................................................................................................................... 35
    Brazil ................................................................................................................................................ 36
    India ................................................................................................................................................. 37
    China ................................................................................................................................................ 38
    Japan ............................................................................................................................................... 39
    Australia ........................................................................................................................................... 40
    United Arab Emirates ....................................................................................................................... 41
    Russia .............................................................................................................................................. 42
Economic Outlook ................................................................................................................................. 43
    Overview .......................................................................................................................................... 43
    Eurozone .......................................................................................................................................... 45
    United Kingdom................................................................................................................................ 46
    United States.................................................................................................................................... 47
    Japan ............................................................................................................................................... 48
    Emerging Markets ............................................................................................................................ 49
Appendix 1 ............................................................................................................................................ 50
Appendix 2 ............................................................................................................................................ 51

EUROPEAN TOURISM: TRENDS & PROSPECTS (Q2/2019)                                                                                                           3
FOREWORD
EUROPEAN TOURISM HOLDS UP WELL DESPITE FALTERING GLOBAL
ECONOMIC PROSPECTS
Demand for European tourism is expected to maintain an upward trajectory over 2019. However, growth
rates by destination are slower than in previous years. The region will struggle to remain resilient as
trade tensions disrupt the global economy. While Europe’s largest long-haul markets continue to sup-
port tourism growth, the contribution from intra-European demand will become even more significant.
Foreign visits and overnights to select destinations
2019 year-to-date*, % change year ago
Source: TourMIS *date varies (Jan-May) by destination
Virtually all reporting destinations registered significant increases in tourist arrivals early in the year,
although data into the summer months will provide a more stable picture of yearly performance. Balkan
destinations’ efforts to expand the tourism season, diversify the product offer, and develop niche mar-
keting are bearing fruit: Montenegro (+50%) and Turkey (+12%) were the only destinations which have
posted double-digit expansions so far this year. Star performers were also Slovenia and Greece (both
+8%); following almost five years of solid growth, 2019 prospects for Greece are positive despite the
return of competing destinations.
The demise of Iceland’s low-cost carrier WOW Air in March, hasn’t gone unnoticed, negatively affecting
the country’s economic outlook and tourism sector (-11%). Romania (-7%) also saw dwindling arrivals
from a wide range of source markets. While relatively weak tourism infrastructure and accommodation
capacity in Romania have had negative impact, strong domestic tourism provides some respite. Estonia
saw a slight decrease (-2%) due to declines from one of its largest source markets, Russia (-9%).
CHALLENGES IN THE SKIES
European airline growth measured in RPK1 (6.9%) outperformed global air passenger growth and that
of other regions based on year-to-date data. However, storm clouds are gathering given increased
demand and constrained air-traffic control capacity. Increasing delays and cancellations are expected
to aggravate the situation over the 2019 peak summer travel months.
1 Revenue Passenger Kilometres
EUROPEAN TOURISM: TRENDS & PROSPECTS (Q2/2019) 4Annual International Air Passenger Growth 2017
% year, RPK
2018
12
2019
10
8
6
4
2
0
-2
Africa Asia/Pacific Europe Latin Mid. East N. America World
America
Source: IATA
According to Eurocontrol, the cost to the EU economy of delays and cancellations was estimated at
€17.6bn in 2018, while over half (60.4%) of the delays related to capacity and staffing. Asia/Pacific air
passenger traffic growth (4.6%) and North America (4.5%) remains below that of Europe. According to
ForwardKeys, Chinese bookings to Europe are 6.7% ahead compared to 2018 while Chinese booking
to the US are down 3% the first five months of 20192.
DESPITE TRADE QUARRELS HEALTHY GROWTH IS REPORTED FROM
EUROPE’S KEY LONG-HAUL MARKETS (US AND CHINA)
A handful of reporting destinations registered more falls from European source markets than from long-
haul. Among Europe’s key long-haul source markets, the US and China continue to stand out in terms
of their contributions to European tourism growth accounting for a share of 11% and 4% respectively.
Contributions to European growth by origin market
% contribution to growth, 2019
Other Europe
Germany
US
France
Russia
UK
Netherlands
Italy
China
Other
Japan
India
Canada
0 10 20 30 40
Source: Tourism Economics
Despite wobbly trade relationships between China and the US and a slowing Chinese travel demand,
the vast majority (93%) of reporting destinations enjoyed growth from the Chinese market early in the
2 ForwardKeys, Chinese tourism is set to surge 7.6% this summer,https://bit.ly/2Xj9Miu, June 2019
EUROPEAN TOURISM: TRENDS & PROSPECTS (Q2/2019) 5year. Some staggering growth was concentrated mainly in Southern/Mediterranean destinations: Mon- tenegro (+150%), Cyprus (+62%), and Croatia (+44%). Lithuania (+77%) was the second fastest desti- nation in terms of Chinese arrivals. A moderate slowdown in US GDP is expected to impact its outbound travel with US visitor arrivals to Europe expected to rise by 3.9% annually on average over the next five-year period. Nevertheless, Europe continues to be an attractive destination for US holidaymakers, supported also by a strong dollar against the euro and the pound. Greece (+47%), Turkey (+37%), and Cyprus (+33%) saw the strongest rates of growth from the US early in the year. Conversely, Iceland which used to register notable in- creases in tourist arrivals from the US has seen a steep decline (-22%) attributable to the collapse of WOW Air and capacity constraints on Trans-Atlantic routes via Iceland. ECONOMIC CHALLENGES AND SLOWING TRAVEL DEMAND KEY FACTORS OF A BUMPY 2019 In the Eurozone, solid domestic demand supports growth, while persistent downside risks continue to weigh on long-term development prospects. Following a solid performance in 2018 (+6%), international tourist arrivals to Europe are projected to grow 3.6% in 2019, a rate more in line with the annual historical average (2008-18)3. Lower projections are associated to downside risks that remain in place: trade war impacts on the global economy, geopolitical tensions, growing concerns around unfolding Chinese economic slowdown, a potential US recession, Brexit, and persistent weakness in the Eurozone (e.g., German slowdown and Italian debt). Following the G20 Summit in Osaka, renewed trade talk between US and China seem to have alleviated tensions, although expert say the “ceasefire” is likely to be temporary. “Europe must align its market mix and identify under-served segments and further expand its under- standing of pan-European product development. Through the promotion of transnational experiences, the European Travel Commission (ETC) particularly seeks to raise visibility for the plethora of products available and to create awareness for the region’s diversity. An essential pillar to achieve the sustaina- ble growth of European tourism are public-private partnerships following a focused approach with com- mon and achievable goals.” said Eduardo Santander, Executive Director ETC. Jennifer Iduh (ETC Executive Unit) with the contribution of the ETC Market Intelligence Group (MIC) 3 UN World Tourism Organization (UNWTO) EUROPEAN TOURISM: TRENDS & PROSPECTS (Q2/2019) 6
TOURISM PERFORMANCE SUMMARY 2019
 SUMMARY

 •        Maintaining growth in 2019 will be more challenging than in 2018. The majority of destinations
          are currently reporting growth according to latest available data, but this is slower than in previous
          years.
 •        Montenegro is the fastest growing destination for which data are available, aided by new capacity
          and connectivity.
 •        For the first time since 2010 declines have been reported in Romania from many of its key source
          markets.

A vast majority of European destinations for which data are available have continued to enjoy growth
amidst a weakening economic backdrop. Based on data presently available, the magnitude of growth
being reported across destinations is below that observed in prior years, with significantly less destina-
tions reporting double-digit arrivals or overnights growth this year compared to prior years, for example.

Year-to-date growth in all reporting destinations was significantly slower than
       in the previous two years, up 3.5% on a weighted average basis
Year-to-date growth in all reporting destinations was significantly slower than in the previous two years,
up 3.5% on a weighted average basis. However, a number of destinations have yet to report data for
April, and the Easter-related demand therein will likely provide some boost to year-to-date performance
for those destinations.

 Foreign visits and overnights to select destinations
  2019 year-to-date*, % change year ago                                         Arrivals
  15                                                                            Nights

  10                                                   Montenegro, 49.5% (A) & 29.1% (N)
                                                       Sweden, -35.0% (N)

     5

     0
                Belgium
           Montenegro
                  Turkey

                 Norway

                   Malta

                Portugal
                  Serbia

               Denmark

                  Austria

                       UK
                Slovakia

               Germany
                 Croatia

                  Poland
                Slovenia

                 Cyprus
                     Italy
               Lithuania

                Hungary
            Ireland Rep

                   Spain

            Switzerland
                 Greece

                Bulgaria

           Netherlands

                 Iceland
                Sweden
           Luxembourg

                   Latvia

                Monaco
                 Finland

             Czech Rep

               Romania
                 Estonia

     -5

 -10

 -15
 Source: TourMIS      *date varies (Jan-May) by destination

Europe’s top growth destination based on early-2019 data was Montenegro which actually saw demand
growth tick upwards from earlier in the year. Arrivals in the first four months of the year grew 49.5% and
overnights 29.1% compared to the same period a year ago. (This compares to arrivals growth of 40.6%
and overnights growth of 23.6% based on data to February.) This momentum has been borne out of
improved air transport accessibility and a number of activities which have been implemented to promote
its tourism offering by the National Tourism Organisation and the Ministry of Sustainable Development
and Tourism. Growth in the early part of the year demonstrates an expanded tourism season, with
growth in January and February in particular owing to the development of winter tourism infrastructure
which has added depth to Montenegro’s tourism offering. In 2015 the government announced that it
would invest some €60 million over a five-year period to improve winter sports facilities, and significant

EUROPEAN TOURISM: TRENDS & PROSPECTS (Q2/2019)                                                               7
improvements have been made to the quality of accommodation, with a substantial number of 4- and 5-star hotels opened in recent years. These investments are now starting to bear fruit. Demand to Turkey has also gathered some steam compared to earlier in the year, with arrivals up 12.2% in the first four months of the year compared to the same period a year ago. Arrivals growth for the first two months of the year was 7.4%. Growth was reported from all source markets for which data are available. In almost all cases growth was significant, however growth from China was somewhat subdued. Lingering weakness of the lira should support further growth into the peak summer tourism season. Russia has been a key part of Turkey’s recovery, and although arrivals growth has slowed slightly compared to earlier in the year (from 33.7% based on data to February compared to 26.5% at present), in absolute terms it remains substantial since Russia accounted for 15% of total foreign arrivals to Tur- key in 2018. This makes it Turkey’s largest source market. Serbia was the third fastest growing destination based on latest on available demand data for 2019. This performance (as third fastest growing destination) was driven by overnights growth of 8.3%, but arrivals also grew at a robust rate of 4.5%, both based on data to March. This has been aided by a growing number of flights operated by Europe’s low-cost carriers to and from Serbia. Efforts to market Serbia to Asian tourist have started to bear fruit; in May, nearly 40 tourism agencies from 12 Asian countries including China took part in the workshop co-organized with Turkish Airlines and the Serbian Tourism Organization, the purpose of which was to showcase the tourism potential of various destinations within Serbia (i.e., not just Belgrade). Such efforts have already yielded significant demand growth from China, with arrivals up 55.6% based on data to March. Continued efforts in this regard will likely support further growth. More generally, Belgrade’s designation as cheapest city in Europe to visit in Post Office’s Travel Money City Costs Barometer last year has likely provided some impetus for demand growth from within Europe. Slovenia has enjoyed robust growth in arrivals and overnights so far in 2019, with arrivals up 8.1% and overnights up 8.2% based on data to April. A recent win for Ljubljana and a runner-up spot for Bled at this year’s ITB Berlin – the world’s largest tourism trade fair – are indicative of efforts being made by Slovenia to attract demand, and such recognition of the success of these efforts suggest further growth is likely. Estonia, Romania, and Iceland were the only markets which reported declines in demand. Estonia has reported a 2.4% decline in arrivals and a 3.1% decline in overnights based on data to April. Whilst arrivals were up from the majority of reported source markets, arrivals from Russia – one of its largest source markets – were down 8.7% and overnights 9.6% compared to the same period a year ago. Russia has accounted for around 10% of annual arrivals to Estonia over the past few years, which leaves Estonia’s overall performance highly exposed to the whims of Russian sentiment. At present, Romania looks set to report declines in arrivals for the first time since 2010. Based on data to April, arrivals are down 6.6% compared to the same period a year ago, with declines common from most reported source markets. It is possible that ground gained by other destinations in the region, such as Bulgaria and Serbia, have come at a cost to Romania. It has been suggested this decline is due to a lack of government measures to develop the tourism industry. Heavy-handed intervention by local police against protesters in Bucharest during the Diaspora protest against the Romanian government in August last year is another possible reason why it has been spurned. Iceland has also reported declines for the first time since 2010 based on early-2019 data. Arrivals to Iceland began to slow in 2018 following a number of years in which significant growth was achieved, with supply shortages cited as being a key part of the slowdown. The recent collapse of Iceland’s low- cost carrier WOW Air in March will have exacerbated these shortages. The reduced capacity on trans- Atlantic routes is evident in arrivals data with the largest falls in arrivals being from US and Canada. EUROPEAN TOURISM: TRENDS & PROSPECTS (Q2/2019) 8
TOURISM PERFORMANCE, 2019 YTD
                                                                              International Arrivals            International Nights
                           Country                                     % ytd                     to month   % ytd                to month
 Austria                                                               0.2%                     Jan-May     -2.4%                Jan-May
 Belgium                                                               0.6%                     Jan-Mar        -                 Jan-Mar
 Bulgaria                                                              4.3%                     Jan-Apr
 Croatia                                                               2.6%                     Jan-May     -5.0%                Jan-May
 Cyprus                                                                -1.1%                    Jan-May     7.4%                 Jan-Apr
 Czech Republic                                                        0.1%                     Jan-Mar     -1.9%                Jan-Mar
 Denmark                                                                                                    1.3%                 Jan-Apr
 Estonia                                                               -2.4%                    Jan-Apr     -3.1%                Jan-Apr
 Finland                                                               1.8%                     Jan-May     1.4%                 Jan-May
 Germany                                                               1.9%                     Jan-Apr     3.1%                 Jan-Apr
 Greece                                                                7.8%                     Jan-Mar
 Hungary                                                               1.6%                     Jan-Apr     0.4%                 Jan-Apr
 Iceland                                                              -11.2%                    Jan-May
 Republic of Ireland                                                   5.1%                     Jan-Apr
 Italy                                                                 2.9%                     Jan-Mar     5.6%                 Jan-Mar
 Latvia                                                                0.2%                     Jan-Apr     3.4%                 Jan-Apr
 Lithuania                                                             5.4%                     Jan-Mar
 Luxembourg                                                            4.7%                     Jan-Mar      0.5%                Jan-Mar
 Malta                                                                 3.1%                     Jan-Apr      3.7%                Jan-Apr
 Monaco                                                                2.5%                     Jan-Apr        -                 Jan-Apr
 Montenegro                                                           49.5%                     Jan-Apr     29.1%                Jan-Apr
 Netherlands                                                              -                     Jan-Mar      3.5%                Jan-Mar
 Norway                                                                                                      4.6%                Jan-May
 Poland                                                                1.7%                     Jan-Mar      1.7%                Jan-Mar
 Portugal                                                              3.4%                     Jan-Mar     -0.1%                Jan-Mar
 Romania                                                               -6.6%                    Jan-Apr
 Serbia                                                                4.5%                     Jan-Mar      8.3%                Jan-Mar
 Slovakia                                                              4.9%                     Jan-Mar      4.6%                Jan-Mar
 Slovenia                                                              8.1%                     Jan-Apr      8.2%                Jan-Apr
 Spain                                                                 4.4%                     Jan-Apr      1.6%                Jan-Apr
 Sweden                                                                                                     -35.0%               Jan-May
 Switzerland                                                           0.8%                     Jan-Apr      -0.1%               Jan-Apr
 Turkey                                                               12.2%                     Jan-Apr
 UK                                                                   -1.0%                     Jan-Mar
Source: TourMIS (http://w w w .tourmis.info); available data as of 3.7.2019
Measures used for nights and arrivals vary by country

EUROPEAN TOURISM: TRENDS & PROSPECTS (Q2/2019)                                                                                              9
GLOBAL TOURISM FORECAST SUMMARY
Tourism Economics’ global travel forecasts are shown on an inbound and outbound basis in the follow-
ing table. These are the results of the Global Travel Service (GTS) model, which is updated in detail
three times per year. Forecasts are consistent with Oxford Economics’ macroeconomic outlook accord-
ing to estimated relationships between tourism and the wider economy. Full origin-destination country
detail is available online to subscribers.
GTS VISITOR GROWTH FORECASTS, % CHANGE
Inbound* Outbound**
2018 2019 2020 2021 2022 2018 2019 2020 2021 2022
data/estimate/forecast e f f f f e f f f f
World 5.8% 4.2% 3.6% 3.8% 4.0% 5.2% 4.3% 3.6% 3.8% 4.0%
Americas 3.3% 4.0% 3.7% 3.8% 4.0% 4.4% 4.1% 3.0% 3.0% 3.3%
North America 4.1% 3.5% 3.4% 3.6% 3.8% 5.6% 4.1% 2.8% 2.7% 3.0%
Caribbean -1.7% 4.8% 5.0% 4.4% 3.8% 2.4% 5.9% 5.6% 5.1% 5.5%
Central & South America 3.5% 4.9% 4.1% 4.2% 4.7% 0.7% 4.1% 3.4% 3.9% 4.2%
Europe 5.9% 3.6% 2.8% 3.2% 3.4% 5.2% 4.2% 3.3% 3.6% 3.7%
ETC+3 5.6% 3.5% 2.6% 2.9% 3.3% 4.6% 4.1% 3.2% 3.4% 3.6%
EU 4.5% 3.2% 2.4% 2.7% 3.1% 4.7% 3.9% 3.1% 3.3% 3.5%
Non-EU 11.6% 5.2% 4.5% 4.8% 4.5% 7.3% 5.6% 4.0% 4.6% 4.5%
Northern 0.7% 3.6% 2.5% 2.4% 3.0% -0.1% 4.1% 3.6% 4.3% 4.7%
Western 6.4% 2.8% 2.0% 2.4% 2.8% 5.2% 3.9% 2.9% 2.9% 3.0%
Southern/Mediterranean 7.0% 3.7% 2.9% 3.4% 3.7% 8.5% 4.7% 3.5% 3.4% 3.8%
Central/Eastern 4.4% 4.5% 3.7% 4.1% 3.8% 9.7% 4.8% 3.5% 3.9% 3.8%
- Central & Baltic 5.1% 4.3% 3.1% 3.3% 3.2% 8.1% 3.8% 2.9% 3.2% 3.2%
Asia & the Pacific 7.0% 4.8% 4.6% 4.4% 4.4% 6.1% 4.7% 4.7% 4.7% 4.8%
North East 6.5% 4.5% 4.7% 4.3% 4.3% 5.7% 4.8% 4.6% 4.7% 4.7%
South East 8.1% 4.6% 4.3% 3.9% 4.2% 7.2% 3.1% 4.3% 4.0% 4.4%
South 7.2% 7.9% 6.0% 5.9% 5.7% 7.8% 8.0% 5.5% 5.7% 5.8%
Oceania 4.2% 4.8% 4.2% 6.3% 5.4% 4.8% 4.5% 5.3% 5.5% 5.3%
Africa 9.7% 6.5% 4.9% 4.9% 4.4% 7.0% 4.8% 3.6% 3.6% 3.6%
Middle East 2.7% 5.6% 5.8% 6.4% 6.3% 1.5% 4.2% 4.3% 5.4% 6.0%
* Inbound is based on the sum of the country overnight tourist arrivals and includes intra-regional flow s
** Outbound is based on the sum of visits to all destinations
The geographies of Europe are defined as follow s:
Northern Europe is Denmark, Finland, Iceland, Ireland, Norw ay, Sw eden, and the UK;
Western Europe is Austria, Belgium, France, Germany, Luxembourg, Netherlands, and Sw itzerland;
Southern/Mediterranean Europe is Albania, Bosnia-Herzegovina, Croatia, Cyprus, FYR Macedonia, Greece, Italy, Malta, Montenegro, Portugal, Serbia,
Slovenia, Spain, and Turkey;
Central/Eastern Europe is Armenia, Azerbaijan, Bulgaria, Czech Republic, Estonia, Hungary, Kazakhstan, Kyrgyzstan, Latvia, Lithuania, Poland, Romania,
Russian Federation, Slovakia, and Ukraine;
- Central & Baltic Europe is Bulgaria, Czech Republic, Estonia, Hungary, Latvia, Lithuania, Poland, Romania, and Slovakia;
ETC+3 is all ETC members plus France, Sweden, and the United Kingdom
Source: Tourism Economics
EUROPEAN TOURISM: TRENDS & PROSPECTS (Q2/2019) 10RECENT INDUSTRY PERFORMANCE
SUMMARY
• Global air transport, measured in Revenue Passenger Kilometres (RPK), grew 4.6% in the first
four months of 2019 compared to the same period a year ago.
• A recent uptick in RPK growth in Europe makes it the fastest growing global region with 6.9%
growth, but capacity constraints remain a concern for the prospects of the region.
• Hotels in Europe grew RevPAR 2.1% in the first five months of 2019 compared to the same period
a year ago. This represents a small improvement in growth relative to Q1 performance.
• ADR remains the chief driver of RevPAR growth across Europe except for in Eastern Europe.
• Relatively low hotel occupancy growth points to potential capacity constraints in hotels given the
high occupancy levels and faster growth in other indicators of demand.
AIR TRANSPORT
Global air passenger growth measured in Revenue Passenger Kilometres (RPK) sat at 4.6% according
to year-to-date data to April. Whilst this remains within the bounds of what could be described as robust,
it represents a slowdown compared to prior years. It is also markedly slower than suggested by year-
to-date figures reported earlier in the year (according to data to February global RPK growth was 5.9%).
For context, this is the slowest rate of air passenger growth for 10 years, when global RPK contracted
in 2009 in the wake of the global financial crisis the year prior. This reflects a slowing global economic
backdrop and some fraught trade relations which are having a clear impact on demand.
Global air passenger growth hit a 10-year low in early-2019
Nonetheless, global passenger load factor (PLF) remains relatively high (81.2% based on data to April).
These capacity constraints coupled with airlines’ limited ability to reduce already low air fares further
may also have stifled demand in recent months.
International Air Passenger Traffic Growth Total
% year, RPK
3mth mav
20
15
10
5
0
-5
-10
-15
Jul-10
Jan-13
Jun-13
Jul-15
Jan-18
Jun-18
Mar-12
Mar-17
Feb-10
Feb-15
Dec-15
Sep-09
Dec-10
Aug-12
Nov-13
Sep-14
Aug-17
Nov-18
Apr-09
May-11
Oct-11
Apr-14
May-16
Oct-16
Apr-19
Source: IATA
At the regional level, Europe appears unaffected by Brexit uncertainty or the softer economic outlook
across the region; despite both contributing to markedly lower business confidence over the past year;
so far this year it has outperformed all other regions, posting 6.9% growth in RPK in the first four months
of the year compared to last year. While global growth is currently comparable to the slowdown experi-
enced in 2016, it is notable that European airline growth remains faster than at that time.
EUROPEAN TOURISM: TRENDS & PROSPECTS (Q2/2019) 11Annual International Air Passenger Growth 2017
% year, RPK
2018
12
2019
10
8
6
4
2
0
-2
Africa Asia/Pacific Europe Latin Mid. East N. America World
America
Source: IATA
As it stands, only Europe and Africa are on course to outperform 2018 growth. However, year-to-date
growth has slowed based on estimates made earlier in the year: Europe’s year-to-date growth estimate
for RPK has fallen by 0.4 pp, from 7.3% to 6.9%, and Africa’s by 0.7 pp, from 3.3% to 2.6% based on
data for the first four months of the year compared to the first two months.
Monthly International Air Passenger Growth Jan-19
% year, RPK
Feb-19
10
Mar-19
8 Apr-19
6
4
2
0
-2
-4
Source: IATA
For the past two years airlines in Asia/Pacific had enjoyed the fastest rates of RPK growth. Indeed, this
was also true based on year-to-date data to February. However, a sharp slowdown in March and April
have shaved almost 3 pp off February’s year-to-date estimate, down from 7.5% to 4.6%.
In 2018 Chinese exports collapsed, pointing to a significant slowdown in global trade growth and an
increasing impact from US tariffs. Further tariffs imposed by the US in March of this year have clearly
exacerbated the impact, with some notable slowing of travel demand in the region since, pulling growth
well below its long-run average.
There was also a marked slowdown in RPK growth generated by Indian airlines due to the exit of Jet
Airways from the market in April. This sizeable supply side interruption has not yet been filled by other
carriers, but the eventual restoration of this supply should offer a boost to RPK growth in the region.
Whilst there was a pick-up in air passenger growth in the Middle East in April, in year-to-date terms it
remains the only region in which demand has declined compared to a year ago. A downward trend in
EUROPEAN TOURISM: TRENDS & PROSPECTS (Q2/2019) 12data has been observed since mid-2018 and is likely to persist in the near-term while some broader
structural changes in the industry are underway.
Africa is the second slowest growing region in RPK terms, and demand has got progressively slower
with each passing month of 2019. Although currently poised to outperform 2018, the current trajectory
of demand in the region looks likely to scupper such a performance. A moderate economic recovery is
forecast for South Africa in 2019, but risks to the outlook have shifted to the downside amidst signs of
a slowdown in global trade, issues surrounding electrical supply security, and a higher tax burden for
consumers. Falling business confidence and rising concerns about economic and political conditions in
other key economies in the region also persist.
International Air Passenger Traffic Growth N. America
% year, RPK
Europe
35
30 Asia/Pacific
25
20
15
10
5
0
-5
-10
-15
-20
Jul-10
Jul-15
Jan-13
Jun-13
Jan-18
Jun-18
Feb-10
Mar-12
Feb-15
Dec-15
Mar-17
Sep-09
Dec-10
Aug-12
Nov-13
Sep-14
Aug-17
Nov-18
May-11
Oct-11
May-16
Oct-16
Apr-09
Apr-14
Apr-19
Source: IATA
In broad terms, for the first time in a number of years, Asia/Pacific air passenger traffic growth has
begun to tick below that of Europe and North American. A trade deal with the US would go some way
towards remedying this. It would also alleviate global growth concerns and provide a much-needed
global confidence boost, to the benefit of air passenger traffic more generally. The sizeable supply side
interruption caused by the collapse of India’s Jet Airways once restored will also help close the gap.
However, other carriers have not yet offset the shortage.
European Airlines Capacity
ASK, monthly average, % change year ago
9
8
7
6
5
4
3
2017
2 2018
1 2019
0
Q1 Q2 Q3 Q4
Source: IATA
Available Seat Kilometres (ASK) have continued to grow in Europe and had until March been sufficient
to keep load factors in check. However, in April ASK grew around 6.3% to RPK’s 7.6%, resulting in
higher PLF on European airlines for the month.
EUROPEAN TOURISM: TRENDS & PROSPECTS (Q2/2019) 13This continued growth demonstrates that capacity constraints have not hampered demand to the extent
that some feared. Nonetheless, capacity remains a major concern within Europe where load factors are
higher than in any other region. The year-to-date load factor in Europe is 82.7%, but in April alone was
85.1%. While this was likely influenced by the timing of Easter which fell in April this year, this is the
highest ever load factor observed in any March or April – the two months in which Easter typically falls
– of the past 15 years.
Slower capacity growth in Europe is applying upward pressure on load factors
This upward pressure on load factors is exacerbated by the slower capacity growth, with the industry
clearly reluctant to grow capacity in the face of a weaker business environment. This shortfall may
persist throughout 2019 given infrastructure limitations and lead times involved in planning new capac-
ity. Airlines may also be seeking to bolster profitability by flying at higher load factors. The importance
of sufficient capacity to destinations is evident in the recent data for Iceland following the collapse of
WOW Air, whereas the strong growth performance in Montenegro has been aided by new routes.
European Airlines Passenger Load Factor 2017
Monthly load factor, %
90 2018
88 2019
86
84
82
80
78
76
74
72
70
Q1 Q2 Q3 Q4
Source: IATA
ACCOMMODATION
European hotel revenue per available room (RevPAR) grew by 2.1% in the first five months of 2019
compared to the same period a year ago, with this growth driven almost exclusively by rate hikes. The
relative strength of the US dollar has driven a significant increase in hotel rates in the Americas when
priced in euro terms, up 8.7%. Priced in dollar terms this increase was much more stunted at 0.9%.
European hotel revenue per available room (RevPAR) grew by 2.1% in the first
five months of 2019
In Asia/Pacific, average daily rate (ADR) increases were broadly comparable to those in Europe, how-
ever, declines in occupancy rates have dragged on RevPAR. Some weaker business confidence in the
region may be to blame. In the Middle East/Africa the story is much the same as Europe whereby hotel
operators have relied upon rate growth to grow RevPAR. At the same time, such low rates of RevPAR
growth (between 2-3%) are sufficient only to offset inflation. This perhaps indicates some trepidation
within the industry to push rates as alternative accommodation types such as Airbnb persist in gaining
market share.
EUROPEAN TOURISM: TRENDS & PROSPECTS (Q2/2019) 14Global Hotel Performance
Jan-May year-to-date, % change year ago
Occ
10 ADR (€)
8 RevPAR (€)
6
4
2
0
-2
Asia/Pacific Americas Europe Middle East/Africa
Source: STR
EUROPEAN TOURISM: TRENDS & PROSPECTS (Q2/2019) 15SPECIAL FEATURE: THE IMPACT OF
“TOURISM YEARS”
SUMMARY
• Tourism years appear to support growth between participating destinations. This growth is mostly
in prior years as capacity expands to meet expected demand from the tourism year.
• The EU-China Tourism Year in 2018 had a clear impact on demand for both EU and non-EU ETC
destinations.
• Tourism years can act as a catalyst for faster growth from developing and long-haul markets, but
short-haul travel will ultimately remain key to Europe’s growth prospects in the near-term.
BACKGROUND
“Tourism years” have become a more prominent feature of bilateral relations in recent years, with sig-
nificant effort being made to forge partnerships with untapped and developing markets. China in partic-
ular has been a prominent partner in a number of recent tourism years.
Tourism years serve a valuable purpose: they provide an impetus for connectivity growth between
countries and help destinations to broaden their appeal across source markets. Different source mar-
kets can be directly targetted in a tourism year. Crucially, they can demonstrate the potential demand
that exists in a given source market and therefore help to justify policy decisions which focus on these
markets.
Tourism years can demonstrate the potential demand that exists in a given
source market
A number of tourism years have been analysed to ascertain the impact of these on arrivals growth
(including their significance in a broader context) and on outbound travel. Included in the review are a
number of tourism years between European destinations and either China or Russia, as well as some
between China and non-European destinations (for completeness). These are:
• 2012: Russia-China
• 2013-14: Italy-Russia
• 2016: United States-China, Spain-Russia
• 2017: Australia-China, Switzerland-China, Denmark-China
• 2017-18: Greece-Russia
• 2018: EU-China, Canada-China, Turkey-China
• 2019: Turkey-Russia, New Zealand-China, Laos-China
THE IMPACT OF TOURISM YEARS ON ARRIVALS
In simple growth terms the impact of tourism years on arrivals is mixed. In the cases reviewed, there is
typically arrivals growth in the three years leading up to the tourism year proper. Indeed, average growth
over this period was often higher than that observed in the tourism year itself. A significant proportion
of growth in prior years is directly attributable to directives associated with the tourism year. Hotels
ready themselves, airlines add to capacity between the destinations in order that demand can be ser-
viced within the tourism year itself. Promotion for the tourism year begins ahead of time, and this pro-
motion alone can be a catalyst for growth by virtue of the additional awareness created.
In most cases, tourism years also appear to have supported sustained tourism demand growth in the
years immediately following. The connections forged by airlines in the lead-up to and during the tourism
EUROPEAN TOURISM: TRENDS & PROSPECTS (Q2/2019) 16year remain, as do the foundations laid elsewhere in the industry to cater for the additional demand
growth during the tourism year. This encourages future travel, with the perceived success of a tourism
year providing further incentive. Nevertheless, growth in the years immediately following a tourism year
tends to be slower compared to before and during, albeit from the higher starting volume.
In most cases, tourism years appear to have supported tourism demand
growth in the years immediately before and after
There are, however, some exceptions. For instance, Greece’s tourism year with Russia failed to yield
any significant return during the capacity building and preparation phase (arrivals actually declined by
a notable amount). There was some growth in the post-tourism year period, but not enough to offset
the previous decline. In addition, the tourism years between Italy and Russia (2012) and Spain and
Russia (2013) saw a decline in arrivals following the tourism year, unwinding some of the increase seen
in the year itself and years prior. However, it is difficult to disentangle the impact of other economic
events from that of the tourism year in these cases, with Greece and Russia both suffering economic
recessions prior to their tourism year, and Italy, Spain, and Russia experiencing downturns following
their tourism years. Similarly, the deterioration of US-Chinese relations under the Trump Presidency
likely restricted arrivals growth after the 2016 US-China tourism year.
Summary of "tourism year" impact Pre TY CAGR
% change arrivals Post TY CAGR
Growth in TY
50%
40%
30%
20%
10%
0%
-10%
-20%
-30%
Source: Tourism Economics
In addition to simple arrivals growth, it is also worth considering the contribution of tourism years to
growth in arrivals. Although Russian arrivals to Italy declined following their tourism year, the impact of
the tourism year in 2012 was much more significant. In 2012, arrivals to Italy grew just 0.5%, and Rus-
sian arrivals accounted for 85% of this growth. This suggests that, if not for its tourism year with Russia,
travel to Italy would have essentially stagnated, with the EU recession stifling demand growth from a
number of Italy’s usual source markets. Russia has also made a significant contribution to Turkey’s
growth in arrivals during their tourism year (this year). Similar to Italy, Turkey’s prospects may have
been very different without Russia’s significant contribution to growth following renewed relations and
cooperation between the two.
China’s contributions to EU arrivals growth during 2018’s EU-China Tourism Year were minor. However,
given the size of the EU and the number of constituent destinations therein, the contributions of this
growth are more evident at the destination level. This will be dealt with in more detail later.
EUROPEAN TOURISM: TRENDS & PROSPECTS (Q2/2019) 17Contribution to growth in a "tourism year"
% contribution to growth
40%
Italy-Russia = 85%
30%
20%
10%
0%
-10%
Source: Tourism Economics
The market share impacts of a tourism year tend to be positive and suggest
more lasting impacts than implied by a slowing rate of arrivals growth
The market share impacts of a tourism year have also tended to be positive and suggests a more lasting
impact than might be implied by a slowing rate of arrivals growth. In the majority of cases a tourism year
has resulted in higher market share of outbound travel from the source market in question. The only
exceptions to this relate to the Russia-China tourism year in 2014 and the Greece-Russia tourism year
in 2017. Some heightened security concerns in Russia following its 2014 annexation of the Crimean
Peninsula are likely to have unwound some gains it made in obtaining a higher share of Chinese out-
bound in the run up to 2014.
Market share impact of "tourism year" % share, pre-TY
% share of total outbound from "country B" % share, post-TY
30% Max share, 2005-18
25%
20%
15%
10%
5%
0%
Source: Tourism Economics
The weak foundations laid in the run-up to Greece and Russia’s tourism year (due to their respective
recessions) left Greece poorly placed to capitalise and it failed even to recoup some the market share
of Russia outbound lost during the recession years. Furthermore, Turkey’s strong gains in Russian
outbound have left little opportunity for any other destinations to gain share.
EUROPEAN TOURISM: TRENDS & PROSPECTS (Q2/2019) 18Market share, Russian outbound % share outbound, 2014
% share of total outbound from Russia
% share outbound, 2019
30%
25%
20%
15%
10%
5%
0%
Turkey Greece
Source: Tourism Economics
Whilst Turkey has made significant gains in its share of Russian outbound at the expense of Greece, it
has not been at the expense of Europe as a whole. Based on the share of Russian outbound demand
held by ETC destinations in aggregate, Turkey’s gains have actually ensured some sustained growth
in the ETC’s share of outbound during a period which otherwise might have suffered some declines of
the same. The Turkey-Russia tourism year has primarily bolstered Russian arrivals growth in Turkey,
but it has also succeeded in keeping Russian outbound travel demand within ETC destinations.
Market share, ETC visits from Russia
% share, total visits
4,0%
Russian visits in ETC
3,5% Exc. Turkey
3,0%
2,5%
2,0%
1,5%
2012 2013 2014 2015 2016 2017 2018 2019 2020
Source: Tourism Economics
EU-CHINA TOURISM YEAR 2018
The EU-China Tourism Year was agreed in 2016 by the Chinese Prime Minister and the President of
the European Commission. ETC played a key role from the outset in what was a unique opportunity to
attract more Chinese travellers, stimulate economic cooperation in the tourism sector, and give extra
impetus to EU-China visa facilitation and air connectivity.
The EU-China Tourism Year in 2018 has proven successful on a number of fronts, not least because it
succeeded in allowing EU destinations to recoup some loss of share of Chinese long-haul travel de-
mand. Several high-profile terrorist attacks and negative headlines in Chinese media about Europe’s
“migrant crisis” both contributed to the declines in the EU’s share of Chinese long-haul outbound travel.
Nonetheless, capacity building continued (at least in air passenger terms), meaning the EU was primed
to take advantage of the tourism year when it arrived. Whilst its share remains below 2015 levels, the
EUROPEAN TOURISM: TRENDS & PROSPECTS (Q2/2019) 19tourism year coincided with the resumption of an upward trajectory in market share. This contrasts with
a slowdown in Chinese long-haul demand in general, suggesting the tourism year allowed the EU to
buck the wider trend.
Chinese outbound growth, long-haul vs. EU and EU share of LH
Index, 2012=100 % share
240 48%
220 47%
200
46%
180
45%
160
44%
140
China to LH
120 China to EU 43%
Share of Chinese LH outbound (RHS)
100 42%
2012 2013 2014 2015 2016 2017 2018
Source: Tourism Economics
The EU-China tourism year corresponded with some market share growth for
both EU and non-EU ETC destinations
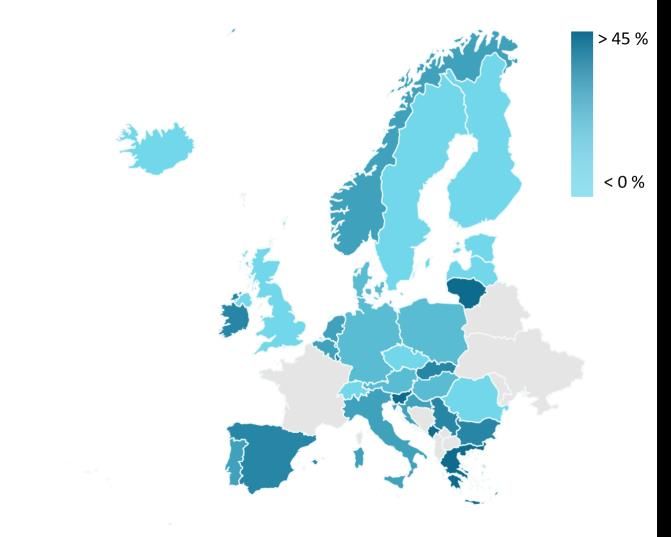
In addition to helping EU destinations gain share of Chinese long-haul demand, the EU-China tourism
year also corresponded with some market share growth for non-EU ETC destinations over the same
period. This spill-over is a function of Europe’s compact geography and the relative proximity of many
destinations, allowing long-haul travellers to maximise the value of their long-haul trip. Multiple destina-
tions in the region can be visited with relative ease during the same trip.
Market share impact of EU-China tourism year
% share LH outbound, 2016
% share of total outbound from China
% share LH outbound, 2019
50%
45%
40%
35%
30%
25%
20%
15%
10%
5%
0%
EU non-EU ETC
Source: Tourism Economics
However, other factors (beyond the tourism year) would have contributed to growth in Chinese arrivals
to these non-EU destinations. For instance, Serbia – the recipient of the largest degree of growth from
China in 2018 – relaxed visa requirements for Chinese visitors in early-2017 and direct air links between
the two has facilitated some rapid demand growth from China since. This supports our long-held view
that visa-free access is the ultimate tool with which to leverage travel demand from previously untapped
source markets.
EUROPEAN TOURISM: TRENDS & PROSPECTS (Q2/2019) 20Chinese visits and overnights to select destinations Arrivals
% change 2018 Nights
105
90
75
60
45
30
15
0 Belgium
Montenegro
Turkey
Austria
Portugal
Denmark
Norway
Lithuania
Poland
Serbia
Cyprus
Croatia
Spain
Slovakia
Hungary
Netherlands
UK
Germany
Slovenia
Iceland
Monaco
Czech Rep
Switzerland
Finland
Romania
Latvia
Luxembourg
Estonia
-15
-30
Source: TourMIS
VISA POLICY – A MORE EFFECTIVE LEVER OF DEMAND?
Chinese travel demand to Europe has been strong in recent years and the outlook remains promising.
Although the EU-China Tourism Year is over, a number of EU destinations remain top of the agenda
for growing numbers of Chinese travellers according to early-2019 data. This offers some evidence of
the tourism year’s success.
Travel demand from China continues to be constrained by visa requirements
However, China is subjected to some of the most stringent visa requirements imposed by EU destina-
tions, and this has ultimately constrained growth relative to many other destinations worldwide. Serbia’s
recent bold step to remove this barrier has shown the potential growth that can be achieved by relaxing
visa restrictions.
Chinese visits and overnights to select destinations Arrivals
2019 year-to-date*, % change year ago Nights
70
60 Montenegro, 150% (A) & 137% (N)
50 Lithuania, 77.3% (A)
Slovakia, -28.0% (A) & -23.8% (N)
40
30
20
10
0
Lithuania
Portugal
Montenegro
Denmark
Norway
Belgium
Austria
Turkey
Poland
Slovenia
Cyprus
Croatia
Hungary
Slovakia
Serbia
Spain
Switzerland
Netherlands
Latvia
Germany
Monaco
Iceland
Sweden
Finland
Czech Rep
Romania
Luxembourg
Estonia
Bulgaria
-10
Source: TourMIS *date varies (Jan-May) by destination
European destinations currently receive only a moderately larger share of Chinese outbound travel than
in prior years, despite some rapid growth in Chinese travel demand over the same period. The EU-
China tourism year has demonstrated that significant demand exists now – the events of 2014-16 (when
EUROPEAN TOURISM: TRENDS & PROSPECTS (Q2/2019) 21the EU’s share of Chinese long-haul demand was falling) demonstrate travellers’ willingness to go else-
where if Europe is seen to be unattractive.
Numerous case studies demonstrate the benefits to travel demand via visa facilitation policies. Visas
are viewed as a formal constraint by travellers, involving additional trip costs in terms of either monetary
cost or indirect costs in the form of time spent waiting or completing complex application procedures.
Visa facilitation policy has clear benefits to destinations in the form of promoting ease of travel and
raising visitor volumes. The relative attractiveness of a destination is raised allowing greater competition
in global travel markets and gain of market share as well as potentially raising total international travel
demand for source markets, depending on the existing level of constraints. Indeed, there remains a
large opportunity for even faster travel demand growth from Chinese in the coming years. The magni-
tude of this uplift, however, will depend on the specific policy approach adopted.
The market share gains made during the tourism year help to illustrate the growth opportunity from
China. Ultimately this example may help to bring about a more facilitative visa policy to generate longer-
run gains.
Arrivals to EU from China under different scenarios
Arrivals, 000s
30.000 Baseline
Scenario 1: best practice
25.000 Scenario 2: new visa types
Scenario 3: visa free travel
20.000
15.000
10.000
5.000
2018 2019 2020 2021 2022 2023
Source: Tourism Economics
EUROPEAN TOURISM: TRENDS & PROSPECTS (Q2/2019) 22KEY SOURCE MARKET PERFORMANCE
Trends discussed in this section in some cases relate to period January to May, although actual cover-
age varies by destination. For the majority of countries, the latest available data point will be earlier than
this. Further detailed monthly data for origin and destination, including absolute values, can be obtained
from TourMIS (http://tourmis.info).
SUMMARY
• There was a mixed picture across European source markets with an unusually high number of
destinations reporting declines from Germany – Europe’s largest source market and arguable
indicator of the region’s economic prospects. But a higher proportion of destinations have re-
ported growth from most of Europe’s other large source markets.
• In general, growth from many non-European source markets stood up better with only two desti-
nations seeing no growth from the US and China. A higher than usual proportion of destinations
have reported growth from Japan, with the strong yen aiding outbound travel.
KEY INTRA-EUROPEAN MARKETS
Germany is Europe’s largest source market, accounting for a large share of total arrivals in many des-
tinations. It may be of some concern that based on the latest available data half have reported declines.
This is perhaps a consequence of Europe’s economic slowdown, much of which has been shouldered
by Germany, particularly towards the end of 2018 wherein recession conditions were narrowly avoided.
However, the German economy bounced backed in Q1 2019, the effects of which may seep into travel
demand further into 2019. Some sizable drops have been reported in early-2019 by key summer desti-
nations; whilst these do not bode well, such falls are not likely to be fully reflective of annual perfor-
mance.
Half of reporting destinations saw declines in arrivals from Germany in early-
2019 data
Montenegro was the fastest growing destination market for German arrivals according to latest available
year-to-date data, with arrivals up 486% and overnights up 201% according to data to April. This growth
represents a moderate slowdown compared to earlier in the year when rates of 520% and 266% were
reported for arrivals and overnights respectively, reflecting stronger growth in January and February as
a result of Montenegro’s efforts to broaden its tourism season. This has been facilitated by greater air
connectivity between Germany and the Balkans, which continues to improve. As of April, Austrian low-
cost airline Laudamotion is operating a service between Stuttgart and Podgorica, and Germany’s
Lufthansa will launch a seasonal flight from Tivat to Munich and Frankfurt as part of the expansion of
its network in the Balkans.
Slovenia has also continued to enjoy strong arrivals growth from Germany in early-2019, following some
strong growth last year, serviced by greater air connectivity. In March the Slovenian government an-
nounced plans to subsidise airlines for the launch of new routes to and from Ljubljana in an attempt to
improve the country's air connectivity by 2021, with Germany identified as being a destination of stra-
tegic importance. This should support further growth from Germany. Spain has reported recovery in
German arrivals which grew 6.5% according to data for the first four months of the year, following de-
clines in 2018. Overnights have continued to fall, however.
EUROPEAN TOURISM: TRENDS & PROSPECTS (Q2/2019) 23German visits and overnights to select destinations Arrivals
2019 year-to-date*, % change year ago Nights
30
Montenegro, 486% (A) & 201% (N)
20 Croatia, -30.8% (N)
Sweden, -45.1% (N)
10
0
Belgium
Portugal
Malta
Montenegro
Turkey
Norway
Denmark
Serbia
Italy
Poland
Austria
Slovenia
Hungary
Lithuania
Slovakia
Cyprus
Croatia
Spain
Ireland Rep
Switzerland
Greece
Netherlands
Estonia
Iceland
Sweden
Latvia
Finland
Bulgaria
Luxembourg
Monaco
Czech Rep
Romania
-10
-20
-30
Source: TourMIS *date varies (Jan-May) by destination
Growth from the Netherlands was more widespread than from Germany, with 69% of reporting desti-
nations claiming some degree of growth during the early-2019 period. But there are some worrying
signs with falls reported in early in 2019 by some large destinations.
Growth from the Netherlands was more widespread than from Germany
As was also the case with regards Germany, Montenegro was the destination which reported the great-
est degree of growth. Arrivals have grown 226% and overnights 58.8% in the first four months of 2019
compared to a year ago. Whilst this represents a slowdown compared to growth earlier in the year, this
is not linked to any underlying trend of slowing demand. Rather, it is reflective of Montenegro’s broader
tourism season which has begun to incorporate winter months.
Lithuania and Estonia have seen an increase in demand from Netherlands so far this year compared
to last, and they may be jointly benefitting from Baltic tours which typically incorporate visits to Lithuania,
Estonia, and Latvia. Turkey continues to enjoy strong growth from the Netherlands as it regains market
share lost in previous years. In 2018 we suggested this market share was lost to Spain and Portugal;
indeed, present declines in Dutch overnights in Spain and arrivals and overnights in Portugal are con-
sistent with this suggestion.
Dutch visits and overnights to select destinations Arrivals
2019 year-to-date*, % change year ago Nights
30
Montenegro, 226% (A) & 58.8% (N)
20
Sweden, -38.6% (N)
10
0
Malta
Belgium
Turkey
Norway
Portugal
Montenegro
Denmark
Serbia
Germany
Austria
Lithuania
Croatia
Poland
Monaco
Cyprus
Spain
Slovakia
Slovenia
Hungary
Finland
Switzerland
Iceland
Latvia
Luxembourg
Sweden
Estonia
Bulgaria
Czech Rep
Romania
-10
-20
Source: TourMIS *date varies (Jan-May) by destination
EUROPEAN TOURISM: TRENDS & PROSPECTS (Q2/2019) 24Almost two fifths (79%) of reporting destinations enjoyed some form of growth from France based on
the latest available data.
Two fifths of reporting destinations enjoyed some form of growth from France
Earlier in the year just over 60% of reporting destinations had reported growth from France. Greece
enjoyed the highest rate of demand growth from France according to data for the first quarter of 2019.
This was driven by an increase in flights from France to Greece this year following discussions between
Greece’s Tourism Minister and leading representatives of the French travel market in Paris last year in
conjunction with tourism industry trade fair IFTM Top Resa 2018. Later this year, Greece is set to feature
in a popular French travel programme with the backing of the Hellenic Tourism Organization (EOT),
which should support growth further.
Significant growth from France was also reported by Ireland, wherein arrivals grew 17.9% based on
data to April. This influx follows an extensive programme of promotions in France last year, including
Tourism Ireland’s campaign with Promovacances – a leading French travel group – designed to grow
visitor numbers from France.
French visits and overnights to select destinations Arrivals
2019 year-to-date*, % change year ago Nights
20 Greece, 42.8% (A)
Czech Rep., 22.8% (N)
15 Turkey, 21.3% (A)
Sweden, -22.2% (N)
Cyprus, -22.5% (N)
10
5
0
Lithuania
Turkey
Norway
Austria
Malta
Denmark
Montenegro
Belgium
Portugal
Hungary
Italy
Serbia
Slovakia
Netherlands
Poland
Germany
Croatia
Spain
Slovenia
Monaco
Iceland
Cyprus
Ireland Rep
Switzerland
Sweden
Greece
Czech Rep
Finland
Latvia
Luxembourg
Estonia
Bulgaria
Romania
-5
-10
-15
Source: TourMIS *date varies (Jan-May) by destination
Growth from Italy was enjoyed by just two thirds of reporting destinations based on the latest available
data for 2019. Having stumbled into recession in H2 2018, and with stagnation set to continue this year,
it is somewhat surprising that trends are not worse, and some large destinations continue to report
growth. Cyprus enjoyed further growth in Italian arrivals off the back of a very strong growth year in
2018. This has been helped by new air links between the two, including Cyprus Airway’s first foray into
the Italian market with its flight from Larnaca to Verona.
Recession in Italy may upset outbound travel growth prospects
Turkey also continues to report significant growth from Italy as its reclamations of lost market share
from 2015-17 continue (its share of Italian outbound was 1.1% in 2015 but fell to 0.4% in 2017). Con-
sequently, Italian arrivals to Spain have declined in 2019 to date and overnights growth was weak,
unwinding some of the growth in the share of the Italian market in prior years (which grew from 14% in
2015 to 14.8% in 2017, at some expense to Turkey).
Declines in Italian arrivals were reported by several Central European destinations (Poland, Czech Re-
public, Bulgaria, Romania, and Hungary), and some pricier Northern European destinations such as
Norway, Denmark, Sweden, Ireland, and Iceland which may reflect the precariousness of Italy’s econ-
omy at present.
EUROPEAN TOURISM: TRENDS & PROSPECTS (Q2/2019) 25You can also read