SURVEY GERMANY CITY OFFICE AND INVESTMENT MARKETS - AN OVERVIEW - Colliers

Page created by Anna Austin
 
CONTINUE READING
SURVEY GERMANY CITY OFFICE AND INVESTMENT MARKETS - AN OVERVIEW - Colliers
GERMANY

CITY
SURVEY
OFFICE AND INVESTMENT
MARKETS – AN OVERVIEW

2020 / 2021
SURVEY GERMANY CITY OFFICE AND INVESTMENT MARKETS - AN OVERVIEW - Colliers
ACCELERATION
                              INSTEAD OF
                              STANDSTILL
                              At the last publication of our City Survey,   Digitalization, which has now also made a
                              no one could even guess at the challenges     breakthrough in the real estate sector,
                              the economy and the real estate markets       has been acting as a pioneer in all of this
                              would face in 2020. Although the impact       and setting the pace for market activity.
                              of the economic downturn and challeng-        By making it possible to finalize deals and
                              ing global environment on the German          sign leases online in light of the contact
                              leasing and investment markets were a         restrictions in place, offering many em-
                              topic of discussion a year ago, no one        ployees the option to work from home and
                              doubted that the unusually long, robust       further spurring the e-commerce sector,
Matthias Leube MRICS          boom would continue. The prospect of          digitalization has brought with it transfor-
CHIEF EXECUTIVE OFFICER       ongoing, strong market performance now        mational changes to the office, retail,
matthias.leube@colliers.com   appears obsolete, however, in view of a       logistics and hotel sectors.
                              pandemic that temporarily eclipses all
                              previous risks of a downturn and is diffi-    However, the Covid-19 crisis has also
                              cult to get a handle on because of its com-   ­increased risk awareness and brought
                              plexity. But is this actually the case?       with it the tendency to place greater
                                                                            ­importance on the quality and future-­
                              At no time did activity on the German real    resilience of an asset. Being able to
                              estate market come to a full standstill.      ­identify and realize sustainable concepts
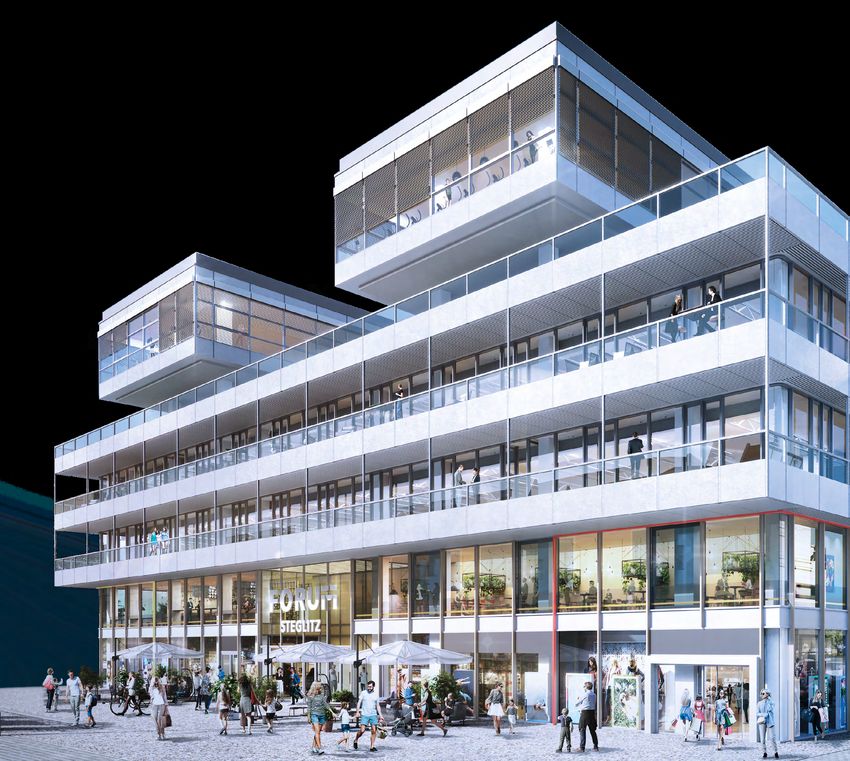
                              Following a brief orientation phase on the    that fit the demands of market players in
                              investment and leasing markets in Q2          that location, like Forum Steglitz featured
                              2020, activity began to pick up in the        on our cover page, is key to crisis-resil-
                              ­second half of the year and again tangibly   ient investment.
                              accelerated in Q4 despite a second lock-
                              down in early November. This momentum         I look forward to exploring these new
                              is an impressive indication of the robust     ­opportunities with you.
                              nature of the German real estate market
                              and the capacity of market players to
                              adapt to an environment that is new to all
                              of us.
SURVEY GERMANY CITY OFFICE AND INVESTMENT MARKETS - AN OVERVIEW - Colliers
3

CONTENTS

                                                          City Survey Germany | Colliers International
                                                          CONTENTS | 2020 / 2021
           Market Data                               4

           Commercial Real Estate Market Germany
             Office Leasing                          6
             Investment                              9
             Retail Investment                      12
             Industrial and Logistics Investment    15
             Hotel Investment                       18

           City Reports
             Berlin
             Office Leasing                         23
             Investment                             25

             Düsseldorf
             Office Leasing                         29
             Investment                             31

             Frankfurt
             Office Leasing                         35
             Investment                             37

             Hamburg
             Office Leasing                         41
             Investment                             43

             Cologne
             Office Leasing                         47
             Investment                             49

             Munich
             Office Leasing                         53
             Investment                             55

             Stuttgart
             Office Leasing                         59
             Investment                             61

           Research Services                        64

           Glossary                                 66

           Contacts /Locations                      67
SURVEY GERMANY CITY OFFICE AND INVESTMENT MARKETS - AN OVERVIEW - Colliers
4
                                               MARKET DATA
                                               Office Leasing
              Market Data | 2020 / 2021
City Survey Germany | Colliers International

                                                                                                          TOP 7         Berlin       Düsseldorf       Frankfurt          Hamburg           Cologne         Munich      Stuttgart

                                               Stock of Office Space in million sqm                       92.83          20.90               7.86              11.49            13.99            7.92        22.50          8.17

                                               Office Space Take-up 2020 in sqm                      2,555,100       734,000           248,000          329,500           334,300         202,000          567,800      139,500

                                               Change year-on-year in %                                   – 35.3        – 28.7              – 47.8            – 40.1            – 37.6          – 26.5       – 26.3       – 55.3

                                               Forecast for 2021

                                               Office Space Take-up in sqm                           3,457,000       750,580           344,500          505,300           525,000         296,600          762,600     272,500
                                               Average 2010 –2019

                                               Prime Rent in € / sqm                                                      41.10             28.50             45.00             30.00           25.75        39.50        25.50

                                               Forecast for 2021

                                               Average Rent in € / sqm                                                   28.70              16.30             23.00              17.10          15.90        21.50        16.60

                                               Forecast for 2021

                                               Vacant Office Space in sqm                            3,269,900       354,000           436,500          810,200           413,300          219,300         787,900     248,700

                                               Vacancy Rate in %                                              3.5            1.7              5.5                7.1              3.0             2.8          3.5          3.0

                                               Change year-on-year in bp*                                     60            50               – 40                20                50              60          130          110

                                               Forecast for 2021

                                               The data for Berlin, Düsseldorf, Hamburg and Cologne are related to the respective city area. The data for Frankfurt, Munich and Stuttgart are related to each of the
                                               ­respective markets on the whole.
                                                * basis points

                                               Investment
                                                                                                         Germany         TOP  7 Berlin        Düsseldorf Frankfurt HamburgCologne                             Munich Stuttgart

                                               Transaction Volume 2020 in million €                       59,247     30,576        8,549             3,220             6,335         5,008         1,450      4,969       1,045

                                               Change year-on-year in %                                     – 17.3    – 30.6       – 29.8            – 16.1            – 19.2            16.7 – 55.2          – 54.4     – 40.5

                                               Forecast for 2021

                                               Transaction Volume in million €                            43,599     24,702        5,658             2,127         5,220             3,473         1,501      5,459       1,264
                                               Average 2010 – 2019

                                               Prime Yield Offices in %                                                             2.80              3.20              3.00             3.00       3.30       2.70         3.10

                                               Prime Yield High Street Retail in %                                                  3.20              3.40             2.80              3.30      3.40        2.80        3.30

                                               Prime Yield Logistics in %                                                                                                         3.70 **
                                               ** Refers to the defined logistics market areas
SURVEY GERMANY CITY OFFICE AND INVESTMENT MARKETS - AN OVERVIEW - Colliers
5

                            City Survey Germany | Colliers International
                            Commercial Real Estate Market Germany | 2020 / 2021
COMMERCIAL
REAL ESTATE
MARKET
GERMANY
OFFICE LEASING
              6

INVESTMENT
          9

RETAIL INVESTMENT
                  12

INDUSTRIAL AND
LOGISTICS INVESTMENT
                       15

HOTEL INVESTMENT
                  18
SURVEY GERMANY CITY OFFICE AND INVESTMENT MARKETS - AN OVERVIEW - Colliers
6

                                                               OFFICE LEASING
Commercial Real Estate Market Germany | 2020 / 2021
                City Survey Germany | Colliers International

                                                                                                        Take-up                                              Following a slow start to the year, the
                                                                                                                                                             German office leasing market hit its
                                                                                                        The German office leasing market was hit
                                                                                                                                                             trough in Q3 with take-up at just under
                                                                                                        hard by the Covid-19 pandemic. In early
                                                                                                                                                             600,000 sqm. Sentiment improved at
                                                                                                        2020, the global economic downturn
                                                                                                                                                             year-end and Q4 2020 posted the year’s
                                                                                                        mainly impacted manufacturing and ex-
                                                                                                                                                             highest quarterly take-up of 712,300 sqm.
                                                                                                        port-oriented sectors. At the latest by
                                                                                                        spring, however, almost all sectors have
                                                                                                                                                             Activity proved livelier in Berlin than in
                                                                                                        found themselves in a recession. As ex-
                                                                                                                                                             Germany’s other top 7 cities. The German
                                                                                                        pected, the office leasing market is being
                                                                                                                                                             capital recorded 734,000 sqm in take-up
                                                                                                        affected by the economic crisis as well.
                                                                                                                                                             in 2020, only slightly below the ten-year
                                                                                                        Expansion plans have been postponed or
                                                                                                                                                             average of 750,000 sqm. Annual take-up
                                                                                                        are simply not being implemented as the
                                                                                                                                                             in the other cities came in 25% to 50%
                                                                                                        result of the pandemic. Roughly 2.6 mil-
                                                                                                                                                             ­below the long-time average. Most loca-
                                                                                                        lion sqm in take-up was posted in Germa-
                                                                                                                                                             tions only saw a handful of large-scale
                                                                                                        ny’s 7 top office hubs in 2020, down
                                                                                                                                                             leases signed for over 10,000 sqm.
                                                                                                        roughly 35% compared to the previous
                                                                                                                                                             ­Leases targeting over 5,000 sqm were
                                                                                                        year’s exceptional results and around
                                                                                                                                                             also scarcer than in the previous year.
                                                                                                        25% below the ten-year average. Never-
                                                                                                                                                             Take-up of small and medium-scale units
                                                                                                        theless, 2020 take-up results are still
                                                                                                                                                             was not as heavily impacted by the
                                                                                                        higher than they were during the 2009
                                                                                                                                                             ­pandemic with some locations posting
                                                                                                        ­financial crisis, in which only 2.3 million
                                                                                                                                                             relatively substantial results.
                                                                                                        sqm of office space was taken up.

                                                               Fast Facts                                                        Figure 1: Office Space Take-up in the TOP 7
                                                                                                                                 in million sqm
                                                               Office Leasing TOP  7               2020            Change
                                                                                                              year-on-year
                                                                                                                                 4,5                   4.2
                                                               Office Space Take-up       2,555,100 sqm             – 35.3%               3.9                     3.8        3.9
                                                                                                                                 3,5
                                                               Vacant Floor Space         3,269,900 sqm               22.9%
                                                                                                                                 4,0
                                                               Vacancy Rate                         3.5%             60  bp*                                                                     3.0
                                                                                                                                 3,0                                                   2.6
                                                               Office Space Stock      92.83 million   sqm             0.2%
                                                                                                                                 2,5
                                                               * basis points
                                                                                                                                 2,0
                                                                                                                                1,5
                                                                                                                                 1,0
                                                                                                                                 0,5
                                                                                                                                 0,0
                                                                                                                                        2016 2017 2018 2019 2020 2021
                                                                                                                                           Whole year             Forecast
                                                                                                                                           Average 2016 – 2020
SURVEY GERMANY CITY OFFICE AND INVESTMENT MARKETS - AN OVERVIEW - Colliers
7

                                                    Rents                                                landlords in the form of rent-free periods
                                                                                                         began to play an increasingly important

                                                                                                                                                        City Survey Germany | Colliers International
                                                                                                                                                        Commercial Real Estate Market Germany | 2020 / 2021
                                                    The increase in prime rents over the past
                                                                                                         role towards the end of the year.
                                                    several years, sometimes in the double
                                                    digits, stopped short in early 2020, and
                                                    prime rents have been trending sideways              Supply and Vacancy
                                                    ever since. The only exception is Stutt-
                                                                                                         Unlike 2019, vacancy increased across
                                                    gart, where prime rents rose more than
                                                                                                         the board with the exception of Düssel-
                                                    6% to a current €25.50 per sqm. Prime
                                                                                                         dorf. However, the wave of vacancies
                                                    rents in Frankfurt fell slightly by 50 cents
                                                                                                         feared by some market participants did
                                                    to €45.00 per sqm, allowing the city to
                                                                                                         not materialize. Vacancies were only up
                                                    keep its status as having the highest
                                                                                                         moderately with the vacancy rate still
                                                    prime rents in Germany. Frankfurt pri-
                                                                                                         ­below the 5% threshold in all cities except
                                                    marily has this reputation due to the
                                                                                                         for Düsseldorf and Frankfurt, indicating
                                                    unique office space offered by the city’s
                                                                                                         a tense market situation.
                                                    CBD combined with the presence of
                                                    ­solvent tenants from the consulting, com-
                                                                                                         Although the practice of subletting
                                                    munication and finance sectors.
                                                                                                         ­increased in significance in H2, offers
                                                                                                         ­remained scattered and subletting has
                                                    The situation around average rents paint-
                                                                                                         yet to become a widespread phenomenon.
                                                    ed a diverse picture. Average rents in
                                                                                                         The average share of vacancies in the
                                                    Berlin, Frankfurt and Munich continued to
                                                                                                         TOP 7 is less than 10%.
                                                    rise considerably by 9%, 8% and 7%, re-
                                                    spectively. Tenants in Berlin could expect
                                                                                                         Only a few new-build developments saw
                                                    to pay an average of €28.70 per sqm with
                                                                                                         their completion delayed and around
                                                    €21.50 per sqm the standard in Munich
                                                                                                         1.7 million sqm of new office space hit the
                                                    and €23.00 per sqm in Frankfurt. Düssel-
                                                                                                         market in 2020. Almost 80% of that space
                                                    dorf experienced a very different trend
                                                                                                         had been taken up by year-end. A similar
                                                    with average rents down almost 6% to
                                                                                                         amount of office space is scheduled for
                                                    €16.30 per sqm. Incentives granted by

Figure 2: Completions of Office Properties in the                            Figure 3: Vacancy Rate in the TOP 7 in %
TOP 7 in total in 1,000 sqm                                                  and Vacancy in million sqm

2,000                                                              1,888     6
                                            1,739      1,697                        4.9 %
                                                                             5
1,500                                                                                              4.1 %
                                    1,226                                    4      4.4
                                                                                                                                             3.5 %
                                                           1,070                                                   3.1 %
                                                                                                   3.7                         2.9 %
        939
1,000                       843                                              3                                                               3.3
                   770                                                 774                                         2.9
                                                                                                                               2.7
                                                                             2
 500
                                                                             1

   0                                                                         0
        2016 2017 2018 2019 2020 2021 2022                                       2016           2017            2018         2019        2020
              Completions                   Pre-let                                Vacancy               Vacancy Rate
              Average 2016 – 2020
SURVEY GERMANY CITY OFFICE AND INVESTMENT MARKETS - AN OVERVIEW - Colliers
8

                                                                                                            completion in the next two years as well.       The start of vaccinations and general up-
                                                                                                            Around 63% of the space scheduled for           swing in the economy give cause for hope.
Commercial Real Estate Market Germany | 2020 / 2021
                City Survey Germany | Colliers International

                                                                                                            completion in 2021 has been preleased           According to the ifo Business Climate
                                                                                                            along with 40% of the space scheduled           ­Index, company business sentiment for
                                                                                                            for completion in 2022. Despite the spike       2021 was up in December and a number
                                                                                                            in remote working since the spring, com-        of economic forecasts are predicting GDP
                                                                                                            panies do not appear to be turning their        growth of over 4%. This positive outlook
                                                                                                            backs on the office despite the fact that       will trigger a boost in demand on the of-
                                                                                                            working from home is gaining increasing         fice markets, albeit somewhat delayed.
                                                                                                            acceptance with employers and their             Due to the second wave of the pandemic,
                                                                                                            ­employees. Offices will continue to be the     we do not expect the markets to return
                                                                                                            main hub for communication and innova-          to pre-crisis levels in the near future.
                                                                                                            tion going forward.                             However, a result of 3.0 million sqm take-
                                                                                                                                                            up is feasible.

                                                                                                            Summary and Outlook
                                                                                                            2020 was a challenging year for the office
                                                                                                            leasing market. Many companies were
                                                               Philipp Allroggen                            more reserved in their leasing activity
                                                               Junior Consultant I Research                 than in past years because of the Covid-19
                                                               +49 211 862062-40                            crisis and the uncertainties it has brought
                                                               philipp.allroggen@colliers.com               with it.

                                                               Figure 4: Vacancy Rate in the TOP 7 in %                            Figure 5: Average Rents in the TOP 7 in €/sqm

                                                               15                                                                   30
                                                                                                                                    28
                                                                                                                                    26
                                                                                                                                    24
                                                               10
                                                                                                                                    22
                                                                                                                                    20
                                                                                                                                    18
                                                               5
                                                                                                                                    16
                                                                                                                                    14
                                                                                                                                    12
                                                                0                                                                   10
                                                                    Q4 16 Q4 17 Q4 18 Q4 19 Q4 20                                         Q4 16 Q4 17 Q4 18 Q4 19 Q4 20
                                                                      Berlin       Düsseldorf   Frankfurt         Hamburg                   Berlin        Düsseldorf      Frankfurt       Hamburg

                                                                      Cologne      Munich       Stuttgart                                   Cologne       Munich          Stuttgart
SURVEY GERMANY CITY OFFICE AND INVESTMENT MARKETS - AN OVERVIEW - Colliers
9

INVESTMENT

                                                                                                                                                         City Survey Germany | Colliers International
                                                                                                                                                         Commercial Real Estate Market Germany | 2020 / 2021
                                              Transaction Volume                                     Supply and Demand
                                              German commercial real estate assets                   Investor confidence in the German real
                                              posted a transaction volume of €59.2bn in              estate market was quick to rebound fol-
                                              2020, reflecting the third-best result in              lowing a brief orientation phase in Q2.
                                              the past decade while significantly ex-                With ten large-scale transactions chang-
                                              ceeding the €50bn mark for the sixth year              ing hands for over €250m in Q1, this num-
                                              in a row despite the Covid-19 pandemic.                ber halfed to five in Q2, bounced back to
                                              Q4 contributed €18.2bn, or 31%, to the                 ten in Q3 and increased to thirteen in Q4.
                                              ­annual result, slightly exceeding the re-
                                              cord start to the year of €17.7bn. This indi-          The year’s highest-volume deal by far was
                                              cates a return to the upward trend that                the TLG portfolio acquisition for around
                                              characterized the investment market in                 €4bn in Q1 within the scope of the
                                              H2 2020 following the relatively moderate              Aroundtown merger. This noteworthy
                                              impact of the first lockdown, with market              deal alone accounts for one-fifth of the
                                              activity even gaining additional momen-                annual total volume generated by portfolio
                                              tum in the last three months of the year.              acquisitions, reflecting €20.9bn, or a 35%
                                                                                                     market share. The largest single-asset
                                              Investors continue to focus on Germany’s               deal of the year was Silberturm in Frank-
                                              top 7 investment hubs, pouring roughly                 furt, which was sold on behalf of Sam-
                                              €30.6bn, or 52% of transaction volume,                 sung Life Insurance and asset manager
                                              into these markets in 2020. However, de-               Hines to Austrian Imfarr Beteiligungs AG
                                              spite the fact that there were high-volume             and Swiss SN Beteiligungen Holding AG.
                                              deals signed in H2, none of the country’s              The deal marks an important milestone
                                              top 7 investment locations were able to                for the overall market in terms of the re-
                                              exceed the €10bn mark in 2020 as Berlin                turn of foreign investors, particularly
                                              and Munich managed in 2019.                            from Asia, after the lockdown in March.

Fast Facts                                                            Figure 1: Total and Office Transaction Volume in
                                                                      Germany in billion €
Transaction Volume in million €    2020      2019        Change

Commercial Properties total       59,247    71,630       – 17.3%      80
                                                                                                                     71.6
  Total Top 7                     30,576    44,047       – 30.6%      70
                                                                                                           60.6                    59.2
                                                                                             57.3                                                57.5
Type of transaction                                                   60
                                                                               52.6
Individual Transactions           38,341    50,576       – 24.2%      50
                                                                                                                            40.5
  Share in the TOP 7              23,324    34,908       – 33.2%      40
Portfolio Transactions            20,906    21,053        – 0.7%                                              30.9
                                                                      30              24.9          26.7
  Share in the TOP 7               7,252     9,140       – 20.7%                                                                          20.4
                                                                      20
Source of capital
                                                                      10
Share by International Buyers     25,344    30,436        – 16.7%
                                                                       0
  Share in the TOP 7               13,151    19,841      – 33.7%
                                                                               2016 2017 2018 2019 2020 2021
Share by International Sellers    17,900    30,526        – 41.4%             Transaction Volume in Germany                        Forecast
  Share in the TOP 7               9,126    20,356       – 55.2%              thereof Office Properties                              Average 2016 – 2020
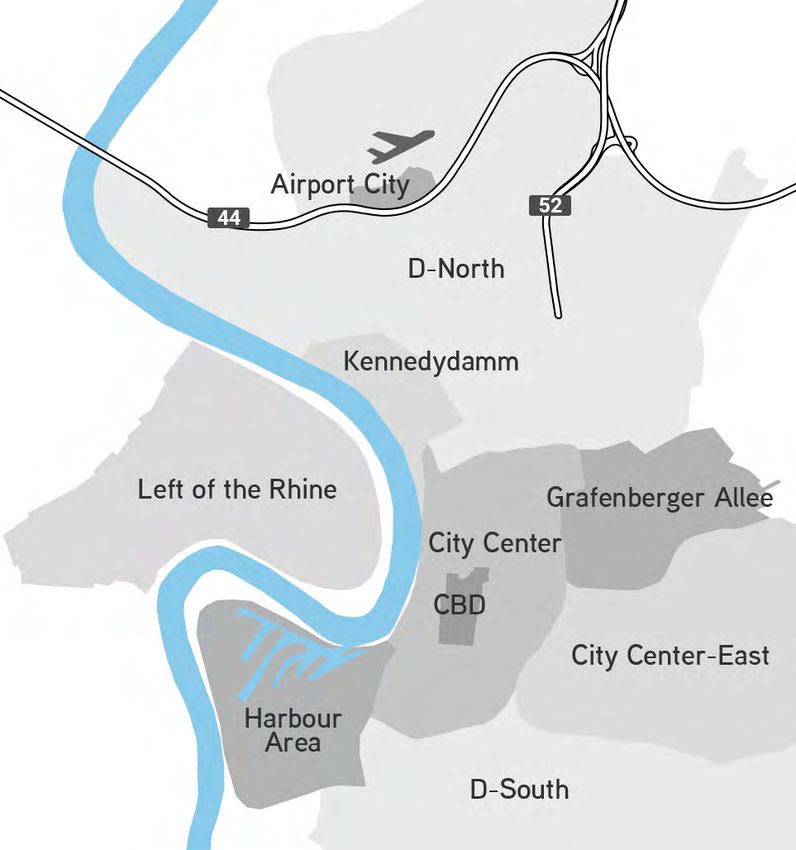
SURVEY GERMANY CITY OFFICE AND INVESTMENT MARKETS - AN OVERVIEW - Colliers
10

                                                                                                      Foreign investors accounted for an overall            particularly in Q4. As a result, prime
                                                                                                      market share of 43% and a transaction vol-            yields are currently posting anywhere
Commercial Real Estate Market Germany | 2020 / 2021
                City Survey Germany | Colliers International

                                                                                                      ume of €25.3bn. Domestic investors with               from 2.70% in Munich to 3.30% in
                                                                                                      their strong equity base, however, acted as           ­Cologne. However, building quality and
                                                                                                      a particularly stabilizing factor in the face         length of lease term are playing an in-
                                                                                                      of the crisis over the course of the year.            creasingly important role in determining
                                                                                                      German institutional investors proved                 the purchase price and marketability of
                                                                                                      quite active in the small-to-medium market            a property. Highly sought-after logistics
                                                                                                      segment of under €100m, particularly in               properties that meet current market
                                                                                                      Q2 and Q3 when foreign investors tended               standards recorded the most substantial
                                                                                                      to prefer a wait-and-see stance. Through-             price increases throughout 2020. Aver-
                                                                                                      out all of 2020, German institutional inves-          age prime yields in Germany’s top
                                                                                                      tors dominated this size segment with a               ­l­ocations came to 3.70% in December.
                                                                                                      market share of 75% and a 57% market                  ­However, we expect to see considerable
                                                                                                      share across all size segments.                       price reductions outside the premium
                                                                                                                                                            segment. Office/retail mix buildings in
                                                                                                      Open-ended real estate funds and special              prime locations were only sporadically
                                                                                                      funds took the lead buy-side with €13.2bn,            ­involved in deals in 2020, with yields ris-
                                                                                                      or 22%, ahead of asset and fund manag-                ing in many markets.
                                                                                                      ers with €11.6bn, or 20%, and listed prop-
                                                                                                      erty companies with €7.1bn, or 12%.
                                                                                                                                                            Office Investment
                                                                                                                                                            Office assets were able to strengthen
                                                                                                      Yields
                                                                                                                                                            their lead and increase their market share
                                                                                                      Gross prime yields experienced further                to 46% in the past three months. Discus-
                                                                                                      compression ranging between 5 bps and                 sions surrounding the topic of the office
                                                                                                      20 bps in Germany’s office hubs of Mu-                of the future in light of the current trend
                                                                                                      nich, Düsseldorf, Hamburg and Stuttgart               towards remote and flexible working
                                                                                                      due to excess demand for core assets,                 ­arrangements as well as the pandemic’s

                                                               Figure 2: Transaction Volume                                       Figure 3: Buyer and Seller Groups in Germany
                                                               by Size Category 2020 share in %                                   in billion €

                                                                                                       upupto to € 10
                                                                                                               € 10 m m5%5%                                             00       5 5 1010 1515 20
                                                                                                                                                                                                20
                                                                                                    € 10
                                                                                                  € 10 mmto to € 25
                                                                                                             € 25 m m10%10% Open-ended
                                                                                                                              Open-ended Real
                                                                                                                                       Real   Estate
                                                                                                                                            Estate   Funds/Special
                                                                                                                                                   Funds/Special   Funds
                                                                                                                                                                 Funds
                                                                                                    € 25
                                                                                                  € 25 mmto to € 50
                                                                                                             € 50       13%
                                                                                                                   m m13%               Asset
                                                                                                                                     Asset     Managers/Fund
                                                                                                                                            Managers/Fund      Managers
                                                                                                                                                            Managers
                                                                                                                                                   Listed
                                                                                                                                                 Listed   Property
                                                                                                                                                        Property   Companies
                                                                                                                                                                 Companies
                                                                                                                                                        Property
                                                                                                                                                      Property   Developers
                                                                                                                                                               Developers
                                                                                                    € 50
                                                                                                  € 50 mmto to € 100
                                                                                                            € 100       15%
                                                                                                                   m m15%
                                                                                                                                                        Insurance
                                                                                                                                                      Insurance   Companies
                                                                                                                                                                Companies
                                                                                                                                                             Other
                                                                                                                                                           Other   Investors
                                                                                                                                                                 Investors

                                                                                                     € 100
                                                                                                  € 100  mmto to € 250
                                                                                                              € 250       26%
                                                                                                                     m m26%                             Property
                                                                                                                                                      Property   Developers
                                                                                                                                                               Developers
                                                                                                        above    € 250
                                                                                                     above € 250 m 31% m  31%                      Listed
                                                                                                                                                 Listed   Property
                                                                                                                                                        Property   Companies
                                                                                                                                                                 Companies
                                                                                                                                            Asset
                                                                                                                                          Asset   Managers/Fund
                                                                                                                                                Managers/Fund   Managers
                                                                                                                                                              Managers
                                                                                                                                  Open-ended
                                                                                                                                Open-ended   Real
                                                                                                                                           Real   Estate
                                                                                                                                                Estate   Funds/Special
                                                                                                                                                       Funds/Special   Funds
                                                                                                                                                                     Funds
                                                                                                                                               Corporates/Owner-occupiers
                                                                                                                                             Corporates/Owner-occupiers
                                                                                                                                                             Other
                                                                                                                                                           Other   Investors
                                                                                                                                                                 Investors

                                                                                                                                                                                   Buyers
                                                                                                                                                                                 Buyers          Sellers
                                                                                                                                                                                               Sellers
11

                                                  overall economic impact on the leasing          break of the pandemic. In the current
                                                  markets do not fundamentally call into          ­market environment, off-market options

                                                                                                                                              City Survey Germany | Colliers International
                                                                                                                                              Commercial Real Estate Market Germany | 2020 / 2021
                                                  question the segment’s significance as an       should prove more popular than struc-
                                                  asset class. Compared to the exceptional        tured sales processes. With pressure to
                                                  €40.5bn recorded in the office segment          invest high, we expect transaction volume
                                                  in 2019, transaction volume was down            to come in between €55bn and €60bn in
                                                  one-third to €27.1bn. At the start of the       2021 despite the many uncertainties still
                                                  pandemic, investors tended to shy away          impacting the markets.
                                                  from investments in high-volume proper-
                                                  ties, which had fueled previous-year
                                                  ­results. This particularly affected the of-
                                                  fice segment.

                                                  Summary and Outlook
                                                  Unlike the first lockdown, the underlying
                                                  sentiment among investors following the
                                                  announcement of a second lockdown was
                                                  positive to optimistic. Market players have
                                                  learned that it is possible to conduct most
                                                  steps in a transaction digitally, even if the
                                                  process may take somewhat longer.
                                                  The crisis has brought with it opportuni-
                                                  ties in certain asset and risk classes. In
                                                  terms of the dip seen on the rental mar-
 Susanne Kiese                                    kets, however, which were hit harder by
 Head of Research                                 the crisis than the investment markets,
 +49 211 862062-47                                ­financial reviews of tenants and proper-
 susanne.kiese@colliers.com                       ties will take longer than before the out-

 Figure 4: Transaction Volume by Type of Property                          Figure 5: Office Prime Yield in the TOP 7 in %
 in billion €

                     0       5     10      15 20 25 30                      5.0
                                                                            5.0

           Office
           Office
                                                                            4.5
                                                                            4.5
            Retail
            Retail

       Industrial                                                           4.0
                                                                            4.0
       Industrial
     && Logistics
        Logistics
    Building
    Building Site
             Site                                                           3.5
                                                                            3.5
    Commerical
     Commerical
       Mixed
       Mixed use
             use                                                            3.0
                                                                            3.0

            Hotel
            Hotel
                                                                            2.5
                                                                            2.5
Other
Other properties
      properties                                                                   Q4 16 Q4 17 Q4 18 Q4 19 Q4 20
                                                                                      Berlin
                                                                                      Berlin      Düsseldorf
                                                                                                  Düsseldorf       Frankfurt
                                                                                                                   Frankfurt      Hamburg
                                                                                                                                  Hamburg
                     Transaction
                     Transaction Volume
                                 Volume Germany
                                        Germany          thereof
                                                         thereof TOP
                                                                 TOP 77
                                                                                      Cologne
                                                                                      Cologne     Munich
                                                                                                  Munich           Stuttgart
                                                                                                                   Stuttgart
12

                                                               RETAIL INVESTMENT
Commercial Real Estate Market Germany | 2020 / 2021
                City Survey Germany | Colliers International

                                                                                                   Transaction Volume                                   comprising 33 Metro wholesale stores,
                                                                                                                                                        which was sold by Aroundtown to P3, the
                                                                                                   German retail assets changed hands in
                                                                                                                                                        European logistics platform of Singa-
                                                                                                   2020 for roughly €11.4bn in total. Transac-
                                                                                                                                                        pore-based sovereign wealth fund GIC,
                                                                                                   tion volume was up 12% yoy, with 2020
                                                                                                                                                        for around €800m.
                                                                                                   replacing 2019 as the third-best year of
                                                                                                   the decade. The trend reversal we saw at
                                                                                                                                                        These megadeals contributed considera-
                                                                                                   the end of the year, with transaction
                                                                                                                                                        bly to the high market share claimed by
                                                                                                   ­volume up 42% qoq, was particularly key
                                                                                                                                                        portfolio deals, which accounted for
                                                                                                   in guaranteeing a positive end to a year
                                                                                                                                                        roughly two-thirds of total transaction
                                                                                                   marked by the Covid-19 pandemic.
                                                                                                                                                        volume, or €7.7bn.

                                                                                                   Supply and Demand                                    Quantum’s sale of the Karstadt depart-
                                                                                                                                                        ment store on Mönkebergstraße in
                                                                                                   The highest-volume retail deals in 2020,
                                                                                                                                                        ­Hamburg to Signa in Q3 for roughly
                                                                                                   however, were signed in Q1, including
                                                                                                                                                        €250m was the largest single-asset deal
                                                                                                   the sale of more than 30 retail assets
                                                                                                                                                        in 2020. A total of five single assets were
                                                                                                   within the scope of the TLG acquisition
                                                                                                                                                        sold in 2020 in the 9-figure range, two
                                                                                                   by Aroundtown. In terms of transaction
                                                                                                                                                        of which changed hands in Q4. Even after
                                                                                                   volume, the retail portion of the mixed
                                                                                                                                                        the second lockdown was imposed,
                                                                                                   portfolio accounted for around 25% of
                                                                                                                                                        ­market activity remained intact.
                                                                                                   the deal’s total volume of €4bn. Of similar
                                                                                                   scope was the deal involving a portfolio
                                                                                                                                                        Pure-play food retail has become the
                                                                                                   comprised of 80 Real hypermarkets,
                                                                                                                                                        ­major driver behind investment activity in
                                                                                                   which was acquired by Russian SCP
                                                                                                                                                        terms of use type. Between 2016 and
                                                                                                   Group from Metro for around €900m.
                                                                                                                                                        2020, transaction volume involving this
                                                                                                   Q4 saw the sale of the Matrix portfolio

                                                               Fast Facts                                                 Figure 1: Transaction Volume Retail
                                                                                                                          in billion €
                                                               Investment                        2020          2019

                                                               Transaction Volume in million €   11,365       10,122      16
                                                               Portfolio Transactions             67%          57%        14
                                                               TOP  7                             21%          33%                               11.9
                                                                                                                          12                                                           11.4
                                                               Share by International Buyers      52%          39%                                              9.8           10.1
                                                                                                                          10      9.2
                                                               Share by International Sellers     42%          53%
                                                                                                                           8
                                                               Prime Yield High Street Retail    2.80%        2.75%
                                                                                                                           6

                                                                                                                           4

                                                                                                                           2

                                                                                                                           0
                                                                                                                                2016           2017          2018         2019       2020
                                                                                                                                  Whole year            Average 2016 – 2020
13

                                       retail segment more than tripled to a re-           ed by office-retail mix assets and shop-
                                       cord €2.0bn from a previous €0.6bn.                 ping centers correlates with the low rate

                                                                                                                                            City Survey Germany | Colliers International
                                                                                                                                            Commercial Real Estate Market Germany | 2020 / 2021
                                       ­Discounters, supermarkets and hyper-               of transactions recorded in Germany’s
                                       markets experienced a boom in 2020 due              top 7 investment hubs, with market share
                                       to the Covid-19 pandemic with volumes               down to 21% yoy from 33% in 2019.
                                       increasing 30% in 2020 alone. The share
                                       in total retail investment claimed by this          Foreign investors accounted for a 52%
                                       sector has risen steadily over the past five        market share and German investors for
                                       years from 6% to 18%.                               48%. In light of the major deals outlined
                                                                                           above, the dominant investor groups rank
                                       Retail warehouses and retail parks ac-              as follows: Open-ended real estate funds
                                       counted for €5.7bn this past year, reflect-         and special funds (€2.2bn, or 19%) led the
                                       ing half of total retail transaction volume         pack buy-side followed by listed property
                                       and an increase of 13 percentage points             companies and asset and fund managers
                                       yoy. Downtown office-retail mix proper-             (both with €2.0bn, or 18%). Listed proper-
                                       ties in prime locations, which also include         ty companies dominated sell-side with
                                       department stores, came in second place             €4.5bn, or 39%, ahead of asset and fund
                                       with €4.0bn, or 35%, down 10 percentage             managers (15%) and open-ended real
                                       points yoy. Deals like the one in Hamburg           ­estate funds and special funds (13%).
                                       also show that investors are becoming
                                       ­increasingly aware of opportunities to
                                                                                           Yields
                                       reposition downtown assets with high
                                       footfall as mixed-use properties. Al-               The yield trend of different usage types
                                       though this trend is still in its infancy, it       continued to diverge, reflecting differenc-
                                       continues to grow in significance because           es in investor demand. Highstreet assets
                                       of the pandemic. Shopping centers regis-            in Germany’s 7 major investment hubs
                                       tered a d
                                               ­ ecrease in market share from              have departed from their historically low
                                       18% to 15% and generated a transaction              yield levels and currently range between
                                       volume of €1.7bn. The low share generat-            2.80% in Munich and Frankfurt and 3.40%

 Figure 2: Transaction Volume by Type of                             Figure 3: Transaction Volume by Buyer and
­Building 2020 share in %                                            Seller Groups in billion €
                         RetailWarehouses/Retail
                               Warehouses/RetailParks   50%
                                                 Parks 50%
                        Retail                                                                                   00 11 22 33 44 55
                                                                   Open-endedReal
                                                                  Open-ended  RealEstate
                                                                                   EstateFunds/Special
                                                                                          Funds/SpecialFunds
                                                                                                        Funds
                                                                                   ListedProperty
                                                                                          PropertyCompanies
                                                                                                   Companies
                                          HighStreet
                                         High          35%%
                                               Street 35                          Listed
                                                                             AssetManagers/Fund
                                                                            Asset  Managers/FundManagers
                                                                                                   Managers
                                                                      OpportunityFunds/Private
                                                                     Opportunity  Funds/PrivateEquity
                                                                                                EquityFunds
                                                                                                       Funds
                                                                                               PensionFunds
                                                                                              Pension   Funds
                                                                                               OtherInvestors
                                                                                              Other  Investors

                                                                                   ListedProperty
                                                                                  Listed  PropertyCompanies
                                                                                                   Companies
                                                                             Asset  Managers/Fund   Managers
                                                                            Asset Managers/Fund Managers
                                    ShoppingCenters
                                   Shopping           15%
                                             Centers 15%
                                                                   Open-ended Real Estate Funds/Special Funds
                                                                  Open-ended Real Estate Funds/Special Funds
                                                                                         PropertyDevelopers
                                                                                        Property  Developers
                                                                               Closed-ended Real Estate Funds
                                                                              Closed-ended Real Estate Funds
                                                                                              OtherInvestors
                                                                                             Other   Investors

                                                                                                                     Buyers
                                                                                                                    Buyers        Sellers
                                                                                                                                 Sellers
14

                                                                                                            in Düsseldorf and Cologne, while shop-        Summary and Outlook
                                                                                                            ping centers in high-footfall locations are
Commercial Real Estate Market Germany | 2020 / 2021
                City Survey Germany | Colliers International

                                                                                                                                                          The Covid-19 pandemic shows how im-
                                                                                                            posting yields at 4.80%. Prime yields for
                                                                                                                                                          portant it is to evaluate retail assets
                                                                                                            retail parks continue moving toward
                                                                                                                                                          ­particularly in terms of their resilience
                                                                                                            4.00%, which is lower than those record-
                                                                                                                                                          based on their heterogeneous composi-
                                                                                                            ed for shopping centers in prime loca-
                                                                                                                                                          tion. While downtown brick-and-mortar
                                                                                                            tions. Some stand-alone retail warehous-
                                                                                                                                                          fashion retailers took a heavy hit, other
                                                                                                            es are posting yields well below the
                                                                                                                                                          sectors are benefiting from a selective
                                                                                                            5.00% mark, while food retail is trading at
                                                                                                                                                          boom including grocery as well as
                                                                                                            a significant premium.
                                                                                                                                                          ­non-food sectors such as recreation,
                                                                                                                                                          sporting goods and DIY. Even in this
                                                                                                                                                          ­challenging environment and thanks to
                                                                                                                                                          the comparatively small-volume retail
                                                               Susanne Kiese                                                                              warehouse and retail park segments
                                                               Head of Research                                                                           as the main driver, annual transaction
                                                               +49 211 862062-47                                                                          ­volume came in at well over €10bn, which
                                                               susanne.kiese@colliers.com                                                                 we expect will set the bar for next year.

                                                               Figure 4: Prime Yield High Street Retail in %

                                                               4.5

                                                               4.0

                                                               3.5

                                                               3.0

                                                               2.5

                                                               2.0
                                                                     Q4 16 Q4 17 Q4 18 Q4 19 Q4 20
                                                                       Berlin      Düsseldorf   Frankfurt         Hamburg

                                                                       Cologne     Munich       Stuttgart
15

INDUSTRIAL AND LOGISTICS INVESTMENT

                                                                                                                                                       City Survey Germany | Colliers International
                                                                                                                                                       Commercial Real Estate Market Germany | 2020 / 2021
                                                Transaction Volume                                  tition and 2020 saw multiples in a range
                                                                                                    that you would typically only expect for
                                                The German industrial and logistics in-
                                                                                                    office assets.
                                                vestment market finished out 2020 with
                                                an exceptional transaction volume total-
                                                ing at roughly €7.5bn. Topping previ-               Supply and Demand
                                                ous-year results by 14%, this strong annu-
                                                                                                    An above-average number of sale-and-
                                                al result is second only to record year
                                                                                                    leaseback transactions generated some
                                                2017 (€8.7bn). Although the logistics
                                                                                                    additional supply throughout the year.
                                                ­asset class continued to rank third on the
                                                                                                    This increase in sale-and-leaseback
                                                overall commercial real estate market, it
                                                                                                    transactions can primarily be attributed to
                                                did manage to up its market share to 13%
                                                                                                    economic fallout from the Covid-19 pan-
                                                compared to the previous year’s 9%. 2020
                                                                                                    demic, as some companies are seeking
                                                was marked by remarkable deals that
                                                                                                    ­liquidity by selling their own properties in
                                                highlighted the strength and attractive-
                                                                                                    this attractive market environment, in
                                                ness of this asset class more than ever
                                                                                                    ­part to bolster their operative growth and
                                                before. The global Covid-19 pandemic
                                                                                                    competitive position through corporate
                                                created additional impetus for investment
                                                                                                    acquisitions. This trend has meant a slight
                                                in logistics assets and put the logistics
                                                                                                    boost in investment opportunities and
                                                asset class on the radar of many investors
                                                                                                    has proven particularly beneficial to in-
                                                for the first time. An increasing number of
                                                                                                    vestors looking for new, sometimes
                                                investors with very little or even no prior
                                                                                                    ­riskier and more profitable opportunities
                                                exposure to logistics were involved in
                                                                                                    in a logistics investment market with very
                                                bids for this asset class. Ongoing limited
                                                                                                    little supply on offer.
                                                supply, particularly in the core segment,
                                                also served to intensify the fierce compe-

Fast Facts                                                              Figure 1: Transaction Volume Industrial
                                                                        and Logistics in billion €
Investment                                          2020       2019

Transaction Volume in million €                     7,478     6,566     8                     7.6

Portfolio Transactions                               35%       40%      7
TOP  7                                               33%       35%                                                                         5.8
                                                                        6
Share by International Buyers                        43%       60%                                                            4.8
                                                                        5
Share by International Sellers                       28%       30%                                            3.9
                                                                        4
Prime Yield Logistics in the TOP 7 (average in %)   3.70%    4.20%             3.2
                                                                                                                    2.9
                                                                        3
                                                                                                                                     1.8         1.7
                                                                        2            1.4
                                                                                                     1.1
                                                                        1
                                                                                  4.6           8.7             6.8             6.6          7.5
                                                                        0
                                                                               2016           2017           2018             2019         2020
                                                                               Logistics        Industrial            TAV in total
                                                                               Average 2016 – 2020
16

                                                                                                      German investors generated the majority          sale of the Roots portfolio featuring 14 as-
                                                                                                      of annual transaction volume, pouring            sets, which was bought by AEW Europe
Commercial Real Estate Market Germany | 2020 / 2021
                City Survey Germany | Colliers International

                                                                                                      roughly €4.2bn into industrial and logis-        for over €500m in Q4, and Union Invest-
                                                                                                      tics assets and increasing their market          ment’s acquisition of the Rocket portfolio.
                                                                                                      share by another 18 percentage points yoy
                                                                                                      to 57%. Because of travel restrictions,
                                                                                                                                                       Yields
                                                                                                      foreign investors had very limited oppor-
                                                                                                      tunities to schedule property viewings           The boom in investor demand for logistics
                                                                                                      or on-site visits. This situation caused         and the resulting fierce competition for
                                                                                                      their market share to drop significantly         these assets led to significant yield com-
                                                                                                      over the course of the year. Remarkably,         pression in Germany this past year. While
                                                                                                      the logistics investment market was able         the average gross prime yields for state-
                                                                                                      to achieve such strong annual results            of-the-art logistics assets in Germany’s
                                                                                                      without the help of major portfolio deals        top logistics regions came to roughly
                                                                                                      in the multi-billion-euro range. Transac-        4.20% in 2019, they fell a further 50 bps to
                                                                                                      tion volume for logistics assets even            below 3.70% over the course of 2020 (re-
                                                                                                      ­managed to come in just behind the ex-          flecting a net yield of around 3.30%).
                                                                                                      ceptional record-breaking year of 2017.          Some of the deals finalized in 2020 were
                                                                                                      Portfolio deals accounted for around             absolute outperformers in terms of the
                                                                                                      €2.6bn, reflecting a 35% share in total          total package they offered. These proper-
                                                                                                      transaction volume. One of the largest           ties saw purchase price multiples in ex-
                                                                                                      portfolio deals to change hands in 2020          cess of 28x based on annual net rent. Mul-
                                                                                                      was Union Investment’s acquisition of the        tiples in this range are typically more
                                                                                                      European Logistrial portfolio early in the       common in the office and residential mar-
                                                                                                      year. The deal posted a volume of roughly        kets. As a result, the purchase prices
                                                                                                      €800m with more than half of total value         achieved per square meter in some cases
                                                                                                      generated by the portfolio’s assets in           exceeded the €2,000 mark, setting the
                                                                                                      ­Germany. Other portfolio deals to change        tone for future transactions with similar
                                                                                                      hands in the mid-9-figure range were the         features.

                                                               Figure 2: Transaction Volume                                   Figure 3: Transaction Volume by Buyer and
                                                               by Size Category 2020 share in %                               Seller Groups in billion €

                                                                                                        upup
                                                                                                           to to € 10   6%
                                                                                                                    m m6%
                                                                                                               € 10
                                                                                                                                                                         00 1 1 22 3 3 44
                                                                                                                                          Asset
                                                                                                                                        Asset    Managers/Fund
                                                                                                                                              Managers/Fund      Managers
                                                                                                                                                              Managers
                                                                                                    € 10
                                                                                                  € 10 mmto to € 30
                                                                                                             € 30      19%
                                                                                                                  m m19%        Open-ended
                                                                                                                              Open-ended   Real
                                                                                                                                         Real   Estate
                                                                                                                                              Estate   Funds/Special
                                                                                                                                                     Funds/Special   Funds
                                                                                                                                                                   Funds
                                                                                                                                             Corporates/Owner-occupiers
                                                                                                                                           Corporates/Owner-occupiers
                                                                                                                                                    Insurance
                                                                                                                                                  Insurance   Companies
                                                                                                                                                            Companies
                                                                                                                                                      Property
                                                                                                                                                    Property    Developers
                                                                                                                                                             Developers
                                                                                                    € 30               11%                                 Other Investors
                                                                                                  € 30 mmto to € 50
                                                                                                             € 50 m m11%                                Other  Investors

                                                                                                                                                       Property
                                                                                                                                                     Property   Developers
                                                                                                                                                              Developers
                                                                                                    € 50
                                                                                                  € 50 mmto to € 100
                                                                                                             € 100      14%
                                                                                                                   m m14%                 Asset  Managers/Fund   Managers
                                                                                                                                        Asset Managers/Fund Managers
                                                                                                      above   € 100 m
                                                                                                    above € 100 m 50%  50%      Open-ended Real Estate Funds/Special Funds
                                                                                                                              Open-ended Real Estate Funds/Special Funds
                                                                                                                                             Corporates/Owner-occupiers
                                                                                                                                           Corporates/Owner-occupiers
                                                                                                                                                          Pension
                                                                                                                                                        Pension   Funds
                                                                                                                                                                Funds
                                                                                                                                                          Other
                                                                                                                                                        Other   Investors
                                                                                                                                                              Investors

                                                                                                                                                                                Buyers
                                                                                                                                                                              Buyers          Sellers
                                                                                                                                                                                            Sellers
17

                                     Outlook

                                                                                    City Survey Germany | Colliers International
                                                                                    Commercial Real Estate Market Germany | 2020 / 2021
                                     The growth trend in e-commerce speaks
                                     to the increasing attractiveness and im-
                                     portance of logistics assets in Germany.
                                     Due to the spread of the Covid-19 pan-
                                     demic in 2020 and the resulting restric-
                                     tions on everyday life, more and more
                                     people are choosing to order online and
                                     have groceries delivered to their homes.
                                     This has considerably increased parcel
                                     delivery volumes in Germany and trig-
                                     gered greater demand for warehouse and
                                     logistics space. We also expect growing
                                     pressure to optimize and innovate in some
                                     areas of traditional industry in the
                                     post-Covid-19 era to lead to calls for lean-
                                     er operations in modern logistics assets.
                                     Because the logistics sector has once
Nicole Kinne                         again proven resilient in times of crisis,
Associate Director I                 we anticipate that the run on industrial
Research Industrial & Logistics      and logistics assets will continue,
+49 89 624294-792                    ­possibly causing further yield compres-
nicole.kinne@colliers.com            sion in 2021.

Figure 4: Prime Yield Logistics in the TOP 7
Average in %

6.0

5.5

5.0

4.5

4.0

3.5
      Q4 16 Q4 17 Q4 18 Q4 19 Q4 20
18

                                                               HOTEL INVESTMENT
Commercial Real Estate Market Germany | 2020 / 2021
                City Survey Germany | Colliers International

                                                                                                  Transaction Volume                                   Supply and Demand
                                                                                                  Hotel assets changed hands for a total of            Similar to 2019, an increasing number of
                                                                                                  €2.0bn in 2020. The hotel investment                 hotels changed hands within the scope of
                                                                                                  market almost came to a standstill due to            portfolio deals, which generated a market
                                                                                                  the Covid-19 pandemic following a solid              share of roughly 38%. Aroundtown’s take-
                                                                                                  start to the year, in which Q1 brought in            over of TLG in Q1 2020 was the primary
                                                                                                  roughly €1.0bn in transaction volume.                driver behind this high market share along
                                                                                                  The unsteady recovery in Q3 was unable               with several smaller portfolios that
                                                                                                  to put down roots before the second                  changed hands over the course of the
                                                                                                  wave of the pandemic and the restrictions            year. The sale of nhow in Berlin was the
                                                                                                  it brought with it again hit the hotel busi-         largest single-asset deal of the year.
                                                                                                  ness in general, and along with it, the              ­Although a dozen additional assets broke
                                                                                                  ­investment market for hotel assets.                 through the €50m barrier, most of the
                                                                                                  Transaction volume fell almost 60%                   ­assets sold went for below €30m. Core
                                                                                                  ­compared to strong previous-year results            assets in good locations remained attrac-
                                                                                                  and came up almost one-third short of                tive and competitive despite the challeng-
                                                                                                  the ten-year average. As overall commer-             ing market environment. Conversions
                                                                                                  cial transaction volume in Germany was               have been gaining in significance as well
                                                                                                  not nearly hit as hard by the Covid-19               with a growing number of hotel assets
                                                                                                  ­crisis as the hotel segment, hotel assets           sold for conversion projects in 2020,
                                                                                                  saw their market share fall to 3%.                   ­particularly towards the end of the year.
                                                                                                                                                       ­Hotel assets are currently being convert-
                                                                                                                                                       ed into office and residential properties
                                                                                                                                                       as well as healthcare and mixed-use.

                                                               Fast Facts                                                 Figure 1: Transaction Volume Hotel
                                                                                                                          in billion €
                                                               Investment                        2020         2019

                                                               Transaction Volume in million €   2,035        5,033       6
                                                                                                                                  5.2
                                                                                                                                                                               5.0
                                                               Portfolio Transactions             38%          27%
                                                                                                                          5
                                                               TOP  7                             53%          60%                               4.2
                                                                                                                                                                4.0
                                                               Share by International Buyers      41%          41%        4

                                                               Share by International Sellers     18%          30%
                                                                                                                          3
                                                               Prime Yield Hotel                 4.01%       3.70%                                                                        2.0
                                                                                                                          2

                                                                                                                           1

                                                                                                                          0
                                                                                                                                2016           2017           2018            2019     2020
                                                                                                                                  Whole year            Average 2015 – 2019
19

                                  One favorable development is the fact that        Hotels in the 4-star segment remained the
                                  foreign investors maintained their 41%            most popular investment, pulling in a

                                                                                                                                   City Survey Germany | Colliers International
                                                                                                                                   Commercial Real Estate Market Germany | 2020 / 2021
                                  market share buy-side despite the pan-            ­market share of 56%. Second place went
                                  demic. That means German hotel assets             to 3-star hotels with a one-third share of
                                  continue to attract foreign capital. Listed       the market. Investment in budget and
                                  property companies were the most active           ­luxury hotels almost came to a complete
                                  buy-side in 2020 with a market share of           standstill with only a few deals registered.
                                  just over 23%. Asset and fund managers            Serviced apartments were the only hotel
                                  followed in the ranks with 18% in the wake        category to experience a favorable trend
                                  of a considerably more active 2019 where          with their share in total hotel transaction
                                  they generated a share of 27%. While              volume up five percentage points to 8%,
                                  open-ended real estate funds and special          or €166m. Serviced apartments have
                                  funds were the most active buy-side into          ­navigated the crisis well to date thanks to
                                  2019, they slid to third place in 2020 with       strong occupancy rates and are becoming
                                  13%.                                              increasingly popular with investors.

                                  German investors dominated market                 Core assets are currently the most
                                  ­activity sell-side and accounted for 82%         ­popular among the risk classes. Supply,
                                  of total transaction volume. As in previous       however, is limited. Many investors are
                                  years, property developers proved the             avoiding core+ assets in the current
                                  most active, selling assets valued at more        ­market environment, particularly due to
                                  than €724m, which reflects a market               the tense situation currently being faced
                                  share of almost 36%. Listed property              by hotel operators. Value-add assets are
                                  companies ranked second with 18%,                 rarely being sold as such but are rather
                                  largely due to the TLG takeover. Family           being further developed into core or core+
                                  ­offices and private investors claimed            assets before being listed on the market.
                                  third place with 14%.

Figure 2: Transaction Volume by Star Segment 2020          Figure 3: Transaction Volume by Buyer and
share in %                                                 Seller Groups in billion €

                                                                                                   0.0
                                                                                                    0.0       0.5
                                                                                                               0.5         1.0
                                                                                                                             1.0
                                           4 Stars55%
                                         4 Stars    55%                 Listed Property
                                                                          Listed        Companies
                                                                                 Property Companies
                                                                  Asset
                                                                    AssetManagers/Fund
                                                                           Managers/Fund Managers
                                                                                           Managers
                                           3 Stars33%
                                         3 Stars    33% Open-ended Real Estate Funds/Special Funds
                                                          Open-ended Real Estate Funds/Special Funds
                                                                               Property Developers
                                                                                 Property  Developers
                                                                   Private Investors/Family Offices
                                                                     Private Investors/Family Offices
                                                                                    Other Investors
                                                                                      Other Investors

                                                                               Property  Developers
                                                                                  Property Developers
                                 Boarding
                                  Boarding House8%
                                          House  8%
                                                                        Listed  Property Companies
                                                                           Listed Property Companies
                                                                   Private Investors/Family Offices
                                            2 Stars2%
                                          2 Stars   2%               Private Investors/Family  Offices
                                            5 Stars1%1%
                                          5 Stars                    Corporates/Owner-occupiers
                                                                        Corporates/Owner-occupiers
                                             1 Star1%1%
                                           1 Star                  Asset Managers/Fund
                                                                     Asset             Managers
                                                                           Managers/Fund Managers
                                                                                   Other Investors
                                                                                     Other Investors

                                                                                                          Buyers
                                                                                                            Buyers     Sellers
                                                                                                                         Sellers
20

                                                                                                            As a result of these activities, the core      Summary and Outlook
                                                                                                            segment posted €1.1bn in transaction
Commercial Real Estate Market Germany | 2020 / 2021
                City Survey Germany | Colliers International

                                                                                                                                                           The hotel segment is likely to face another
                                                                                                            ­volume in 2020, reflecting a market share
                                                                                                                                                           difficult year in 2021. Convention hotels
                                                                                                            of 59%. Core+ and value-add followed in
                                                                                                                                                           will particularly continue to suffer under
                                                                                                            the ranks with 32% and 6%, respectively.
                                                                                                                                                           the ongoing restrictions. Operators are
                                                                                                                                                           expected to continue to pursue market
                                                                                                            Yields                                         consolidation. Hotel chains, particularly
                                                                                                                                                           those in the budget segment, appear to be
                                                                                                            Yields for hotel investments remained
                                                                                                                                                           navigating the crisis more successfully.
                                                                                                            stable over the course of the year. Munich
                                                                                                                                                           Major operators in the lower price seg-
                                                                                                            continued to post the lowest gross prime
                                                                                                                                                           ment are even continuing with their ex-
                                                                                                            yields at a flat 3.70% with yields in Berlin
                                                                                                                                                           pansion strategies. Core assets in top
                                                                                                            at the other end of the spectrum at 4.40%.
                                                                                                                                                           ­locations remain an attractive investment
                                                                                                            Gross prime yields nationwide are post-
                                                                                                                                                           and the same applies to properties boast-
                                                                                                            ing at an average of roughly 4.00%. Be-
                                                                                                                                                           ing conversion potential, which offer
                                                                                                            cause so few deals were transacted in
                                                                                                                                                           ­opportunity as well. We expect the market
                                                                                                            2020, these numbers are based on limited
                                                                                                                                                           to return to pre-crisis levels no earlier
                                                                                                            data.
                                                                                                                                                           than 2023. Look for market recovery to
                                                                                                                                                           move from the inside out and from bottom
                                                                                                                                                           to top. That means that hotels in down-
                                                                                                                                                           town locations will likely recover more
                                                               Philipp Allroggen                                                                           swiftly than those located in city outskirts
                                                               Junior Consultant I Research                                                                and that demand for budget accommoda-
                                                               +49 211 862062-40                                                                           tion will pick up earlier than demand for
                                                               philipp.allroggen@colliers.com                                                              higher priced accommodation.

                                                               Figure 4: Prime Yield Hotel in %

                                                               6.0

                                                               5.5

                                                               5.0

                                                               4.5

                                                               4.0

                                                               3.5
                                                                     Q4 16 Q4 17 Q4 18 Q4 19 Q4 20
                                                                       Berlin      Düsseldorf   Frankfurt           Hamburg

                                                                        Cologne    Munich       Stuttgart
21

                               City Survey Germany | Colliers International
                               City reports | 2020 / 2021
CITY
REPORTS
BERLIN
     22

DÜSSELDORF
                          28

FRANKFURT
                     34

HAMBURG
                40

COLOGNE
               46

MUNICH
          52

STUTTGART
                     58
22       Berlin | 2020 / 2021
City Survey Germany | Colliers International   BERLIN

                                               CITY FACTS Berlin                                           Fast Facts
                                               Population in 1,000                                 3,669   Office Leasing Berlin                   2020    Change year-on-year

                                               Employees Paying Social Se­cu­rity Contributions    1,539   Office Space Take-up          734,000 sqm                   – 28.7%
                                               in 1,000
                                                                                                           Leasing Take-up              668,600 sqm                    – 32.4%
                                               Unemployment Rate in %                               10.1   Prime Rent                    41.10   € / sqm                  3.0%
                                               Per Capita Disposable Income in €                  22,294   Average Rent                 28.70   € / sqm                   9.1%

                                                                                                           Vacancy Rate                            1.7%                  50 bp

                                                                                                           Office Space Stock       20.90 million sqm                     2.0%

                                                                                                           Rents in € / sqm
                                                                                                           Submarket                                             Range of Rents
                                                                                                           CBD City West                                          20.75 - 42.50
                                                                                                           CBD City East                                          20.00 - 39.80
                                                                                                           CBD Potsdamer Platz / Leipziger Platz                  20.85 - 38.00
                                                                                                           Central Station                                        28.00 - 35.00
                                                                                                           Mediaspree                                             24.00 - 36.15
                                                                                                           City West                                              17.00 - 32.00
                                                                                                           City East                                              18.45 - 42.30
                                                                                                           City Margins North                                     19.40 - 38.25
                                                                                                           City Margins South                                     18.00 - 34.00
                                                                                                           Periphery North                                        13.50 - 27.50
                                                                                                           Periphery West                                         21.00 - 28.50
                                                                                                           Periphery South                                        14.00 - 30.00
                                                                                                           Periphery East                                         14.45 - 26.00
                                                                                                           Adlershof                                              15.00 - 20.00
                                                                                                           Schönefeld                                             14.45 - 16.25
23

OFFICE LEASING

                                                                                                                                                      City Survey Germany | Colliers International
                                                                                                                                                      Berlin | 2020 / 2021
                                                 Take-up                                              Market activity once again revolved
                                                                                                      around the CBD City Ost and City Ost sub-
                                                 The Berlin office leasing market posted
                                                                                                      markets, which contributed around
                                                 around 734,000 sqm in take-up in 2020,
                                                                                                      253,000 sqm to total take-up. The largest
                                                 a good result in line with the ten-year
                                                                                                      lease of 2020, which was signed by
                                                 ­average of roughly 750,000 sqm despite
                                                                                                      ­insurer Deutsche Rentenversicherung for
                                                 the impact of the Covid-19 pandemic.
                                                                                                      more than 84,000 sqm at the An den
                                                 The ­final quarter of the year proved par-
                                                                                                      ­Treptowers property, was a major driver
                                                 ticularly robust with take-up coming in at
                                                                                                      behind the above-average result posted
                                                 231,000 sqm. A number of large-scale
                                                                                                      in the Mediaspree submarket of
                                                 leases signed for over 10,000 sqm played
                                                                                                      113,000 sqm. Neighboring locations are
                                                 a significant role, accounting for more
                                                                                                      also attracting increasing demand due to
                                                 than 300,000 sqm in take-up.
                                                                                                      the ongoing supply bottleneck in central
                                                                                                      locations. The City Periphery North and
                                                 Public administration was responsible for
                                                                                                      City Periphery South submarkets both
                                                 roughly 270,000 sqm in take-up, generat-
                                                                                                      benefited from current market conditions
                                                 ing a market share of almost 40%. With
                                                                                                      and also ranked high among the city’s
                                                 this result, the public sector solidified its
                                                                                                      most popular office locations. Take-up in
                                                 dominant position on the Berlin office
                                                                                                      the City Periphery South submarket was
                                                 market. Companies from the ICT, banking
                                                                                                      particularly impacted by the lease signed
                                                 and finance sectors trailed in the ranks at
                                                                                                      by Deutsche Bahn for roughly 30,000 sqm
                                                 some distance, each falling just shy of
                                                                                                      at EUREF-Campus on Torgauer Straße.
                                                 double-digit results.

Figure 1: Office Space Take-up in 1,000 sqm                               Figure 2: Completion Volume in 1,000 sqm

1,200                                                                      1,200

                                               989
1,000                                                                      1,000
                        837
 800    740                         752                                     800
                                                           669
                                                                                                                                         602
 600                                                                        600                                             551
                                                                                                                  457
 400                                                                        400                         309
                                                                                                                                  341

                                                                                        203                                                    185
 200          123                                                           200
                              100
                                          39          41         65

   0                                                                           0
        2016            2017        2018        2019       2020                        2018           2019      2020        2021         2022
              Leasing               Owner-occupiers                                              Completions         thereof Pre-let/Owner-occupied
24

                                                                                           Rents                                           Key Developments
                    Berlin | 2020 / 2021
City Survey Germany | Colliers International

                                                                                           Office rents have been showing very little      A total of 551,000 sqm are currently in the
                                                                                           change in the wake of the pandemic and          development pipeline for 2021 with
                                                                                           remained high at year-end 2020. Prime           around two-thirds of this space already
                                                                                           rents come to a current €41.10 per sqm          taken up as at the start of the year. These
                                                                                           with average rents at €28.70 per sqm,           developments are primarily targeting CBD
                                                                                           ­reflecting a yoy increase of 3% and 9%,        locations in the City Ost and West submar-
                                                                                           respectively. Tenants were willing to pay       kets and around the Berlin central station.
                                                                                           more than €35.00 per sqm for roughly
                                                                                           106,000 sqm of new office space.
                                                                                                                                           Summary and Outlook
                                                                                                                                           We can look for rents to continue to rise
                                                                                           Supply and Vacancy
                                                                                                                                           slightly in 2021, albeit with significantly
                                                                                           Berlin’s extremely low vacancy rate of          less momentum than in past years. Nu-
                                                                                           1.2% increased slightly over the course of      merous businesses are on the lookout ­for
                                                                                           2020 to 1.7% at the end of December.            large-scale units in 2021 as well, guaran-
                                                                                           The amount of space available for imme-         teeing the Berlin market a solid founda-
                                                                                           diate tenancy rose yoy to around                tion going forward despite the impact of
                                                                                           354,000 sqm. The situation in submar-           the pandemic. We have yet to see a
                                                                                           kets outside Berlin’s suburban train ring       ­dramatic drop in vacancy. Office proper-
                                                                                           remains particularly tense at below 1.0%.       ties will continue to play an important
                                                                                                                                           role for companies. In light of the above,
                                                                                                                                           2021 is set to post another increase in an-
                                                                                                                                           nual take-up to over 800,000 sqm.

                                               Figure 3: Vacancy Rate in % and Vacancy                            Figure 4: Prime and Average Rents in ¤/sqm
                                               in 1,000 sqm

                                               600       567                                                      45
                                                                                                                                                                              41.10
                                                                                                                                                                  39.90
                                               500                                                                40
                                                                                                                                                      35.10
                                                                     390                                          35
                                               400                                                                                        31.30
                                                                                                     354
                                                                                                                              28.50                                           28.70
                                                         3.0%               304                                   30
                                                                                                                                                                 26.30
                                               300
                                                                                           246
                                                                                                                  25
                                                                     2.0%                                                                             21.70
                                               200                                                   1.7%
                                                                             1.5%                                                          19.15
                                                                                           1.2%                   20
                                                                                                                              16.30
                                               100                                                                 15

                                                 0                                                                 10
                                                       2016        2017     2018       2019        2020                    2016         2017       2018        2019        2020
                                                               Vacancy      Vacancy Rate                                            Prime Rent         Average Rent
25

 INVESTMENT

                                                                                                                                    City Survey Germany | Colliers International
                                                                                                                                    Berlin | 2020 / 2021
                                      Transaction Volume                           The second wave of the pandemic in Q4
                                                                                   2020 was unable to stop the end-of-year
                                      2020 was an unusual year that started off
                                                                                   rally on the Berlin market. The dip in
                                      on Berlin’s commercial real estate invest-
                                                                                   ­market activity due to high uncertainty at
                                      ment market as strong as record-year
                                                                                   the start of the pandemic created excess
                                      2019 ended, which was with €12.2bn in
                                                                                   demand that hit the market in H2 and
                                      transaction volume. Then market activity
                                                                                   boosted deal activity. Commercial trans-
                                      came to an abrupt halt. Investors, howev-
                                                                                   action volume came in 50% above the ten-
                                      er, quickly regained confidence in the
                                                                                   year average despite the crisis.
                                      market, pouring €8.5bn into the city’s
                                      commercial assets by year end, putting
                                      2020’s strong transaction results in sec-
                                      ond place after 2019.

                                      Fast Facts
                                      Investment Berlin                                         2020                        2019

                                      Transaction Volume                               8,549 million  €         12,172 million  €

                                      Portfolio Transactions                                      38%                       17%

                                      Share by International Buyers                               52%                       59%

                                      Share by International Sellers                              29%                       46%

                                      Most Important Property Type                         Office 64%                 Office 79%

                                      Prime Yield Office                                       2.80%                      2.90%

 Figure 5: Transaction Volume in million €                     Figure 6: Transaction Volume by Type of
                                                               Property 2020 share in %
14,000
 14,000                              12,172                                                                     Office 64%
12,000                                12,172                                                                     Office 64%
 12,000
10,000                                                                                                           Retail 16%
 10,000                                         8,549
                                                                                                                  Retail 16%
                   7,522                         8,549
 8,000                      6,959
  8,000             7,522
                             6,959
 6,000    4,900                                                                                           Building Site 6%
  6,000    4,900                                                                                           Building Site 6%
 4,000                                                                                                             Hotel 4%
  4,000                                                                                                             Hotel 4%
                                                                                                                Industrial &
 2,000                                                                                                            Industrial
                                                                                                              Logistics  3%&
  2,000                                                                                                        Logistics   3%
                                                                                                                  Other 7%
     0                                                                                                                Other 7%
      0
          2016 2017 2018 2019 2020
           2016 2017 2018 2019 2020
26

                                                                                      Supply and Demand                                 Aroundtown’s takeover of TLG was the
                                                                                                                                        largest portfolio deal in 2020. Listed
                    Berlin | 2020 / 2021
City Survey Germany | Colliers International

                                                                                      Office assets accounted for two-thirds of
                                                                                                                                        property companies ranked most active
                                                                                      total transaction volume in 2020 with
                                                                                                                                        buy-side (€2.4bn) and sell-side (€2.5bn)
                                                                                      €5.5bn. Retail assets ranked second with
                                                                                                                                        as a result. Property developers came in
                                                                                      €1.4bn, or a 16% market share. Commer-
                                                                                                                                        second sell-side with €1.6bn, followed
                                                                                      cial land sites posted above-average
                                                                                                                                        closely by asset and fund managers,
                                                                                      transaction volume at over €500m, se-
                                                                                                                                        which posted just under €1.6bn. Asset
                                                                                      curing third place.
                                                                                                                                        and fund managers purchased assets in
                                                                                                                                        the same volume and ranked third buy-
                                                                                      Large landmark deals such as those in the
                                                                                                                                        side just behind open-ended real estate
                                                                                      record year 2019 with more than half a
                                                                                                                                        funds and special funds with €1.8bn.
                                                                                      ­billion euros were absent in 2020. How-
                                                                                      ever, three single-asset deals were
                                                                                                                                        Property developers in Berlin particularly
                                                                                      signed for over €250m. One of the year’s
                                                                                                                                        benefited from the fact that demand for
                                                                                      most pricey deals was the sale of the
                                                                                                                                        large-scale adjoining office space, some-
                                                                                      western section of the office complex at
                                                                                                                                        thing that is hard to come by in stock prop-
                                                                                      Humboldthain. A section of the Focus
                                                                                                                                        erties, remained quite high among tenants
                                                                                      Teleport office center in Moabit and the
                                                                                                                                        from the public sector despite the pan-
                                                                                      Südkreuz Offices in Schöneberg joined
                                                                                                                                        demic. Interest in assets guaranteeing
                                                                                      the ranks towards the end of the year.
                                                                                                                                        long-term secure cashflow is on the rise.
                                                                                      The sale of Spreeturm at Postbahnhof in
                                                                                      the Mediaspree submarket was another
                                                                                      high-volume deal that changed hands for
                                                                                      just shy of €200m.

                                               Figure 7: Transaction Volume by Buyer Groups                  Figure 8: Transaction Volume by Seller Groups
                                               in million €, share in %                                      in million €, share in %

                                                      Listed
                                                        Listed
                                                             Property
                                                               Property                        28%
                                                                                                 28%               Listed
                                                                                                                     Listed
                                                                                                                          Property
                                                                                                                            Property                                  29%
                                                                                                                                                                        29%
                                                           Companies
                                                             Companies                                                  Companies
                                                                                                                          Companies

                                               Open-ended
                                                Open-endedReal
                                                            Real
                                                               Estate
                                                                 Estate               20%
                                                                                        20%                   Property
                                                                                                                Property
                                                                                                                       Developers
                                                                                                                         Developers                         19%
                                                                                                                                                              19%
                                                 Funds/Special
                                                   Funds/Special
                                                               Funds
                                                                 Funds

                                                     Asset
                                                       Asset
                                                           Managers/
                                                             Managers/               19%
                                                                                       19%                        Asset
                                                                                                                    Asset
                                                                                                                        Managers/
                                                                                                                          Managers/                        18%
                                                                                                                                                             18%
                                                      Fund
                                                        FundManagers
                                                              Managers                                             Fund
                                                                                                                     FundManagers
                                                                                                                           Managers

                                                 Property
                                                   Property
                                                          Developers
                                                            Developers     7%7%                             Open-ended
                                                                                                             Open-endedReal
                                                                                                                         Real
                                                                                                                            Estate
                                                                                                                              Estate                9%9%
                                                                                                              Funds/Special
                                                                                                                Funds/Special
                                                                                                                            Funds
                                                                                                                              Funds

                                                 Insurance
                                                   Insurance
                                                           Companies
                                                             Companies     6%6%                                  Private
                                                                                                                   Private
                                                                                                                         Investors/
                                                                                                                           Investors/        5%5%
                                                                                                                     Family
                                                                                                                       Family
                                                                                                                            Offices
                                                                                                                              Offices

                                                      Other
                                                        Other
                                                            Investors
                                                              Investors              20%
                                                                                       20%                         Other
                                                                                                                     Other
                                                                                                                         Investors
                                                                                                                           Investors                         20%
                                                                                                                                                               20%

                                                                      00   1,000
                                                                             1,000   2,000
                                                                                       2,000    3,000
                                                                                                  3,000                             00          1,000
                                                                                                                                                  1,000     2,000
                                                                                                                                                              2,000    3,000
                                                                                                                                                                         3,000
27

Yields                                          Summary and Outlook

                                                                                               City Survey Germany | Colliers International
                                                                                               Berlin | 2020 / 2021
Gross initial yields for core office assets     Activity in 2020 has shown investor
dropped a further 10 bps yoy to 2.80%.          ­confidence in the Berlin market remains
­Increased demand for industrial and logis-     strong, also and especially in times of
tics assets because of the pandemic trig-       great uncertainty. Because we are still
gered strong yield compression of 50 bps.       unable to predict the course of a pandem-
Retail assets in high-street locations saw      ic that is still waging, we cannot realisti-
an increase of 10 bps in contrast.              cally forecast transaction volume for 2021
                                                with the necessary degree of precision.
The two property developments, IMPULS           However, the development of promising
on Stresemannstraße and NEO on Knese-           vaccines has been a major victory in the
beckstraße, both of which are under long-       fight against Covid-19. As such, we have
term lease and were transacted within the       reasonable cause to hope that life will
scope of forward deals, are representative      soon be getting closer to normal and that
of the current trend in office yields. Fi-      uncertainties around the market will
nancing for office investments with val-        ­begin to fade. The development pipeline is
ue-add or opportunistic risk files, on the      well-stocked at the moment and, com-
other hand, has become more expensive,          bined with the benefits of the recent grand
leading to owners having to accept con-         opening of Berlin’s BER airport, should
siderable price reductions of 10% to 15%.       create the perfect conditions for even
While the parties involve were able to          livelier market activity in 2021 with the
­notarize the sale of the Goldstück office      current year possibly even taking over
building in the Moabit district in 2020 at      2020's second-place ranking.
roughly €5,000 per sqm and an expected
yield of 5.60%, the sale of The Heinrich of-
fice complex in Schöneberg, which would
have likely been the largest single-asset
deal of the year, fell through as the parties
were unable to agree on the price.

    The Berlin office leasing market remains robust despite
    the impact of the pandemic. Rents continue to rise
    and the boom on the investment market remains intact.

    CONTACT
    Margit Lippold Director | Research
    +49 30 202993-43, margit.lippold@colliers.com
28  Düsseldorf | 2020 / 2021
City Survey Germany | Colliers International   DÜSSELDORF

                                               CITY FACTS Düsseldorf                                       Fast Facts
                                               Population in 1,000                                  622    Office Leasing Düsseldorf              2020      Change year-on-year

                                               Employees Paying Social Se­cu­rity Contributions     430    Office Space Take-up           248,000 sqm                   – 47.8%
                                               in 1,000
                                                                                                           Leasing Take-up                234,500 sqm                   – 50.2%
                                               Unemployment Rate in %                                8.0   Prime Rent                    28.50   € / sqm                  0.0%
                                               Per Capita Disposable Income in €                  28,528   Average Rent                   16.30   € / sqm                – 5.8%

                                                                                                           Vacancy Rate                            5.5%                  – 40 bp

                                                                                                           Office Space Stock          7.86 million sqm                    1.4%

                                                                                                           Rents in € / sqm
                                                                                                           Submarket                                              Range of Rents
                                                                                                           CBD                                                     18.50 - 28.50
                                                                                                           City Center                                             13.00 - 26.00
                                                                                                           Harbour Area                                            16.50 - 25.00
                                                                                                           Kennedydamm                                             16.50 - 25.00
                                                                                                           Left of the Rhine                                       11.00 - 22.00
                                                                                                           Düsseldorf-North                                        11.00 - 18.00
                                                                                                           Airport City                                            14.50 - 17.50
                                                                                                           Grafenberger Allee                                      12.00 - 14.50
                                                                                                           City Center-East                                        10.00 - 16.00
                                                                                                           Düsseldorf-South                                         9.00 - 12.00
29

OFFICE LEASING

                                                                                                                                                    City Survey Germany | Colliers International
                                                                                                                                                    Düsseldorf | 2020 / 2021
                                                  Take-up                                           Most space segments recorded signifi-
                                                                                                    cant decreases in take-up compared
                                                  The Düsseldorf office leasing market
                                                                                                    to the previous year, the sole exception
                                                  (municipal area only) recorded
                                                                                                    being the segment of between 500 sqm
                                                  248,000 sqm in take-up in 2020, down
                                                                                                    and 1,000 sqm, which posted an increase
                                                  48% as anticipated compared to the previ-
                                                                                                    of roughly 5% yoy. The medium and
                                                  ous year’s all-time high of 475,000 sqm.
                                                                                                    ­lar­ge-sized space segments saw take-up
                                                  These results can be attributed to to the
                                                                                                    drop significantly compared to the previ-
                                                  restrictions imposed due to the pandemic.
                                                                                                    ous year’s excellent result, as considera-
                                                  Looking at performance over the course
                                                                                                    bly fewer leases were signed in 2020.
                                                  of the year, take-up was noticeably up in
                                                  Q3 compared to a very weak Q2 at around
                                                                                                    In terms of location, the majority of
                                                  60,000 sqm. Activity dropped again
                                                                                                    ­take-up tended to revolve around three
                                                  slightly in Q4 due to the stricter Covid-19
                                                                                                    different submarkets. The City Center
                                                  restrictions implemented around that
                                                                                                    East submarket led the pack with
                                                  time. Around 25% of 2020 annual take-up
                                                                                                    41,000 sqm thanks a large-scale lease
                                                  can be attributed to the public sector.
                                                                                                    signed by the financial administration
                                                  Consulting firms, which typically com-
                                                                                                    ­office, closely followed by the Düsseldorf
                                                  prise one of the city’s strongest tenant
                                                                                                    North and Linksrheinisch submarkets
                                                  groups, increased their activity noticeably
                                                                                                    with roughly 39,000 sqm each.
                                                  in H2, putting them in second place with
                                                  an overall market share of 14%.

Figure 1: Office Space Take-up in 1,000 sqm                               Figure 2: Completion Volume in 1,000 sqm

500
 500                                            471
                                                 471                     150
                                                                          150

400
 400                                                                     120
                                                                          120                                             111
                                                                                                                           111         114
                                                                                                                                        114
       359
        359
                     322
                      322          323
                                    323
                                                                                                    92
                                                                                                     92
                                                                                       86
                                                                                        86
300
 300                                                                      90
                                                                           90
                                                            235
                                                             235                                                73
                                                                                                                 73              70
                                                                                                                                  70          69
                                                                                                                                               69

200
 200                                                                      60
                                                                           60

100
 100                                                                      30
                                                                           30

              77            1111          15
                                           15          44          13
                                                                    13
  00                                                                        00
       2016
       2016 2017
            2017 2018
                 2018 2019
                      2019 2020
                           2020                                                     2018
                                                                                    2018 2019
                                                                                         2019 2020
                                                                                              2020 2021
                                                                                                   2021 2022
                                                                                                        2022
              Leasing
               Leasing             Owner-occupiers
                                    Owner-occupiers                                          Completions
                                                                                              Completions         thereof
                                                                                                                   thereofPre-let/Owner-occupied
                                                                                                                           Pre-let/Owner-occupied
You can also read