The future electricity intraday market design
←
→
Page content transcription
If your browser does not render page correctly, please read the page content below
The future electricity intraday
market design

Written by
Andreas EHRENMANN, Pierre HENNEAUX, Gerd KÜPPER (TRACTEBEL Advisory and Advanced
Analytics)
Johan BRUCE, Björn KLASMAN, Linda SCHUMACHER (SWECO)
February – 2019
The future electricity intraday market design

 Directorate-General for Energy
 Internal Energy Market
2018
EUROPEAN COMMISSION
Directorate-General for Energy
Directorate B — Internal Energy Market
Unit B2 — Wholesale markets; electricity & gas
The future electricity intraday market design

The future electricity intraday
market design
The future electricity intraday market design

Europe Direct is a service to help you find answers
to your questions about the European Union.

Freephone number (*):

00 800 6 7 8 9 10 11
 (*) The information given is free, as are most calls (though some operators, phone
 boxes or hotels may charge you).

LEGAL NOTICE
This document has been prepared for the European Commission, however it reflects the views only of the
authors, and the Commission cannot be held responsible for any use which may be made of the information
contained therein.

More information on the European Union is available on the Internet (http://www.europa.eu).

Luxembourg: Publications Office of the European Union, 2019

ISBN 978-92-79-88757-4
doi:10.2833/004191

© European Union, 2018
Reproduction is authorised provided the source is acknowledged.
EXECUTIVE SUMMARY The Commission Regulation (EU) 2015/1222 of 24 July 2015 “establishing a guideline on capacity allocation and congestion management”, hereafter called CACM, defines the target model for a single European market for electricity. However, its current requirements for the single intraday coupling - namely congestion pricing based on actual bids, efficient use of cross-border transmission capacity and continuous trade - are difficult to reconcile. The main reason is that continuous trade implies a first-come first-served allocation of transmission capacity, precluding by definition any congestion-based pricing. As a consequence, in the current XBID continuous trading mechanism, transmission capacity is not priced: any remaining or newly released capacity after the day-ahead market clearing is allocated for free, on a first-come first-served basis. This can create dispatch distortions in the short term, and investment distortions in the long term. In that context, this study aims at analysing possible options for improvements in the intraday market design, with a view to establishing a scheme for an efficient and effective transmission capacity pricing method. As a general finding of this study, it appears that specific requirements of 1) pricing congestion based on actual orders, 2) treatment of non- standard products and 3) inclusion of flow-based market coupling constraints all tend to favour auctions over continuous trading. Forward looking, we believe that a higher share of renewable energy sources (RES) with their inherent short-term uncertainty, in combination with the introduction of a flow-based grid representation for the intraday time frame and the need to introduce non-standard products with finer time granularity, will render intraday auctions indispensable. This trend may be further reinforced if a bidding zone review would lead to smaller zones. Auctions may also foster participation of new and smaller market participants, which seems essential in a world of growing shares of decentralized renewable generation. Hence the key question is not if auctions need to be introduced, but rather when to introduce them and how many are needed. The auction frequency is driven by the need of market participants to trade in specific moments. Such events obviously relate to changes in the information about the market like recalculations of the transmission capacities in intraday, but also to better information on RES output closer to real-time, as well as to the availability of products with finer time granularity at the intraday gate opening. Current proposals on how to integrate auctions in European intraday markets range from one auction (All TSOs’ initial proposal for pricing cross-zonal capacity) to high-frequency auctions (Deutsche Börse AG Continuous Auction Market model). We believe that one auction is not sufficient, while we question at the same time the performance of high-frequency (e.g. every few seconds) auctions. Our following recommendations are intended to further improve the working of the cross- zonal intraday markets: As a prerequisite and next to an alignment on cross-zonal intraday market opening and gate closure times (as decided by ACER in 2018), also cross-border products should be aligned. In light of increasing RES shares, we plead in particular for the introduction of products with a 15-minutes time granularity. Cross-zonal intraday auctions should be introduced: - An opening auction, to allow for efficient allocation of transmission capacity left from day-ahead, conditional on the introduction of products with finer time granularity than in day-ahead; - One evening auction, to allocate transmission capacity that would result from the capacity recalculation process which will be established at regional level for the intraday timeframe. If more capacity re-calculations are possible in the future additional auctions have to be added; - 8 to 12 additional auctions starting at midnight, conditional on a flow- based grid representation being introduced in intraday, to adjust transmission capacity usage following better information on RES output.
To allow market participants to react quickly to events and in line with the current CACM, we suggest keeping continuous trading in-between the auctions, possibly with simplified products. Finally, we believe that our discussion on intraday markets has to be seen in a wider context. It touches upon the purpose of the intraday market. Initially, day-ahead markets were considered as “spot” markets, with intraday markets and balancing markets being adjustment markets. This view is already changing: the moment of exchange of power should be the spot market, as argued by (Smeers Y. , 2008), while all other markets have to be seen as forward markets. From that perspective, we already have a closing auction in the form of the balancing market – which essentially remains national until the balancing guideline will be fully implemented. Further integration even closer to real-time will thus be needed.
CONTENTS
EXECUTIVE SUMMARY ...................................................................................... 6
LIST OF FIGURES ............................................................................................ 9
ACRONYMS ..................................................................................................... 9
INTRODUCTION ............................................................................................. 11
 Context – the need to price transmission capacity ........................................ 11
 Study objectives and structure .................................................................. 11
1. MARKET DESIGN ASPECTS ........................................................................ 12
 1.1. Concepts and principles ..................................................................... 12
 1.1.1. The intraday market ............................................................... 12
 1.1.2. Product definition ................................................................... 13
 1.1.3. The power transmission grid .................................................... 13
 1.1.4. Matching mechanisms ............................................................. 15
 1.2. CACM market design requirements for intraday markets ........................ 16
 1.2.1. Allocation and pricing of transmission capacity ........................... 16
 1.2.2. Grid representation ................................................................ 16
 1.2.3. Trading of non-standard products ............................................. 17
2. CROSS-BORDER TRADING OPTIONS IN INTRADAY MARKETS ........................ 17
 2.1. Current trading arrangements ............................................................. 17
 2.1.1. Calculation of intraday cross-border transmission capacity .......... 17
 2.1.2. Current European Cross-Border Intraday Solution – XBID ........... 19
 2.1.3. Auctions in intraday markets ................................................... 20
 2.1.4. Some statistics ...................................................................... 20
 2.2. Proposed Future Trading Options ......................................................... 21
 2.2.1. Continuous Auction Model ....................................................... 21
 2.2.2. All TSOs Hybrid Model ............................................................. 23
3. INTRODUCING AUCTIONS IN INTRADAY MARKETS ...................................... 23
 3.1. Auctions versus continuous trading ...................................................... 23
 3.1.1. Efficient price discovery .......................................................... 23
 3.1.2. Non-standard products trading ................................................ 24
 3.1.3. More detailed grid representation ............................................. 24
 3.1.4. Support of smaller market participants ..................................... 27
 3.1.5. Information efficiency ............................................................. 27
 3.1.6. Summing up .......................................................................... 27
 3.2. Setting the auction frequency ............................................................. 28
 3.2.1. Concentration of liquidity ........................................................ 28
 3.2.2. Empirical evidence ................................................................. 30
 3.3. Comparative analysis ......................................................................... 33
 3.3.1. CACM requirements ................................................................ 33
 3.3.2. Other CACM requirements ....................................................... 36
 3.3.3. Conclusions ........................................................................... 36
4. CONCLUSIONS AND RECOMMENDATIONS ................................................... 37
REFERENCES ................................................................................................. 41
LIST OF INTERVIEWS ...................................................................................... 44
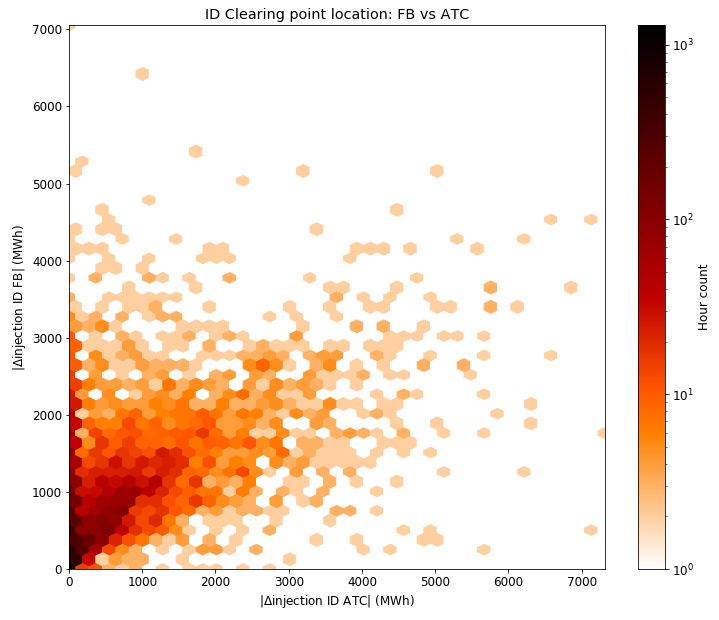
LIST OF FIGURES

Figure 1: Sequence of EU electricity markets and related network codes and guidelines 12

Figure 2: Defining the commercial transmission capacity – ATC and FB domains ..........14

Figure 3: Continuous trading versus auctions ...........................................................15

Figure 4: Day-ahead and intraday volumes on EPEX Spot and EXAA ...........................20

Figure 5: ID traded volumes per zone and product ...................................................21

Figure 6: The clocked process of the CAM ................................................................22

Figure 7: The consecutive process of the CAM ..........................................................22

Figure 8: Dispatch re-optimization in intraday ..........................................................25

Figure 9: Dispatch adjustments from DA to ID according to ATC and FB domain in ID ...26

Figure 10: Evolution of the wind onshore production forecast error .............................29

Figure 11: Bid formats in different countries ............................................................29

Figure 12: Trading needs when 15-minutes products are introduced ...........................30

Figure 13: Average number of trades depending on time to real-time .........................31

Figure 14: Average number of sell and buy orders ....................................................32

Figure 15: Frequency of successful ID auctions with 5 seconds and 5 minutes intervals.32

Figure 16: DK1-SE3 new ID capacity, time to saturation after start of trading session ...33

Figure 17 : Comparison of the different options ........................................................36

Figure 18: Indicative intraday timing with 10 auctions ..............................................39

ACRONYMS

ACER Agency for the Cooperation of Energy Regulators

AON All-Or-Nothing

ATC Available Transfer Capacity

CACM Capacity Allocation and Congestion Management

CAM Continuous Auction Model

CCM Capacity Calculation Methodology

CCR Capacity Calculation Region

CGM Common Grid Model

CET Central European Time

CT Continuous Trading
DAM Day Ahead Market

DBAG Deutsche Börse AG

D2CF Two Days Ahead Congestion Forecast

FB Flow Based

FBMC Flow Based Market Coupling

FCFS First-Come First-Served

FOK Fill-Or-Kill

IDCZGOT Intraday Cross-Zonal Gate Opening Time

IDCZGCT Intraday Cross-Zonal Gate Closure Time

IDA Intraday Auction

IDM Intraday Market

IOC Immediate-Or-Cancel

MTU Market Time Unit

NEMO Nominated Electricity Market Operator

PUN Prezzo Unico Nazionale

OTC Over-the-Counter

RES Renewable Energy Sources

TSO Transmission System Operator

XBID Cross-Border Intraday Market Project
INTRODUCTION

Context – the need to price transmission capacity

With increasing shares of variable renewables, the volume of adjustments closer to real
time is growing. Hence, there is an increasing need to unlock flexibility from all potential
market actors on the supply and the demand side, across all market time-frames and
bidding zone borders.

The Commission Regulation (EU) 2015/1222 of 24 July 2015 “establishing a guideline on
capacity allocation and congestion management”, hereafter called CACM, defines the target
model for a single European market for electricity. It sets criteria related to the calculation
of cross-border transmission capacity, its allocation and pricing both for the day-ahead and
intraday time-frame. As a general principle, the target model envisages that electric energy
and transmission capacity between bidding zones are allocated simultaneously, i.e. cross-
zonal trade is possible for market participants without explicitly acquiring transmission
capacity, under the condition that interconnectors are not congested. By integrating day-
ahead and intraday markets, the possibility for market parties to trade out their imbalances
will be significantly improved. Next to implicit allocation of transmission capacity, CACM
also requires a pricing of transmission capacity reflecting congestion and market
participants’ willingness to pay for it.

The go-live of the XBID Market Project in June 2018 has accommodated an intraday cross-
zonal market in a common IT system across the EU. The vision is a single integrated market
across the whole of Europe, enabling intraday transmission capacity to be utilized after the
closure of the day-ahead market by all market parties.

However, in the current XBID continuous trading mechanism, transmission capacity is not
priced. Any remaining or newly released capacity after the day-ahead market clearing is
allocated for free, on a first-come first-served basis. As a result, transmission capacity is
not necessarily allocated to transactions between price zones with biggest price differences,
where it creates most value, but to the trader submitting the first, even if this is between
price zones with limited price difference. In the short term, this thus creates dispatch
distortions. Total generation costs tend to be higher since possibly scarce transmission
capacity is not allocated efficiently. In the longer term, the absence of transmission pricing
creates investment distortions, in favour of generation capacity (since transmission
capacity is for free) compared to transmission capacity.

Study objectives and structure

The aim of the study is to consider the options for possible improvements in the current
XBID project, with a view to establish a scheme for an efficient and effective transmission
capacity pricing method. The study focuses on the two options,presented in Section 2.2,
but also assesses other alternatives.

The report is structured as follows. In order to ensure a common understanding of the
concepts applied in this report, Section 1 reviews several market design choices and recalls
the key market design principles for the intraday market, as laid down in the CACM. Section
2 then looks at current cross-border trading arrangements in intraday and it elaborates on
the proposed future trading options to price cross-border transmission capacity more
efficiently. Introducing auctions for cross-border trade is seen as an option to this end.
Before comparing the merits of each of the proposed options, Section 3 starts with
addressing the question why the introduction of auctions, as opposed to continuous
trading, may be desirable. It then continues with a positioning of the proposed options
within a set of key market design requirements, some of them being CACM specific, others
not. Section 4 concludes with a set of concrete recommendations. In the course of the
study, interviews were held with several stakeholders. They are listed at the end of the
report.
1. MARKET DESIGN ASPECTS

 This section aims at summarizing the main features of the current regulatory
framework. Section 1.1 introduces the main concepts and principles used. Section 1.2 then
summarizes the main requirements of the CACM relevant for the treatment of transmission
capacity in intraday markets.

1.1. Concepts and principles

 1.1.1. The intraday market

Electricity is not storable in significant amounts, neither is it easy to transport (Kirchhoff
laws) and generation units often face flexibility constraints. This implies that power
markets do not emerge naturally but they need to be organized. The target design model
for the European internal electricity market is based on a temporal sequence of forward,
short term day-ahead and intraday as well as real-time balancing markets. The rules
governing these markets are laid down in eight Commission Regulations, commonly
referred to as Network Codes.1 Network Codes are drafted by ENTSO-E, under guidance of
ACER. There are three families to be distinguished: codes related to grid connection, to
system operation and to markets. According to the Capacity Allocation and Congestion
Management (CACM) market network code, ‘intraday market time-frame’ means the time-
frame of the electricity market after intraday cross-zonal gate opening time and before
intraday cross-zonal gate closure time, where for each market time unit, products are
traded prior to the delivery of the traded products.

 Source: (Meeus & Schittekatte, 2018)

Figure 1: Sequence of EU electricity markets and related network codes and guidelines

The European regulators (ACER/CEER, 2018) decided that intraday cross-zonal gate
opening times (IDCZGOT) should be harmonized at 15h00 market time (CET) day-ahead
and the intraday cross-zonal gate closure time (IDCZGCT) shall be 60 minutes before the
start of the relevant market time unit.

This report focuses on the intraday market (IDM) and the related Capacity Allocation and
Congestion Management (CACM) market network code. Market design features ahead
(day-ahead and forward markets) and after IDM (balancing markets) are taken as given,

1
 Strictly speaking, only four out the eight Commission Regulations are network codes (ER, RfG, DC, HVDC), the
 other four are guidelines: CACM, FCA, EB and SO (Meeus & Schittekatte, 2018).

 12
although their interdependence is obvious. As pointed out by (Smeers Y. , 2008), “because
of non-storability, the physical trade of electricity only takes place in real-time, which is
thus the only true spot market. The other markets are forward markets that trade
derivatives products maturing in real-time on the spot market.”

 1.1.2. Product definition

The product definition, or bidding format, defines the way market participants can
introduce bids along a price-quantity schedule. In an exchange-based market environment,
three types of formats can be distinguished: simple, block and complex bids.

A simple bid encompasses only a volume and a price for energy to be delivered in a given
market time unit (MTU), which is the period for a market price is established (Commission
Regulation, 2013). This typically corresponds to a period of one hour or of 15 minutes.
Simple bids can be partially accepted. Although simple and transparent, simple bids cannot
accommodate inter-temporal unit commitment constraints of power plants. This may lead
to inefficient dispatch when generators cannot adjust production with their portfolio,
especially when intermittency in the power system is increasing. To account for these
drawbacks, generators are given the possibility to enter non-standard bids.

Block bids relate to a certain number of consecutive time periods. They are defined by a
unique price for all MTUs and a volume which can vary between MTUs. Execution happens
only if the average received price over the time horizon is at least equal to the price of the
bid. In that case, bids are said to be ‘in-the-money’. An exception to this rule is the
paradoxically rejected order, i.e. a rejected block order which is in-the-money. In principle,
block bids are either fully rejected or fully accepted, which is the ‘All-Or-Nothing’ constraint.
There are several variants of the regular block bid: volumes per MTU can be profiled, some
power exchanges like NordPool allow for curtailable block bids that can be partially
accepted according to a minimum acceptance ratio. Also, several block bids can be linked.
In the latter case, the acceptance of one block bid is conditional on the acceptance of
another block bid.

With complex bids, generators can condition the acceptance of their bid to technical plant
constraints like start-up costs, minimum stable load levels or ramping rates. In Europe,
only the Spanish market allows for such offers. The inclusion of complex bids in the
matching algorithm substantially increases computational time.

 1.1.3. The power transmission grid

The exchange of electricity requires its transport via a transmission (and distribution) grid.
The flow of electricity is not straightforward in meshed networks, since Kirchhoff’s laws
require that the electricity flow allocation is inversely proportional to the path’s impedance.
Considering thermal limits of the lines is not sufficient. This implies important network
externalities: depending on the impedance of the transmission lines, the power injection
at a certain node to satisfy load in another node will impact the ability to inject and
withdraw power at other nodes. There are several options to integrate the grid in power
markets. They differ by the degree of aggregation of the physical properties of the grid,
and hence by the ability of the market to reflect more local conditions.

 1.1.3.1. Power grid representation

Several power markets outside Europe, like Pennsylvania, New Jersey & Maryland (PJM),
New York ISO, Mid-West ISO (MISO), Texas (ERCOT), New England or New Zealand, opted
for a detailed representation of the grid in the market by implementing nodal pricing. The
European target model, on the other hand, is based on a zonal approach: network nodes
are aggregated by zones and cross-zonal trade is feasible according to commercial
transmission capacities. In the remainder of the text, we focus on the European approach

 13
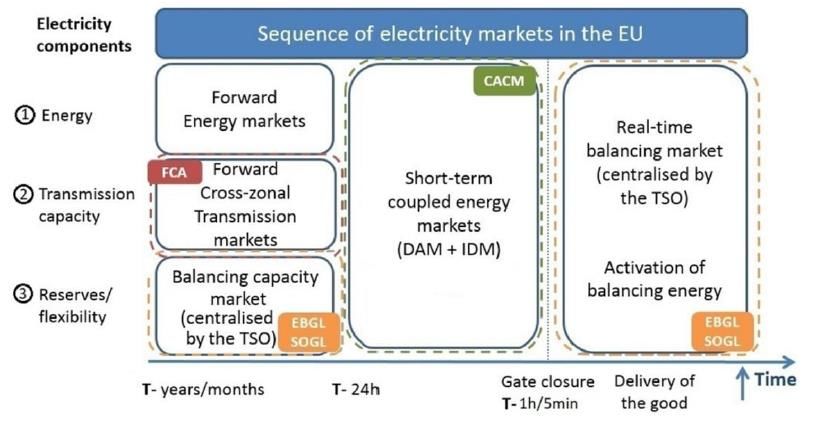
of a zonal grid representation.2 There are two methodologies to define the transmission
capacity available for cross-zonal trade: the Available Transfer Capacity (ATC) and the
Flow-Based (FB) approach. It is a general consensus that the FB approach is superior
to the ATC approach: instead of defining bilaterally the available commercial capacity on
each zonal border, all TSOs within a geographical area, called the Capacity Calculation
Region (CCR)3, coordinate to take grid externalities explicitly into account in the
transmission capacities provided to the market. Coordination reduces security margins and
leaves the allocation of capacity among borders to the market. It follows a better usage of
the existing transmission network, with more regional price convergence.

Figure 2 shows the ATC domain and the FB domain for a system based on three bidding
zones A, B and C. Net exchange positions are limited by the relevant ATC or FB domain.
Given that additional security margins need to be taken in the ATC approach, the FB
domain is typically larger than the ATC domain. More energy can be exchanged to benefit
from regional cost differences. The efficient dispatch minimizing total costs usually implies
a corner solution (note that the objective function is not shown in the graph). Figure 2 also
highlights the inclusion of grid externalities in the FB domain. For instance, if country A is
a net exporter towards countries B and C (upper right area), A could increase exports
towards B when reducing exports to C. This is not possible in an ATC environment.

 Source: KU Leuven Energy Institute, EI Fact Sheet 2015-02

Figure 2: Defining the commercial transmission capacity – ATC and FB domains

 1.1.3.2. Allocation of transmission capacity

Transmission capacity can be auctioned separately from energy (explicit auction) or
simultaneously (implicit auction). Given that regional energy price differences are not fully
known when transmission capacity is auctioned explicitly, an inefficient usage and pricing
is likely: efficient trades might be inhibited, or rents are captured by traders while they
should be received by the owner of the scarce resource. When markets are coupled, the
available capacity is used to maximize social welfare across the markets, hence capacity is
implicitly auctioned and efficiently used and priced. For the remainder of the text, we do
not further consider the option of explicitly auctioning transmission capacity.

2
 The literature on nodal and zonal pricing mechanisms is extensive. We refer the interested readers to, for
 instance, (Hogan, 1992).

3
 There are ten CCR, see (ACER, 2016).

 14
1.1.4. Matching mechanisms

Market participants introduce bids to buy and submit offers to sell electricity. They can
meet directly on a bilateral basis, on the so-called Over-the-Counter (OTC) market, or on
an exchange platform. When trade is exchange-based, orders are gathered in an order
book and some algorithm needs to be defined to match bids and offers as well as to set a
clearing price. Two main mechanisms are distinguished: continuous trading and auction-
based trading. In a continuous trading setting, an incoming offer is immediately matched
if possible with existing bids. Continuous trading is thus based on the first-come first-
served principle and the pricing rule is necessarily pay-as-bid (you get what you bid).
Auctions, on the other hand, match demand and supply at a fixed point in time. Auctions
therefore allow both for a pay-as-bid or a pay-as-cleared (you get the marginal bid) price
determination.

Competition on speed rather than on costs

Compared to auctions, speed (or the order at which bids enter the trading platform) and not only
the offered price matters for matching demand and supply in continuous trading. Figure 3 illustrates
the matching of buyers and sellers in a given time period, for instance all bids that enter within a
given hour for a given MTU. With auctions, buy (sell) orders are ordered from the highest (lowest)
to the lowest (highest) bid. Social welfare, being the difference between willingness to pay and to
sell, is maximized. Assume that buy orders enter the trading platform from highest to lowest
willingness to pay. It is possible that the highest buy orders are taken by the sellers with the higher
willingness to sell (marginal cost). Although there are more trades ( ∗∗ > ∗ ), welfare is lower and
allocation is suboptimal. In particular, the seller with the lowest cost in that example is not matched.
Hence, the number of trades is not necessarily a good indicator to evaluate the relative performance
of continuous trading compared to auctions.

Figure 3: Continuous trading versus auctions

The literature comparing pay-as-bid and pay-as-cleared mechanisms is extensive.4
Overall, one can argue that they lead in expectation to the same outcome, since market
participants adapt their bidding strategy to the rules of the game. In particular, while

44
 See for instance (Ausubel & Cramton, 2002), (Federico & Rahman, 2003), (Fabra, 2003) or (Tierney, Schatzki,
 & Mukerij, 2008).

 15
bidding at marginal cost would be the dominant strategy in a pay-as-cleared mechanism, players will bid at the expected marginal bid in a pay-as-bid setting. On the other hand, pay-as-bid can introduce an inefficient ranking of bids leading to a higher total cost (since players bid strategically, trying to estimate the marginal bid), pay-as-cleared tends to favour the entry of smaller market participants (since it is easier to bid at marginal cost), while the relative performance is less clear-cut in non-competitive settings. In general, there tends to be a preference for pay-as-cleared auctions. For the remainder of the text, we propose therefore to consider auctions only in combination with a pay-as-cleared pricing mechanism. 1.2. CACM market design requirements for intraday markets 1.2.1. Allocation and pricing of transmission capacity The following requirements of the CACM are of paramount importance for intraday markets. On the allocation and pricing of cross-zonal transmission capacity, the CACM specifies that: (Preamble 13) Capacity should be allocated in the day-ahead and intraday market time-frames using implicit allocation methods, in particular methods which allocate electricity and capacity together. In the case of single day-ahead coupling, this method should be implicit auction and in the case of single intraday coupling it should be continuous implicit allocation; (Preamble 22) Reliable pricing of transmission capacity should be introduced for the intraday market time-frame, reflecting congestion and (Art.55) shall be based on actual orders. Most of the interviewees agree that continuous trading and efficient pricing and allocation of transmission capacity are not compatible with each other. This defines the starting point of our task to study methods for an efficient and effective transmission capacity pricing in intraday markets. Section 3.1.1 will elaborate on the incompatibility of continuous trading and efficient pricing of transmission capacity. Note that those who did not agree with this incompatibility argued either that transmission capacity left from day ahead would have no value, hence it could be allocated for free and a pricing mechanism is not needed. Or they believe that transmission pricing can still be included in the continuous trading mechanism. However, as we will argue in Section 3.2.1, we believe that available transmission capacity available after DAM can have a positive value under certain circumstances. Furthermore, as long as transmission capacity and energy are not cleared simultaneously (implicit auctions), any pricing of transmission capacity will only be an estimate (Baringa, 2014). 1.2.2. Grid representation Regarding the representation of the transmission grid, the CACM clearly prefers the FB approach: (Preamble 7) There are two permissible approaches when calculating cross-zonal capacity: flow-based or based on coordinated net transmission capacity. The flow- based approach should be used as a primary approach for day-ahead and intraday capacity calculation where cross-zonal capacity between bidding zones is highly interdependent. The flow-based approach should only be introduced after market participants have been consulted and given sufficient preparation time to allow for a smooth transition. The coordinated net transmission capacity approach should only be applied in regions where cross-zonal capacity is less interdependent and it can be shown that the flow-based approach would not bring added value. 16
1.2.3. Trading of non-standard products The method should also allow for the trading of non-standard products reflecting market participants’ needs, especially those that are related to unit commitment constraints (Preamble 41). In particular, the CACM states that multiple time unit bids should be possible: (Article 53 (3)) All NEMOs shall ensure that the continuous trading matching algorithm is able to accommodate orders covering one market time unit and multiple market time units. Especially in Article 65 on the removal of explicit bids for transmission capacity, the CACM refers to non-standard products that need to be developed and offered: (Article 65) The NEMOs concerned shall cooperate closely with the TSOs concerned and shall consult market participants in accordance with Article 12 in order to translate the needs of market participants linked to explicit capacity allocation rights into non-standard intraday products. Prior to deciding on the removal of explicit allocation, the regulatory authorities of the Member States of each of the bidding zone borders concerned shall jointly organise a consultation to assess whether the proposed non-standard intraday products meet the market participants' needs for intraday trading. The competent regulatory authorities of the Member States of each of the bidding zone borders concerned shall jointly approve the introduced non-standard products and the removal of explicit allocation. 2. CROSS-BORDER TRADING OPTIONS IN INTRADAY MARKETS 2.1. Current trading arrangements 2.1.1. Calculation of intraday cross-border transmission capacity The CACM allows both for the ATC and the FB approach to compute and to allocate transmission capacity between bidding zones to the market. Although, according to the CACM guideline, the FB approach should be the primary approach for intraday market coupling, only the ATC approach is currently used to calculate and allocate intraday cross- border transmission capacity. Currently, the cross-border transmission capacity available for the intraday market corresponds essentially to the left-over capacity from the day-ahead market clearing point. For borders using an ATC approach for the day-ahead market, the computation of that left- over capacity is straightforward. In the CWE region, the only region currently using a FB approach for the day-ahead market, a specific procedure is put in place to extract the intraday ATC domain from the FB domain (Amprion; Creos; Elia; RTE; TenneT; BW, Transnet; APG, 2016). The TSOs can re-assess the ATC to increase the capacity available for the intraday market, but this is not based on a systematic process. Note that the calculation of the cross-border transmission capacity for the day-ahead market is based itself on the two days ahead congestion forecast (D2CF). The reliability margins necessary to account for uncertainties are thus important. Therefore, the current methodologies do not allow for a reduction of the reliability margins when forecasts improve. In the framework of the CACM implementation, the European TSOs are revisiting Capacity Calculation Methodologies (CCMs) for both the day-ahead and the intraday timeframe. It is thus envisaged to have a dedicated calculation of the cross-border transmission capacity for the intraday timeframe in the various CCRs: 17
For the Core CCR, a dedicated intraday common capacity calculation process using a FB approach is expected to be implemented early 2021 (CCR, TSOs OF THE CORE, 2018). A first intraday common capacity calculation should be performed at the end of the day before the day of delivery for all Market Time Units (MTUs), and a second intraday capacity calculation should be performed during intraday for the remaining MTUs. Note that the Core TSOs will review the frequency of recalculations two years after the implementation of the process, the target being to have multiple (i.e. more than two) recalculations throughout the day 5. Before the implementation of the intraday common capacity calculation process, the Core intraday capacities will still correspond to the left-over capacities from the day-ahead market clearing point, with the adaptation for the CWE region as described in (Amprion; Creos; Elia; RTE; TenneT; BW, Transnet; APG, 2016). For the Nordic CCR, although the FB approach is the target capacity calculation approach for the intraday timeframe, the coordinated NTC approach will be applied in the intraday timeframe until conditions to implement FB approach are met (Energinet, Svenska Kraftnät, Fingrid and Statnett, 2018).It means that, at the moment of the CCM implementation early 2021, the NTC approach will be used, and that the FB approach should be used beginning of 2022 if the intraday market coupling algorithm can accommodate it (Energinet, Svenska Kraftnät, Fingrid and Statnett, 2018). In both cases, dedicated common grid models will be used to compute capacities for intraday time-frame, which means that the Nordic intraday capacities will not be simply the left-over capacities from the day-ahead market clearing point. However, “due to the fact that the intraday gate opening takes place before CGMs for the intraday market timeframe are available, the first assessment of intraday cross-zonal capacity shall be done based on CGMs for the day-ahead market timeframe and the results of the single day-ahead coupling” (Energinet, Svenska Kraftnät, Fingrid and Statnett, 2018). Furthermore, it is not yet clear when the capacity will be recalculated, as it is only stated that “the frequency of the reassessment of the intraday cross-zonal capacity is dependent on the availability of input data relevant for capacity calculation (e.g. CGMs), as well as any events impacting the cross-zonal capacity”. For the Channel CCR, a dedicated intraday common capacity calculation process using an NTC approach is expected to be implemented no later than Q3 2019 (BritNed, Elia, National Grid, Nemo Link, RTE, TenneT, 2018). At least one intraday capacity calculation will be performed, before the day of delivery based on the latest CGMs (i.e. the DACF). In the short term, no more than one capacity calculation is expected, but “the TSOs of the Channel Region shall perform, no later than two years after the implementation of the Channel intraday capacity calculation methodology, a study on the number of intraday capacity re-computations” (BritNed, Elia, National Grid, Nemo Link, RTE, TenneT, 2018). For the SEE CCR, a dedicated intraday common capacity calculation process using an NTC approach is expected to be implemented by July 2020 (DMIE, ESO EAD, Transelectrica, 2018). However, it is not clear when the capacity calculation will be done. It can be assumed that at least one intraday capacity calculation will be performed, before the day of delivery. The frequency of recalculation will be reviewed two years after the implementation. For the SWE CCR, a dedicated intraday common capacity calculation process using a FB approach is expected to be implemented by the end of 2020. A first intraday common capacity calculation should be performed in the end of the day before the 5 To be complete, the Core CCM indicates that, in case, during the project implementation phase, it turns out feasible and of added value to have more than two intraday capacity calculations, additional recalculations will be performed during intraday. However, the authors understand that having already two capacity calculations by 2021 is challenging. 18
day of delivery, and a second intraday capacity calculation should be performed during intraday. The frequency of recalculation will be reviewed two years after the implementation, by performing a cost-benefit analysis on the SWE region. For the Italy North CCR, a dedicated intraday common capacity calculation process using an NTC approach was expected to be implemented by the end of 2018 (APG, ELES, RTE, Swissgrid, Terna, 2018). However, the methodology was not yet approved in January 2019. The frequency of the capacity calculation is not clear, but it can be assumed that at least one intraday capacity calculation will be performed, before the day of delivery. For the Hansa CCR, a dedicated intraday common capacity calculation process using an NTC approach is expected to be implemented, but it is not clear when it should be implemented (Statnett; TenneT; Svenska Kraftnät; PSE; 50hertz; Energinet, 2018). The NTC for the intraday time frame will be reassessed at least once during the intraday time frame, but it is only 30 days after the approval of the CCM for CCR Hansa, that the CCR Hansa TSOs will inform the market about what time cross-zonal intraday capacity will be released. The CCM proposal indicates also that “in case of unexpected events on the CCR Hansa interconnectors, and if these would impact cross zonal capacity, the capacity in the intraday time frame will be reassessed”. For the IU CCR, a dedicated intraday common capacity calculation process using an NTC approach is expected to be implemented in the beginning of 2020 (EirGrid, Moyle, NGET, SONI). At least one intraday capacity calculation will be performed, before the day of delivery based on the latest CGMs (i.e. the DACF). Consequently, by 2021, at least one intraday capacity calculation will be performed in all CCRs, before the day of delivery. Some CCRs might have more than one calculation, but the practices will not be fully aligned. Also by 2021, several CCRs intend to base the calculation on a FB approach. 2.1.2. Current European Cross-Border Intraday Solution – XBID XBID is a joint initiative of TSOs and Power Exchanges from 11 countries to create a coupled cross-border intraday market. The original launch was foreseen in 2014. However, because of several delays, the first go-live happened in June 2018 and comprised 14 countries. The next phase is planned in 2019, with additional countries joining the coupled intraday market. The go-live was preceded by several Local Implementation Projects (LIPs), like NL/BE6 or Kontek7. The Deutsche Börse AG (DBAG) is the selected technology provider. Trading occurs on a continuous 24/7 basis and market participants enter their orders in the Local Trading Solution of their NEMO. NEMOs are obliged to send these orders to the centralized Shared Order Book (SOB). Orders from other market areas are seen in the SOB as long as there is enough transmission capacity available. If not, only orders from the local market area are accessible. Transmission capacities are made available by TSOs in the Capacity Management Model (CMM). The Shipping Module (SM) provides information on concluded trades to all parties. In principle, transmission capacity is allocated implicitly, on a first-come first-served basis. Capacity is therefore used for free, as long as there is no congestion, in which case trades can only occur locally. There are two exceptions from the continuous and implicit allocation: explicit and continuous allocation on the French-German border, implicit auctions for the Portuguese-Spanish border. Market participants can trade at least hourly products on all borders. 30 or 15 6 Elia, TenneT NL, EPEX, NordPool 7 Energinet, 50Hz, NordPool, Epex 19
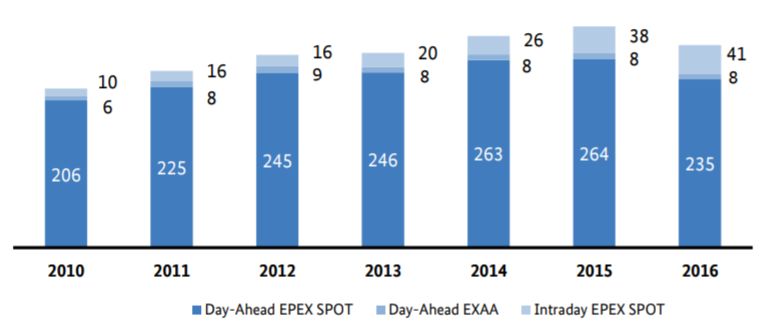
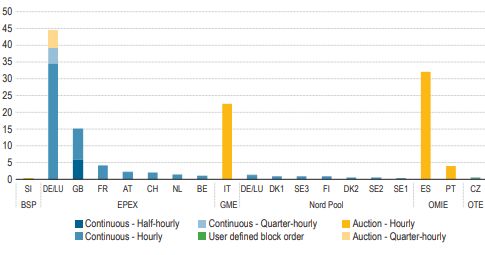
minutes products are available on some borders as well. User-defined hourly blocks bids
are possible on all borders, except for Iberia.

 2.1.3. Auctions in intraday markets

The Iberian power market Mibel, managed by OMIE, comprises a day-ahead market
and an intraday market. The latter is characterized by 6 consecutive auctions, to take
adjusted network constraints and unforeseen events into account. Portuguese-Spanish
transmission capacity is auctioned implicitly. Since the introduction of the XBID solution in
June 2018, Iberia has thus a hybrid system, with auctions complemented by continuous
trading in-between. Transmission capacity on the French-Spanish border is now allocated
continuously within XBID, while it was auctions explicitly before.

In April 2018, Nord Pool introduced an intraday cross-border auction for Germany
only8. The first auction is held at 22.00 CET for all hours of the coming day [00-24]. The
second auction is organized at 10:00 CET intraday and covers the remaining hours [12-
24]. 15 minutes before auction gate closure, cross-border continuous trading is frozen, but
continuous trading with bidding areas remains possible. The available transmission
capacity for the auctions is the remainder of the day-ahead market and continuous trading.
Technically, the auction system is based on Nord Pool’s day ahead system and the
Euphemia algorithm. As opposed to the Iberian intraday market, Nord Pool introduced
auctions to complement the already existing continuous trading.

Note that countries do not necessarily rely on intraday markets to adjust closer to rea-
time. In Poland, the day-ahead closes at 14:30. Subsequently, the TSO operates the
balancing market based on mandatory bids from qualified units. Reserves are procured
based on a joint energy and reserve market clearing process.

 2.1.4. Some statistics

With increasing shares of intermittent RES, adjustments closer to real-time become crucial.
Intraday markets are thus expected to gain in importance compared to day-ahead markets.
This is confirmed in Figure 4, where German/Austrian intraday volumes have steadily
increased since 2010. EPEX SPOT data also highlights strong volume increases between
2016 and 2017, especially for the Belgian (76 percent) and the Dutch (65 percent) intraday
markets. Compared to 2017, volumes continued to grow strongly in 2018 (France: 42
percent, the Netherlands: 41 percent, Great Britain: 25 percent, Germany: 13 percent,
Belgium: 4 percent).9

 Source: (Bundesnetzagentur, 2017)

Figure 4: Day-ahead and intraday volumes on EPEX Spot and EXAA

8
 Note that EPEX also organizes intraday auctions for the German area, at 3pm (15 minutes products).

9
 EPEX SPOT Yearly Figures Report 2018.

 20
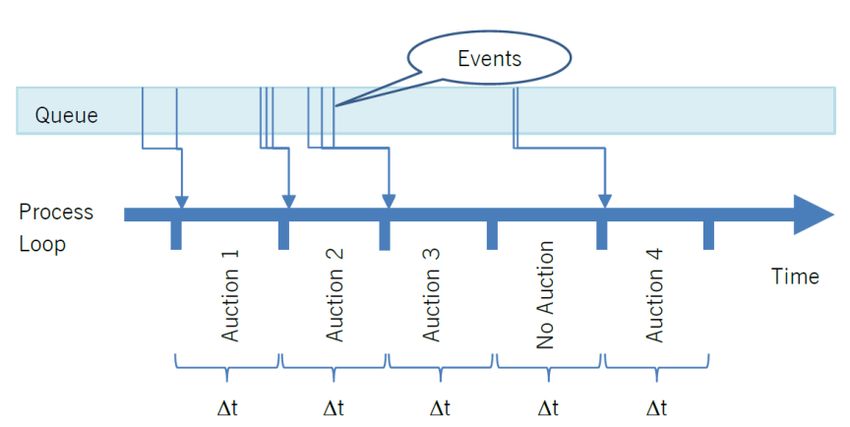
Today, the largest intraday markets in terms of volumes traded are in Germany, Iberia,
Italy and Great Britain. Most of these volumes are traded within the zones, but cross-zonal
trade is expected to increase strongly in the near future.

 Source: (ACER/CEER, 2018)

Figure 5: ID traded volumes per zone and product

The growing importance of intraday markets and the expected growth of trade between
zones supports therefore the need to ensure an efficient pricing and allocation of cross-
border transmission capacity in the intraday timeframe.

2.2. Proposed Future Trading Options

 2.2.1. Continuous Auction Model

DBAG has plans to accommodate capacity pricing as an essential feature in the continuous
trading matching algorithm of XBID. The following description is based on (Deutsche Börse
AG, 2018).

In the proposed Continuous Auction Model (CAM), auctions take place on a continuous
basis, possibly every few seconds. DBAG argues that when softening the strict first-come
first-served principle, orders entered with small time delay should be considered as
(nearly) simultaneously entered. Hence, any orders entered within a pre-defined time
frame shall be regarded as eligible for competition, and therefore must be traded in one
auction. Auctions with a pay-as-cleared pricing mechanism define a clear regional
reference price, allowing thus for an efficient pricing and allocation of transmission
capacity. The frequency at which the auctions take place is the key parameter in the CAM.
DBAG proposes two processes: the clocked and the consecutive process.

In the clocked process, there is a fixed time frame of which all entered orders are
collected and optimized. The duration of the time frame and, hence, the frequency needs
to be chosen by the market operator. The higher the frequency at which auctions are held,
i.e. the shorter the time frame, the more the system resembles to the current continuous
auction trading model. On the contrary, the CAM converges to a conventional auction-
based system with a lower frequency.

 21
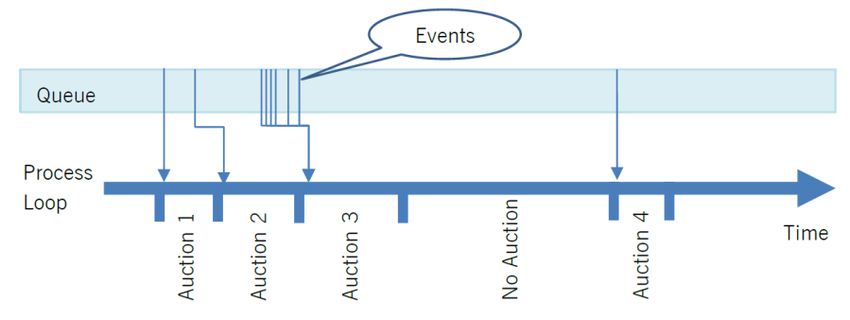
Source: (Deutsche Börse AG, 2018) Figure 6: The clocked process of the CAM The frequency at which auctions are held is defined endogenously in the consecutive process. The frequency depends on the technical limitations of the IT system, the number of incoming orders and the geographical scope (number of nodes and interconnectors). An incoming order directly triggers an auction. Orders entering during the clearing process of an auction are bundled together and cleared in a subsequent auction. Source: (Deutsche Börse AG, 2018) Figure 7: The consecutive process of the CAM DBAG argues that the model is self-adaptive, in the sense that it behaves like a continuous trading and according to the FCFS principle for transmission capacity allocation when the order entry rate is low (orders are processed one by one). For a high order entry rate (expected to be the case at the intraday gate opening and closure), orders compete which each other for the potentially scarce transmission capacity and a price for that capacity can be established. Further characteristics of the CAM are: Traded products: the CAM offers one single product based on a Market Time Unit (MTU) duration of 15 minutes10. However, a market participant has the possibility to link several MTUs via so-called multi-part orders. These orders are defined by a price-quantity pair, a set of (not necessarily consecutive) MTUs as well as a profile of execution fractions per MTU; Capacity orders: Transmission capacity is normally allocated implicitly. However, the CAM also allows for explicit capacity allocation, via a capacity order including the source and destination, the quantity and the limit price; 10 The duration can be adjusted if needed. 22
Grid representation: DBAG states that the CAM model allows for both an NTC and a Flow-Based grid representation. It remains to be analysed deeper how the Flow- Based approach would perform in case the frequency of events is such that orders are thus processed one-by-one (i.e. the CAM behaves like a continuous trading). 2.2.2. All TSOs Hybrid Model Some key stakeholders consider that it is not possible to price efficiently intraday cross- zonal capacity solely with continuous trading. Based on Article 55 of CACM, transmission system operators have proposed a hybrid model for pricing intraday cross-zonal capacity, in which continuous trading is combined with intraday auctions. In their proposal, it is stated that cross-border intraday capacity shall be initially offered to an intraday auction. However, in case additional capacity becomes available, which will no longer be traded in subsequent intraday auctions, the additional capacity shall not be withheld from the continuous trading sessions. The main design features of this model are (ENTSO-E, 2017): Intraday cross-zonal capacity is priced through Intraday Auctions (IDAs); Initial IDA is executed in day ahead timeframe and covers all the MTUs of the delivery day; Different options for further IDAs: all IDA cover all MTUs, or no overlap of MTU; Continuous matching sessions are run between the IDAs; Given the fact that bids are pay-as-cleared under implicit auction and pay-as-bid under implicit continuous market participants need to enter their bids for both types of markets separately; the type of products to be traded within IDA are not necessary linked with the ones traded during continuous matching session; Can be combined with XBID Solution; same systems could be in charge of the execution of IDA and continuous matching, but this does not have to be necessary as such. 3. INTRODUCING AUCTIONS IN INTRADAY MARKETS In the current XBID continuous trading mechanism, transmission capacity is not priced. Remaining transmission capacity left over after the day-ahead market clearing is allocated for free, on a first-come first-served basis. Section 2.2 presented the two proposed mechanisms, the CAM and the Hybrid Model, both aiming at introducing an efficient transmission capacity pricing method. To this end, they have in common that auctions should be introduced. Hence, before comparing the relative benefits and disadvantages of both approaches in more detail, we first assess the reasons why the introduction of auctions could be desirable in comparison with continuous trading. At least five aspects are to be considered. 3.1. Auctions versus continuous trading 3.1.1. Efficient price discovery The CACM requires that the transmission capacity price should reflect congestion and it should be based on actual orders. These conditions hold in the day-ahead market coupling: transmission capacity prices are equal by construction to the zonal energy price difference. In intraday with continuous trading, on the other hand, capacity cannot be priced on actual orders, since an efficient reference price reflecting willingness to trade cross-zonal cannot be established. Bids and offers standing in the order book are taken at the indicated price, while the buyer or the seller does not reveal his own willingness to pay or to sell (marginal cost). With continuous trading, either some pricing of transmission capacity is introduced, but this is necessarily based on pre-defined parameters or historical (day-ahead) prices not reflecting anymore the conditions prevailing at the moment of the trade, or capacity is 23
allocated for free on a first-come first-served basis. In the latter case (as in XBID), capacity
having potentially a positive value is given away for free to the fastest market participant,
not being necessarily the one with the highest valuation.

We conclude that to ensure an efficient allocation of potentially scarce transmission
capacity to the market participants with the highest valuation, some form of competition
for the transmission capacity needs to be introduced. Auctions can do this, by gathering
(during a given timeframe and for a given MTU) bids and offers revealing market
participants’ valuation. Transmission capacity is efficiently rationed according to prices, not
speed. The reasoning is based, however, on the assumption that the auction can indeed
reveal the true valuation of market participants. This is questionable when only a few bids
and orders are competing, i.e. when the auctions are frequently organized. Bidding
incentives in high frequency auctions and continuous trading are expected to converge.

 3.1.2. Non-standard products trading

Market participants trade in intraday often to adjust schedules, either due to unforeseen
outages or due to updated forecasts of renewable production. Hence the intraday
timeframe covers a time horizon in which the dispatch can still be optimized, and unit
commitment decisions can be reversed or taken. Two aspects are important: treatment of
multiple MTU and bids that deal with non-divisibility, ramping conditions and blocs.
Intraday markets should thus allow for block and possibly complex bids.

Continuous trading is necessarily bilateral: pairs of bids and offers are cleared
sequentially. Block bids can be accommodated by continuous trading conditional to the
presence of a market participant willing to take a given block bid. Liquidity in trading block
bids is thus expected to be very limited. Trading complex products in continuous trading,
on the other hand, is impossible given that the associated constraints cannot be fulfilled
bilaterally. Auctions concentrate liquidity and clear many bids and offers simultaneously.
Auctions can thus easily accommodate block and complex bids, although the latter
significantly increase complexity and computing time to find a market outcome.

 3.1.3. More detailed grid representation

Continuous trading considers exchanges between two parties only. Hence, a transaction
can only affect the import-export balance between two zones. This fits the ATC view where
a transaction only affects the flow from one zone to the other, but it is not in line with the
treatment of network externalities in a FB grid representation. To re-optimize the usage of
the network, i.e. to move along the edge of the FB domain, bids from more than two zones
need to be cleared together. This is known as the complementary goods problem (Mansur
& White, 2009).

Auctions allow for the treatment of the complementary good problem. On the other hand,
it is highly unlikely that continuous trading would allow for such re-optimization by a
sequence of bilateral trades, i.e. through some form of “tâtonnement”. This is illustrated
in Figure 8.

 24
You can also read