Spatial correlations constrain cellular lifespan and pattern formation in corneal epithelium homeostasis - eLife
←
→
Page content transcription
If your browser does not render page correctly, please read the page content below
RESEARCH ARTICLE

                                     Spatial correlations constrain cellular
                                     lifespan and pattern formation in corneal
                                     epithelium homeostasis
                                     Lior Strinkovsky1, Evgeny Havkin1, Ruby Shalom-Feuerstein2,3, Yonatan Savir1,3*
                                     1
                                      Department of Physiology, Biophysics and System Biology, Faculty of Medicine,
                                     Technion, Haifa, Israel; 2Department of Genetics & Developmental Biology, Faculty
                                     of Medicine, Technion, Haifa, Israel; 3The Rappaport Family Institute for Research in
                                     the Medical Sciences, Technion, Haifa, Israel

                                     Abstract Homeostasis in adult tissues relies on the replication dynamics of stem cells, their
                                     progenitors and the spatial balance between them. This spatial and kinetic coordination is crucial to
                                     the successful maintenance of tissue size and its replenishment with new cells. However, our
                                     understanding of the role of cellular replicative lifespan and spatial correlation between cells in
                                     shaping tissue integrity is still lacking. We developed a mathematical model for the stochastic
                                     spatial dynamics that underlie the rejuvenation of corneal epithelium. Our model takes into account
                                     different spatial correlations between cell replication and cell removal. We derive the tradeoffs
                                     between replicative lifespan, spatial correlation length, and tissue rejuvenation dynamics. We
                                     determine the conditions that allow homeostasis and are consistent with biological timescales,
                                     pattern formation, and mutants phenotypes. Our results can be extended to any cellular system in
                                     which spatial homeostasis is maintained through cell replication.

                                     Introduction
*For correspondence:                 In adult tissues, stem cells and their progeny play a crucial role in maintaining homeostasis. Renewal
yoni.savir@technion.ac.il            of the tissue is due to progenitor cells that have limited replication capacity (Watt and Hogan,
                                     2000). The interplay between stem cells and their progenitors with respect to replication, differentia-
Competing interests: The
                                     tion, and cellular hierarchy is not fully understood. For example, two opposing limiting models of
authors declare that no
                                     stem cell replication have been proposed: A ’Hierarchical’ model where stem cells are rare slow-
competing interests exist.
                                     dividing cells with longevity similar to the hematopoietic stem cell paradigm (Orkin and Zon, 2008)
Funding: See page 15                 and a ’Equipotent’ model where stem-cells are abundant equipotent cells that divide frequently and
Received: 26 February 2020           their loss is dictated by neutral drift (Klein and Simons, 2011; Klein et al., 2010; Losick and Des-
Accepted: 08 December 2020           plan, 2008; Lopez-Garcia et al., 2010). Another lingering question is the role of spatial correlation
Published: 12 January 2021           between replication and removal in homeostasis. Some studies assume a long-range correlation
                                     between replication and cell removal, that is, as a cell replicates, the removed cell can be tens and
Reviewing editor: Pierre Sens,
Institut Curie, PSL Research
                                     even hundreds of cells away (Lobo et al., 2016; Richardson et al., 2018; Park et al., 2019;
University, CNRS, France             Richardson et al., 2017) and other studies, in different experimental systems, suggest short-range
                                     correlations between replication and removal (Mesa et al., 2018; Miroshnikova et al., 2018).
   Copyright Strinkovsky et al.
                                        The cornea acts as a lens that focuses light into the eye, and serves as a barrier that protects the
This article is distributed under
                                     eye against external hazards or injury. Thus, maintaining its integrity and its continuous regeneration
the terms of the Creative
Commons Attribution License,         is crucial for proper vision in vertebrates (Yazdanpanah et al., 2017). It is now predominantly
which permits unrestricted use       accepted that the regeneration of the corneal epithelium, in homeostasis, is due to limbal epithelial
and redistribution provided that     stem cells (LESCs) residing at the circumference of the cornea, the limbus, which separates the cor-
the original author and source are   nea from the conjunctiva (Figure 1A; O’Callaghan and Daniels, 2011; Cotsarelis et al., 1989;
credited.                            Pellegrini et al., 1997; Lavker et al., 2004; Davanger and Evensen, 1971; Dziasko and Daniels,

Strinkovsky et al. eLife 2021;10:e56404. DOI: https://doi.org/10.7554/eLife.56404                                                    1 of 28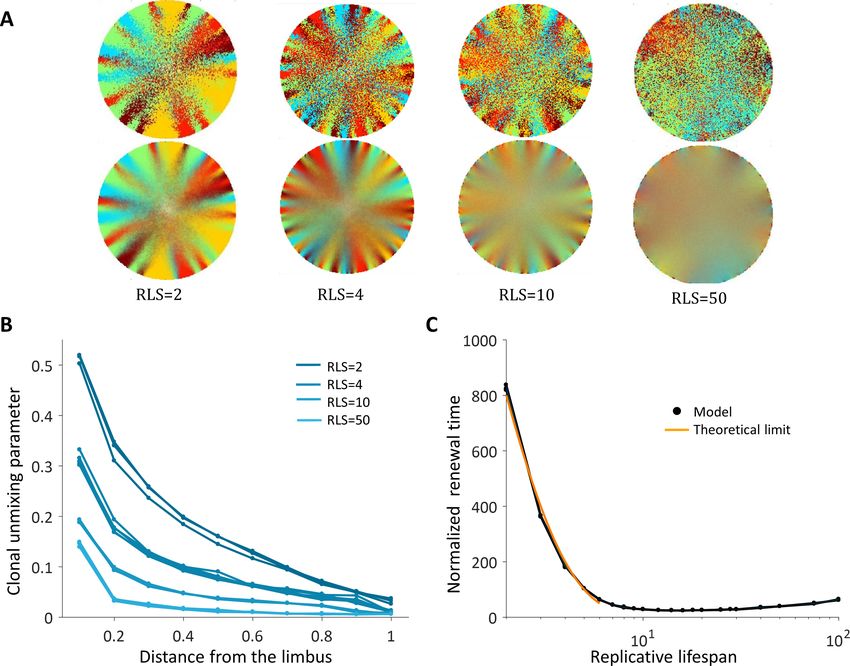
Research article                                                              Computational and Systems Biology Physics of Living Systems

Figure 1. Model setup. (A) Maintenance of cells in the cornea, the outer transparent part of the eye, is mainly due to stem cells that reside in the
limbus – a niche at the circumference of the cornea. (B) Illustration of in vivo multi-color lineage tracing experiment. Clonal stripes emerge from the
limbus toward the center of the cornea. (C) We consider two limiting scenarios for stem cell distribution and dynamics. In the first (left), stem cells are
evenly distributed all over the limbus. They can divide symmetrically to maintain the limbus or asymmetrically to provide progenitor cells to the cornea.
In the second model (right), stem cells are scarce and divide asymmetrically to give rise to progenitor cells in the limbus that further divide and
populate the cornea. In both models, progenitor cells have limited replicative lifespan capacity. When cells exhaust their replicative lifespan, the cells
can no longer divide in the basal layer and are replaced by other dividing cells. (D) Whether the location of replication and cell removal are correlated
(replication and cell removal occur in the same neighborhood) or not plays a crucial role in the cornea rejuvenation dynamics. Accounting also for
whether there is a centripetal bias results in four possible classes of models.

                                      2016). LESCs divide both symmetrically and asymmetrically to yield progenitor cells that have a lim-
                                      ited replicative lifespan (RLS) (Lehrer et al., 1998). In turn, progenitor cells are proliferating from the
                                      limbus to the basal cornea where they can either proliferate or migrate to upper layers
                                      (Figure 1A; Lehrer et al., 1998). The observation that in homeostasis the overall number of cells in
                                      the cornea does not fluctuate dramatically led to the ‘XYZ hypothesis’ that states that the prolifera-
                                      tion of epithelial cells in the limbus and their migration to the cornea is balanced by cell loss
                                      (Thoft, 1983). Lineage-tracing experiments in living mice revealed a pattern of clonal stripes that
                                      propagate from the limbus toward the center of the cornea (Figure 1B and Appendix 1 section I)
                                      (Amitai-Lange et al., 2015; Di Girolamo et al., 2015; Dorà et al., 2015; Nasser et al.,
                                      2018). Some hypotheses have been suggested regarding the mechanism of the centripetal migra-
                                      tion dynamics in the corneal epithelium homeostasis (West et al., 2015), including population
                                      dynamics and electrophysiological or electrochemical cues (Lavker et al., 1991; Gao et al., 2015;
                                      Blanco-Mezquita et al., 2013; Walczysko et al., 2016; Sharma and Coles, 1989). Yet, the underly-
                                      ing mechanism behind these dynamics is not fully understood.
                                          Using one-dimensional mathematical models to infer stem cells and progenitor cells dynamics
                                      from lineage tracing experiments have been useful in modeling different tissues such as murine epi-
                                      thelial homeostasis of the skin (Mascré et al., 2012), gut (Snippert et al., 2010), human epithelial
                                      homeostasis of the epidermis (Simons, 2016), lung (Teixeira et al., 2013), prostate (Moad et al.,
                                      2017), and the cornea (West et al., 2018; Moraki et al., 2019). Yet, while these models are insight-
                                      ful, the unique spatial organization in the cornea requires two-dimensional models to encompass
                                      overall pattern changes. These types of models require some assumptions on the spatial nature and
                                      organization of stem cells and on the spatial interactions between corneal cells. In particular, the
                                      role of interaction range between cells, or the spatial correlation between the location of replication
                                      and location of cell loss, plays a crucial role in the resulting dynamics (Mesa et al., 2018;
                                      Miroshnikova et al., 2018). In addition, another key property of the dynamics is the replicative life-
                                      span (RLS) of corneal cells – the number of times each corneal cell can divide. Approximating the

Strinkovsky et al. eLife 2021;10:e56404. DOI: https://doi.org/10.7554/eLife.56404                                                                   2 of 28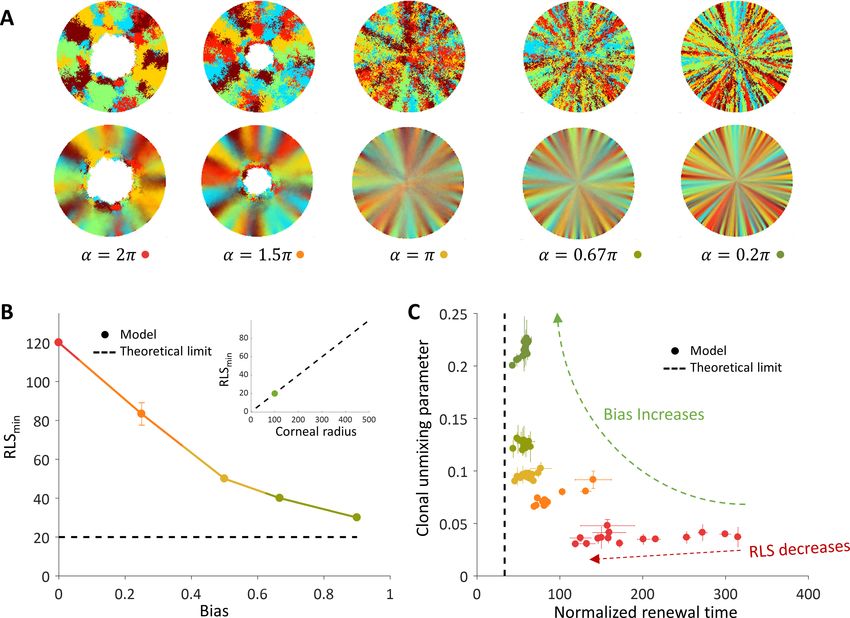
Research article                                                         Computational and Systems Biology Physics of Living Systems

                                    tissue as a kind of elastic network that minimizes some energy function (Barton et al., 2017) was
                                    used to suggest that corneal epithelial cells can organize into centripetal patterns in the absence of
                                    external cues (Lobo et al., 2016) under the assumption that stem cells are uniformly distributed, RLS
                                    of few divisions, and no correlation between replication location and cell loss location.
                                        In this work, we combine a novel mathematical model that allows rapid simulation of the stochas-
                                    tic dynamics of epithelial cells and pattern formation in the cornea together with analytical calcula-
                                    tions to consider a broad set of possible physiological scenarios. In particular, we determine the
                                    consequences of different assumptions on the replication-removal coupling range and replicative
                                    lifespan values. We characterize the tradeoff between renewal time and replicative lifespan and
                                    determine the constraints that allow homeostasis and are consistent with the formation of the
                                    observed spatial patterns, biological timescales, and mutant dynamics.

                                    Materials and methods
                                    We developed a lattice-based mathematical model of the cornea’s basal layer, to examine the
                                    potential underlying mechanisms and parameters that govern corneal homeostasis, centripetal
                                    migration and spatial order patterns as seen in the in vivo data (Appendix 1 sections I and II). We
                                    model the cornea as a round assortment of cells in the basal layer of the cornea (Figure 1C) with a
                                    radius R. We assume two types of cells: stem cells (S) and progenitor cells (P) that have different
                                    doubling rates ls and lp, respectively. S cells reside only in the limbus and can either divide symmet-
                                    rically or asymmetrically to produce S and P cells (Figure 1C). In the case of the ’Equipotent’ model,
                                    the P cells can reside only in the cornea while in the ’Hierarchical’ model they can reside both in the
                                    limbus and the cornea, PL and PC, respectively. P cells can divide only symmetrically; if they are in
                                    the cornea they can divide in any direction and if they are in the limbus (’Hierarchical’ model), they
                                    can divide only toward the cornea (Figure 1D). P cells are also limited in their maximal amount of
                                    horizontal replications - their replicative lifespan, RLS, a parameter which will play a major role in the
                                    forthcoming results (Figure 1C).
                                         Assuming corneal homeostasis, as cells in the cornea and the limbus are dividing, new cells are
                                    replacing other cells in the basal layer concurrently. The specific parameters of the replication rate,
                                    replicative lifespan, replication direction, and the coupling between the cells affect the spatial
                                    dynamics. There are two key properties that play a crucial role in tissue homeostasis dynamics, not
                                    only in the cornea. The first is the effective interaction range between replication and removal
                                    events. In one limit, the location of the cell that is removed is independent of the replication event.
                                    In the other limit, the probability of a cell to be removed will be higher in the area near the new cell
                                    (e.g., local pressure). The second property is whether there is an external bias that affects the repli-
                                    cation direction or removal location due to, for example, chemical cues, matrix structures or local
                                    mechanical perturbation such as blinking. While previous modeling efforts focus only on a particular
                                    model, which fits the hypothesis of the study, in this work we systematically account for all these sce-
                                    narios and provide the physical limitations, biological implications, and feasibility of each model.
                                         Dynamics are simulated using a stochastic 2D lattice Monte-Carlo approach (Appendix 1 section
                                    II). In homeostasis, as cells replicate, other cells are removed to keep the overall number of cell con-
                                    stant. In each step of the simulation, a pair of cells is chosen: one for replication and one for removal.
                                    The locations of these cells is determined by the spatial correlation between replication and removal.
                                    In the case that replication and removal are spatially correlated, both cells are more likely to be
                                    closer to each other. To account for bias, the location of the removed cell is randomly drawn from a
                                    uniform distribution of a circular section that is facing the center of the cornea around the replicating
                                    cell, and has an angle of a and radius of few cells (Appendix 1 section II, Figure 1D). If a = 2p, there
                                    is no centripetal bias, and as a is smaller the bias is larger (Figure 1D). In the case there is no corre-
                                    lation between replication and removal, the cells of the pair are chosen independently. To account
                                    for bias in this case, the removed cell is selected from a circle at the center of the eye with radius .
                                    As  is smaller, the centripetal bias increases (Figure 1D). Once the location of the pair, the repli-
                                    cated and removed cell, has been determined, the cells in the cornea reorient their location accord-
                                    ingly. The probability that a cell will move into the vacant hole depends on its distance from the
                                    vector that connects the replicated cell (that causes local stress) and the removed cell (which leaves
                                    a vacant space) (Appendix 1 section II). At the start of each realization, we label only the limbal stem
                                    cells and track the lineage dynamics by labeling their progenies with the same marker.

Strinkovsky et al. eLife 2021;10:e56404. DOI: https://doi.org/10.7554/eLife.56404                                                       3 of 28
Research article                                                              Computational and Systems Biology Physics of Living Systems

                                      Results
                                      Spatial coupling between cell replication and cell removal
                                      First, we examine the case in which replication and removal processes are spatially coupled in the
                                      absence of centripetal bias. We will introduce the centripetal bias in the next section. In this case,
                                      the replicated and removed cells are from the same neighborhood which is an order of a few cells
                                      and is denoted by m (Figure 1D). Accordingly, the effective step size of clone progression is small,
                                      an order of a few cells, hence there is a limit on the maximal distance of cell renewal from the lim-
                                      bus. This distance depends on the RLS. If the RLS is small then cells will exhaust their replicative
                                      capacity before reaching the center of the eye (Figure 2A, Video 1). For example, if the RLS is one
                                      (i.e. a P cell can divide once and then becomes post-mitotic), in steady-state the renewed cell front
                                      will propagate to fill the local interaction neighborhood, m (Appendix 1 section V). As RLS increases,
                                      cells can replicate further, and the renewed cell front at steady-state will be closer to the center. The
                                      steady-state location of the front is closer to the limbus than what is expected if it propagates an
                                      additional one cell toward the center for each replicative lifespan added (the deterministic limit,
                                      Appendix 1 section V). For example, even if the RLS is equal to the radius of the tissue, R = 100 in
                                      our case, the front still does not reach the center (Figure 2B), because P cells lose their proliferative
                                      potential already in the periphery.
                                          We capture the quantitative details of this phenomenon by considering an effective one-step
                                      binomial stochastic process. At each time point, the front can either stay at the same place or move
                                      forward with some probability. The probability of moving forward in the case there is no centripetal
                                      bias depends on the radial geometry of the front and is estimated to be about 3/8 (Appendix 1 sec-
                                      tion V). The results of this model are consistent with the simulation results. In the case there is no
                                      centripetal bias the expected minimal RLS, which permits replacement of central corneal cells,
                                      RLSmin, is around 130 replications (Figure 2B, Video 1). For RLSs that are above this critical value,
                                      the front can reach the center and a patched pattern is formed. The emerging pattern, in this case,

Figure 2. Spatial coupling between cell replication and cell removal in the absence of centripetal bias. (A) Steady-state snapshots (upper row) and
time-averages over 200 corneal replications (lower row). If the replicative lifespan is below a critical value, the cornea cannot be rejuvenated. For
replicative lifespan values that are above the critical value (RLSmin >
                                                                      ~ 130), the emerging pattern is that of contiguous patches reminiscent of in vivo
mutant phenotypes. (B) The fraction of the cornea that is renewed increases with replicative lifespan. Three realizations of the dynamics are shown
(black dots). The purple line is the theoretical upper limit on the renewed area, and the orange line is the result of a theoretical model that
approximates renewal as a one-step process (see text and Appendix 1 section V for details).

Strinkovsky et al. eLife 2021;10:e56404. DOI: https://doi.org/10.7554/eLife.56404                                                                    4 of 28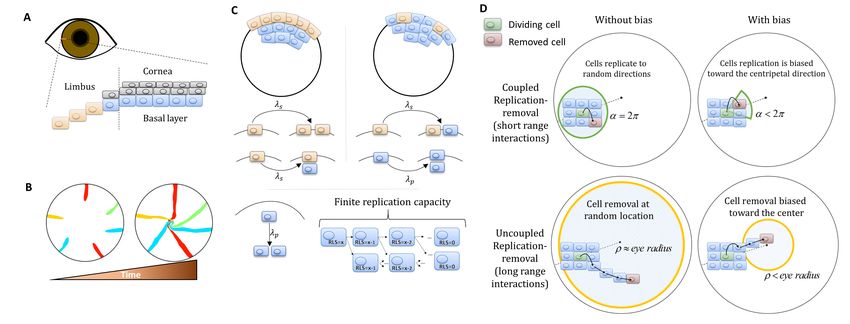
Research article Computational and Systems Biology Physics of Living Systems
is that of patches (Figure 2B, Appendix 1—fig-
ure 2). While this case does not provide clonal
stripes, it does result in contiguous patches that
resemble the in vivo pattern of mutants that lack
certain genes that are thought to play a role in
centripetal chemotaxis (Findlay et al., 2016;
Kucerova et al., 2012; Mort et al., 2011;
Douvaras et al., 2013) (Appendix 1 section III).
Adding bias to the dynamics of
coupled replication-removal
Video 1. Coupled spatial correlations in the absence of
We hypothesized that biased cell division orienta-
bias, RLS = 130. In this case, RLS >
~ RLSmin and thus the
cornea is fully rejuvenated. The emerging pattern is
tion toward the center (Figure 1D) would lower
that of contiguous patches. RLSmin and lead to a pattern that resembles the
https://elifesciences.org/articles/56404#video1 in vivo clonal stripes. To capture the effect of
external centripetal bias, (that could be the result
of, for example, chemical or mechanical cues),
once a cell replicates, the removed cell is drawn
randomly from a section that is facing the center of the tissue centered around the replicated cell
and has an angle a (Figure 1D). It is convenient to define the centripetal bias in this case to be
between zero and one, bias = 1-a/2p. As the bias increases, a centripetal pattern emerges
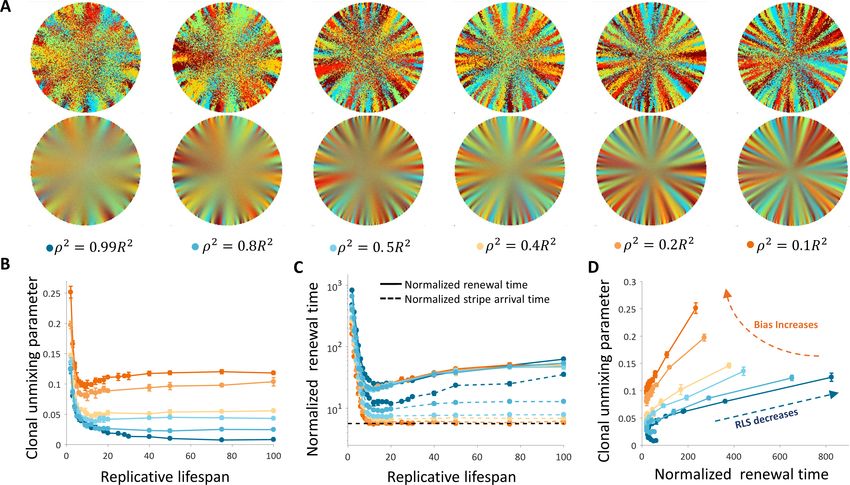
(Figure 3A, Video 2), and the required minimal RLS for renewal goes down (Figure 3B). To quantify
how much the pattern resembles stripes that elongate from the limbus to the center, we define a
clonal unmixing parameter that captures the centripetal stripe mixing (Appendix 1 section IV). When
the unmixing parameter is equal to one, the pattern is composed of perfect stripes. As the stripe
order is lower, the unmixing parameter approaches zero (Appendix 1 section IV).
When there is no bias, the minimal RLS is of the order of the radius of the tissue. In the case of
ideal bias, the minimal replicative lifespan required for full renewal, where m is much smaller than R,
is R/m (Appendix 1 section V). In our case, m is five cells which give a minimal RLS of about 20 repli-
cations (Fig, 3B, 3B-inlet). This result is interesting in light of previous literature that attributed very
limited replication capacity (RLS around 3–4) to short-lived P cells (Lobo et al., 2016;
Richardson et al., 2017; Lehrer et al., 1998). It imposes a minimal lifespan for progenitor cells that
scales as the radius of the tissue divided by the radius of the local neighborhood in which cells
interact.
The replicative lifespan also plays a role in determining the normalized renewal time that is
defined as the time it takes for all cells in the cornea to be replaced divided by the doubling time of
corneal cells. As the RLS increases, the renewal time decreases (Figure 3C). As the centripetal bias is
larger the renewal time is faster. In the case of ideal bias, the limit on the renewal time dynamics can
be captured as a one-step process with an average step size that depends on the interaction length,
m (Appendix 1 section V). The limit on the
renewal time is given by 2R/(m+1) (Figure 3C). In
our case, where the radius is about 100 cells, it
results in a renewal time of ~35 replications,
which amount to ~100 days assuming a 3-day cell
cycle (Lehrer et al., 1998; Sagga et al., 2018).
Spatial uncoupling of replication-
removal
Spatial coupling between cell replication and cell
removal has been demonstrated in skin cells, yet
another possibility is the case where replication
and removal are not tightly correlated in space.
Video 2. Coupled spatial correlations with bias, In this case, the replication and removal do not
RLS = 60. Adding local centripetal bias results in a have to be in the same neighborhood
pattern of centripetal stripes. (Figure 1D). First, we consider the case where
https://elifesciences.org/articles/56404#video2
Strinkovsky et al. eLife 2021;10:e56404. DOI: https://doi.org/10.7554/eLife.56404 5 of 28
Research article                                                             Computational and Systems Biology Physics of Living Systems

Figure 3. The effect of centripetal bias in the case of spatial coupling between cell replication and cell removal. (A) Steady-state snapshots (upper row)
and time-averages over 200 replications (lower row) for RLS = 60 and different centripetal bias. (B) The minimal RLS required for renewal as a function of
centripetal bias. Data points are the mean of three realizations, and error bars (some smaller than the marker size) are the standard deviation. In the
case of ideal bias, the minimal theoretical value for RLSmin (dotted horizontal line) is » R/m (where R is the radius of the cornea, and m is the local
replication-removal neighborhood). (B-inset) The lower limit on RLSmin as a function of the corneal radius when m = 5. The green dot marks the corneal
radius used for the simulations, R = 100. (C) The effect of centripetal bias (Different colors, match the colors on panel 3B) on the normalized renewal
time and clonal unmixing. As the bias increases, the corneal renewal time is shorter, and the pattern is more ordered. In the case of ideal bias, the
theoretical lower limit on renewal time (vertical dotted line) is 2R/(m+1).

                                     there is no inherent centripetal bias, that is, cell removal and replication events in the cornea are not
                                     biased toward the center. It was previously suggested that centripetal patterns can be formed even
                                     in the absence of centripetal bias (Lobo et al., 2016). We show here that this phenomenon is limited
                                     to a particular set of RLS and interaction lengths that are associated with slow corneal replenishment
                                     time and high post-mitotic rate.
                                         The emergent pattern, in this case, is inherently different. For low RLS values, a centripetal pat-
                                     tern is formed near the limbus edge. However, the unmixing is diminishing as the stripes are moving
                                     toward the center (Figure 4A and B, Video 3), similar to previous reports (Lobo et al., 2016). The
                                     unmixing is decaying toward the center of the tissue and the pattern becomes mixed akin of a ’salt
                                     and pepper’ noise. In this case, the disordered pattern does not form spatial neighborhoods as the
                                     coupled interaction case.
                                         The emergence of a centripetal pattern occurs only for small RLS values. As the replicative life-
                                     span is larger than a few replications, the emergent unmixing becomes more and more limited to

Strinkovsky et al. eLife 2021;10:e56404. DOI: https://doi.org/10.7554/eLife.56404                                                                 6 of 28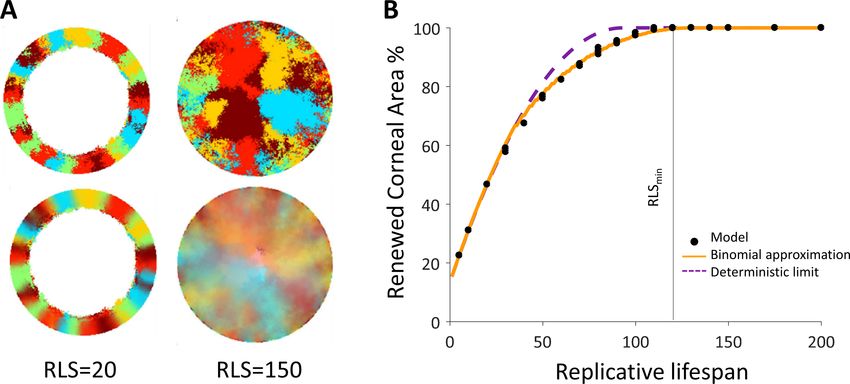
Research article                                                               Computational and Systems Biology Physics of Living Systems

Figure 4. Spatial uncoupling between cell replication and cell removal. (A) Steady-state snapshots (upper row) and time-averages over 200 corneal
replications (lower row) for different RLS values. (B) The clonal unmixing at different distances from the limbus. Ordered centripetal pattern emerges
mainly at the periphery of the tissue and only for low values of replicative lifespan (blue-lines, three realizations for each RLS value). (C) The renewal
time decreases exponentially with RLS for values that are lower than log2(R) » 7 (black line, three realizations are shown). The orange line is the
theoretical limit when considering renewal as a one-step stochastic process with radial boundary (see text and Appendix 1 section VI).

                                      the edges of the tissue. This is consistent with previous studies that assumed RLS of only a few repli-
                                      cations. For RLS that is larger than 10, unmixed order formation is very limited. In contrast, small RLS
                                      values result in a high post-mitotic rate (Figure 7B). Interestingly, while only very low RLS values
                                      allowed some organized stripe pattern, in these low RLS values, the vast majority of the cornea was
                                      occupied by post-mitotic P cells that continuously underwent centripetal movement as a conse-
                                      quence of divisions of limbal S and corneal peripheral P cells. Thus, this regime suggests no cell pro-
                                      liferation at the center of the cornea.
                                          Another ramification of short replicative lifespan is the number of replications needed to get to
                                      the center of the tissue (replication times) that also depends greatly on the RLS. When the capacity
                                      of the cells to replicate is low, RLS of only a few replications, the time that is required to get to the
                                      center in units of replication times is in the order of hundreds (Figure 4C). Thus, there is an inherent
                                      tradeoff between the renewal time and the centripetal order.

Strinkovsky et al. eLife 2021;10:e56404. DOI: https://doi.org/10.7554/eLife.56404                                                                     7 of 28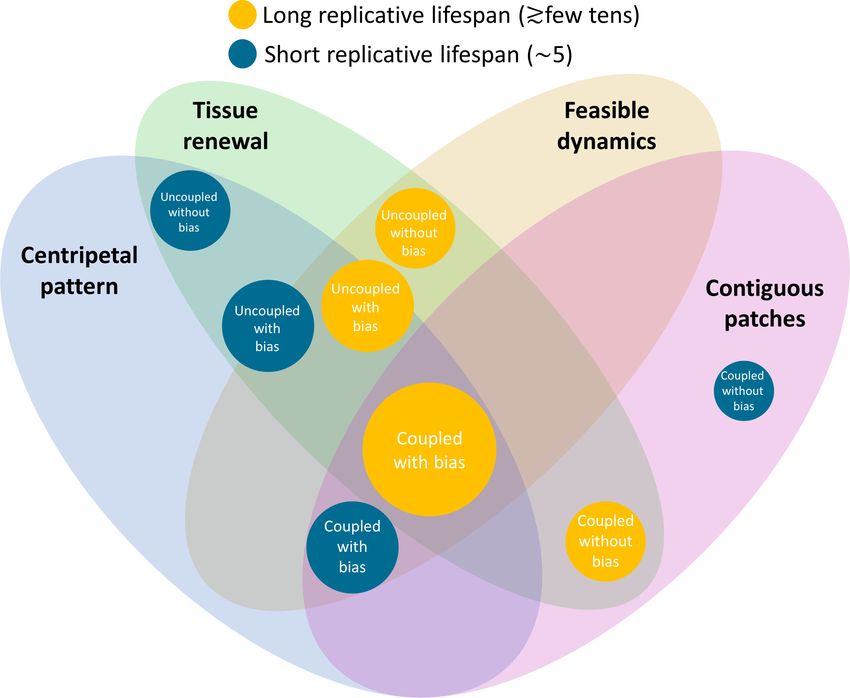
Research article                                                         Computational and Systems Biology Physics of Living Systems

                                                                                               It is insightful to estimate the limits on the
                                                                                            maximal and minimal renewal times in this case.
                                                                                            For the maximal time: in case the RLS is zero,
                                                                                            that is only the stem cells can replicate, the fast-
                                                                                            est renewal time is when there is a perfect bias
                                                                                            toward the center. In this case, the renewal time
                                                                                            is determined by the radius of the tissue, the
                                                                                            asymmetric replication rate of the stem cells and
                                                                                            the geometrical difference between the number
                                                                                            of cells that are replicating to the number of cells
                                                                                            that are pushed forward (Appendix 1 section VI).
                                    Video 3. Uncoupled spatial correlations with the
                                                                                            In terms of the number of corneal cells replica-
                                    absence of bias, RLS = 10. A centripetal pattern is
                                    formed near the limbus edge, and the order is
                                                                                            tions, twith bias ¼ lp =ð2ls  aÞ ðR þ 1Þ, which is
                                    diminished in the central cornea.                       about 600 corneal replication times in our case.
                                    https://elifesciences.org/articles/56404#video3         In the case there is no bias at all, the probability
                                                                                            to move toward the center is not one and
                                                                                            depends on the location of the front (Appendix
                                                                                            1 section VI). In this case, the renewal time is

                                    larger, tno bias ¼ lp =ðls  aÞ  HR  R, where HR is the Rth harmonic number. In the case the radius is
                                    100 cells, the replenish time increase by a factor of ~10 to ~6000 corneal replication times. As the
                                    replicative lifespan increases, additional corneal cells contribute to the propagation of the front.
                                    Thus, for small RLS the replenishing time is expected to decrease by the factor 2RLS , the number of
                                    cells that contribute to pushing front. This is consistent with the results of the simulated dynamics
                                    (Figure 4C). For the minimal time: In case of ideal bias and high RLS, in each corneal replication time
                                    the traced stripes double their length. Thus, the minimal time needed to renew the whole cornea is
                                    log2(R) which in our case is around 7.

                                    Adding centripetal bias to the uncoupled model
                                    In the previous section, we show that if cell replication and removal are not coupled in space, the
                                    emergent clonal stripe pattern is limited to the periphery and also requires very low RLS values that
                                    lead to post-mitosis of most P cells at the corneal periphery. For these values of low RLS, the
                                    renewal time is slow and requires hundreds of corneal replications. To study the effect of centripetal
                                    bias in this case, we keep the assumption that the location of replication and removal are indepen-
                                    dent, but the location of the removed cell is from a circle that is centered at the center and has a
                                    smaller radius (Figure 1D). This could result from, for example, localized high pressure in the center
                                    of the eye, or from blinking that affects more the cells in the center of the eye. We note that the
                                    area with high probability for cell removal does not have to be a circle, for example, blinking can
                                    cause a horizontal, elliptic, area of high removal probability (Ren and Wilson, 1996; Ren and Wil-
                                    son, 1997; Yamamoto et al., 2002). Here, we assume a circle to capture the qualitative tradeoffs of
                                    increasing the bias on the dynamics.
                                         As the bias increases, the overall clonal unmixing increases (Figure 5A and B, Video 4). Yet, the
                                    overall trend of mixing order in the central region from which cells are removed is bias independent.
                                    RLS smaller than ~5 provide high unmixing but results in slow renewal dynamics (Figure 5B), and still
                                    high post-mitotic rate (Figure 6B). The case of uncoupled replication-removal without bias can be
                                    approximated as a 1D model. In such a model, only cell numbers as a function of time are consid-
                                    ered and there are no spatial limitations (Moraki et al., 2019). Taking physiological parameters, this
                                    model yields homeostasis for RLS values of 4–12, which are comparable to the RLS range that pro-
                                    vides minimal renewal time without bias (Figure 5C). It is insightful to consider two types of time-
                                    scales: one is the time it takes for stripes to reach the center of the tissue, that is an important
                                    experimental observable, and the second is the overall renewal time which is the time that takes to
                                    fill the entire cornea (Figure 5B). These two timescales exhibit different dependencies on the replica-
                                    tive lifespan. As the RLS is larger, the time it takes a clone stripe to reach the center is increasing
                                    exponentially with RLS. For large values of RLS, as the bias is larger, the velocity of stripe progres-
                                    sion is larger. The limit on stripe speed can be estimated in the case of ideal bias, that is the
                                    removed cells are from the center of the tissue, and high replicative capacity, the minimal number of

Strinkovsky et al. eLife 2021;10:e56404. DOI: https://doi.org/10.7554/eLife.56404                                                        8 of 28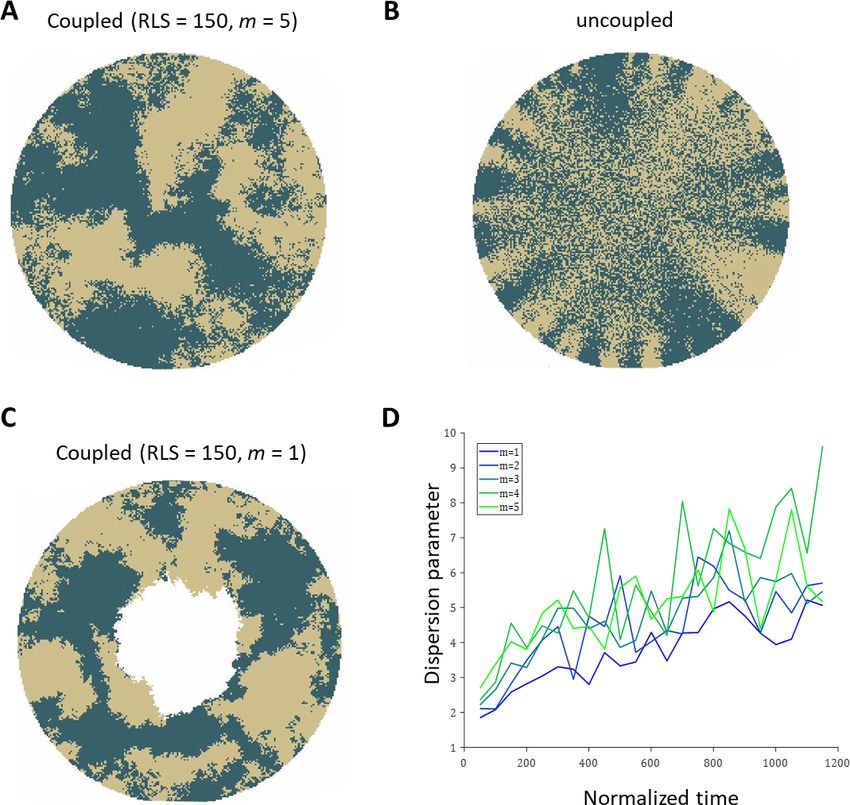
Research article                                                              Computational and Systems Biology Physics of Living Systems

Figure 5. Dynamics and patterns in the case where replication and removal are uncoupled. (A) Steady-state snapshots (upper row) and time-averages
(lower row) over 200 corneal replications for different values of , the radius of the area from which cells can be removed, for RLS = 10. (B) The
dependence of centripetal unmixing, halfway to the center, on replicative lifespan. Colors denote the centripetal bias and are the same as in 5A. Data
points are means of three realizations, and error bars are the standard deviation. For all values of RLS, the order decreases as RLS
increases. (C) Normalized renewal time decreases as RLS increases (solid lines). The black dotted line is the theoretical limit in the case of ideal bias and
high RLS. Data points are means of three realizations, and error bars are standard deviation. (D) The interplay between unmixing and renewal time for
different bias (different colors) and different RLS values ranging from 2 to 100. Data points are means of three realizations, and error bars are standard
deviation.

                                      replication needed for a stripe to reach the center is given by log2(R). (Appendix 1 section VI), where
                                      R is the radius of the tissue, which is around seven corneal replication times in the case R = 100. The
                                      renewal time of the entire tissue dynamics exhibits a non-monotonic behavior. For high RLS values,
                                                                                           the centripetal motion slows down the motion in
                                                                                           the direction which is orthogonal to the centripe-
                                                                                           tal direction and thus slows down the overall
                                                                                           renewal dynamics. The interplay between the
                                                                                           renewal time and unmixing is shown in
                                                                                           Figure 5C.

                                                                                                  Limits on the different models
                                                                                                  We have considered three main properties that
                                                                                                  affect the dynamics and pattern formation in the
                                                                                                  cornea: spatial correlation between replication
                                                                                                  and removal, inherent centripetal bias, and repli-
                                                                                                  cative lifespan of cells in the cornea. For different
                                      Video 4. Uncoupled spatial correlations with bias,          models, there were different constraints that
                                      RLS = 10. Adding centripetal bias increases the overall     determine their biological feasibility. Under con-
                                      clonal unmixing. Yet, the central region is less ordered.
                                                                                                  ditions of spatial coupling between cell
                                      https://elifesciences.org/articles/56404#video4

Strinkovsky et al. eLife 2021;10:e56404. DOI: https://doi.org/10.7554/eLife.56404                                                                    9 of 28
Research article                                                             Computational and Systems Biology Physics of Living Systems

Figure 6. Limits and constraints on the different model classes. (A) The unmixing parameter as a function of the normalized renewal time for different
values of replication lifespan, ranging from 2 to 100. The shaded areas are regions that are not consistent with experimental observations of centripetal
unmixing and renewal time. (B) The hallmark of low RLS models is a high post-mitotic fraction regardless of bias.

                                     replication and cell loss, external cue that imposes a bias of centripetal movement is required for the
                                     emergence of a centripetal pattern. Another major constraint is a requirement for a minimal value of
                                     RLS that allows renewal. This value depends on the replication bias and cannot be shorter than a life-
                                     span of ~20 replications. Once the condition for the minimal RLS is met, dynamics are feasible, and
                                     the emerged unmixing is higher than the unmixing of long-range interactions.
                                        Recent nucleotide analogue incorporation experiments suggest a progenitor cell cycle of 3–5
                                     days (Sagga et al., 2018), and complete renewal of the cornea occurs, in mice, in few months (Ami-
                                     tai-Lange et al., 2015). Thus, the normalized renewal time is in the order of 20–50 replication times,
                                     setting 100 replication times as a conservative upper limit (Figure 6A). In the case of uncoupled
                                     interactions without bias, centripetal unmixing formation is feasible under very specific constraints.
                                     Centripetal clonal unmixing emerges but mainly in the periphery of the tissue and only for small RLS
                                     values that are below ~10. However, for these RLS values, the renewal dynamics and stripe propaga-
                                     tion velocity, of a few hundred corneal replications are much slower than experimental observations
                                     (Figure 6A). Adding bias to these types of interactions allows formation in feasible time scales and
                                     the emergent of a centripetal pattern for slightly lower RLS values (Figure 6A).
                                        Another experimental observation is the fact that in some mutants that abolish centripetal bias,
                                     the resulting pattern is that of contiguous patches. Models of uncoupled interaction cannot provide
                                     such a pattern while coupled can. In the case of uncoupled interactions without bias, the resulting
                                     pattern would be akin to ’salt and pepper’ mixed pattern rather that of patches. Thus, only the cou-
                                     pled model can explain contagious patches in mutants with the constraint of RLS >20.
                                        Another outcome of low replicative lifespan is the distribution of post-mitotic cells. Figure 6B
                                     shows the fraction of post-mitotic cells as a function of the distance from the limbus. Models that
                                     require a low replicative lifespan, such as uncoupled replication-removal without bias, result in a
                                     complete post-mitosis of the central cornea. A scenario of post-mitotic central cornea is not consis-
                                     tent with in vivo data; nucleotide analogue labeling experiments suggest that some

Strinkovsky et al. eLife 2021;10:e56404. DOI: https://doi.org/10.7554/eLife.56404                                                                10 of 28
Research article Computational and Systems Biology Physics of Living Systems
(Richardson et al., 2017) or most of the cells in the central cornea are actively mitotic (Sagga et al.,
2018).
The effect of stem cells distribution and dynamics
There are two limiting common hypotheses for the properties of stem cells, and in particular limbal
stem cells, in their niche. In the previous section, we investigated the case where stem cells populate
all the limbal cells and can replace each other as they replicate. In this section, we also consider the
case in which stem cells are rare cells (~10%) (Sartaj et al., 2017) which divide asymmetrically to lim-
bal progenitor cells that in turn, divide into corneal cells. In this case, the stem cells cannot be
replaced by limbal progenitor cells. The interplay between the emergent pattern and the
Figure 7. The effect of stem cell dynamics and distribution. (A) Steady-state snapshots (upper row) and time-averages (lower row) over 200 corneal
replications for the Equipotent and Hierarchical models. The colors denote the different cases (blue, orange, and green) and are the same for all the
panels. (B) The interplay between clonal unmixing and renewal time for different bias and different RLS values in the case of the Hierarchical model. The
tradeoffs are similar to those of the Equipotent model (Figure 6A). (C) The number of limbal clones as a function of time in the case of the Equipotent
model (solid lines) and the Hierarchical model (dotted lines). While the number of limbal clones in the equipotent case diminishes with time, the
number of limbal clones in the hierarchical case approaches the number of limbal stem cells (red horizontal dotted line). In both models, the spatial
coupling does not affect the dynamics of clone number. (D) The number of corneal clones as a function of time in the case of the Equipotent model
(solid lines) and the Hierarchical model (dotted lines). In the hierarchical case, the dynamics of corneal clone number and limbal clone number are
similar (inset). In the equipotent case, the spatial coupling affects the decay rate of the number of clones. (E) The renewed cells’ front location as a
function scaled time. Time was scaled such that 1 is the time to replenish the cornea. The stripe propagation velocity depends on the spatial coupling
but is less sensitive to the stem cells distribution.
Strinkovsky et al. eLife 2021;10:e56404. DOI: https://doi.org/10.7554/eLife.56404 11 of 28Research article Computational and Systems Biology Physics of Living Systems
Figure 8. Constraints on the different models and their biological feasibility. Each circle represents a model with different spatial correlations between
cell replication and cell removal, high or low replicative lifespan, and whether there is a centripetal bias or not. The colors represent whether the
replicative lifespan is short or long (blue and orange, respectively). The radius of each circle is proportional to the number of properties each model is
consistent with. In the case of the cornea, the only model that can provide all four requirements (centripetal pattern, full tissue renewal, feasible time
scales, and contiguous patches observed in mutants) is coupled replication-removal with bias and long replicative lifespan.
dependence on replicative lifespan and replication-removal interaction length is similar to the case
of uniform progenitor cells (Figure 7A and B).
To highlight the differences between these two models, it is insightful to examine the number of
clones as a function of time both in the limbus and in the cornea. In the case of the Hierarchical
model, both the number of clones in the limbus and in the cornea goes down in a similar fashion
until it is equal to the number of stem cells. (Figure 7C). These dynamics are invariant to the interac-
tion length and to the degree of centripetal bias. In the case of the Equipotent model, the dynamics
of the number of clones in the limbus and in the cornea is different. In the limbus, there is a mono-
tonic decline in the number of clones. This decline is invariant to the interaction length due to the
continuous competition in the limbus. It is insightful to compare the Equipotent model to the neutral
drift clonal competition model in which the main predictions are that the number of clones declines
Strinkovsky et al. eLife 2021;10:e56404. DOI: https://doi.org/10.7554/eLife.56404 12 of 28Research article Computational and Systems Biology Physics of Living Systems
pffi pffi
as 1= t , the average clone size increases as t, and the distribution of clone size divided by the
average (n=) is time-invariant (Klein and Simons, 2011).
In the case of the Equipotent model, the dynamics of the limbal clone number and average limbal
clone size are monotonically increasing and monotonically decreasing, respectively. Yet, they do not
follow the neutral drift dynamics during the entire time trajectory (Appendix 1 section VIII, Appen-
dix 1—figure 5). However, the limbal clone size distribution does exhibit scale invariance (Appen-
dix 1—figure 5). The dynamics of the number of clones in the cornea has a bi-phasic shape that
does depend on the interaction length (Figure 7D). The first part of the bi-phasic dynamics is a
decline that is similar to the limbus decline and is due to stem cell competition. A plateau follows
this decline as clones are propagating toward the center. The second decline is due to the clonal
competition when all the tissue is labeled.
Another experimental observable is the location of the clonal front. The normalized front propa-
gation velocity is invariant to the stem cell dynamics (whether it is the Hierarchical or Equipotent
model) and depends mainly on the interaction length and bias (Figure 7E). Moreover, the front loca-
tion as a function of normalized time, suggests that the velocity in which the front propagates
depends on the radial location. A concave curve indicates that the front velocity accelerates as it is
closer to the center, while a convex curve suggests a slowdown (Appendix 1 section VII, Appen-
dix 1—figure 4). In the case there is a centripetal bias, the velocity of the front propagation is accel-
erating as they are moving away from the stem cell niche toward the center (Figure 7E,
Appendix 1—figure 4). This is similar to the dynamics in the intestinal crypts, where cells that are
higher on the crypt axis move faster (Tóth et al., 2017).
Discussion
The dynamics of corneal stem cells and their progenitors play a key role in maintaining homeostasis
in adult tissues. As the total number of cells in homeostasis remains constant, the main facilitators of
cell location and tissue rejuvenation, when the tissue is intact, are cell division and removal. Thus,
the spatial correlation between the locations of the replicated cell and the removed cell determines
the rejuvenation speed and clonal pattern of the tissue. These spatial correlations can arise from
mechanical or chemical interactions. The actual mechanical interaction is complex as it is affected by
many factors such as interactions with the matrix, interactions between cells, and the cornea’s geom-
etry. Moreover, these mechanical interactions can be long-ranged (e.g., in the elastic limit) or dic-
tated by local interactions. In this work, we accounted for two effective spatial correlations between
the location of the replicated and removed cells: a short-range interaction with a typical interaction
range of m cells (the ‘coupled’ model) and the limit of long-range interactions (the ‘uncoupled’
model).
Another feature that is critical in replication-removal dynamics is the replicative lifespan of the
progenitor cells. Here, we use a mathematical model together with analytical benchmarks to derive
the tradeoffs and constraints of varying replication-removal correlation length and replicative life-
span and characterize the conditions that are consistent with experimental measurements. Identifica-
tion of the conditions governing corneal cell dynamics will facilitate new approaches to limbal stem
cell deficiency treatments and translate to other cellular systems that are dependent on spatial cell
arrangement and division.
Spatial coupling of replication and removal dramatically influences the parameters that are
needed for tissue renewal in physiological time scales. Recent studies suggested that replication and
removal events in homeostasis happen in close proximity of a few cells (Mesa et al., 2018;
Miroshnikova et al., 2018). The main consequence of this type of ‘short-range’ interaction is that
they set a minimal replicative lifespan (Figure 3B). The limit for replicative lifespan is the ratio
between the radius of the cornea and the radius of the local neighborhood in which replication and
removal occur. For example, in the case of a cornea with a radius of ~100 cells and a local interaction
neighborhood with a radius of ~5 cells, the minimal replicative lifespan should be at least 20 replica-
tions. This limit is in the case of high bias, that is the cells are replicating toward the center of the tis-
sue. In practice, one should expect a higher limit (Figure 3B). This suggests that if cell replication
and cell removal are indeed spatially correlated, the replicative lifespan of progenitor cells should be
much higher than traditional values which are an order of only a few replications. Another limit is
imposed by the replication-removal interaction range, m. We showed that m dictates RLSmin
Strinkovsky et al. eLife 2021;10:e56404. DOI: https://doi.org/10.7554/eLife.56404 13 of 28Research article Computational and Systems Biology Physics of Living Systems
(Appendix 1 section V), and tissue renewal time (Figure 3C). As the interaction range is smaller, the
minimal RLS needed for a complete renewal of the cornea is higher and scale as R/m. For interaction
range that is of the order of the cornea radius, the minimal RLS scale as log2(m) (Appendix 1 section
V). That is, mechanical or chemical interactions that are local require a higher replication capacity of
corneal cells. The relation between the interaction range and cornea renewal time is monotonic,
t = 2R/(m+1) (Appendix 1 section V). Future work can account for a more complex spatial structure
of the correlations that capture more intricate mechanical interactions between the cells and the
tissue.
Another interesting consequence of these results is that increasing the tissue size (e.g. human
and large mammals cornea and large organs) requires increasing the replicative lifespan of progeni-
tor cells or increasing the local replication-removal interaction length. Cancer, aging or other hyper-
plastic conditions (e.g. psoriasis) are extreme examples of potentially extensive changes in
replicative lifespan that may lead to failure in maintaining tissue renewal and proper tissue size, lead-
ing to a burden on stem cells, failure to maintain homeostasis, and/or regenerate the tissue under
stress (Appendix 1 section IX).
In this context, it is insightful to consider the limits on mutation accumulation quantitatively
(Frank and Nowak, 2004; Vermeulen et al., 2013). Cancer in the cornea is relatively rare, and
when it occurs, it is believed to originate from the conjunctiva or the limbus (Basti and Macsai,
2003). The probability of mutation accumulation that results, for example, in cancer depends on the
probability of acquiring oncogenic (or other deleterious) mutations, the number of cells, and the
number of replications before the mutated linage is removed. In the cornea, the number of cells is
low compared to the number of cells in the skin or in the gut, for example (Milo et al., 2009). In
general, symmetric divisions promote cell exchange and can flush out mutations, and therefore the
Equipotent model is more resilient to mutations in the limbus (Appendix 1 section IX). Mutation
accumulation potential of a linage that originates from a mutator in the limbus depends on the lin-
age lifetime and depth. Centripetal bias decreases the depth of a linage, and the radius of the cor-
nea imposes a limit on the median depth (Appendix 1 section IX, Appendix 1—figure 6). The
typical linage depth, together with the small number of cells in the cornea, suggest a low probability
for an accumulation of a series of oncogenic mutations in comparison to other organs such as the
skin or the gut.
We also characterized the dynamics in the limit in which replication and removal events are not
spatially correlated. The case without any spatial consideration, such as bias and replication-removal
correlations, can be approximated by a 1D model. A model, which is a private case of our work, sug-
gested that physiological homeostasis requires RLS in the range of 4–12 replications (Moraki et al.,
2019). This estimate is consistent with our Equipotent uncoupled model in the absence of bias. A
2D uncoupled replication-removal without bias was suggested in the context of the cornea with a
replicative lifespan of fewer than about five replications (Lobo et al., 2016). Our results show that
while rejuvenation of the entire cornea is possible for short replicative lifespan, the rejuvenation time
without external bias is much slower than physiological estimations (Figure 6A). Thus, self-organizing
stripe formation in homeostasis without external cues, while possible, is very limited and results in a
rejuvenation time of hundreds of replications, that is, hundreds of days assuming corneal replication
time of a few days. Another hallmark of a model that has a short replicative lifespan is a cornea in
which most of the cells are post-mitotic (Figure 6B).
Figure 8 summarizes the predictions of each model and its consistency with experimental
data. We focused on four main experimental attributes: (1) Tissue renewal: whether the model allows
complete rejuvenation of all cells in homeostasis. (2) Feasible dynamics: Whether the speed of clonal
spread is physiological. (3) Centripetal pattern: Whether the model allows the formation of centripe-
tal clonal stripes. (4) Contiguous patches: Whether the model allows the formation of contiguous
clonal patches that is reminiscent of VNGL/PAX6 mutants. The model that seems to account for all
features is that of coupled replication-removal dynamics (‘short-range interactions’) with centripetal
bias and a replicative lifespan that is at least ~20 replications. One of the main predictions of such a
model is that cells should proliferate not only near the limbus but also closer to the center of the
cornea.
Our results regarding the interplay between replication-removal interaction length and replicative
lifespan do not depend on whether stem cell dynamics and distribution follow the ’Hierarchical’ or
’Equipotent’ model (Figure 7B). As expected, our results show that the number of clones overtime
Strinkovsky et al. eLife 2021;10:e56404. DOI: https://doi.org/10.7554/eLife.56404 14 of 28Research article Computational and Systems Biology Physics of Living Systems
on the limbus and cornea together could distinguish between the two. While in the ’Equipotent’
model, the number of clones in the cornea has a certain plateau and delay between the cornea and
the limbus while in the ’Hierarchical’ model there is no difference in the dynamics of the number of
clones in the limbus and in the cornea (Figure 7C; Figure 7D).
While stem cells, that are considered as long-lived cells that can self-renew, are at the focus of
regenerative medicine, progenitor cells, that are viewed as short-lived cells with a very limited repli-
cation potential, are often overlooked. Our work highlights the crucial role of replicative lifespan of
progenitor cells in shaping rejuvenation dynamics in homeostasis. Our conclusions regarding the
interplay between replication-removal locality and replicative lifespan are relevant for any tissue in
which conditions do not permit significant cell motility and thus spatial homeostasis is maintained
through cell replication.
Acknowledgements
We would like to thank Tanya Wasserman and Waseem Nasser for their critical input and construc-
tive comments. This work was supported by the American Federation for Aging Research, Israel Sci-
ence Foundation grants 1619/20, 1308/19, 2830/20, Rappaport Foundation, The Prince Center for
Neurodegenerative Disorders of the Brain #828931, and the National Institutes of Health R21
800040.
Additional information
Funding
Funder Grant reference number Author
American Federation for Aging New Investigators Awards in Yonatan Savir
Research Alzheimer’s Disease
Israel Science Foundation 1619/20 Yonatan Savir
Rappaport Foundation Ruby Shalom-Feuerstein
Yonatan Savir
Israel Science Foundation 1308/19 Ruby Shalom-Feuerstein
Israel Science Foundation 2830/20 Ruby Shalom-Feuerstein
The Prince Center for Neuro- 828931 Ruby Shalom-Feuerstein
degenerative Disorders of the Yonatan Savir
Brain
National Institutes of Health R21 800040 Ruby Shalom-Feuerstein
The funders had no role in study design, data collection and interpretation, or the
decision to submit the work for publication.
Author contributions
Lior Strinkovsky, Conceptualization, Data curation, Software, Formal analysis, Investigation, Visualiza-
tion, Methodology, Writing - original draft, Writing - review and editing; Evgeny Havkin, Software,
Formal analysis, Validation, Investigation, Visualization, Methodology, Writing - original draft, Writ-
ing - review and editing; Ruby Shalom-Feuerstein, Conceptualization, Methodology, Writing - review
and editing; Yonatan Savir, Conceptualization, Resources, Data curation, Software, Formal analysis,
Supervision, Funding acquisition, Validation, Investigation, Visualization, Methodology, Writing -
original draft, Project administration, Writing - review and editing
Author ORCIDs
Lior Strinkovsky https://orcid.org/0000-0002-0301-3515
Yonatan Savir https://orcid.org/0000-0002-5345-8491
Strinkovsky et al. eLife 2021;10:e56404. DOI: https://doi.org/10.7554/eLife.56404 15 of 28Research article Computational and Systems Biology Physics of Living Systems
Ethics
Animal experimentation: This study was performed in strict accordance with the ARVO Statement
for the Use of Animals in Ophthalmic and Vision Research. All experiments were approved by the
Technion ethical committee, reference #IL0980713.
Decision letter and Author response
Decision letter https://doi.org/10.7554/eLife.56404.sa1
Author response https://doi.org/10.7554/eLife.56404.sa2
Additional files
Supplementary files
. Transparent reporting form
Data availability
All data generated or analysed during this study are included in the manuscript and supporting files.
References
Amitai-Lange A, Altshuler A, Bubley J, Dbayat N, Tiosano B, Shalom-Feuerstein R. 2015. Lineage tracing of stem
and progenitor cells of the murine corneal epithelium. Stem Cells 33:230–239. DOI: https://doi.org/10.1002/
stem.1840, PMID: 25187087
Barton DL, Henkes S, Weijer CJ, Sknepnek R. 2017. Active vertex model for cell-resolution description of
epithelial tissue mechanics. PLOS Computational Biology 13:e1005569. DOI: https://doi.org/10.1371/journal.
pcbi.1005569, PMID: 28665934
Basti S, Macsai MS. 2003. Ocular surface squamous neoplasia: a review. Cornea 22:687–704. DOI: https://doi.
org/10.1097/00003226-200310000-00015, PMID: 14508267
Blanco-Mezquita T, Martinez-Garcia C, Proença R, Zieske JD, Bonini S, Lambiase A, Merayo-Lloves J. 2013.
Nerve growth factor promotes corneal epithelial migration by enhancing expression of matrix Metalloprotease-
9. Investigative Opthalmology & Visual Science 54:3880–3890. DOI: https://doi.org/10.1167/iovs.12-10816
Corominas-Murtra B, Scheele C, Kishi K, Ellenbroek SIJ, Simons BD, van Rheenen J, Hannezo E. 2020. Stem cell
lineage survival as a noisy competition for niche access. PNAS 117:16969–16975. DOI: https://doi.org/10.1073/
pnas.1921205117, PMID: 32611816
Cotsarelis G, Cheng SZ, Dong G, Sun TT, Lavker RM. 1989. Existence of slow-cycling limbal epithelial basal cells
that can be preferentially stimulated to proliferate: implications on epithelial stem cells. Cell 57:201–209.
DOI: https://doi.org/10.1016/0092-8674(89)90958-6, PMID: 2702690
Davanger M, Evensen A. 1971. Role of the pericorneal papillary structure in renewal of corneal epithelium.
Nature 229:560–561. DOI: https://doi.org/10.1038/229560a0, PMID: 4925352
Di Girolamo N, Bobba S, Raviraj V, Delic NC, Slapetova I, Nicovich PR, Halliday GM, Wakefield D, Whan R, Lyons
JG. 2015. Tracing the fate of limbal epithelial progenitor cells in the murine cornea. Stem Cells 33:157–169.
DOI: https://doi.org/10.1002/stem.1769, PMID: 24966117
Dorà NJ, Hill RE, Collinson JM, West JD. 2015. Lineage tracing in the adult mouse corneal epithelium supports
the limbal epithelial stem cell hypothesis with intermittent periods of stem cell quiescence. Stem Cell Research
15:665–677. DOI: https://doi.org/10.1016/j.scr.2015.10.016, PMID: 26554513
Doupé DP, Alcolea MP, Roshan A, Zhang G, Klein AM, Simons BD, Jones PH. 2012. A single progenitor
population switches behavior to maintain and repair esophageal epithelium. Science 337:1091–1093.
DOI: https://doi.org/10.1126/science.1218835, PMID: 22821983
Douvaras P, Mort RL, Edwards D, Ramaesh K, Dhillon B, Morley SD, Hill RE, West JD. 2013. Increased corneal
epithelial turnover contributes to abnormal homeostasis in the Pax6(+/-) mouse model of aniridia. PLOS ONE
8:e71117. DOI: https://doi.org/10.1371/journal.pone.0071117, PMID: 23967157
Dziasko MA, Daniels JT. 2016. Anatomical features and Cell-Cell interactions in the Human Limbal Epithelial
Stem Cell Niche. The Ocular Surface 14:322–330. DOI: https://doi.org/10.1016/j.jtos.2016.04.002,
PMID: 27151422
Findlay AS, Panzica DA, Walczysko P, Holt AB, Henderson DJ, West JD, Rajnicek AM, Collinson JM. 2016. The
core planar cell polarity gene, Vangl2, directs adult corneal epithelial cell alignment and migration. Royal
Society Open Science 3:160658. DOI: https://doi.org/10.1098/rsos.160658, PMID: 27853583
Frank SA, Nowak MA. 2004. Problems of somatic mutation and Cancer. BioEssays 26:291–299. DOI: https://doi.
org/10.1002/bies.20000, PMID: 14988930
Gao J, Raghunathan VK, Reid B, Wei D, Diaz RC, Russell P, Murphy CJ, Zhao M. 2015. Biomimetic stochastic
topography and electric fields synergistically enhance directional migration of corneal epithelial cells in a MMP-
Strinkovsky et al. eLife 2021;10:e56404. DOI: https://doi.org/10.7554/eLife.56404 16 of 28You can also read