Cannabinoid Combination Induces Cytoplasmic Vacuolation in MCF-7 Breast Cancer Cells - MDPI
←
→
Page content transcription
If your browser does not render page correctly, please read the page content below
molecules
Article
Cannabinoid Combination Induces Cytoplasmic
Vacuolation in MCF-7 Breast Cancer Cells
Recardia Schoeman, Natasha Beukes and Carminita Frost *
 Department of Biochemistry and Microbiology, Nelson Mandela University, P.O. Box 77000, Port Elizabeth 6031,
 South Africa; recardia23@outlook.com (R.S.); natasha.beukes@mandela.ac.za (N.B.)
 * Correspondence: carminita.frost@mandela.ac.za; Tel.: +2741-504-4123

 Academic Editor: Silvie Rimpelová

 Received: 15 September 2020; Accepted: 7 October 2020; Published: 14 October 2020

 Abstract: This study evaluated the synergistic anti-cancer potential of cannabinoid combinations
 across the MDA-MB-231 and MCF-7 human breast cancer cell lines. Cannabinoids were combined
 and their synergistic interactions were evaluated using median effect analysis. The most promising
 cannabinoid combination (C6) consisted of tetrahydrocannabinol, cannabigerol (CBG), cannabinol (CBN),
 and cannabidiol (CBD), and displayed favorable dose reduction indices and limited cytotoxicity against
 the non-cancerous breast cell line, MCF-10A. C6 exerted its effects in the MCF-7 cell line by inducing cell
 cycle arrest in the G2 phase, followed by the induction of apoptosis. Morphological observations indicated
 the induction of cytoplasmic vacuolation, with further investigation suggesting that the vacuole membrane
 was derived from the endoplasmic reticulum. In addition, lipid accumulation, increased lysosome size,
 and significant increases in the endoplasmic reticulum chaperone protein glucose-regulated protein
 78 (GRP78) expression were also observed. The selectivity and ability of cannabinoids to halt cancer
 cell proliferation via pathways resembling apoptosis, autophagy, and paraptosis shows promise for
 cannabinoid use in standardized breast cancer treatment.

 Keywords: breast cancer; cannabinoids; combination studies; anti-cancer; cytoplasmic vacuolation

1. Introduction
      Cannabis sativa L. has been used for centuries in the treatment of various ailments. One particular
group of compounds produced by this plant, the C21 terpenophenolics (referred to as cannabinoids),
are well known for their vast range of bioactivity [1,2]. There are several types of cannabinoids:
endocannabinoids; synthetically synthesized cannabinoids; and phytocannabinoids, which specifically
refer to the cannabinoids obtained from cannabis plants [3,4]. The most abundant and psychoactive
phytocannabinoid is ∆9 -tetrahydrocannabinol [1,5]. Other well-known phytocannabinoids include
cannabigerol (CBG), cannabinol (CBN), cannabidiol (CBD), cannabichromeme (CBC), and cannabicyclol
(CBL), amongst others [2]. Phytocannabinoids mimic endogenous cannabinoids by activating
cannabinoid receptors. Depending on the cell type, phytocannabinoids have been documented to
modulate cell proliferation, differentiation, and death [6,7]. These properties have gained traction in the
cancer field, since the activation of cannabinoid receptor can be exploited to influence several hallmarks
of tumor progression. The anti-cancer effects of phytocannabinoids have been observed in several
cancer types, including gliomas and carcinomas of the skin, liver, colon, prostate, and breast [8–12].
Breast cancer is particularly difficult to treat due to its heterogeneity [13]. Breast cancer cells are
heterogenous and are mainly classified by the expression of the hormone receptors (estrogen and
progesterone) and epidermal growth factor receptor 2 (HER2). Breast cancer cells that lack these
receptors are referred to as triple-negative breast cancer (TNBC). TNBCs are aggressive and notoriously
difficult to treat due to their lack of drug receptor targets. Studies have shown that phytocannabinoids

Molecules 2020, 25, 4682; doi:10.3390/molecules25204682                       www.mdpi.com/journal/molecules
Molecules 2020, 25, 4682                                                                                        2 of 21

are effective against various breast cancer subtypes as they induce cell cycle arrest and cell death via
pathways such as apoptosis and autophagy [14–17].
      Although conventional chemotherapeutic agents exist, patients often experience side-effects that
influence their quality of life [18,19]. In addition, cancers often acquire resistance mechanisms to
evade cell death pathways, rendering the chemotherapeutic agent obsolete [20,21]. Several studies
have evaluated the use of drug combinations to overcome these chemotherapy-associated problems.
Some advantages, including a reduction in the required dose [22,23], minimal potential to induce
toxicity in the host, a reduction in the cost associated with therapy [23], and the minimal risk of
developing drug resistance [24,25] have been associated with the various studies. Consequently,
this study aimed to investigate the potential use of cannabinoid combinations to amplify therapeutic
efficacy by simultaneously activating multiple anti-cancer mechanisms in breast cancer cell lines.
In addition, we identified the mechanism of action of a promising synergistic cannabinoid combination.

2. Results

2.1. Combination Studies
     Prior to evaluating the efficacy of cannabinoid combinations on breast cancer cells, the cytotoxicity
of the individual cannabinoids was determined. In addition to the IC50 values, the IC75 and IC90 values
were determined to evaluate if the cannabinoids would retain their selectivity for cancerous cells at
higher treatment concentrations (Table 1).

      Table 1. Inhibitory concentrations of ∆9 -tetrahydrocannabinol, cannabigerol (CBG), cannabinol (CBN),
      and cannabidiol (CBD) at the selected effect levels.

        Inhibitory                        MDA-MB-231                                     MCF-7
    Concentration (µM)        IC50           IC75           IC90           IC50           IC75           IC90
            THC            30.13 ± 3.94   30.57 ± 1.05   35.72 ± 2.32   40.14 ± 4.68   48.37 ± 3.86   58.55 ± 3.28
            CBG            28.40 ± 4.63   33.40 ± 6.34   39.34 ± 8.54   31.45 ± 2.28   37.85 ± 2.61   45.60 ± 3.30
            CBN            23.22 ± 2.62   28.22 ± 2.12   34.84 ± 4.40   28.19 ± 2.98   32.21 ± 3.92   36.84 ± 5.14
            CBD            13.82 ± 1.96   25.80 ± 1.40   49.20 ± 4.48   20.62 ± 1.66   28.12 ± 3.12   38.54 ± 5.68

     The IC values between cannabinoids were significant within a cell line (data not shown),
while no significance was observed between the two cell lines. Although not significant, the MD
Anderson-Metastatic Breast-231 (MDA-MB-231) triple negative breast cancer (TNBC) cells had a
higher susceptibility to the individual cannabinoid treatments when compared to the Michigan Cancer
Foundation-7 (MCF-7) breast cancer cells (ER+ , PR+ , and HER2+ ), as indicated by the inhibitory
concentrations (Table 1). Despite receptor expression being the main difference between the cell lines,
the order of cytotoxicity (IC50 ) of the cannabinoids remained the same in both the cell lines: CBD >
CBN > CBG > THC. The next step was to determine the effects of various cannabinoid combinations.
The IC50 values of the individual cannabinoids were used to combine the cannabinoids at equipotent
ratios at double their respective IC50 :IC50 concentrations (Table 2), as recommended by Chou [26].
     Despite the inhibitory concentrations of the individual cannabinoids being lower in the
MDA-MB-231 cell line, the inhibitory concentrations of the combinations of two cannabinoids were
generally lower in the MCF-7 cell line. It should be highlighted that the two combinations with
the lowest IC values in the MCF-7 cell line were combinations containing THC, while the opposite
was obtained in the MDA-MB-231 cell line. The determination of the combination index values
associated with the two-cannabinoid combinations highlighted that the majority of the combinations
were antagonistic across the two cell lines (Figure 1), with the exception of the THC:CBD combination,
which displayed a synergistic interaction in the MCF-7 cells at a 50% growth inhibition.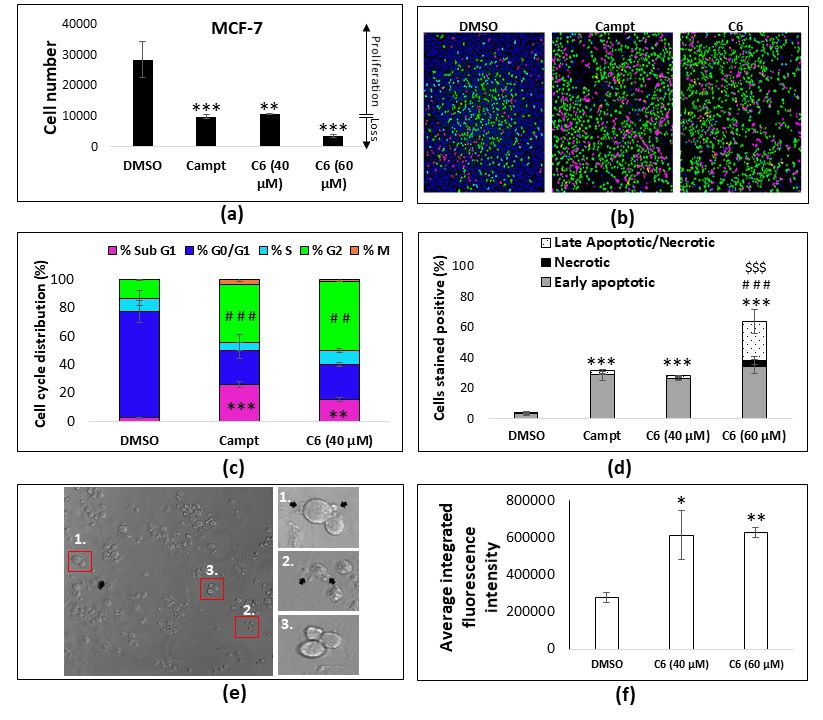
Molecules
Molecules 2020,
2020, 25,25, x FOR PEER REVIEW
4682 3 of
3 of 21 21
Despite the inhibitory concentrations of the individual cannabinoids being lower in the MDA-
MB-231 cell Table 2. Inhibitory
line, concentrations
the inhibitory of combinations
concentrations of the consisting of two of
combinations cannabinoids.
two cannabinoids were
generally lower in the MCF-7 cell line. It should
MDA-MB-231
be highlighted that the two combinations with the
MCF-7
Inhibitory Concentration
lowest
(µM) IC values in the MCF-7
of Combination cell line were
IC50 IC75
combinations
IC90
containing
IC50
THC, while
IC75
the opposite
IC90
was
obtained in the
THC and CBN
MDA-MB-231 cell line.
73.85 ± 9.52
The determination
89.04 ± 12.21 80.25 ± 14.65
of the combination
28.16 ± 1.95
index values
33.99 ± 1.70
associated
34.06 ± 8.71
with the
THCtwo-cannabinoid
and CBD combinations
52.12 ± 4.02 65.97highlighted
± 2.91 71.29 ±that
13.90the20.23
majority
± 1.17 of35.09
the± combinations
6.23 were
53.27 ± 14.79
CBG and CBN 40.29 ± 5.54 48.32 ± 6.65 65.41 ± 7.40 32.91 ± 6.68 50.56
antagonistic across the two cell lines (Figure 1), with the exception of the THC:CBD combination, ± 5.30 79.33 ± 1.05
CBG and CBD 31.88 ± 4.21 38.09 ± 5.26 45.59 ± 6.94 31.02 ± 4.16 48.59 ± 4.00 72.88 ± 3.88
whichCBNdisplayed
and CBDa synergistic
31.62 interaction
± 4.77 44.94in
± the
9.61 MCF-7
64.35 ±cells
17.80 at 31.22
a 50% growth
± 6.26 inhibition.
41.48 ± 5.27 55.44 ± 4.27
MDA-MB-231 MCF-7
3.5 3.5
50% 50%
Combination index (CI)
Combination index (CI)
3.0 3.0
2.5 Antagonism 2.5 Antagonism
2.0 2.0
1.5 1.5
1.0 Additive 1.0 Additive
0.5 Synergism 0.5 Synergism
0.0 0.0
TN TD GN GD ND TN TD GN GD ND
Combination Combination
(a) (b)
3.5 3.5
75% 75%
Combination index (CI)
Combination index (CI)
3.0 3.0
2.5 2.5
2.0 2.0
1.5 1.5
1.0 1.0
0.5 0.5
0.0 0.0
TN TD GN GD ND TN TD GN GD ND
Combination Combination
(c) (d)
3.5 3.5
90%
Combination index (CI)
90%
Combination index (CI)
3.0 3.0
2.5 2.5
2.0 2.0
1.5 1.5
1.0 1.0
0.5 0.5
0.0 0.0
TN TD GN GD ND TN TD GN GD ND
Combination Combination
(e) (f)
Figure 1. Combination index (CI) values were calculated for the respective two-cannabinoid
Figure 1. Combination
combinations determined in index (CI) values(a,c,e)
the MDA-MB-231 wereandcalculated for the
MCF-7 (b,d,f) respective
cell lines at 50% two-cannabinoid
(a,b), 75% (c,d),
combinations determined in the MDA-MB-231 (a,c,e) and MCF-7 (b,d,f)
and 90% (e,f). CI signifies the combination index at 50%, 75%, and 90% inhibition of cell lines
the at
cell50% (a,b), 75%
population,
(c,d), and 90% (e,f). CI signifies the combination index at 50%, 75%, and 90%
where CI = [1/Dx)1] + [2/Dx)2], where Dx = Dm[fa/(1-fa)]1/m. A CI < 1 indicates synergism, CI inhibition of the
= cell
1
population,
indicates where CI
an additive effect, and CI+>[2/Dx)2],
= [1/Dx)1] where
1 indicates Dx = Dm[fa/(1-fa)]1/m.
antagonism. T, THC; G, CBG;A CIN, < 1CBN;
indicates synergism,
D, CBD.
CI = 1 indicates an additive effect, and CI > 1 indicates antagonism. T, THC; G, CBG; N, CBN; D, CBD.
Screening four-cannabinoid combinations (Figure 2) yielded highly cytotoxic growth inhibition
Screening
percentages four-cannabinoid
ranging combinations
between 94% and (Figure
100% across 2) yielded
both cell lines. highly cytotoxic growth inhibition
percentages ranging between 94% and 100% across both cell lines.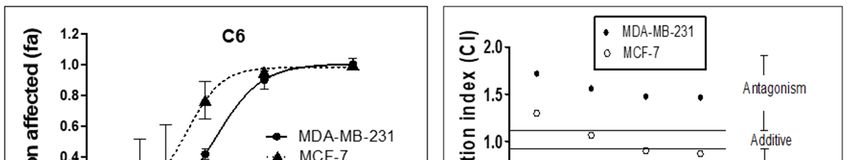
Molecules 2020,25,
Molecules        25, x FOR PEER REVIEW                                                                                   4 of2121
          2020, 25, 4682
Molecules 2020,     x FOR PEER REVIEW                                                                                  44 of
                                                                                                                          of 21

       Figure 2.Screening
                   Screening ofcombinations
                                   combinations consistingofoffour  four cannabinoids.Percentage
                                                                                          Percentage growthinhibition
                                                                                                               inhibition
     Figure
     Figure 2. 2. Screening ofof combinations consisting
                                                    consisting of four cannabinoids.
                                                                        cannabinoids. Percentage growth
                                                                                                      growth inhibition
       induced
     induced      by various    ratios   of four-cannabinoid     combinations   against  the   (a) MDA-MB-231     and (b)
     induced by  byvarious
                    variousratios
                              ratiosof of
                                       four-cannabinoid
                                           four-cannabinoid combinations  against
                                                                combinations      the (a)
                                                                              against     MDA-MB-231
                                                                                        the               and (b)and
                                                                                             (a) MDA-MB-231       MCF-7
                                                                                                                     (b)
       MCF-7 breastcell
     breast
     MCF-7cancer
                        cancer
                           lines.
               breast cancer    cell***  p < 0.0001
                                  cell lines.
                                      lines.
                                               *** p < 0.0001 to
                                              *** p < relative
                                                               relative to 0.5% dimethyl
                                                                  0.5% to
                                                       0.0001 relative  dimethyl  sulfoxide
                                                                          0.5% dimethyl
                                                                                              sulfoxide (DMSO)
                                                                                                (DMSO)(DMSO)
                                                                                            sulfoxide
                                                                                                                  vehicle
                                                                                                         vehicle control
                                                                                                                 vehicle
       control
     and        p < 0.001
            ### and  ### p
Molecules 2020, 25, 4682 5 of 21
Molecules
Molecules 2020,
2020, 25,
25, xx FOR
FOR PEER
PEER REVIEW
REVIEW 55 of
of 21
21
Figure
Figure 4. 4. Evaluating
Evaluating the
the efficacy
efficacy of
of C6
C6 across
across twotwo breast
breast cancer
cancer cell lines. (a)
celllines. (a) Dose
Dose response
response curves
curves of
of
C6 in the
C6 ininthe MDA-MB-231
MDA-MB-231
the MDA-MB-231 and
andand MCF-7
MCF-7 cell
cell lines,
MCF-7 lines,
cell (b) (b)
CI value
lines, CI value
(b) CIofvalue of C6
C6 determined determined at
at the selected
of C6 determined the selected
percentages
at the selected
percentages
of of
of growth
growth inhibition
percentages in inhibition
growth the in
in the
MDA-MB-231
inhibition the MDA-MB-231
and MCF-7 cell
MDA-MB-231 and
and MCF-7
MCF-7 cell
lines. cell lines.
lines.
The IC
The ICvalues
IC values
valuesof of
the C6 cannabinoid
of the
the C6 combination
C6 cannabinoid
cannabinoid were compared
combination
combination were against the
were compared
compared IC values
against
against the generated
the IC
IC values
values
by the individual
generated by the cannabinoids
individual (Figure 5).
cannabinoids (Figure
generated by the individual cannabinoids (Figure 5). 5).
Figure
Figure 5.5. Comparison
Comparison of
Comparison of the
of the concentration
the concentration of
concentration of each
of each cannabinoid,
each cannabinoid, individually
cannabinoid, individually and
individually and in
and in combination,
combination,
combination,
required to induce a (a,d) 50%, (b,e) 75%, and (c,f) 90% growth inhibition in
required to induce a (a,d) 50%, (b,e) 75%, and (c,f) 90% growth inhibition in the (a–c) MDA-MB-231 the (a–c) MDA-MB-231
and
and (d–f)
(d–f) MCF-7
MCF-7 cell lines. ** pp<
lines.
celllines.Molecules 2020, 25, 4682 6 of 21
Molecules 2020, 25, x FOR PEER REVIEW 6 of 21
Figure 6.
Figure 6. Screening
Screening ofof C6
C6 in
in the
the non-cancerous
non-cancerous breast cell line,
breast cell line, MCF-10A,
MCF-10A, toto evaluate its selectivity
evaluate its for
selectivity for
breast cancer cells. ** p < 0.01. Camptothecin (5.74 µM) was used as a positive control to induce
breast cancer cells. ** p < 0.01. Camptothecin (5.74 µM) was used as a positive control to induce growthgrowth
inhibition. Campt,
inhibition. Campt, camptothecin.
camptothecin.
Mechanism studies were to be completed with the C6 cannabinoid combination in the cell line,
which displayed
displayedaasynergistic
synergisticinteraction;
interaction;however,
however, thethe
synergism
synergism observed was not
observed waspromising, since
not promising,
the C6the
since combination
C6 combinationonly only
yielded a synergistic
yielded interaction
a synergistic at a at
interaction very specific
a very effect
specific level,
effect rather
level, than
rather at
than
multiple
at multipleeffect
effectlevels.
levels.Alternatively,
Alternatively, mechanism
mechanismstudies
studieswere
werecompleted
completedfor for C6,
C6, based
based on
on the
induction of morphological
morphological changes
changes inin the
the MCF-7
MCF-7 cell
cell line
line (Section
(Section 2.4).
2.4).
2.3. Cell Cycle Arrest and Apoptosis
When evaluating the MCF-7 cell number at 40 and 60 µM µM (the total
total concentration
concentration of all the
cannabinoids
cannabinoids comprising
comprisingthe theC6C6combination)
combination)(Figure
(Figure 7a), thethe
7a), cellcell
number after
number 40 µM
after of treatment
40 µM did
of treatment
not
did deviate from from
not deviate the 10,000 cells that
the 10,000 were
cells thatinitially seeded, seeded,
were initially indicating that the C6
indicating thatinduced
the C6ainduced
cytostatica
effect. At effect.
cytostatic a concentration of 60 µMofof60C6,
At a concentration µMthe cellthe
of C6, number decreased
cell number belowbelow
decreased the initial 10,00010,000
the initial cells
seeded, indicating
cells seeded, the induction
indicating the inductionof aofcytotoxic
a cytotoxiceffect at at
effect higher
higher concentrations.
concentrations.The Thecytostatic
cytostatic and
cytotoxic effects were further analyzed
further analyzed through cell cycle analysis,
cycle analysis, and the induction
induction ofof apoptosis
apoptosis
through quantifying the translocation
translocation of of phosphatidylserine.
phosphatidylserine. Cannabinoids are known to induce cell
cycle arrest at
at both the GG00/G
both the /G11 and
and GG22/M
/M checkpoints
checkpoints [27–29]. Previous
Previous studies have utilized flow
cytometry to analyze cell cycle arrest; however, this technique technique cannot distinguish between cell cycle
arrest in the GG22 and M phase, while in this study an image-based assay was employed, allowing the
distinction between the G22 and and M M phases
phases (Figure
(Figure 7b,c).
The cell cycle phase distribution in the MCF-7 cells showed a significant increase (p < 0.01) in the
G2 phase, with a shift from 13% in the DMSO vehicle control to 48% in cells treated with 40 µM of
C6 (Figure 7c). In addition, there were significant increases (p < 0.01) in the percentage of cells in the
Sub-G1 phase, indicative of apoptotic cells. Cells were stained with Annexin V, which specifically binds
to phosphatidylserine that translocate from the inner to the outer leaflet of the cell membrane when
apoptosis is initiated. Cells were simultaneously stained with propidium iodide, an impermeable
DNA dye that only stains positive if the cell membrane integrity is disrupted. Although treating the
MCF-7 cells with 40 µM of C6 did not result in a loss of cell number, indicating cell death (Figure 7a),
the evaluation of phosphatidylserine translocation indicated that at least 28% of the cells were in the
early phase of apoptosis (Figure 7d). At the higher concentration of 60 µM, the cytotoxic effects of C6
were enhanced, producing a significant increase in the late apoptotic phase. A total of 60% of the cell
population underwent apoptosis in both the early and late phases, whereas the percentage of cells that
stained positive for propidium iodide only (necrotic) were limited. After treatment, the MCF-7 cells
also underwent morphological changes associated with the induction of apoptosis, such as membrane
blebbing, cell shrinkage (Figure 7e), and the condensation of the nucleus. When staining the nucleus
with a fluorescent stain, the average integrated fluorescence intensity increases when the nuclearMolecules 2020, 25, 4682 7 of 21
material is condensed [30]. This was observed after the Hoechst 33,342 staining of the MCF-7 nuclei
(Figure 7f), further
Molecules 2020, 25, x FORsupporting the induction of apoptosis.
PEER REVIEW 7 of 21
Figure 7. Mechanism of action through which C6 induces its anti-proliferative action. (a) Cell
Figure 7. Mechanism of action through which C6 induces its anti-proliferative action. (a) Cell number
number determination in the MCF-7 cell after treatment at two concentrations, using the Hoechst
determination in the MCF-7 cell after treatment at two concentrations, using the Hoechst 33,342
33,342 staining and image acquisition method. ** p < 0.01, *** p < 0.001 relative to DMSO vehicle
staining and image acquisition method. ** p < 0.01, *** p < 0.001 relative to DMSO vehicle control. (b)
control. (b) Representative images acquired during cell cycle analysis, where each color represents
Representative images acquired during cell cycle analysis, where each color represents the phase of
the phase of the cell cycle assigned to the specific cell based on the intensity of the Hoechst 33,342
the cell cycle assigned to the specific cell based on the intensity of the Hoechst 33,342 staining. (c)
staining. (c) Quantitative analysis of the percentage of the cell population in each phase of the cell
Quantitative analysis of the percentage of the cell population in each phase of the cell cycle.
cycle. Camptothecin (5.74 µM) was used as a positive control for cell cycle arrest in the G2 phase.
Camptothecin (5.74 µM) was used as a positive control for cell cycle arrest in the G2 phase. ** p < 0.01,
** p < 0.01, *** p < 0.001 relative to the DMSO vehicle control of % Sub G1; ## p < 0.01, ### p < 0.001
*** p < 0.001 relative to the DMSO vehicle control of % Sub G1; ## p < 0.01, ### p < 0.001 relative to
relative to DMSO vehicle control of %G2 using a one-way ANOVA with post hoc Tukey test (n = 3).
DMSO vehicle control of %G2 using a one-way ANOVA with post hoc Tukey test (n = 3). (d)
(d) Quantitative analysis of the cell population undergoing apoptosis or necrosis. *** p < 0.001 relative
Quantitative analysis of the cell population undergoing apoptosis or necrosis. *** p < 0.001 relative to
to the % of early apoptotic cells of DMSO vehicle control; ### p < 0.001 relative to the % of necrotic
the % of early apoptotic cells of DMSO vehicle control; ### p < 0.001 relative to the % of necrotic cells
cells of DMSO vehicle control and $$$ p < 0.001 relative to the % of late apoptotic cells of the DMSO
of DMSO vehicle control and $$$ p < 0.001 relative to the % of late apoptotic cells of the DMSO vehicle
vehicle control using a one-way ANOVA with a post hoc Tukey test (n = 3). (e) Morphological changes
control using a one-way ANOVA with a post hoc Tukey test (n = 3). (e) Morphological changes
induced by C6 showing membrane blebbing (black arrows) and cell shrinkage. (f) Quantification of the
induced by C6 showing membrane blebbing (black arrows) and cell shrinkage. (f) Quantification of
average integrated nuclear fluorescence intensity. * p < 0.05, ** p < 0.01, relative to the DMSO vehicle
the average integrated nuclear fluorescence intensity. * p < 0.05, ** p < 0.01, relative to the DMSO
control. Campt, camptothecin.
vehicle control. Campt, camptothecin.
2.4. Lipid Droplet Accumulation
The cell cycle phase distribution in the MCF-7 cells showed a significant increase (p < 0.01) in the
The morphological changes observed in the MCF-7 cells treated with C6 showed the presence
G2 phase, with a shift from 13% in the DMSO vehicle control to 48% in cells treated with 40 µM of C6
of spherical structures resembling lipid droplets (Figure 8a). A previous study reported that,
(Figure 7c). In addition, there were significant increases (p < 0.01) in the percentage of cells in the Sub-
after epithelial-mesenchymal transition, breast cancer cells can be terminally differentiated into
G1 phase, indicative of apoptotic cells. Cells were stained with Annexin V, which specifically binds
to phosphatidylserine that translocate from the inner to the outer leaflet of the cell membrane when
apoptosis is initiated. Cells were simultaneously stained with propidium iodide, an impermeable
DNA dye that only stains positive if the cell membrane integrity is disrupted. Although treating the
MCF-7 cells with 40 µM of C6 did not result in a loss of cell number, indicating cell death (Figure 7a),
the evaluation of phosphatidylserine translocation indicated that at least 28% of the cells were in the7 nuclei (Figure 7f), further supporting the induction of apoptosis.
2.4. Lipid Droplet Accumulation
The morphological changes observed in the MCF-7 cells treated with C6 showed the presence of
Molecules 2020, 25, 4682 8 of 21
spherical structures resembling lipid droplets (Figure 8a). A previous study reported that, after
epithelial-mesenchymal transition, breast cancer cells can be terminally differentiated into adipocytes
adipocytes
when when with
co-treated co-treated with a peroxisome
a peroxisome proliferator-activated
proliferator-activated receptor (PPARγ)
receptor gamma gamma (PPARγ)agonist
agonist (rosiglitazone)
(rosiglitazone) and mitogen-activated
and mitogen-activated proteinkinase
protein kinase kinase(MEK)
kinaseinhibitor
(MEK) inhibitor (trametinib)
(trametinib) [31].
[31]. Studies
Studies specifically
specifically investigating
investigating the phytocannabinoids
the phytocannabinoids used inused
thisinstudy
this study
havehave reported
reported the the activation
activation of
of PPARγ
PPARγ by by
THC THC [32],
[32], CBG CBG
[33],[33],
andand CBDCBD[32].[32]. In addition,
In addition, CBNCBN [34,35][34,35] and THC
and THC [36] inhibit
[36] inhibit the MEK the
pathway.
MEK pathway.Therefore, a combination
Therefore, a combinationlike C6,
likecomprising THC,THC,
C6, comprising CBG,CBG,CBN,CBN,
and CBD, theoretically
and CBD, had
theoretically
hadpotential
the the potential to induce
to induce the differentiation
the differentiation of breast
of breast cancercancer
cells cells into adipocytes.
into adipocytes. MCF-7MCF-7 cells
cells were
therefore stained
were therefore with with
stained a neutral lipidlipid
a neutral stain (Figure
stain 8b).8b).
(Figure The Theresults
resultsindicated
indicatedthat
thatthere
therewas
was an an
accumulation
accumulation of of neutral
neutral lipids
lipids in
in the
the treated
treated cells;
cells; however,
however, thethe initial
initial structures believed
believed toto be
be lipid
lipid
droplets
droplets remained
remained unstained.
unstained. ItIt was
was therefore
therefore hypothesized
hypothesized that that these
these spherical
spherical structures
structures could
could bebe
cytoplasmic
cytoplasmic vacuoles, induced by processes such as autophagy and paraptosis.
Figure
Figure 8. Evaluating
Evaluating lipid
lipid droplet
droplet accumulation
accumulation inin the MCF-7 cell line. (a) Morphological
Morphological changes
changes
induced
induced by by C6C6observed
observedwithwith phase
phase contrast
contrast micrographs;
micrographs; whitewhite arrows
arrows indicate
indicate structures
structures of
of interest.
interest. (b) Typical micrographs obtained for MCF-7 cells stained
(b) Typical micrographs obtained for MCF-7 cells stained with HCS LipidTOX with HCSTM LipidTOX TM Green
Green neutral lipid
neutral lipid
stain after stain after
treatment treatment
with C6. with C6.
2.5. Autophagy
2.5. Autophagy and
and Paraptosis
Paraptosis
Consequently, the
Consequently, the induction
induction ofof autophagy
autophagy waswas indirectly
indirectly evaluated
evaluated through
through staining
staining with
with
LysoTracker TM Green to visualize acidic organelles—e.g., late autophagic vesicles (Figure 9a).
LysoTracker Green to visualize acidic organelles—e.g., late autophagic vesicles (Figure 9a). The
TM
The DMSO
DMSO vehicle
vehicle control
control displayed
displayed several
several lysosomes
lysosomes with
with a asimilar
similarsize
sizethat
that were
were distributed
distributed
throughout the cell. The MCF-7 cells treated with C6 displayed fewer lysosomes; however, they were
larger in size and located close to the nucleus of the cell.
A study by Shrivastava et al. [17] showed that CBD coordinates a cross-talk between apoptosis
and autophagy. The study indicated that one link between the two pathways was the induction
of endoplasmic reticulum stress, therefore, the GRP78 protein expression levels were quantified
(Figure 9b). There was a significant increase in the relative GRP78 protein levels in MCF-7 cells treated
with 40 µM of C6, indicating that endoplasmic reticulum stress may be a possible link for the induction
of both apoptosis and autophagy.
Since cytoplasmic vacuolation can be induced by both autophagy and paraptosis, the markers of
paraptosis were also assessed. Endoplasmic reticulum staining indicated an increase in fluorescence
surrounding the vacuole membrane, indicative of the vacuole membrane being derived from the
endoplasmic reticulum membrane (Figure 9c). In addition, the mitochondrial staining showed changes
in the mitochondrial structure from a fibrous to a rounded morphology, associated with mitochondrial
dilation. Nuclear fragmentation, a common marker of apoptosis, was also evident in the confocalthroughout the cell. The MCF-7 cells treated with C6 displayed fewer lysosomes; however, they were
larger in size and located close to the nucleus of the cell.
A study by Shrivastava et al. [17] showed that CBD coordinates a cross-talk between apoptosis
and autophagy. The study indicated that one link between the two pathways was the induction
Molecules 2020, 25, 4682
of
9 of 21
endoplasmic reticulum stress, therefore, the GRP78 protein expression levels were quantified (Figure
9b). There was a significant increase in the relative GRP78 protein levels in MCF-7 cells treated with
images
40 µM ofofC6,MCF-7 cells treated
indicating with 60 µMreticulum
that endoplasmic of C6 (Figure
stress9d).
mayTherefore, markers
be a possible ofthe
link for both cell death
induction of
pathways, apoptosis and
both apoptosis and autophagy. paraptosis, were evident.
Evaluation
Figure 9. Evaluation of of
thethe MCF-7
MCF-7 organelle
organelle structures
structures andand
GRP78GRP78 protein
protein expression.
expression. (a)
(a) Representative micrographs TM for lysosomes, (b) Western
Representative micrographs of of MCF-7
MCF-7 cellsstained
cells stainedwith
withLysotracker
LysotrackerTM for lysosomes, (b) Western
blot analysis representing the relative protein expression levels of GRP78 in MCF-7 cells treated with
C6 (40 µM) representative membrane showing band intensities, * p <
µM) and representative < 0.05 relative to the DMSO
vehicle control.
control. Representative
Representativemicrographs
micrographs ofofMCF-7
MCF-7vehicle control
vehicle andand
control C6-treated cells cells
C6-treated stained with
stained
(c) ER(c)
Tracker TM to visualize the endoplasmic reticulum membrane and (d) CytoPainter TM to visualize
with ER Tracker TM to visualize the endoplasmic reticulum membrane and (d) CytoPainter TM to
the mitochondria.
visualize the mitochondria.
3. Discussion
Since cytoplasmic vacuolation can be induced by both autophagy and paraptosis, the markers
of paraptosis were also
The heterogeneity assessed.
within Endoplasmic
breast cancers reticulum
has raised severalstaining indicated an increase
calls for patient-specific treatmentsin
fluorescence surrounding
to improve prognosis the vacuole
[37]. membrane, indicative
The MDA-MB-231 and MCF-7 of the
cellvacuole membrane
lines differ being
in their derived
phenotypic
from the endoplasmic
and genotypic reticulum
levels. The membrane include
major differences (Figure the
9c).expression
In addition, the hormone
of the mitochondrial staining
(estrogen and
showed changes
progesterone) in the mitochondrial
receptors and the HER2 structure from
receptor a fibrous
by the MCF-7 to cells,
a rounded
whilemorphology,
the MDA-MB-231associated
cell
with
line ismitochondrial
representativedilation. Nuclear fragmentation,
of triple-negative breast cancera common
[38]. THC marker of apoptosis,
has been reportedwas also evident
to suppress the
ERα-mediated proliferation of MCF-7 cells via the upregulation of the ERβ repressor [39,40]. This could
explain why the two cannabinoid combinations containing THC had the lowest IC values amongst
the combinations tested (Table 2). In addition, the binding of cannabinoids to the CB2 receptor
disrupts the HER2/CB2 heterodimer formation, inhibiting proliferation via the PI3K/Akt pathway [41].
Since the C6 combination comprises four cannabinoids that can all bind to the CB2 receptor [42],Molecules 2020, 25, 4682 10 of 21
their anti-proliferative effects in the MCF-7 cells would be amplified when cannabinoids are combined.
The use of cannabinoid combinations to simultaneously target the multiple receptors expressed by the
MCF-7 cell line that are lacking in the MDA-MB-231 cell line could possibly explain the lower inhibitory
concentrations observed for the cannabinoid combinations (Table 2) and why the dose reduction was
more significant in the MCF-7 cell line (Figure 5). Therefore, this study provided evidence for the
potential of cannabinoid combinations to be tailored to the molecular targets uniquely expressed within
the patient’s tumor, improving the treatment efficacy and prognosis.
It could be hypothesized that the spherical structures observed (Figure 8a) were vesicles derived
from the cell membrane in the form of endosome-associated clathrin-coated buds (approximately 60 nm
in diameter) or plasma membrane-derived clathrin-coated vesicles (approximately 100 nm in
diameter) [43]. Clathrin-coated pits generally occupy 1% to 2% of the cell surface area, range between
60 and 100 nm in diameter, and have an estimated lifetime of 1 to 2 min [43,44]. Clathrin-independent
plasma membrane invaginations also exist and are referred to as caveolae [45]. Caveolae are enriched in
lipid rafts of cholesterol and sphingolipids such as ceramide, which are neutral lipids [46]. The spherical
structures observed in this study occupied more than 2% of the cell surface and were larger than
100 nm (Figure 8a). During the imaging of the MCF-7 cells, no membrane dynamics were visible,
and the spherical structures remained the same size, indicating that the structures observed had a
lifetime exceeding 2 min. Since caveolae contain neutral lipids, an increased fluorescence intensity
should be evident within the membrane of the spherical structure when staining with LipidToxTM if
these structures were derived from the cell membrane in the form of caveolae; however, this was not
observed (Figure 8b). In addition, an increased fluorescence intensity was observed when staining
with ER-trackerTM (Figure 9c), indicating that the membrane of the spherical structure was derived
from the endoplasmic reticulum rather than from the cell membrane. This suggests that it is unlikely
that the spherical structures observed in this investigation could be derived from the cell membrane.
However, to certainly exclude this possibility future studies could evaluate the localization of clathrin
(for clathrin-dependent structures) and caveolin (for clathrin-independent caveolae) in relation to the
spherical structures. The anti-proliferative effects of cannabinoids are well-documented [12,14,47,48].
Specifically, in breast cancer cells, the phase of cell cycle arrest is dependent on the type of cannabinoid
used in treatment. When bound to CB2 , THC downregulates cell division control 2 (Cdc2), inducing cell
cycle arrest in the G2 /M [28]. CBD has been shown to induce cell cycle arrest in the G1 /S phase [49],
mediated via the CB1 receptor [12], while cannabinoid combinations have been found to induce
simultaneous arrest in all phases of the cell cycle [50]. In the MCF-7 cell line, the CB2 receptor is more
prominently expressed than CB1 [28]; therefore, it could be eluded in this study that the G2 arrest
induced by C6 (Figure 7c) was mediated via the CB2 receptor.
Cannabinoids commonly induce cell death via two pathways: autophagy and apoptosis.
Autophagy is a conserved cellular process in which the cytoplasmic contents are sequestered into
double-membraned vesicles (autophagosomes) and fused with lysosomes for degradation or recycling.
Therefore, an increase in the lysosomal content often serves as an indirect method of measuring
the induction of autophagy (Figure 9a). The cannabinoid-induced activation of autophagy is often
mediated by the induction of endoplasmic reticulum stress [14,51,52]. The inhibition of the mammalian
target of rapamycin complex 1 (mTORC1) is a key step in the activation of autophagy [53]. THC induces
endoplasmic reticulum stress by triggering the accumulation of ceramide and the phosphorylation of
the eukaryotic translation initiation factor 2α. This activates the endoplasmic reticulum stress stress
response, which leads to the tribble homolog 3-dependent inhibition of the protein kinase B/mTORC1
pathway [52], resulting in autophagy [51]. Since GRP78 is a marker of endoplasmic reticulum stress and
was significantly increased after the treatment with C6 (Figure 9b), this could be an indication that C6
induced endoplasmic reticulum stress-mediated autophagy (Figure 9a,b). Furthermore, the initiation of
autophagy is commonly associated with lipid droplet inclusion into autophagosomes and subsequent
degradation by lysosomes (lipophagy) [54,55]; however, in this study an accumulation of lipid droplets
was observed. The small guanosine triphosphatase Rab7 is indispensable for lipophagy [56] and isMolecules 2020, 25, 4682 11 of 21
associated with lipid droplets and lysosomes under starvation conditions [57]. When Rab7 is silenced,
there is an accumulation of lipid droplets [56]. The colocalization of Rab7 and CB2 on the lysosomal
membrane has been reported [58]; however, it is yet to be established whether the colocalization plays
a role in the attenuation of lipophagy and the subsequent accumulation of lipid droplets.
Studies have documented the accumulation of lipids in MCF-7 cells in response to various stimuli,
which include the presence of peroxisome proliferator-activated receptor gamma (PPARγ) agonists [32].
Cannabinoids, specifically THC and CBD, have been reported to activate PPARγ, possibly explaining
the increase in lipid accumulation observed in the MCF-7 cells. Moreover, PPARγ activations has
been linked to pro-apoptotic signaling in MCF-7 cells [59]. This supports the lipid accumulation
(Figure 8b), significant increases in phosphatidylserine translocation (Figure 7d), membrane blebbing,
cell shrinkage (Figure 7e), significant increases in the average integrated nuclear fluorescence intensity
(Figure 7f), and nuclear fragmentation (Figure 9d) observed in this study.
Several studies have reported the induction of cytoplasmic vacuolation, and markers associated
with the atypical cell death mechanism, paraptosis [60–62]. It was therefore not unexpected to observe
cytoplasmic vacuolation in this study (Figure 8a); however, it was the first report of cytoplasmic
vacuolation induced in a breast cancer cell line using a cannabinoid combination. Paraptosis is
characterized by cellular swelling and cytoplasmic vacuolation, resulting from the dilation of the
endoplasmic reticulum and mitochondria, with the membrane of these cytoplasmic vacuoles often
derived from the endoplasmic reticulum (Figure 9c) [63].
The exact molecular mechanism for the induction of paraptosis is not well established, although the
most frequently reported induction signal is via the insulin-like growth factor receptor 1 (IGFR-1) [63,64].
IGFR-1 is overexpressed in the MCF-7 cells [15], providing a possible explanation for the presence of
cytoplasmic vacuolation in the MCF-7 cell line only. Alternatively, a study by Hoa et al. [65] found
that the activation of big conductance calcium-activated potassium (BKCa ) channels leads to the onset
of ionic imbalance and cellular swelling associated with paraptosis. The forced activation of the BK
channels results in potassium efflux, followed by an influx of sodium cations and water to restore ionic
balance. This influx of water results in cellular swelling. Since the BK channels are located on the
endoplasmic reticulum and mitochondria [65–67], this explains why these two organelles are specifically
targeted during the induction of paraptosis, as seen in this study (Figure 9c,d). The excess intracellular
Na+ is removed via ATP-dependent Na + /H+ antiporter [68]. However, the physical disruption of the
mitochondria impairs its ability to produce ATP, leading to an accumulation of intracellular Na+ and
eventually the osmotic lysis of the cell [68]. The disruption of energy homeostasis is also associated
with the induction of lipid droplet accumulation [69,70], linking the lipid accumulation induced by
C6 (Figure 8b) to the initiation of paraptosis. Studies have also found that endoplasmic reticulum
stress and the unfolded protein response (UPR) precede vacuole formation [60,71]. This supports the
findings of this study, with significant increases in the GRP78 protein levels in the MCF-7 cells treated
with C6 (Figure 9b). The induction of paraptosis by cannabinoids shows promise as an alternative
treatment for apoptosis-resistant carcinomas, as well as the emerging field of targeting ion channels to
treat cancer cells.
Conventional chemotherapeutic agents such as doxorubicin [72,73], paclitaxel [74,75],
and tamoxifen [76,77] often induce adverse effects, which limit the dose that can be administered safely.
Several studies have reported the limited induction of cytotoxicity by cannabinoids to the host in both
in vitro and in vivo models [17,78–80], supporting the observations made in this study with regards
to the MCF-10A cell line (Figure 6). It should be noted that conventional chemotherapeutic agents
have been reported to induce cytotoxicity in the MCF-10A cell line at concentrations ranging from
1 to 15 µM [81,82], while the cannabinoid combination C6 induced no cytotoxicity in the MCF-10A
cell line even at 40 µM. In this study, camptothecin treatment significantly reduced the MCF-10A cell
viability, which supports the cytotoxic effects of chemotherapeutic agents on non-cancerous, viable cells.
The anti-proliferative actions of cannabinoids are therefore not restricted by dose-limiting effects.Molecules 2020, 25, 4682 12 of 21
Cannabinoid signaling regulates several pathways in cancer and immune cells [83].
Cannabinoids reduce tumor proliferation by inhibiting the activation of the AKT [15,84], EGFR, ERK,
and nuclear factor kappa beta (NF-κβ) signaling pathways [84,85]. NF-κβ is one of the key regulators
of inflammation and tumor metastasis, survival, invasion, angiogenesis, and chemoresistance [86].
Cannabinoids also curtail tumor invasion and metastasis by inhibiting the secretion of matrix
metalloproteinase (MMP)-2 [84,87] and MMP-9 [84,88], while increasing the tissue inhibitors of
MMP-1 (TIMP-1) [89]. THC induces autophagy-mediated cell death as a result of stimulating the
p8-regulated pathway. The stimulation of the p8 induces ceramide accumulation via the inhibitory
effect of the tribbles homologue 3 (TRIB3) with the AKT/mTORC1 complex [51,52,90]. Therefore,
cannabinoids exert their anti-tumor effects by modulating both the proliferative and inflammatory
pathways. Like cannabinoids, other natural compounds such as curcumin, resveratrol, and calebin A
modulate multiple signaling pathways associated with tumor cell proliferation, invasion, and metastasis.
In addition, these compounds were evaluated in cultures mimicking the environment found in vivo
and have shown promise in counteracting the synergistic crosstalk that occurs between cancer cells
and the tumor microenvironment (TME) [91–94]. The modulation of the TME is important, since the
TME plays a vital role in tumor development, invasion, and metastasis [83].
Conventional in vitro monolayer cell cultures inadequately represent the tumor environment
found in vivo [95,96], highlighting a limitation of this study, where the effect of C6 on MCF-7 cells was
not evaluated within a tumor microenvironment (TME). Although cannabinoids have shown a reduction
in tumor proliferation within the TME [14,84,97], the evaluation of C6 within a TME remains important,
since conflicting reports have been found. Cannabinoids can exert an immunosuppressive action
against the anti-tumor immune cells found in the TME. Cannabinoid-induced immunosuppression
incites tumor growth. This is mainly executed by reducing T cell proliferation and shifting the
T helper profiles from a pro-inflammatory Th1 profile to an anti-inflammatory Th2 profile [98,99].
More specifically, this is accomplished through the decreased production of Th1 cytokines, such as
interferon-γ (IFN-γ), interleukin-12, and interleukin-2; the reduced expression of the IFN-γ and IL-12
receptors; as well as an increased production of Th2-promoting cytokines (IL-10 and transforming
growth factor-β) [100,101].
4. Materials and Methods
4.1. Reagents
All the cell lines were purchased from the American Type Culture Collection (Manassas, VA, USA).
Dimethylsulfoxide (DMSO) was purchased from Merck (Darmstadt, Germany). Bradford reagent,
sodium dodecyl sulphate (SDS) and the alkaline phosphatase conjugate substrate kit were purchased
from Bio-Rad (Hercules, CA, USA). Annexin V-FITC and propidium iodide were purchased from
BD Pharmingen (San Diego, CA, USA). Camptothecin, curcumin, hydrocortisone, bis-Benzamide
H 33,342 trihydrochloride (Hoechst 33342), recombinant insulin, Leibovitz’s-L15, and trypsin were
purchased from Sigma-Aldrich (St Louis, MO, USA). Cannabigerol, cannabinol, and cannabidiol were
purchased from LGC (Teddington, UK). ∆9 -tetrahydrocannabinol was purchased from Leco (St. Joseph,
Michigan), Triton X-100 and mercaptoethanol were purchased from Fluka (North Carolina, NC, USA).
Dulbecco’s Modified Eagle’s Medium (DMEM) high glucose with HEPES, DMEM/F12, foetal bovine
serum, horse serum, and Roswell Park Memorial Institute (RPMI) 1640 were purchased from Biowest
(Nuaillé, France). The mitochondrial staining kit (Cytopainter Orange) was purchased from Abcam
(Cambridge, UK). ER TrackerTM Green, Lysotracker® Green DND-26, and lipidTOXTM Green were
purchased from Molecular Probes® , Life Technologies, and Thermo Fisher Scientific (Logan, UT, USA).
3-[4–dimethylthiazole-2-yl]-2,5 diphenyltetrazolium bromide (MTT) was purchased from Melford
(Suffolk, UK). Epidermal growth factor was purchased from Life Technologies (Carlsbad, CA, USA).
GRP78 (H-129) sc-13968 Rabbit polyclonal IgG was purchased from Santa Cruz (Dallas, TX, USA).
p-p44/42 MAPK (T202/Y204) (D13.14.4E) XP rabbit mAb, goat anti-rabbit IgG conjugated to alkalineMolecules 2020, 25, 4682 13 of 21
phosphatase, and goat anti-mouse IgG (Fc specific) alkaline phosphatase conjugate were purchased
from Cell Signaling Technology (Danvers, MA, USA).
4.2. Cell Culture Conditions
The human breast cancer cell lines MCF-7 and MDA-MB-231 were cultured in DMEM high glucose
and Leibovitz’s-L15, respectively, supplemented with 10% (v/v) FBS [102,103]. The non-cancerous
human breast cell line, MCF-10A, was cultured in DMEM/F12, supplemented with 5% (v/v) horse
serum, 20 ng/mL of epidermal growth factor, 10 µg/mL of insulin, and 0.5 µg/mL of hydrocortisone.
The cultures were maintained at 37 ◦ C in a humidified incubator with 5% CO2, except for the
MDA-MB-231 cells, which were incubated in an airtight container to limit the CO2 exchange.
4.3. Proliferation Assay
To evaluate the effect of individual cannabinoids (cannabidiol, cannabigerol, cannabinol,
and ∆9 -tetrahydrocannabinol) on the proliferation of breast cancer cell lines, MCF-7 and MDA-MB-231
were seeded in a 96-well plate at 1 × 10⁴ cells (100 µL/well) and left to attach overnight. The media was
aspirated and replaced with 100 µL of the treatment at a concentration range of 16–64 µM. The working
solutions were serially diluted to construct dose–response curves. After 48 h of treatment exposure,
the cell viability was determined by replacing the spent media with 200 µL of MTT solution (0.5 mg/mL),
followed by a 2 h incubation at 37 ◦ C. The MTT solution was replaced with 200 µl of dimethylsulfoxide
and the absorbance was recorded at 550 nm [104]. The GraphPad Prism® curve fitting software was
used to determine the IC50 value of the respective cannabinoids.
4.4. Combination Studies
4.4.1. Constant Ratio Design
Cells (1 × 10⁴ /well) were seeded into 96-well plates and left to attach overnight. Cannabinoids
were combined at equipotent ratios of 1:1—i.e., the respective IC50 :IC50 concentrations—thereby
creating the following combinations: THC + CBG, THC + CBN, THC + CBD, CBG + CBN, CBG + CBD,
and CBN + CBD. The cell viability was determined after 48 h of treatment exposure using the MTT
assay. The nature of the drug:drug interactions were assessed by calculating the combination index
using the median effect equation [26].
4.4.2. Non-Constant Ratio Design
Four cannabinoids were combined using the checkerboard assay, with each cannabinoid at six
different concentrations. The checkerboard assay was designed with the maximum concentration of
individual cannabinoids, being double their respective IC50 values, and combined to extend over a
wide range of ratios (Figure 10).
4.4.3. Determination of Combination Index
The Chou–Talalay method is based on the median effect equation derived from the mass action
law principle. This general equation (equation 1) encompasses several equations, including the
Michaelis–Menten, Hill, Scatchard, and Henderson–Hasselbalch equations. The equation uses a
combination index as a measure of quantifying the drug–drug interactions, where CI = 1 represents
an additive effect, CI < 1 signifies a synergistic effect, and CI > 1 signifies an antagonistic effect.
The combination index can be calculated as follows:
CI = [1 /(Dx)1 + 2 /(Dx)2 ] (1)Molecules 2020, 25, 4682 14 of 21
where 1 and 2 refer to the dose of each drug in the combination that is required to inhibit the cell growth
by a given level, while (Dx)1 and (Dx)2 refer to the dose of the individual drugs required to induce the
same level of cell growth inhibition and are determined by Equation 2:
Dx = Dm [fa/ (1 - fa)]1/ m (2)
where Dm refers to the potency (inhibitory concentration), fa refers to the fraction of the cell population
affected by the drug, and m refers to the shape of the dose–effect curves.
Molecules 2020, 25, x FOR PEER REVIEW 14 of 21
Figure 10.
Figure 10. Illustration
Illustration of
of the
the combination
combination of four cannabinoids
of four cannabinoids in in aa 96-well
96-well cell
cell culture
culture plate
plate for
for the
the
treatment of
treatment of the
the breast
breast cancer
cancer cell
cell lines,
lines, MDA-MB-231
MDA-MB-231 and and MCF-7.
MCF-7. Darkest
Darkest color
color indicates
indicates the
the highest
highest
concentration, which
concentration, which was
was subsequently
subsequently diluted
diluted in
in the
the direction
direction illustrated.
illustrated.
4.5.
4.4.3.Screening against of
Determination Non-Cancerous
CombinationMCF-10A
Index Cell Line
Cells were seeded method
The Chou–Talalay at a cellisdensity
based on of the × 104 and
1.5 median incubated
effect equationovernight for cell
derived from attachment.
the mass action
The cells were treated with the IC
law principle. This general equation
90 of C6 (40 µM; total concentration of all the cannabinoids comprising
(equation 1) encompasses several equations, including the
the C6 combination).
Michaelis–Menten, Camptothecin
Hill, Scatchard, and (5.74 µM) was used as a positive
Henderson–Hasselbalch control
equations. Thetoequation
induce growth
uses a
inhibition.
combination After treatment,
index the MTT
as a measure assay was completed.
of quantifying the drug–drug interactions, where CI = 1 represents
an additive effect, CI < 1 signifies a synergistic effect, and CI > 1 signifies an antagonistic effect. The
4.6. Mechanism of Cell Death
combination index can be calculated as follows:
4.6.1. Cell Seeding and Treatment CI = [1/(Dx)1 + 2/(Dx)2], (1)
whereMCF-7
1 andcells were
2 refer to seeded atof
the dose a cell
eachdensity
drug inof the 104
1 × combination
cells per well
that (100 µL) andtoleft
is required overnight
inhibit to
the cell
attach. ◦
growthTheby acells
givenwere treated
level, with
while the
(Dx) IC90(Dx)
1 and concentration ofdose
2 refer to the C6 for
of48
theh individual
at 37 C. drugs required to
induce the same level of cell growth inhibition and are determined by Equation 2:
4.6.2. Imaging and Analysis
Dx = Dm[fa/(1 – fa)]1/m (2)
Images of cells stained with fluorescent dyes were acquired using the ImageXpress Micro
whereWidefield
XLS Dm refers to the potency
High-Content (inhibitory
Analysis system concentration),
(Molecular Devices ® , to
fa refers SantheJose,
fraction
CA, of the and
USA) cell
population
analyzed affected
with the MetaXpress ®
by the drug,High-Content
and m refers to the shape
Image of the dose–effect
Acquisition and Analysis curves.
Software version 6.01
(Molecular Devices® , San Jose, CA, USA). Assays were conducted in 96-well plates and 9 sites per
4.5. Screening
well against
were imaged, Non-Cancerous
covering MCF-10A
an area of Cell Line
approximately 63.5% of the total well area. The number of cells
imaged was dependent on the cytotoxicity of the treatment [105]. overnight for cell attachment. The
Cells were seeded at a cell density of 1.5 × 10 and incubated
4
cells were treated with the IC90 of C6 (40 µM; total concentration of all the cannabinoids comprising
the C6 combination). Camptothecin (5.74 µM) was used as a positive control to induce growth
inhibition. After treatment, the MTT assay was completed.
4.6. Mechanism of Cell Death
4.6.1. Cell Seeding and TreatmentMolecules 2020, 25, 4682 15 of 21
Cell Cycle Analysis
After treatment, the spent media was aspirated and the cells were stained with a 1 × binding
buffer stock (0.1M HEPES, pH 7.4; 1.4M NaCl; 25mM CaCl2), supplemented with 5% (v/v) Annexin
V-FITC (BD PharmingenTM) and Hoechst 33,342 at a final concentration of 1 µg/mL in the dark at 37 ◦ C
for 15 min. Images were acquired using the 40 ,60 -diamidino-2-phenylindole (DAPI) and fluorescein
isothiocyanate (FITC) filters.
Phosphatidylserine Translocation
The cells were stained according to the manufacturer’s instructions. Prior to image acquisition,
propidium iodide was added (final concentration of 1 µg/mL) to the Annexin V/Hoechst stain.
Images were acquired using the DAPI, FITC, and Texas Red filter sets.
Induction of Autophagy-Related Processes
The cells were stained according to the manufacturer’s instructions, with slight modifications.
The cells were co-stained with Lysotracker® Green (75 nM) and 1 µg/mL of Hoechst 33,342 for 30 min
at 37 ◦ C, followed by image acquisition using the DAPI and FITC filters.
Lipid Accumulation
After treatment, the spent media were removed, and the cells were stained with HCS LipidTOXTM
Green (1:200) and 1 µg/mL of Hoechst 33,342 and incubated in the dark for 30 min at 37 ◦ C. Images were
acquired using the DAPI and FITC filters.
Endoplasmic Reticulum Staining
After treatment, the spent media were aspirated and the cells were stained with ER-TrackerTM
(1 µM) and 1 µg/mL of Hoechst 33,342 for 15 min at 37 ◦ C, which was subsequently replaced with
fresh media and imaged using the DAPI and TRITC filters.
4.6.3. Mitochondrial Dilation
The cells were seeded at a 1 × 10³ cells per well in a µ-slide (Ibidi, Martinsried, Germany).
After overnight attachment, the cells were treated with C6 (40 µM). The spent media were removed,
and cells were stained using the CytoPainter Orange mitochondrial staining kit (1:500), as per the
manufacturer’s instructions. After a 30 min incubation, the stain was replaced with binding buffer and
the cells were imaged with the Zeiss LSM510 Meta laser scanning confocal microscope using the DAPI
and TRITC filter sets.
4.6.4. Western Blotting Analysis
After cell treatment, the media were aspirated and the cells were washed with ice-cold phosphate
buffered saline, followed by a 10-min incubation in lysis buffer (50 mM of Tris-HCl, pH 7.4; 2 mM of
EDTA, 1% (v/v) Triton X-100). The cells were lifted using a cell scraper and the lysates were vortexed
for 10 s and aliquoted for storage at −20 ◦ C. When required, the protein concentrations of the lysates
were determined using the Bradford assay, and equal protein concentrations were electrophoresed on a
10% SDS-PAGE [106]. The protein was transferred to a PVDF membrane using electroblotting with the
Biorad trans-blot transfer system at 20 V for 20 min. The PVDF membrane was blocked with 5% (w/v)
milk powder and the respective primary antibodies were added (1:1000) and incubated overnight at
4 ◦ C. This was followed by incubation with the anti-rabbit alkaline phosphatase conjugated secondary
antibody (1:20,000) for 3 h at 4 ◦ C. Bands were detected using the Bio-Rad alkaline phosphatase
substrate kit [107]. The protein expression was normalized to the total protein. Replicate gels from
independent experiments were stained with Coomassie Brilliant Blue and densitometric analysis wasYou can also read