SCALENE: Scripting-Language Aware Profiling for Python
←
→
Page content transcription
If your browser does not render page correctly, please read the page content below
S CALENE: Scripting-Language Aware Profiling for Python

                                                                                                    Emery D. Berger
                                                                                     College of Information and Computer Sciences
                                                                                          University of Massachusetts Amherst
                                                                                               emery@cs.umass.edu
arXiv:2006.03879v2 [cs.PL] 25 Jul 2020

                                                                        Abstract                                                This combination of overheads can lead applications in
                                            Existing profilers for scripting languages (a.k.a. “glue” lan-                   scripting languages to run orders of magnitude slower than
                                         guages) like Python suffer from numerous problems that dras-                        code written in systems languages. They also can consume
                                         tically limit their usefulness. They impose order-of-magnitude                      much more space: for example, because of object metadata,
                                         overheads, report information at too coarse a granularity, or                       an integer consumes 24–28 bytes in most scripting languages.
                                         fail in the face of threads. Worse, past profilers—essentially                      The widespread use of incomplete memory management algo-
                                         variants of their counterparts for C—are oblivious to the fact                      rithms like reference counting, which cannot reclaim cycles,
                                         that optimizing code in scripting languages requires informa-                       only exacerbates the situation. These performance properties
                                         tion about code spanning the divide between the scripting                           combine to make developing efficient code in scripting lan-
                                         language and libraries written in compiled languages.                               guages a challenge, but existing profilers for these languages
                                            This paper introduces scripting-language aware profil-                           are essentially ports of profilers for systems languages like
                                         ing, and presents S CALENE, an implementation of scripting-                         gprof [12] or perf, which greatly limits their usefulness.
                                         language aware profiling for Python. S CALENE employs a                                This paper introduces scripting-language aware profiling,
                                         combination of sampling, inference, and disassembly of byte-                        which directly addresses the key challenges of optimizing
                                         codes to efficiently and precisely attribute execution time and                     code written in scripting languages. Because scripting lan-
                                         memory usage to either Python, which developers can opti-                           guages are so inefficient, optimizing applications in these lan-
                                         mize, or library code, which they cannot. It includes a novel                       guages generally involves moving code into native libraries.
                                         sampling memory allocator that reports line-level memory                            Developers thus need to know if bottlenecks reside in the
                                         consumption and trends with low overhead, helping develop-                          scripting language, which they can optimize, or in native li-
                                         ers reduce footprints and identify leaks. Finally, it introduces                    braries, which they cannot. Because of the significant space
                                         a new metric, copy volume, to help developers root out insidi-                      overheads that scripting languages impose, developers need
                                         ous copying costs across the Python/library boundary, which                         to both limit unnecessary memory consumption by avoiding
                                         can drastically degrade performance. S CALENE works for                             accidental instantiation of lazily generated objects, moving
                                         single or multi-threaded Python code, is precise, reporting                         memory intensive code into libraries, as well as identify leaks.
                                         detailed information at the line granularity, while imposing                        Finally, they need to identify and eliminate implicit copying
                                         modest overheads (26%–53%).                                                         across the scripting language/compiled language boundary,
                                                                                                                             which can drastically degrade performance.
                                         1     Introduction                                                                     We have developed a scripting-language aware profiler for
                                                                                                                             Python called S CALENE. We target Python because it is one
                                         General-purpose programming languages can be thought of as                          of the most popular scripting languages according to a variety
                                         spanning a spectrum from systems languages to scripting lan-                        of rankings [8, 24, 39, 44]. Large-scale industrial users of
                                         guages [26]. Systems languages are typically statically-typed                       Python include Dropbox [4], Facebook [19], Instagram [16],
                                         and compiled, while scripting languages are dynamically-                            Netflix [23], Spotify [47], and YouTube [45].
                                         typed and interpreted. As Table 1 shows, scripting languages                           In addition to subsuming the functionality of previous pro-
                                         share many implementation characteristics, such as unop-                            filers with higher performance, S CALENE implements the
                                         timized bytecode interpreters, relatively inefficient garbage                       following novel scripting-aware profiling features:
                                         collectors, and limited support for threads and signals 1 .
                                             1 Wedeliberately exclude JavaScript, which was initially a scripting lan-       much in common with those of other scripting languages, beyond its lack of
                                         guage; its implementation has evolved to the point where it no longer has           support for threads.

                                                                                                                         1
Scripting Interpreter GC algorithm Threads Signal limitations
Language Bytecode AST Ref-counting Mark-sweep pthreads Serialized Main Only Delayed
Perl (1987) X X N/A X
Tcl/Tk (1988) X X N/A N/A
Python (1990) X X † X X X X
Lua (1993) X ‡ X X
PHP (1994) X †† * N/A X
R (1995) X X X N/A N/A
Ruby (1995) X ‡‡ X X X X
Table 1: Major scripting language implementations share common implementation characteristics. Next to each language is its first
release date. All are dynamically typed; their standard implementations are interpreted and garbage-collected, most with reference counting.
All lack threads or serialize them with a global interpreter lock (“GIL”), and all place severe limits on signal delivery, such as delivering only
to the main thread and delaying delivery until the interpreter regains control (e.g., after executing a bytecode). †: Python has an optional
“stop-the-world” generational mark-sweep garbage collector. ‡: Lua garbage collector is an incremental mark-sweep collector. ††: PHP has a
backup cycle collector [2]. ‡‡: Ruby’s garbage collector is an incremental, generational mark-sweep collector. *: PHP support for threads is
disabled by default, but can be configured at build time. (§5.1)
Profiler Time Efficiency Mem Unmodified Threads Scripting-Lang Aware
Cons. Code Python/C Mem Trend Copy Vol.
function-granularity
cProfile [34] real y X
Profile [35] CPU ri X
pyinstrument [32] real x
i X
yappiCPU [7] CPU s
i X X
yappiwallclock [7] real w
i X X
line-granularity
line_profiler [18] real i
t
pprofiledet [28] real q
i X X
pprofilestat [28] real y X X
py-spy [10] both y X X
memory_profiler [27] N/A p
i X
S CALENE both x
i X X X X X X
Table 2: Existing Python profilers vs. S CALENE. Time indicates real (wall-clock) time, CPU time, or both. Darker circles shown in Efficiency
indicate higher efficiency (lower overheads), ranging from less than 1.2× to over 1000× (Figure 4 provides detailed performance breakdowns,
and Section 5.2 provides other details.) Mem Cons. indicates whether it profiles memory consumption. Unmodified Code means that use of the
profiler does not require source code modifications. Threads indicates whether it correctly attributes execution time or memory consumption for
multithreaded Python code. Only S CALENE reports scripting-language aware statistics: Python/C = separate attribution of execution time (§3.1)
and memory (§3.2) to Python code or C, Mem Trend = timeline of memory consumption (§3.3), and Copy Vol. = copy volume in MB/s (§3.4).
• Separate Python/C accounting of time and space. ory consumption to Python vs. native code, but also to
S CALENE separately attributes both execution time efficiently profile memory usage at the line granular-
(§3.1) and memory consumption (§3.2) based on ity. It produces per-line memory profiles in the form of
whether it stems from Python or native code. Most sparklines (see Figure 1): these are in-line graphs that in-
Python programmers are not able to optimize the perfor- dicate trends of memory consumption over time, making
mance or memory consumption of native code (which is it easier to track down leaks (§3.3).
usually either in the Python implementation or external
libraries), so this helps developers focus their optimiza- • Copy volume. Finally, S CALENE reports copy volume
tion efforts on the code they can improve. in megabytes per second, for each line of code (§3.4).
This novel metric makes it straightforward to spot inad-
• Fine-grained tracking of memory use over time. vertent copying, including silent coercion or crossing the
S CALENE uses a novel sampling memory allocator Python/library boundary (e.g., accidentally converting
(§3.2) to not only enable separate accounting of mem- numpy arrays into Python arrays or vice versa).
2S CALENE overcomes a number of technical challenges in- By contrast, Figure 1b shows the output of S CALENE for
herent to the implementation of scripting languages to collect the same program. The profile reveals that the line of code
this information with relatively low performance overhead. in question is unusual: its memory consumption (exclusively
S CALENE outperforms other profilers by in some cases orders in native code) exhibits a distinctive sawtooth pattern. In
of magnitude, while delivering far more detailed information. addition, the line is responsible for a considerable amount of
S CALENE is precise. Unlike many existing Python profilers, copy volume (almost 600 MB/s). Together, this information
S CALENE performs both memory and CPU profiling at the tells a familiar tale: copying to a temporary, which is allocated
line granularity. This level of detail can be much more use- and then promptly discarded. Inspection of this line of code
ful than the function-granularity profiles returned by many reveals an unnecessary call to np.array (the result of the
profilers: unlike in systems languages, where individual lines expression is already a numpy array). Removing that call, as
are often compiled to a few cycles, lines of code in scripting Figure 1c shows, reduces both overall memory consumption
languages are often orders of magnitude more expensive. Our (shown in the top line of the profile) and total execution time
prototype achieves this precision with low overhead. For full by 50%.
memory and copy profiling, it imposes between 26%–53% In addition to revealing optimization opportunities that
overhead; for CPU profiling only (separating Python and C other profilers cannot, S CALENE is also fast, imposing just
execution), it imposes no observable performance penalty 10% overhead for this benchmark. The next section details
(Section 4). how S CALENE’s implementation simultaneously delivers
While this paper primarily focuses on S CALENE and high precision and generally low overhead (at most 53%).
Python, we believe the techniques it describes depend primar-
ily on implementation details common to almost all scripting
languages, and thus should be broadly applicable. 3 Implementation
Our S CALENE prototype runs on Linux (including Windows
2 Overview of S CALENE Subsystem for Linux, version 2) and Mac OS X, for Python
versions 3.5 and higher. It is implemented as a combination of
This section provides an overview of S CALENE’s operation
a pure Python module and a specialized runtime library writ-
in collecting profile information.
ten in C++ that replaces key calls by library interposition (that
Profiling a Python program with S CALENE is a straight-
is, LD_PRELOAD on Linux and DYLD_INSERT_LIBRARIES on
forward matter of replacing the call to Python (e.g., python3
Mac OS X). Figure 2 presents a diagrammatic overview.
app.py becomes scalene app.py). By default, S CALENE
Crucially, S CALENE does not depend on any modifications
generates a profile when the program terminates. To sup-
to the underlying CPython interpreter. This approach means
port long-running Python applications, S CALENE also can be
that S CALENE works unchanged with other implementations
directed via command-line parameters to periodically write
of Python like PyPy [33]. It also provides evidence that the
profiles to a file.
techniques we develop for S CALENE should be portable to
In addition to providing line-granularity CPU profiles, S CA -
other scripting languages without significant changes. Table 3
LENE breaks out CPU usage by whether it is attributable
presents an overview of scripting languages and the features
to interpreted or native code (§3.1). Its sampling memory
that S CALENE relies on.
allocator—which replaces the default allocator through li-
brary interposition—lets it report line-granularity net memory Exposing scripting-language aware features—without mod-
consumption, separately attribute memory consumption to ifying the underlying language—required overcoming a
Python or native code (§3.2), and display trends, in the form number of technical challenges. This section first explains
of “sparklines” [46], which capture memory usage over time how S CALENE turns the severe limitations on signal deliv-
(§3.3). This information makes it easy for developers to iden- ery (typical of scripting languages) to good effect. It then
tify leaks or unnecessary allocation and freeing. It also reports presents S CALENE’s runtime library, which cooperates with
copy volume in megabytes per second, which can identify the Python-based component to track memory usage, trends
unnecessary copying, whether in Python, in native libraries, over time, and copy volume, all at a line granularity and with
or across the boundary. low overhead. In the remainder of this section, we focus our
Figure 1 demonstrates how S CALENE’s guidance can help discussion specifically on Python, noting where characteris-
developers find inefficiencies and optimize their code. Fig- tics of Python differ from other scripting languages.
ure 1a shows a profile from a standard Python profiler,
line_profiler. The generic nature of past profilers (just 3.1 Python/C Attribution of CPU Time
tracking CPU time) often fails to yield meaningful insights.
Here, it indicates that the line of code is responsible for 100% Traditional sampling profilers work by periodically interrupt-
of program execution, but this fact does not suggest optimiza- ing program execution and examining the current program
tion opportunities. counter. Given a sufficiently large number of samples, the
3(a) Profiling with line_profiler. Traditional CPU profilers often yield little actionable insight.
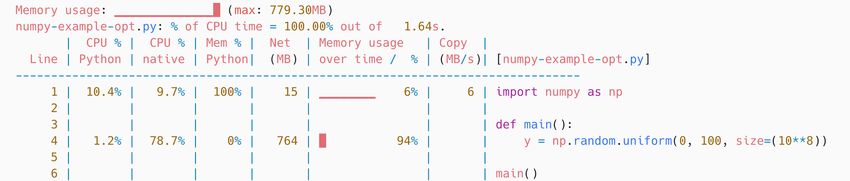
(b) Profiling with S CALENE: before optimization. Line 4’s sawtooth allocation and high copy volume indicate copying due to np.array.
(c) Profiling with S CALENE: after optimization. Removing the call to np.array cuts execution time and total memory footprint in half.
Figure 1: S CALENE’s profiler can effectively guide optimization efforts. Unlike past profilers, S CALENE splits time spent and memory
consumed in the Python interpreter vs. native libraries, includes average net memory consumption as well as memory usage over time, and
reports copy volume. The sawtooth pattern and high copy volume on line 4 in Figure 1b indicate unnecessary allocation and copying due to a
redundant np.array call. Removing it stabilizes allocation and eliminates copying overhead, leading to a 50% performance improvement and
footprint reduction.
number of samples each program counter receives is propor- code executing in threads (besides the main thread) are never
tional to the amount of time that the program was executing. executed. In the worst case, sampling can utterly fail. Con-
Sampling can be triggered by the passage of real (wall-clock) sider a main thread that spawns child threads and then blocks
time, which accounts for CPU time as well as time spent waiting for them to finish. Because no signals are delivered to
waiting for I/O or other events, or virtual time (the time the the main thread while it is blocking, and because the threads
application was actually scheduled for execution), which only themselves also never receive signals, a naïve sampling pro-
accounts for CPU time. filer could report that no time elapsed. (Note that because of
While both timer approaches are available in Python (on serialization due to the GIL, Python threads are not particu-
Linux and Mac OS X systems), directly using sampling is larly well suited for parallel code, but they are widely used in
ineffective for Python. As noted previously, nearly all script- servers to manage connections.)
ing languages impose severe limitations on signal delivery.
Typically, as in Python, these signals are delayed until the vir- Inferring Time Spent in C Code
tual machine (i.e., the interpreter loop) regains control, often Recall that one of the goals of S CALENE is to attribute exe-
after each opcode. These signals are also only delivered to cution time separately, so that developers can identify which
the main thread. code they can optimize (Python code) and which code they
The result is that no signals are delivered—and thus, no generally cannot (C or other native code). An apparently
samples accrue—during the entire time that Python spends promising approach would be handle signals, walk the stack,
executing external library calls. It also means that lines of and distinguish whether the code was invoked by the inter-
4It might seem counterintuitive to update both counters, but
Python app as we show below, this approach yields an unbiased estimator.
under profile That is, in expectation, the estimates are equivalent to the
yourapp.py actual execution times. We first justify this intuitively, and
then formally prove it is unbiased.
separates Python/C First, consider a line of code that spends 100% of its time
SCALENE execu,on ,me;
in the Python interpreter. Whenever a signal occurs during
tracks memory usage
Python module trends & copy execution of that line, it will be almost immediately delivered,
volume meaning that T = q. Thus, all of its samples (q) will accumu-
scalene.py (per-line)
late for the Python counter, and 0% (T − q = T − T = 0) for
the C counter, yielding an accurate estimate.
Now consider a line that spends 100% of its time executing
Python
C code. During that time, no signals are delivered. The longer
interpreter the time elapsed, the more accurate this estimate becomes.
The ratio of time attributed to C code over (C plus Python)
−q
generates signals:
is (T T−q)+q , which simplifies to T T−q . As T approaches infin-
intercepts
malloc/ SCALENE ,mer interrupts, ity, this expression approaches 1 (that is, limT →∞ T T−q = 1),
alloca,on events,
free run+me (C++) & copying; making it an accurate estimate.
& memcpy
separates Python/C While equality holds in the limit, the resulting approxima-
libscalene.so
mem consump,on
tion is accurate even for relatively low elapsed times, as long
Figure 2: S CALENE Overview. S CALENE consists of two main as they are larger relative to the sampling interval. S CALENE’s
components, a Python module and a C++-based runtime system, current sampling interval is 0.01 seconds, so a line that takes
both depicted in gray. The runtime system is loaded via library
one second executing C code would receive (1 − 0.01)/1 or
interposition. The white components (the code being profiled and
the Python interpreter itself) require no modifications.
99% of its samples as native code, which is only off by 1%.
Finally, consider the general case when the ratio of time
spent in C code to Python code is some fraction F. In expec-
tation, the signal will be delayed with probability F, meaning
preter as an external function, or whether it was within the
interpreter itself. However, as we note above, no signals are that the attribution to C code will be F(TT−q) . As T approaches
delivered during native code execution, making such an ap- infinity, this expression approaches F.
proach impossible. To prove that this approach yields an unbiased estimator,
Instead, we turn this ostensible limitation to our advantage. we need to show that, in expectation, the estimates equal the
We leverage the following insight: any delay in signal delivery actual values. We denote the execution time of the program’s
corresponds to time spent executing outside the interpreter. Python and C components as P and C, respectively. We sub-
That is, if S CALENE’s signal handler received the signal im- script these with an index (e.g., Pi ) to denote individual lines
mediately (that is, in the requested timing interval), then all of code; P = ∑i Pi . We use hats to denote estimates, as in P̂i .
of that time must have been spent in the interpreter. If it was Rephrasing formally, to show that these estimates are unbi-
delayed, it must be due to running code outside the interpreter, ased, we need to show that E[P̂i ] = E[Pi ] and E[Ĉi ] = E[Ci ].
which is the only cause of delays (at least, in virtual time). We first observe that, in expectation, Pi is the proportional
To track this time, S CALENE uses a clock (either fraction of execution time taken by line i of the total P (and
time.process_time() or time.perf_counter()) to similarly for Ci ). By linearity of expectation, it is sufficient to
record the last time it received a CPU timer interrupt. When consider the total execution times and show that E[P̂] = E[P]
it receives the next interrupt, it computes T , the elapsed time and E[Ĉ] = E[C].
and compares it to the timing interval q (for quantum). Call S the total number of samples received by the
S CALENE uses the following algorithm to assign time to program—by definition, only when it is executing Python
Python or C: Whenever S CALENE receives a signal, S CA - code. This means that E[P] = Sq: the expected running time
LENE walks the Python stack until it reaches code being pro- of Python code is the number of samples times the length of
filed (that is, outside of libraries or the Python interpreter each quantum. S CALENE adds q every time to its estimate
itself), and attributes time to the resulting line of code. S CA - of Python execution time whenever it receives a signal: the
LENE maintains two counters for every line of code being total is Sq, so E[P̂] = Sq = E[P]. For C code, S CALENE adds
profiled: one for Python, and one for C (native) code. Each the time elapsed waiting for a signal. The total time elapsed
time a line is interrupted by a signal, S CALENE increments when waiting for a signal is the total elapsed time minus the
the Python counter by q, the timing interval, and it increments time accounted for by signals: E[Ĉ] = E[(P +C) − Sq]. We
the C counter by T − q. have already shown that E[P] = Sq, so we have E[Ĉ] = E[C].
5Simulated Python execution
Attributing Time Spent in Threads
2.00
Python ratio
1.75 C ratio The approach described above accurately attributes execution
Ratio of estimated time over actual time
time for Python vs. C code in the main thread, but it does not
1.50
attribute execution time at all for threads, which themselves
1.25
never receive signals. To handle this, S CALENE relies on
1.00 the following Python features, which are available in other
0.75 scripting languages: monkey patching, thread enumeration,
0.50 stack inspection, and bytecode disassembly.
0.25
0.00 Monkey patching. Monkey patching refers to the redef-
1 4 16 64 256 1024 4096 16384
Simulated running time (seconds) inition of functions at runtime, a feature of most scripting
languages. S CALENE uses monkey patching to ensure that
Figure 3: Simulated execution of Python/C code. This graph val-
idates S CALENE’s inference approach to distinguishing Python and signals are always received by the main thread, even when
C execution times, showing that as execution time increases, the that thread is blocking. Essentially, it replaces blocking func-
estimated shares of execution time become increasingly accurate. tions like threading.join with ones that always use time-
outs. The timeout interval is currently set to Python’s thread
quantum (obtained via sys.getswitchinterval()). By re-
placing these calls, S CALENE ensures that the main thread
yields frequently, allowing signals to be delivered regularly.
Simulation study. To quantify how quickly these formu- In addition, to attribute execution times correctly, S CA -
las converge converges depending on the ratio of T and q, LENE maintains a status flag for every thread, all initially
we perform a simulation study. The simulator mimics the executing. In each of the calls it intercepts, before S CALENE
effect of executing a Python program line by line, spending actually issues the blocking call, it sets the calling thread’s
a random amount of time executing Python code, and then a status as sleeping. Once that thread returns (either after suc-
random amount of time running C code. The simulator draws cessfully acquiring the desired resource or after a timeout),
the execution times of the Python and C components of each S CALENE resets the status of the calling thread to executing.
line of code from a Pareto distribution such that 20% of the S CALENE only attributes time to currently executing threads.
code accounts for 80% of the total execution time (α = 1.16).
It then simulates execution of 100 lines of code for a range of Thread enumeration. When the main thread receives a
execution times, where the simulated quantum is set at 0.01 signal, S CALENE introspects on all running threads, invok-
seconds (as in S CALENE), and attributes time as described ing threading.enumerate() to collect a list of all running
either to Python or C code. At the end of execution, the simu- threads; similar logic exists in other scripting languages (see
lator reports the estimated total time spent in Python code or Table 3).
C code, along with the simulated “actual” time.
Figure 3 presents the results of running this simulation 10 Stack inspection. S CALENE next obtains the
times; the x-axis is execution time, and the y-axis is the aver- Python stack frame from each thread using Python’s
age ratio of estimated time to simulated time. As predicted, sys._current_frames() method. Note that the preceding
the accuracy of both estimators increases as execution time in- underscore is just Python convention for a “protected” class
creases. The simulation shows that the amount of error in both method or variable. As above, S CALENE walks the stack to
estimates is under 10% after one minute of execution time. find the appropriate line of code for which it will attribute
Empirically, we find that actual code converges more quickly; execution time.
we attribute this to the fact that actual Python code does not
consist of serialized phases of Python and then C code, but Bytecode disassembly. Finally, S CALENE uses bytecode
rather that the phases are effectively randomly mixed. disassembly (via the dis module) to distinguish between
time spent in Python vs. C code. Whenever Python invokes
We also evaluate the correlation of all estimated and sim- an external function, it does so via a bytecode whose textual
ulated times using Spearman’s ρ, which measures whether representation starts with CALL_ (this approach is common
there is a linear relationship between the two, a value of ρ = 1 to other languages; for example, Lua uses OP_CALL, while
denoting a monotonic linear relationship between the values. Ruby’s is opt_call_c_function). S CALENE builds a map
For 64 seconds of execution, the correlation coefficient for of all such bytecodes at startup.
the Python estimates and the C estimates to their simulated For each running thread, S CALENE checks the stack and its
execution time is ρ > 0.99, indicating that the estimates are associated map to determine if the currently executing byte-
directly correlated with the simulated times. code is a call instruction. Because this method lets S CALENE
6know with certainty whether the thread is currently executing error (e.g., freeing an unaligned object, a stack-allocated ob-
Python or C code, there is no need for the inference algorithm ject, or an object obtained from an internal allocator), but also
described above. If the bytecode is a call, S CALENE assigns because of timing: library interposition does not necessarily
time to the C counter; otherwise, it assigns it to the Python intercept all object allocations. In fact, Python invokes free
counter. on ten foreign objects, which are allocated before S CALENE’s
interposition completes. Because re-using foreign objects to
satisfy object requests could lead to havoc, a general-purpose
3.2 Memory Usage allocator needs a fast way to identify foreign objects and
Traditional profilers either report CPU time or memory con- discard them (a small leak being preferable to a crash).
sumption; S CALENE reports both, at a line granularity. It is We therefore built a general-purpose memory allocator for
vital that S CALENE track memory both inside Python and S CALENE whose performance characteristics nearly match
out; external libraries are often responsible for a considerable those of the Python allocator. At initialization, the S CALENE
fraction of memory consumption. allocator reserves a contiguous range of virtual memory to sat-
To do this, S CALENE intercepts all memory allocation re- isfy small object requests. It also allocates memory for large
lated calls (malloc, free, etc.) via its own replacement mem- objects to be aligned to 4K boundaries, and places a magic
ory allocator, which is injected before execution begins. number (0xDEADBEEF) in each header as a validity check. If
By default, Python relies on its own internal memory allo- objects are outside the contiguous range, not properly aligned,
cator for objects 512 bytes or smaller, maintaining a freelist or fail their validity check, S CALENE treats them as foreign.
of objects for every multiple of 8 bytes in size. However, We have found this approach to be sufficiently robust to enable
if the environment variable PYTHONMALLOC is set to malloc, it to work on every Python program we have tested.
Python will instead use malloc to satisfy all object requests. Otherwise, the internals of the S CALENE allocator are sim-
S CALENE sets this variable accordingly before beginning pro- ilar in spirit to those of the Python allocator; it maintains lists
filing. Note that some other languages may not make it so for every size class of a multiple of 16 bytes up to 512 bytes.
straightforward to replace all allocations; for example, while These point to 4K slabs of memory, with a highly optimized
Ruby uses the system malloc to satisfy large object requests, allocation fast path. Large objects are allocated separately,
there is no facility for replacing small object allocations. How- either from a store of 4K chunks, or directly via mmap. In our
ever, most other scripting languages make it simple to redirect tests, this allocator significantly closes the performance gap
all of their allocations (see Table 3). between the system allocator and Python’s internal allocator,
reducing overhead from 80% to around 20%. We expect to be
able to optimize performance further, especially by avoiding
An Efficient Replacement Allocator repeated calls to mmap for large object allocation.
Because Python applications can be extremely allocation-
intensive, using a standard system allocator for all objects can Sampling
impose considerable overhead. In our experiments, replacing
With this efficient allocator in hand intercepting all allocation
the allocator by the default on Mac OS X can slow down
requests, we are now in a position to add the key component:
execution by 80%. We viewed this as an unacceptably large
sampling.
amount of overhead, and ended up building a new allocator
in C++, with some components drawn from the Heap Layers
infrastructure [5]. Allocation-Triggered Sampling: The S CALENE sampling
This might at first glance seem unnecessary, since in theory, allocator maintains a count of all memory allocations and
one could extract the allocator from the Python source code frees, in bytes. Once either of these crosses a threshold, it
and convert it into a general-purpose allocator. Unfortunately, sends a signal to the Python process. To allow S CALENE to
the existing Python allocator is also not suitable for use as work on Mac OS X, which does not implement POSIX real-
a general malloc replacement. First, the built-in Python al- time signals, we re-purpose two rarely used signals: SIGXCPU
locator is implemented on top of malloc; in effect, making for malloc signals, and SIGXFSZ for free signals. S CALENE
it a general-purpose allocator still would require building an triggers these signals roughly after a fixed amount allocation
implementation of malloc. or freeing. This interval is currently set as a prime number
However, the most important consideration, which neces- above 1MB, intended to reduce the risk of stride behavior
sitates a redesign of the algorithm, is that a usable general- interfering with sampling.
purpose allocator replacement needs to be robust to invo-
cations of free on foreign objects. That is, it must reject Call Stack Sampling: To track the provenance of allocated
attempts to free objects which were not obtained via calls to objects (that is, whether they were allocated by Python or
its malloc. This case is not a theoretical concern, but is in native code), S CALENE triggers call stack sampling. The sam-
fact a near certitude. It can arise not just due to programmer pling rate is set as a multiple of the frequency of allocation
7samples (currently 13×). Whenever the threshold number 3.3 Memory Trends
of allocations is crossed (that is, after 1MB/13 allocations),
S CALENE climbs the stack to determine whether the sampled S CALENE not only reports net memory consumption per
allocation came from Python or native code. line, but also reports memory usage over time in the form
of sparklines, both for the program as a whole and for each
To distinguish between these two, S CALENE relies on the individual line. It adds the current footprint (updated on every
following domain-specific knowledge of Python internals. allocation and free event, comprising at least 1MB of alloca-
Python has a wide range of functions that create new Python tion) to an ordered array of samples for each line of code. The
references, all of which begin with either Py_ or _Py. If S CA - sampling array is chosen to be a multiple of 3, currently 27.
LENE encounters one of these functions as it climbs the stack, When the array fills, the contents are reduced by a factor of 3,
the object was by definition allocated by Python, so it incre- replacing each entry by its median value; after this reduction,
ments a count of Python allocations by the requested size.2 footprint samples are again added to the end of the array. The
After walking a maximum number of frames (currently 4), effect of this approach is to smooth older footprint trends (on
if S CALENE has not encountered one of these functions, it the left side of the sparkline) while maintaining higher fidelity
concludes that the allocation was due to native code and incre- for more recent footprints.
ments the C allocation counter. When the S CALENE allocator
eventually sends allocation information to the Python module
(described below), it includes the ratio of Python bytes over
3.4 Copy Volume
total allocated bytes. It then resets both allocation counters. Finally, S CALENE reports copy volume by line. It also accom-
Because resolving function names via dladdr is relatively plishes this by sampling. The S CALENE runtime system inter-
costly, especially on Mac OS X, S CALENE maintains an open- poses on memcpy, which is invoked both for general copying
addressed hash table that maps call stack addresses to function and copying across the Python/C boundary. As with memory
names. This hash table is a key optimization: using it reduces allocations, S CALENE triggers a signal (this time, SIGPROF)
S CALENE’s overhead by 16% in one of our benchmarks. after a threshold number of bytes has been copied. It also uses
the same temporary file approach to avoid the problem of lost
signals. The current memcpy sampling rate is set at a multiple
of the allocation sampling rate (currently 2×). The ratio of the
Managing Signals: Because Python does not queue sig- of copy sampling and the allocation sampling rates typically
nals, signals can be lost. We thus need a separate channel to has a proportional impact on the number of interrupts. Since
communicate with the main process; to do this, we allocate copying is almost always immediately preceded by an allo-
a temporary file with the process-id as a suffix. S CALENE cation of the same size, and followed by a deallocation, the
appends information about allocations or frees to this file, as current setting maintains copy samples at roughly the same
well as the fraction of Python allocations. rate as allocation samples.
When S CALENE’s signal handler is triggered (in the Python
module), it reads the temporary file and attributes allocations
4 Evaluation
or frees to the currently executing line of code in every frame.
As with sampling CPU execution, lines of code that frequently We conduct our evaluation on a MacBook Pro (2016), with
allocate or free memory will get more samples. S CALENE a 3.3 GHz dual-core Intel Core i7, and equipped with 16GB
also tracks the current memory footprint, which it uses both of 2133 MHz DDR3 RAM. The Powerbook running Ma-
to report maximum memory consumption and to generate cOS Catalina (version 10.15.4). All C and C++ code is com-
sparklines for memory allocation trends (Section 3.3). piled with clang version 11.0, and we use version 3.6.8 of the
One fly in the ointment is that the Python signal handler Python interpreter.
itself allocates memory. Unlike in C, this allocation is impossi-
ble to avoid because the interpreter itself is constantly allocat-
ing and freeing memory. However, S CALENE again leverages 4.1 CPU Profiling Overhead
one of Python’s limitations to its advantage: Python’s global This section compares the profiling overhead of S CALENE
interpreter lock ensures that there is no true concurrency in- to the suite of existing profilers listed in Table 2. To tease
side the interpreter. Therefore, S CALENE straightforwardly apart the impact of the S CALENE runtime library, we include
prevents re-entrant calls by checking a boolean flag to see if the results of S CALENE without the library, which we refer
it is already in the signal handler; if not, it sets the flag. to as “S CALENE (CPU)” (as it performs CPU profiling only,
although still separating Python and C execution time), from
2 A few special cases: _PyCFunction allocates memory but on behalf of “S CALENE (full)”, which includes both memory and copy
a C call, and PyArray, a non-Python call that numpy uses for allocating its volume tracking. We conservatively choose CPU-intensive
own (native) arrays; S CALENE treats both of these correctly as C allocations. applications to perform these experiments, as these represent
8Scripting malloc Monkey Thread Stack Opcode
Language interposition patching enum. inspection disassembly
Perl X(1) X threads->list() Devel::StackTrace B::Concise
Tcl/Tk X(2) X not needed not needed not needed
Python X(3) X threading.enumerate() sys._current_frames() dis
Lua X(4) X not needed not needed not needed
PHP X(5) X not needed not needed not needed
R X X not needed sys.call disassemble
Ruby X(6) X Thread.list caller RubyVM::InstructionSequence
Table 3: Feature support needed for scripting-language aware profiling, with corresponding functions/modules, if needed. While
S CALENE is a Python profiler, it relies on widely available characteristics of scripting language implementations. (1): Perl’s default configuration
disables its internal allocator (-Dusemymalloc=n). (2): Tcl/Tk’s default configuration also disables its internal allocator (-DUSE_TCLALLOC=0).
(3): Python’s allocator can be redirected by setting the environment variable PYTHONMALLOC=malloc. (4): Lua’s allocator can be changed via
the function lua_setallocf(). (5): PHP’s allocator can be redirected by setting the environment variable USE_ZEND_ALLOC=0. (6): Ruby
invokes malloc for objects larger than 512 bytes, but does not provide a facility for interposing on smaller object allocations.
the worst-case for profiling overheads; overheads are likely Normalized profiler execution time (julia)
60.0
to be substantially lower in applications that spend more time 50.5
50.0
in I/O operations.
40.0
29.8
30.0
Benchmarks. While there is a standard benchmark suite 19.3
20.0
for Python known as pyperformance, most of the included 11.6
10.0
benchmarks are microbenchmarks, running in many cases 1.0 1.5 1.4
3.1
1.1 1.0 1.0 1.8
0.0
for less than a second. As these are too short lived for our
r
at
u
t
y
e
t
ile
e
l l)
)
ck
il e
de
PU
en
sp
fil
lin
cp
st
(fu
clo
of
purposes, we conduct our evaluation on one of the longest run-
ro
of
_
e_
m
i_
(C
se
e_
Pr
py
cP
all
pr
ru
ne
pp
fil
ba
fil
ne
e_
w
st
ro
le
ya
ro
le
i_
in
a
lin
pp
pp
a
ning benchmarks, bm_mdp, which simulates battles in a game
Sc
pp
py
Sc
ya
and whose core involves topological sorting. This benchmark
(a) Overhead running the Julia benchmark.
takes roughly five seconds. We also use as a benchmark pro-
gram an example used as a basis for profiling in a book on Normalized profiler execution time (mdp)
60.0
high-performance Python, which we refer to as julia [11,
50.0
Chapter 2]; this benchmark computes the Julia set (a frac-
tal) and runs for seven seconds. We modify the benchmarks 40.0
35.7
slightly by adding @profile decorators, as these are required 30.0
by some profilers; we also add code to ignore the decorators 20.0 15.9
when they are not used. In addition, we had to add a call to 10.0
9.7
4.6
2.1
system.exit(-1) to force py-spy to generate output. We 0.0
1.4 1.2 1.0 1.2 1.1 1.3
report the average of three consecutive runs.
t
y
t
ile
e
r
l l)
)
at
ck
u
de
PU
en
il e
sp
fil
cp
(fu
st
clo
of
ro
_
of
e_
m
(C
i_
e_
Pr
py
cP
all
ru
ne
pr
pp
fil
ne
fil
Figure 4 provides these results. In general, S CALENE (CPU
w
e_
st
ro
le
ya
ro
le
i_
in
a
pp
lin
pp
a
Sc
pp
py
Sc
ya
only) imposes virtually no overhead, while the full S CALENE
imposes between 26% and 53% overhead. (b) Overhead running the mdp benchmark.
Figure 4: Profiling overheads. Despite collecting far more detailed
4.2 Memory Profiling Overhead information, S CALENE is competitive with the best-of-breed CPU
profilers, imposing no perceivable overhead in its CPU-only version,
The profilers we examine include just one memory profiler and between 26%–53% for its full version.
(memory_profiler). That profiler’s focus is exclusively on
memory profiling; that is, it does not track CPU time at all.
Like S CALENE, memory_profiler works at a line granular-
ity, reporting only average net memory consumption.
We sought to perform an empirical comparison of
memory_profiler’s performance against S CALENE. Unfor- the Julia benchmark, we allowed it to run for over 2 hours, but
tunately, memory_profiler is far too slow to be usable. it never completed. In other words, its slowdown is at least
While it runs for simple examples, we forcibly aborted it 1000×. By contrast, S CALENE delivers fine-grained memory
after it had run for at least 100× longer than the baseline; for usage information with vastly lower overhead.
9(a) Profiling with line_profiler. Line 15 is the clear culprit, but the reason is unclear.
(b) Profiling with S CALENE (before optimization) S CALENE reveals that line 15 is allocating and freeing memory at a high rate.
Figure 5: Case Study: This small case study illustrates how S CALENE can reveal optimization opportunities: in this case, changing a few
lines improves performance by over 1, 000× (§4.3).
4.3 Case Study When we run S CALENE on this code, we see an entirely
different story (Figure 5b). S CALENE reveals that line 15 is
In this section, we report how S CALENE can reveal previously- mostly executing in Python, but most importantly, it shows
unknown optimization opportunities in actual Python code. that it is, somewhat surprisingly, allocating and freeing objects
This case study is primarily meant to illustrate S CALENE’s at a rapid rate. In fact, this single line accounts for 81% of the
role in the optimization process, and how it improves on past object allocation activity in the program, all in Python. This
work. We note that we do not expect most users of S CALENE fact warranted investigation of the num and fact variables.
to identify such enormous optimization opportunities. Inspecting the values of num and fact made it clear that both
We examine code presented in the Python documentation are growing large fast: they are repeatedly allocating and
for the Decimal arbitary-precision library to compute exp freeing space for digits.
(ex ) [31]. Running this code on Decimal(3000) takes 12 To address this—that is, to keep the size of these numbers
seconds. A standard line-level profiler (line_profiler) re- small—we introduce a variable nf that maintains the ratio num
ports that line 15 is the bottleneck: computing the ratio num / fact. This change required the addition of a new variable,
/ fact (Figure 5a). However, line_profiler does not pro- adding one line of code, and deleting two. The result was a
vide much insight into why this is the case. drop in execution time from 12 seconds to 0.01 seconds: an
10improvement of over 1, 000×. at build time by turning on ZTS (Zend Thread Safety). Since
PHP 7.0, signal delivery has been delayed until the interpreter
regains control; unlike other scripting languages, PHP delays
5 Related Work delivering signals not just after executing one opcode but only
once the VM reaches a jump or calls instruction.
5.1 Other Scripting Languages R [15] was designed by Ross Ihaka and Robert Gentle-
Table 1 provides a breakdown of previous scripting languages man; its first release was in 1995. R is a reimplementation
by the characteristics of their standard implementations. All of the S programming language, developed in 1976 by John
are dynamically-typed languages, and their standard imple- Chambers [3], with the addition of lexical scoping. R has both
mentations are interpreters. This section describes key fea- an AST-based interpreter and a bytecode interpreter (since
tures of these scripting languages. version 2.13, released in 2011) [43]. Since its creation, R
Perl [49] was designed by Larry Wall and first released in has employed a mark-sweep-compact garbage collector. R is
1987. Unusually, Perl does not use bytecodes, instead using single-threaded and has no support for signal handling.
an abstract-syntax tree-based interpreter. It exclusively relies Finally, Ruby [22] was designed by Yukihiro Matsumoto
on a reference-counting garbage collector. Since Perl 5.8, (a.k.a., “Matz”) and first released in 1995. Originally an
released in 2002, Perl has provided interpreter threads, which abstract-syntax-tree based interpreter, it switched to using
comprise separate interpreters per thread; unlike traditional a stack-based bytecode interpreter (“YARV” [37]) with Ruby
threads, all variables and references are thread-local unless 1.9 [52], released in 2007. Initially, like Lua, it employed a
they are explicitly shared [30]. Signal delivery is delayed until stop-the-world, mark-sweep garbage collector; generational
interpreter enters a safe state (between opcodes), also since collection was introduced in version 2.0, and incremental
Perl 5.8; previously, it had been signal-unsafe. garbage collection as of version 2.1. Like Python, Ruby has
Tcl/Tk [25, 53] was designed by John Ousterhout; its first multiple threads but these are serialized behind a global-
release was in 1988. It has used a stack-based bytecode inter- interpreter lock. Signals are only delivered to the main thread,
preter since version 8.0, released in 1997 [20, 41], replacing and they are queued until the interpreter regains control.
its original string-based interpreter. It relies exclusively on a
reference-counting garbage collector. Like Perl, Tcl imple- 5.2 Existing Python Profilers
ments a variant of interpreter threads (as an extension) [40],
with explicit sharing of variables possible via special opera- Table 2 provides a high-level overview of the features of all
tors, [50, Chapter 21]. Unlike other scripting languages dis- of the major Python profilers of which we are aware. All
cussed here, core Tcl has no built-in support for signals since but one are CPU profilers. These profilers fall into two cat-
version 8.6, though it is available in extensions [42]. egories: function-granularity and line-granularity. Most are
Python [48] was designed by Guido van Rossum and ini- less efficient than S CALENE (particularly in its CPU-only
tially released in 1990. It is a stack-based bytecode interpreter. mode), notably those that rely on Python’s built-in support
It has a reference-counting garbage collector, but there is also for profiling (the setprofile and setttrace calls from the
an optional gc module that performs mark-sweep garbage sys and threading modules). Some fail to record informa-
collection. Only one thread at a time can execute in the inter- tion accurately for multi-threaded applications. None perform
preter, which is protected by a global lock (the global inter- scripting-aware profiling.
preter lock, a.k.a., “the GIL”). Signals are delivered only to Two of the profilers operate in different modes. Like S CA -
the main thread, and delayed until VM regains control. LENE, yappi can perform either CPU-time or wall-clock pro-
Lua [13, 14] was designed by Roberto Ierusalimschy; its filing. However, yappi’s CPU-time profiling mode does not
first release was in 1993. Lua’s interpreter is register-based, use sampling, making it inefficient, degrading performance by
rather than bytecode-based. Lua has never had reference- 10×–20×. The wall-clock version is considerably more effi-
counting, relying on stop-the-world mark-sweep garbage col- cient, though it still imposes performance penalties ranging
lection until incremental GC was added in version 5.1, re- from 2×–3×. Like yappi, pprofile has two different ver-
leased in 2006. Lua had no threads of any kind until version sions: one is deterministic, relying on instrumentation, while
4.1; it now has cooperative (non-preemptive) threads. Signals the other uses sampling. The sampling version imposes low
are delayed until the VM regains control. overhead, but the deterministic version imposes the highest
PHP [51] was designed by Rasmus Lerdorf and first re- performance penalties of any CPU profiler we study: from
leased in 1994. Its interpreter is similar to a register-based 30×–50×.
bytecode (three-address based). It uses a reference-counting
garbage collection, but added a backup cycle collector based 5.3 Profilers for Other Scripting Languages
on Bacon and Rajan’s synchronous cycle collection algo-
rithm [2] in PHP 5.3, released in 2009. PHP’s default config- Like previous Python profilers, profilers for other scripting
uration is NTS (Not Thread Safe); threading can be enabled languages are essentially variants of traditional profilers for
11systems languages; none are scripting-language aware. References
Next to Python, Ruby is the scripting language with the [1] L. Andersen, V. St-Amour, J. Vitek, and M. Felleisen. Feature-
most profilers in wide use. Rbspy is an efficient sampling- specific profiling. ACM Transactions on Programming Lan-
based profiler that inspired the development of Py-Spy [9]. An- guages and Systems (TOPLAS), 41(1):1–34, 2018.
other profiler for Ruby, stackprof, optionally performs object [2] D. F. Bacon and V. T. Rajan. Concurrent cycle collection in
sampling after every so many allocations [17]. Unlike S CA - reference counted systems. In J. L. Knudsen, editor, ECOOP
LENE , this sampling does not integrate with CPU sampling, 2001, volume 2072 of Lecture Notes in Computer Science,
nor does it perform any scripting-language aware profiling pages 207–235. Springer, June 2001.
such as separate CPU/memory attribution, tracking memory [3] R. A. Becker, J. M. Chambers, and A. R. Wilks. The New S
usage over time or reporting copy volume. Finally, Ruby also Language. Chapman and Hall/CRC, 1988.
has a MemoryProfiler that precisely tracks object allocations
[4] M. Belanger and D. Deville. How we rolled out one
at the line granularity, imposing considerable overheads (up to
of the largest Python 3 migrations ever - Dropbox.
5×) [36]. Like stackprof, MemoryProfiler cannot simultane- https://dropbox.tech/application/how-we-rolled-
ously perform CPU profiling and memory allocation tracking. out-one-of-the-largest-python-3-migrations-ever,
R’s standard profiler is Rprof, a line-granularity sampling- Sept. 2018.
based profiler for CPU and memory consumption; it does [5] E. D. Berger, B. G. Zorn, and K. S. McKinley. Composing
not measure CPU time or memory consumed by native code high-performance memory allocators. In M. Burke and M. L.
in libraries. Andersen et al. describe feature-specific pro- Soffa, editors, Proceedings of the 2001 ACM SIGPLAN Confer-
filing [1], a profiling approach that focuses on attributing ence on Programming Language Design and Implementation
costs to specific language features, such as pattern match- (PLDI), Snowbird, Utah, USA, June 20-22, 2001, pages 114–
ing or dynamic dispatch. They present an implementation of 124. ACM, 2001.
this profiler for R that uses Rprof’s sampler. Most feature- [6] T. Bunce and A. Kaplan. Devel::NYTProf. https:
specific profiling they describe is orthogonal and complemen- //blog.timbunce.org/2009/12/24/nytprof-v3-worth-
tary to scripting-language aware profiling. One use case they the-wait/.
describe—identifying when R’s copy-on-write policy fails, [7] S. Cip. Yappi: Yet Another Python Profiler. https://github.
resulting in deep copies—would be subsumed by S CALENE’s com/sumerc/yappi.
copy volume profiling. A previous R profiler, lineprof, also [8] N. Diakopoulous, M. Bagavandas, and G. Singh. In-
reports the number of vector duplications. teractive: The top programming langauges. https:
//spectrum.ieee.org/static/interactive-the-top-
Profilers for other scripting languages are conventional.
programming-languages-2019, 2019.
Profilers for Lua include LuaProfiler [38], LuaTrace [21],
and Pro-Fi [29], all function granularity CPU profilers. Simi- [9] J. Evans. rbspy. https://rbspy.github.io/.
larly, the standard Tcl profiler is also a function-level profiler. [10] B. Frederickson. py-spy: Sampling profiler for Python pro-
Perl has a variety of profilers, include Devel::DProf (also grams. https://github.com/benfred/py-spy.
function granularity), Devel::SmallProf (line granularity), [11] M. Gorelick and I. Ozsvald. High Performance Python: Prac-
Devel::FastProf (a faster variant of Devel::SmallProf tical Performant Programming for Humans. O’Reilly Media,
written in C); the most sophisticated profiler for Perl is 2020.
Devel::NYTProf, which performs profiling at the file, func- [12] S. L. Graham, P. B. Kessler, and M. K. McKusick. gprof: a call
tion, “block”, and line granularity [6]. graph execution profiler. In SIGPLAN Symposium on Compiler
Construction, pages 120–126. ACM, 1982.
[13] R. Ierusalimschy, L. H. de Figueiredo, and W. C. Filho. Lua-
an extensible extension language. Software - Practice and
Experience (SPE), 26(6):635–652, 1996.
6 Conclusion
[14] R. Ierusalimschy, L. H. de Figueiredo, and W. C. Filho. The
evolution of Lua. In B. G. Ryder and B. Hailpern, editors,
This paper introduces scripting-aware profiling, and presents Proceedings of the Third ACM SIGPLAN History of Program-
a prototype scripting-aware profiler for Python called S CA - ming Languages Conference (HOPL-III), San Diego, Califor-
LENE. S CALENE both sidesteps and exploits characteristics of nia, USA, 9-10 June 2007, pages 1–26. ACM, 2007.
Python—and typical of most scripting languages—to enable [15] R. Ihaka and R. Gentleman. R: A Language for Data Analy-
it to deliver actionable information to Python developers. Its sis and Graphics. Journal of Computational and Graphical
pervasive use of sampling coupled with its runtime system Statistics, 5(3):299–314, 1996.
allow it to capture detailed information with relatively mod- [16] Instagram Engineering. Python - Instagram Engineer-
est overhead. S CALENE has been released as open source at ing. https://instagram-engineering.com/tagged/
https://github.com/emeryberger/scalene. python, 2019.
12[17] A. G. Karmani. stackprof - a sampling call-stack profiler for [37] K. Sasada. YARV: Yet Another RubyVM: Innovating the Ruby
Ruby 2.1+. https://github.com/tmm1/stackprof. Interpreter. In Companion to the 20th Annual ACM SIGPLAN
[18] R. Kern. line_profiler: Line-by-line profiling for Python. Conference on Object-Oriented Programming, Systems, Lan-
https://github.com/pyutils/line_profiler. guages, and Applications, page 158–159, New York, NY, USA,
2005. ACM.
[19] R. Komorn. Python in production engineer-
ing. https://engineering.fb.com/production- [38] L. Silveira, M. Osorio, and F. Mascarenhas. LuaProfiler.
engineering/python-in-production-engineering/, https://github.com/luaforge/luaprofiler.
May 2016.
[20] B. T. Lewis. An On-the-fly Bytecode Compiler for Tcl. In [39] Stack Overflow. Stack Overflow Developer Survey
M. Diekhans and M. Roseman, editors, Fourth Annual USENIX 2019. https://insights.stackoverflow.com/survey/
Tcl/Tk Workshop 1996. USENIX Association, July 1996. 2019, 2019.
[21] G. Leyland. LuaTrace - a tool for tracing Lua script execution [40] Tcl Developer Xchange. Tcl Threading Model. https://www.
and analysing time profiles and coverage. https://github. tcl.tk/doc/howto/thread_model.html.
com/geoffleyland/luatrace.
[22] Y. Matsumoto. Ruby in a nutshell - a desktop quick reference. [41] Tcl Developer Xchange. Tcl/Tk 8.0. http://www.tcl.tk/
O’Reilly, 2002. software/tcltk/8.0.html, 1999.
[23] Netflix Technology Blog. Python at Netflix. [42] Tcler’s Wiki. signal. https://wiki.tcl-lang.org/page/
https://netflixtechblog.com/python-at-netflix- signal.
bba45dae649e, Apr. 2019.
[24] S. O’Grady. The RedMonk Programming Language Rankings: [43] L. Tierney. A Byte Code Compiler for R. http://www.stat.
January 2020. https://redmonk.com/sogrady/2020/02/ uiowa.edu/~luke/R/compiler/compiler.pdf, 2019.
28/language-rankings-1-20/.
[44] TIOBE Software BV. TIOBE Index for May 2020. https:
[25] J. K. Ousterhout. Tcl: An embeddable command language.
//www.tiobe.com/tiobe-index/.
In Proceedings of the USENIX Summer 1990 Technical Con-
ference, pages 133–146, Anaheim, California, USA. USENIX [45] D. Trotter. Grumpy: Go running Python! https:
Association. //opensource.googleblog.com/2017/01/grumpy-
[26] J. K. Ousterhout. Scripting: Higher level programming for the go-running-python.html, Jan. 2017.
21st century. Computer, 31(3):23–30, 1998.
[46] E. R. Tufte. Beautiful Evidence. Graphics Press, 2006.
[27] F. Pedregosa and P. Gervais. memory_profiler: Monitor
memory usage of Python code. https://github.com/
[47] G. van der Meer. How we use Python at Spo-
pythonprofilers/memory_profiler.
tify. https://labs.spotify.com/2013/03/20/how-we-
[28] V. Pelletier. pprofile: Line-granularity, thread-aware deter- use-python-at-spotify/, Mar. 2013.
ministic and statistic pure-Python profiler. https://github.
com/vpelletier/pprofile. [48] G. van Rossum. A tour of the Python language. In TOOLS
[29] L. Perkin. Pro-fi. https://gist.github.com/perky/ 1997: 23rd International Conference on Technology of Object-
2838755, 2012. Oriented Languages and Systems, page 370. IEEE Computer
Society, July 1997.
[30] Perl::DOC. threads - perldoc.perl.org. https://perldoc.
perl.org/threads.html. [49] L. Wall and R. L. Schwartz. Programming Perl, 1st Edition. A
[31] E. Price, F. Batista, R. Hettinger, Aahz, and S. Krah. decimal nutshell handbook. O’Reilly, 1992.
— Decimal fixed point and floating point arithmetic. https:
//docs.python.org/3/library/decimal.html. [50] B. B. Welch, K. Jones, and J. Hobbs. Practical Programming
in Tcl/Tk. Prentice Hall Professional, 2003.
[32] J. Rickerby. pyinstrument: Call stack profiler for Python.
https://github.com/joerick/pyinstrument. [51] Wikipedia contributors. PHP — Wikipedia, the free encyclo-
[33] A. Rigo and S. Pedroni. PyPy’s approach to virtual machine pedia. https://en.wikipedia.org/w/index.php?title=
construction. In P. L. Tarr and W. R. Cook, editors, Companion PHP&oldid=958604132, 2020. [Online; accessed 25-May-
to the 21th Annual ACM SIGPLAN Conference on Object- 2020].
Oriented Programming, Systems, Languages, and Applications,
pages 944–953. ACM, Oct. 2006. [52] Wikipedia contributors. Ruby MRI — Wikipedia, the free
encyclopedia. https://en.wikipedia.org/w/index.php?
[34] B. Rosen and T. Czotter. The Python Profilers (cPro-
title=Ruby_MRI&oldid=950801691, 2020. [Online; ac-
file). https://docs.python.org/3.8/library/profile.
cessed 24-May-2020].
html.
[35] J. Roskind. The Python Profilers (profile). https://docs. [53] Wikipedia contributors. Tcl — Wikipedia, the free encyclo-
python.org/3.8/library/profile.html. pedia. https://en.wikipedia.org/w/index.php?title=
[36] S. Saffron. MemoryProfiler. https://github.com/ Tcl&oldid=958396007, 2020. [Online; accessed 24-May-
SamSaffron/memory_profiler. 2020].
13You can also read