Some Investigations on a Possible Relationship between Ground Deformation and Seismic Activity at Campi Flegrei and Ischia Volcanic Areas ...
←
→
Page content transcription
If your browser does not render page correctly, please read the page content below
geosciences
Article
Some Investigations on a Possible Relationship between
Ground Deformation and Seismic Activity at Campi
Flegrei and Ischia Volcanic Areas (Southern Italy)
Ciro Ricco 1 , Simona Petrosino 1 , Ida Aquino 1, *, Carlo Del Gaudio 1 and Mariarosaria Falanga 2
 1    Istituto Nazionale di Geofisica e Vulcanologia, Sezione di Napoli—Osservatorio Vesuviano,
      80124 Naples, Italy; ciro.ricco@ingv.it (C.R.); simona.petrosino@ingv.it (S.P.);
      carlo.delgaudio@ingv.it (C.D.G.)
 2    Dipartimento di Ingegneria dell’Informazione ed Elettrica e Matematica applicata/DIEM, Università degli
      Studi di Salerno, 84084 Fisciano, Italy; mfalanga@unisa.it
 *    Correspondence: ida.aquino@ingv.it; Tel.: +39-081-6108-337

 Received: 19 March 2019; Accepted: 8 May 2019; Published: 15 May 2019

 Abstract: In the present paper, we analyse ground tilt and seismicity at Campi Flegrei caldera and
 Ischia Island, two volcanic areas located in the south of Italy. These areas have been well studied for
 many years from a petrological, volcanological and geophysical view point. Moreover, due to the
 high seismic and volcanic risk for the populations living there, they are continuously monitored by
 networks of geophysical and geochemical sensors. We summarize the most important results that we
 obtained so far, concerning the observations of relationships between seismic activity and ground
 tilt anomalies, focusing on the time interval 2015–2018. First, we present a detailed description of
 the tiltmeter and seismic networks in both the investigated areas, as well as their development and
 improvement over time that has enabled high quality data collection. From the joint analysis of the
 seismic and borehole tiltmeter signals, we often notice concurrence between tilt pattern variations
 and the occurrence of seismicity. Moreover, the major tilt anomalies appear to be linked with the
 rate and energy of volcano-tectonic earthquakes, as well as with exogenous phenomena like solid
 Earth tides and hydrological cycles. The analysis that we present has potential applicability to other
 volcanic systems. Our findings show how the joint use tilt and seismic data can contribute to better
 understanding of the dynamics of volcanoes.

 Keywords: ground deformation; seismic phenomena; Campi Flegrei Caldera; Ischia Island; volcanic
 risk; seismic and tiltmeter networks; ground tilt anomalies

1. Introduction
     A multidisciplinary analysis of data coming from different fields, such as tilt and
seismic observations, represents a successful strategy to investigate the dynamics of volcanoes.
Ground deformation related to fracture processes or induced by fluid mass movements are often
associated with the occurrence of seismicity, and the two phenomena can be interpreted in a unified
framework. For example, joint investigation of tilt and seismic data has revealed inflation-deflation
cycles associated with gas recharge and discharge in volcano conduit or with magma pressurization at
shallow depths, as has been found at Stromboli [1] and Montserrat [2], respectively. The hypothesis of
a shallow source associated with a steam-filled crack has also been proposed at Mount St. Helen [3],
on the basis of the correlation between ground tilt and local seismicity. Tilt offsets have clearly been
observed concurrent with seismic swarms, as in the case of Etna where the offset associated with the
seismic swarm on January 2001 indicated the occurrence of both seismic and aseismic deformation
mechanisms related to a fluid-driven faulting episode [4]. A strong reversal of the tilt direction was also

Geosciences 2019, 9, 222; doi:10.3390/geosciences9050222                      www.mdpi.com/journal/geosciences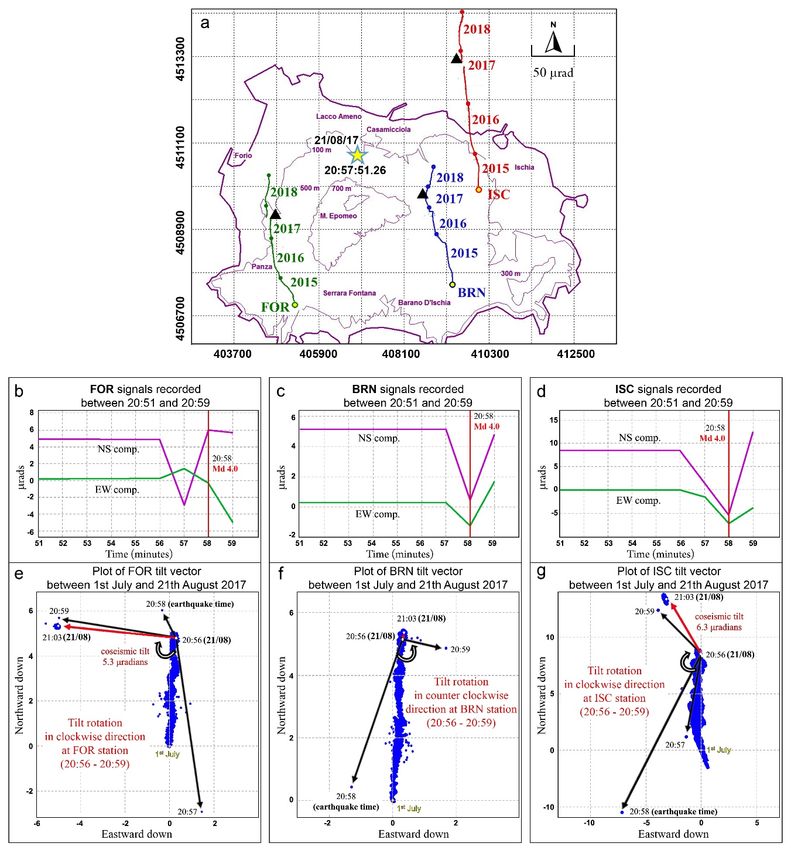
Geosciences 2019, 9, 222                                                                              2 of 24

detected at Vesuvius between the end of 2000 and the first months of 2001 and it was likely related to
the consistent reduction of the energy released by local earthquakes, after the strong seismic crises that
affected the volcano in late 1999–2000 [5]. Continuous and high resolution tilt measurements are crucial
for monitoring purposes. Precursory phenomena of volcanic eruptions, like ground deformations
induced by the ascent of magma can often be small and difficult to detect. As a result, monitoring
instruments and surveying techniques that have sub-centimetric accuracy must be used [4]. The tilt
data correlated with seismic, explosive and pyroclastic activity have been even used to forecast times
of increased volcanic hazard [2].
     The assessment of the seismic and volcanic risk is particularly relevant in densely populated areas.
The volcanoes of the Neapolitan District (Campi Flegrei, Vesuvius and Ischia) are considered among
the most dangerous in the world; the risk being very high because it is strongly urbanized and also
includes an impressive historical, artistic and cultural heritage. Numerous studies (see Section 2 and
references therein) have been conducted on these volcanoes to model their dynamics and improve
eruption forecasts.
     Due to a necessity to improve the monitoring system, the geodetic and seismic networks have
undergone several technical upgrades throughout the years, thus allowing reliable joint analysis of
ground tilt and seismicity. The study of ground deformation in the Campanian volcanic area during
the past 20 years has been carried out by using surface tiltmeters that are accurately installed in isolated
locations protected from strong environmental factors [6,7]. A great development in the last 5 years
has taken place with the use of tilt sensors in deep holes [8]. Similarly, from a seismological view
point, there has also been a significant increase over time in both the density and the quality of the
instruments, improving the network performance [9,10]. The progressive upgrade of the seismic
network has been paralleled by the development of more accurate analysis techniques [9,11–14].
     In this paper, we analyse data recorded by the tiltmeter and seismic networks operating at
Campi Flegrei, with the aim of providing a further contribution to the understanding of the link
between ground deformation and seismic activity. In particular, we focus on the 2015–2018 interval,
due to the availability of high quality data from new borehole tiltmeters (Figure 1). A similar
investigation is also carried out at Ischia Island. From the joint analysis of tilt and seismic data, we find
evidence of relationships between tilt patterns and the rate and energy of volcano-tectonic earthquakes.
Moreover, we identify tilt anomalies related to both high energy seismic swarms and to external
sources such as Earth tidal and hydrological cycles. These relationships suggest that the observed
ground deformation trend is the result of a complex superposition of the endogenous dynamics and
exogenous processes.

2. Geological and Geophysical Background
       The Phlegraean Volcanic District is one of the most hazardous volcanic areas in the world,
consisting of the Campi Flegrei caldera, the volcanic islands of Ischia and Procida, and a number of
submerged vents, aligned in the NE-SW direction [15–21] (Figure 1b). The Phlegraean Volcanic District
originated following the Pliocene-Quaternary extension, which generated the graben of the Campanian
Plain between the western sector of the Appenine Chain and the eastern margin of the Tyrrhenian Sea.
It is composed mostly of monogenetic centers, with fissure-type magmatic systems [19–23].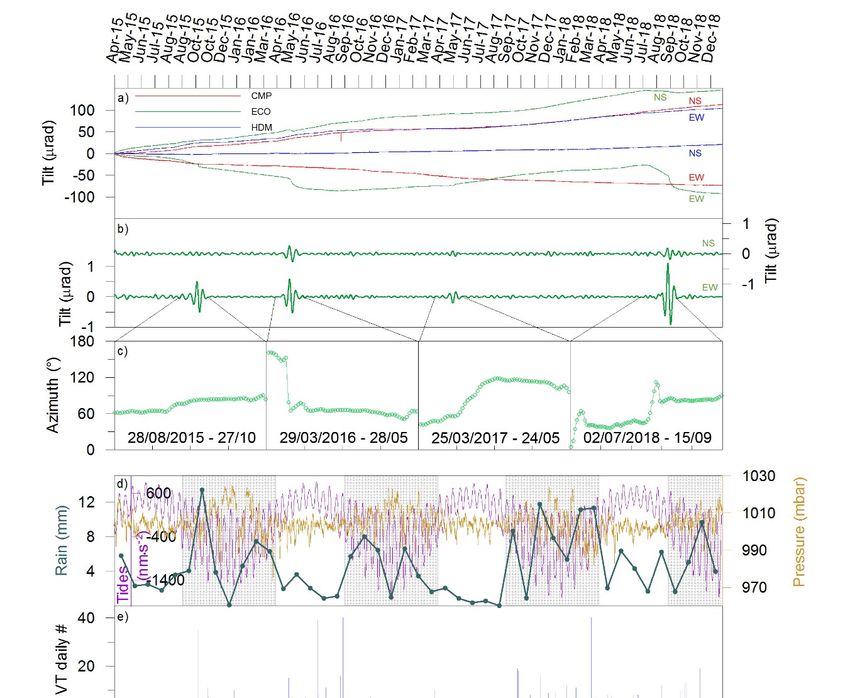
Geosciences 2019, 9, 222 3 of 24
Geosciences 2019, 9, x FOR PEER REVIEW 3 of 25
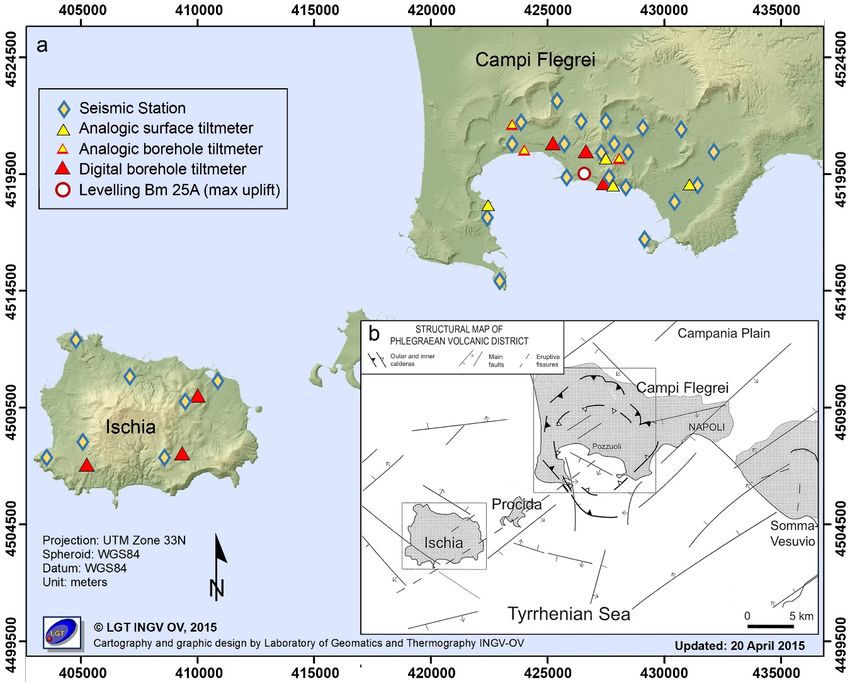
Figure 1. (a)Tiltmeter (triangles) and seismic (diamonds) network for ground monitoring at Campi
Flegrei and Ischia Island. The
The inset
inset (b) show the Geological and Structural map of the Phlegraean
Phlegraean
Volcanic District,
Volcanic District, modified
modifiedfrom
from[20].
[20].
2.1. Campi Flegrei
2.1. Campi Flegrei
The
The Campi
Campi Flegrei
Flegrei caldera
caldera isis commonly
commonly considered
considered one one of
of the
the most
most dangerous
dangerous active
active volcanic
volcanic
systems on Earth, extending into a densely inhabited metropolitan region
systems on Earth, extending into a densely inhabited metropolitan region on the western on the western edge ofedge
Napoli
of
bay (Southern Italy). In fact, the western suburbs of the city of Naples lie within
Napoli bay (Southern Italy). In fact, the western suburbs of the city of Naples lie within the calderathe caldera rim and the
town
rim andof Pozzuoli
the townisofcompletely
Pozzuoli issituated within
completely the caldera;
situated withina the
possible
caldera;explosive eruption
a possible coulderuption
explosive directly
impact more than 1 million people. This caldera 2
could directly impact more than 1 million people.covers an areacovers
This caldera of approximately 200 km defined
an area of approximately 200
by a quasi-circular depression, half onland, half offshore [24]. It is a resurgent
km² defined by a quasi-circular depression, half onland, half offshore [24]. It is a resurgent structure generated
structureby
two major collapses, the Campanian Ignimbrite (~39 ky), with an erupted
generated by two major collapses, the Campanian Ignimbrite (~39 ky), with an erupted volume of volume of products ranging
between
products 100 and 200
ranging km3 [25]
between 100 and
and the
200Neapolitan
km3 [25] and Yellow Tuff with 20–50
the Neapolitan Yellow km 3 of erupted products
Tuff with 20–50 km3 of
(~15 ky) [15,26]. Post-caldera volcanic activity has been confined within
erupted products (~15 ky) [15,26]. Post-caldera volcanic activity has been confined within the caldera and characterized
the caldera
by more than 60 eruptions, mostly explosive and some effusive
and characterized by more than 60 eruptions, mostly explosive and some effusive [15]. [15]. The last eruption occurred in
The last
1538 withoccurred
eruption the formation of awith
in 1538 scoria
thecone called Monte
formation Nuovo.
of a scoria conePreceding
called Montethe eruption
Nuovo.a Preceding
ground upliftthe
occurred in the central area of the caldera, accompanied by intense seismic activity
eruption a ground uplift occurred in the central area of the caldera, accompanied by intense seismic [21,27,28].
After
activity the Monte Nuovo eruption, Campi Flegrei has shown a complex deformation history;
[21,27,28].
indeed, ground deformation
After the Monte Nuovo exhibited
eruption, a downward
Campi Flegrei trendhas
until the middle
shown of the last
a complex century. Over
deformation the
history;
last 2 millennia, an accurate reconstruction of vertical ground movements
indeed, ground deformation exhibited a downward trend until the middle of the last century. Overhas been performed through
many
the laststudies [28–32].
2 millennia, an The bradyseism
accurate consistsof
reconstruction ofvertical
a slow subsidence
ground movementsalternating haswith
beenfast ground
performed
uplifts that are often accompanied by seismicity. In more recent times,
through many studies [28–32]. The bradyseism consists of a slow subsidence alternating with three major and several minor
fast
uplift episodes have occurred. The first bradyseismic crisis occurred between
ground uplifts that are often accompanied by seismicity. In more recent times, three major and 1950 and 1952 with a
maximum
several minor uplift of 80
uplift cm, during
episodes have which the The
occurred. population did not detect
first bradyseismic crisisany earthquakes
occurred between [31]. Inand
1950 the
1952 with a maximum uplift of 80 cm, during which the population did not detect any earthquakes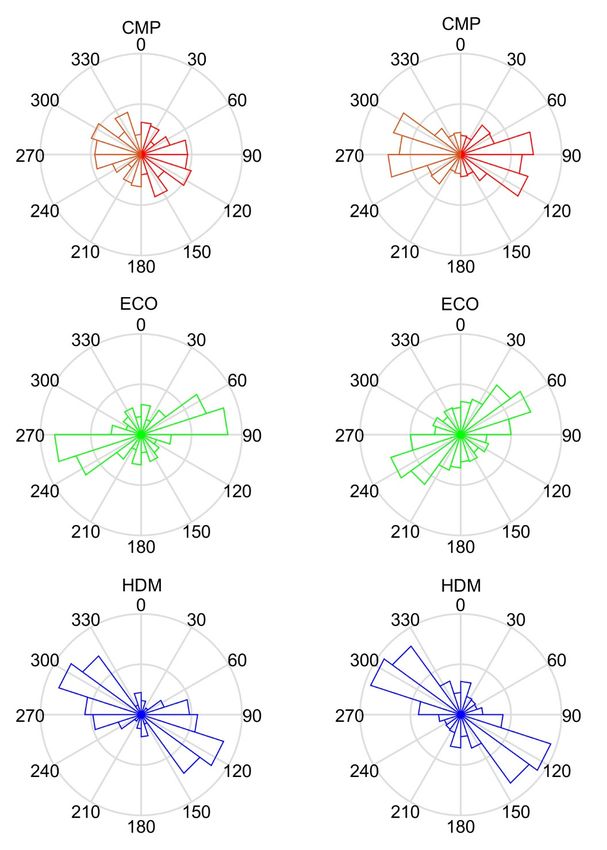
Geosciences 2019, 9, x FOR PEER REVIEW                                                                           4 of 25
Geosciences 2019, 9, 222                                                                                          4 of 24

[31]. In the periods 1969–1972 and 1982–1984, two important episodes of inflation occurred,
accompanied
periods 1969–1972by seismic    crises. These
                       and 1982–1984,        two episodes
                                                  importantproduced
                                                               episodes maximum
                                                                          of inflationuplifts    of 177
                                                                                         occurred,        and 179 cm,
                                                                                                      accompanied      by
respectively,   centered  on  the  town    of  Pozzuoli   (Figure  2). The  geometrical
seismic crises. These episodes produced maximum uplifts of 177 and 179 cm, respectively,   shape   of the deformation
                                                                                                                centered
remained
on the town  constant  in time.
                of Pozzuoli       It had
                             (Figure    2). aThe
                                               circular  symmetry
                                                  geometrical    shapearound
                                                                        of the Pozzuoli
                                                                                deformationandremained
                                                                                                 regularlyconstant
                                                                                                             decreased in
towards    the amargin
time. It had             ofsymmetry
                  circular  the caldera       [33–36].
                                          around        Both the
                                                    Pozzuoli    and1969–1972
                                                                     regularly and    1982–1984
                                                                                 decreased          uplifts
                                                                                              towards    thehave
                                                                                                             margin been
                                                                                                                       of
attributed
the calderato[33–36].
                a magmatic
                        Both intrusion
                               the 1969–1972 [32]. After  1984, minor
                                                   and 1982–1984        deformation
                                                                     uplifts  have been  episodes   occurred
                                                                                           attributed            in 1989,
                                                                                                        to a magmatic
1994  and 2000.
intrusion         Starting
            [32]. After    from
                        1984,     2005,
                               minor      a new ground
                                        deformation         uplift occurred
                                                        episodes   began. This    uplift1994
                                                                              in 1989,   has different
                                                                                              and 2000.characteristics
                                                                                                          Starting from
in fact, the  rate of deformation      since   2005 is about   20 times  slower    compared
2005, a new ground uplift began. This uplift has different characteristics in fact, the         to rate
                                                                                                   the 1969–1972     and
                                                                                                        of deformation
1982–1984    episodes.  The  last  lifting  phase   began   in 2012  and  is still ongoing   [31] (Figure
since 2005 is about 20 times slower compared to the 1969–1972 and 1982–1984 episodes. The last lifting      2). The  two
recent  uplift phases were accompanied by seismic activity both with Long Period (LP) and Volcano-
phase began in 2012 and is still ongoing [31] (Figure 2). The two recent uplift phases were accompanied
Tectonic (VT) earthquakes [37].
by seismic activity both with Long Period (LP) and Volcano-Tectonic (VT) earthquakes [37].

     Figure 2. (a) Height variation of the benchmark 25A (Bm 25A) which records the maximum vertical
     Figure 2. (a) Height variation of the benchmark 25A (Bm 25A) which records the maximum vertical
     displacement in the Campi Flegrei area in the last twenty years; the ground uplift rate in mm/month are
     displacement in the Campi Flegrei area in the last twenty years; the ground uplift rate in mm/month
     shown in green. (b) Height variations observed from 1905 to 2018 ([31] modified and supplemented
     are shown in green. (b) Height variations observed from 1905 to 2018 ([31] modified and
     with data from leveling surveys carried out after 2009). (c) Schematic map with the Bm 25A location
     supplemented with data from leveling surveys carried out after 2009). (c) Schematic map with the Bm
     (red circle) coincident with the maximum uplift measured.
     25A location (red circle) coincident with the maximum uplift measured.
    The most remarkable LP sequence started on 23 October 2006 [37] and lasted about seven days.
    The  most
During the    remarkable
           three            LP sequence
                 days of climax         started2006),
                                (26–28 October  on 23 more
                                                      October
                                                           than2006
                                                                300 [37] and
                                                                    events   lasted about
                                                                           occurred,      seven
                                                                                     located     days.
                                                                                             at depths
During the three days of climax (26–28 October 2006), more than 300 events occurred, located at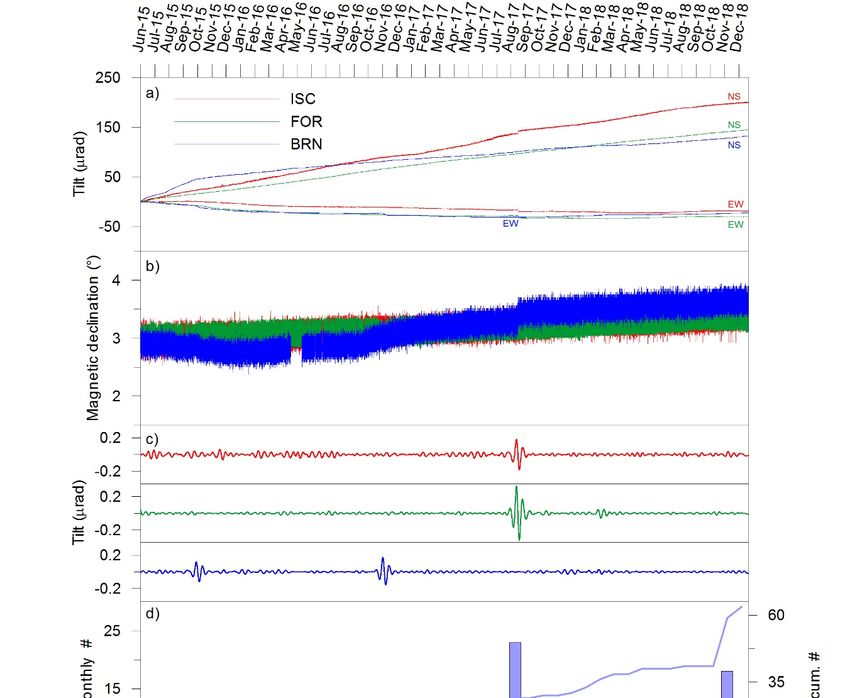
Geosciences 2019, 9, 222                                                                                5 of 24

of about 500 m b.s.l. beneath the Solfatara crater. Their source mechanism was ascribable to the
acoustic resonance of a crack filled by a water-gas mixture of hydrothermal origin [38–41]. Two minor
LP episodes were observed in January 2008 and June 2010 [42]. The VT activity shows a periodic
occurrence, alternating intense swarms lasting a few hours or even minutes, and phases of very low
seismicity rate [43]. Major seismic swarms composed of up to 200 earthquakes with duration magnitude
Md up to 2.5, were observed in October 2005, October 2006, January 2008, March 2010, September
2012, March 2014, October 2015, July 2016, August 2016, March 2018, September 2018 and October
2018 [13,14,42,43]. The most energetic earthquakes since the recent uplift phase occurred in October
2015 (Md = 2.5), July 2016 (Md = 2.1), March 2018 (Md = 2.4), September 2018 (Md = 2.5) and October
2018 (Md = 2.0). The earthquakes were generally located beneath the Solfatara-Pozzuoli area, at depths
up to 4 km b.s.l. [37,42]. The waveforms and spectral features of the VTs are indicative of a source
process involving brittle shear failure, possibly induced by the pressurization of the hydrothermal
system and fluid flow towards the surface [37,44].

2.2. Ischia Island
      The volcanic island of Ischia is located in the westernmost portion of the Phlegraean Volcanic
District (Figure 1b) and represents the subaerial portion of a volcanic field, whose activity started
around 150 ky [45]. It is located on the Tyrrhenian border of central Italy, at the intersection of regional
fault systems, with NW-SE (Appennine) and NE-SW (anti-Apennine) trends [19–23]. Ischia island rises
over 1000 m above the seabed [46] and covers an area of 46.4 km2 , it is morphologically dominated
by Mt Epomeo (787 m above sea level), located in a central sector of the island along the NE-SW
alignment of Mt Vezzi and Mt Cotto in the SE sector. The coast is characterized by steep cliffs and
some less steep slopes that plunge into the sea [19,47–50]. The volcanic activity started around
150 ky and was characterized by several effusive and explosive eruptions alternating with periods
of quiescence [23,46–48]. The most impacting event on the island is the caldera forming eruption of
the Green Tuff of Mt Epomeo, which occurred 55 ky and caused the collapse of the central sector of
the island, followed by resurgence of the Mt Epomeo block starting from 30 ky [23,48–50]. The last
eruption occurred in 1302 A.D. with the effusive eruption of Arso, located in the eastern sector of the
island [23,51,52].
      Ischia is characterized by significant ground deformation, whose first quantitative measurement
was made in 1913 by the Italian Army Geographic Institute (IGM) through a precision leveling survey
and repeated in 1967 by the Italian Geodetic Society (SGI). From 1978 to 2010, new leveling lines including
new benchmarks were installed by the Istituto Nazionale di Geofisica e Vulcanologia–Osservatorio
Vesuviano (INGV–OV) and numerous surveys have since been carried out, the latest of which was
carried out in November 2017. Starting from 1996, a network involving 17 Global Positioning System
(GPS) stations has been set up on the island [53]. At the same time, the in-situ ground deformation
monitoring of the island has been further expanded using the Differential Synthetic Aperture Radar
Interferometry (DInSAR) technique [54]. All measurements made along the geodetic network of
the island of Ischia clearly show a persistent and significant subsidence, which can be observed in
particular in the central-southern and north-western sectors of the island with movements of the
order of 1 cm/year [55,56]. The results obtained from the high precision leveling survey carried out in
November 2017 in the northwestern area of the island identify a localized and pronounced anomaly
of ground deformation in the epicentral area of the recent Md 4.0 earthquake, which occurred on
21 August 2017 [8].
      The seismicity of the island is mainly located in the northern sector and it is related to the resurgent
block of Mt Epomeo. In the past, the activity was intense: strongest historical earthquakes (VIII < I < XI
MCS) occurred in the eighteenth and nineteenth centuries [57,58]. We recall the destructive earthquakes
of March 4, 1881 (I = IX MCS, [59,60]) and 28 July 1883 (Imax = XI MCS and M = 5.2, [57,60]).
      Recent seismicity of Ischia consists of low-magnitude earthquakes, most part of them located at
depths shallower than 2 km [10]. In 2017, on August 21 an earthquake of Md = 4.0 (moment magnitude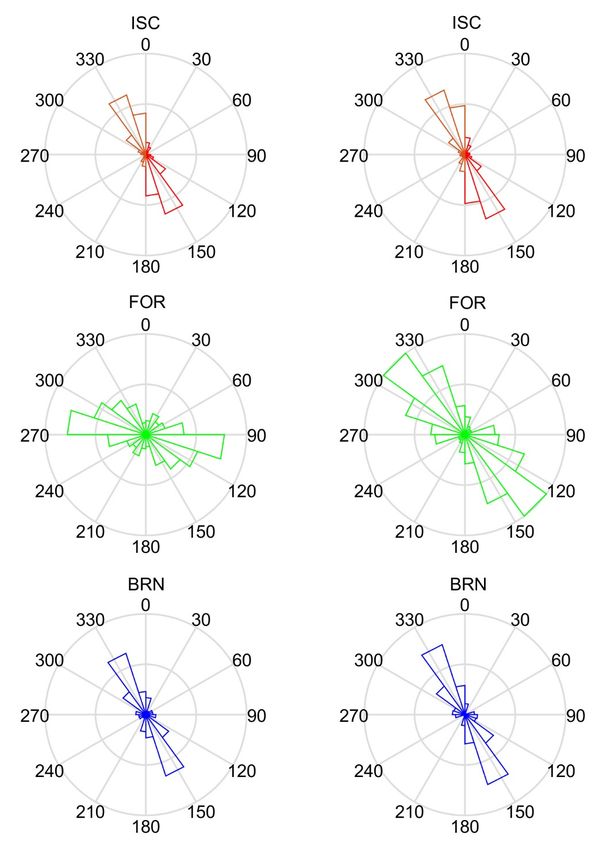
Geosciences 2019, 9, 222                                                                           6 of 24

Mw = 3.9) occurred, causing severe damage in the area of Casamicciola. This event (hereafter referred
to as EQ2017) was located at about 1.2 km b.s.l. and it was followed by a seismic sequence of about
30 earthquakes. Since that date, the rate of seismicity has remained low. The last relevant sequence
occurred in November 2018 and consisted of 20 earthquakes with maximum Md of 0.7.

3. Tilt and Seismic Measurements: Data Analysis and Results

3.1. Campi Flegrei
       The tiltmeter network for the monitoring of ground deformation induced by phlegraean
bradyseism has a long history dating back to 1985 [6,7]. In 2006, the tiltmeter network consisted of
five analog surface tilmeters and two analog borehole tiltmeters installed at 7 and 5 m depth but later,
from 2006 to 2011, three more surface stations were installed in locations of low background noise.
In 2013, another analog borehole tiltmeter close to Pisciarelli fumarole field (near Solfatara) at 1.5 m
depth was installed. Finally, in 2015, three borehole stations equipped with digital sensors of the
model “Lily Self-Leveling Borehole Tiltmeter” were installed into 25 m deep wells [61,62] (Figure 1).
The stainless steel instruments have a cylindrical shape with dimensions of 51 × 915 mm. At the
bottom, an electrolyte bubble and temperature sensors, and a magnetic compass (to detect the change of
magnetic declination, counter clockwise from N), are positioned. The sensing device is a self-levelling
sensor on a range of ± 10 degrees, with a dynamic range of ± 330 µradians and a resolution less than
5 nradians [63]. Ground tilt variations are measured along two orthogonal directions NS and EW; they
are recorded with a sampling rate of 1 sample (defined as the average of 8000 readings) per minute.
       The seismic network managed by the INGV–OV is composed of both permanent installations
and mobile deployments (Figure 1). Since 2005 the seismic network has undergone to several
technological improvements. The analog permanent stations are equipped with short-period 1 Hz
seismometers (Mark L4C, 1 Hz Lennartz LE-3Dlite, Geotech S13); the digital dataloggers are coupled
with three-component broadband seismometers (Guralp CMG40T, Guralp 3TB/5TB, Trillium 120 P).
The signals are continuously recorded at 100 sps and telemetered to the acquisition centre. The mobile
network consists of stand-alone dataloggers with both 1 Hz (Lennartz LE-3Dlite) and three-component
broadband sensors (Lennartz LE3D/20s, Geotech KS2000, Guralp CMG-40T). The data are sampled at
the rates of 125 Hz or 100 Hz. The updated configuration of the seismic network is reported at the URL
www.ov.ingv.it and further details can be found in [9].
       From historical observations, leveling surveys, GPS and DInSar measurements, the centroid of the
deformation field is permanently located in Pozzuoli [42,53,54]. The radiality of the observed
deformation constitutes a first-order effect due to the phases of ground uplift and deflation.
However, epochs in which the angular component of the strain undergoes sharp changes over
time are superimposed to the general trend. These variations, here called tilt reversal, are recorded
only by tiltmeters that measure the non-diagonal components (i , j) of the deformation tensor (pure
tilt in a solid halfspace) [64].
       Since 2015, the three borehole instruments (CMP, ECO and HDM) for which the background
noise is greatly reduced, provides time series that are easier to interpret than the superficial ones.
For these tiltmeters, the inclination detected by the NS components have always been consistent with
the deformation recorded by the vertical component of the GPS stations located nearby. In addition,
the resulting tilt vector obtained from the composition of the NS and EW component, provides
directions of ground inclination generally congruent with those obtained from the deformation field
induced by uplift of Pozzuoli only for CMP and HDM (located respectively at NNW and ESE of
Pozzuoli). Conversely, the ECO station, located NE of Pozzuoli, tilted in line with the uplift only from
March 2017 to July 2018; before this time interval its tilting direction was NW and then W.
       Based on the clear symmetry of the tilt pattern at ECO station, we identified on the hodograph the
points where there is an abrupt switch in tilting direction (Figure 3).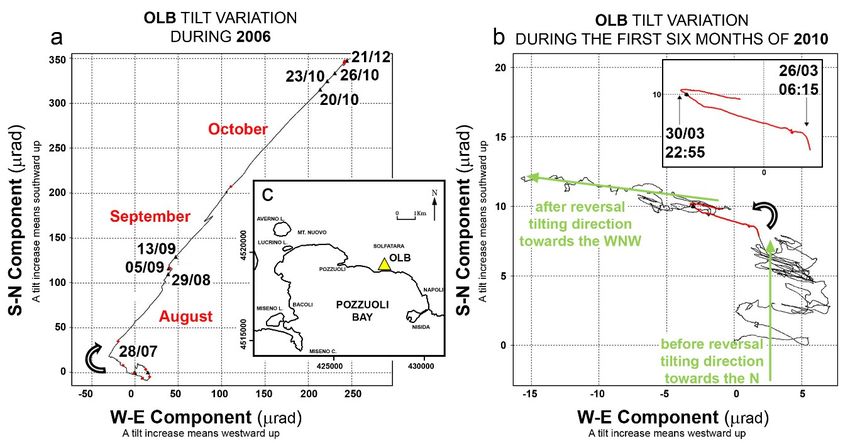
Geosciences
Geosciences       9, x9,FOR
              2019,
            2019,        222 PEER REVIEW                                                                              7 of7 of
                                                                                                                            25 24

       Figure
     Figure     3. Schematic
             3. Schematic  mapmap   of Campi
                                 of Campi       Flegrei,
                                             Flegrei,    superimposed
                                                      superimposed     onon   a grid
                                                                           a grid      representing
                                                                                   representing   thethe two-dimensional
                                                                                                       two-dimensional
       plane  of ground  inclinations,  in which  each  mesh  is equivalent  to a tilt variation of 50
     plane of ground inclinations, in which each mesh is equivalent to a tilt variation of 50 μradians.µradians.  TheThe
                                                                                                                      three
       sites CMP,   ECO   and  HDM     are  distinguished   by   different colors   (red, green
     three sites CMP, ECO and HDM are distinguished by different colors (red, green and blue,    and   blue, respectively),
       as well as the
     respectively),     curves
                     as well      thatcurves
                              as the   originate
                                              that from   them:
                                                    originate     thethem:
                                                               from    latterthe
                                                                              indicates    the cumulative
                                                                                  latter indicates           tilt variation
                                                                                                     the cumulative   tilt
       (hodograph) recorded since 29 March 2015 to 31 December 2018. The roman numerals indicate four
     variation (hodograph) recorded since 29 March 2015 to 31 December 2018. The roman numerals
       time subintervals separated by the occurrence of a tilt reversal episode (TR) and characterized by
     indicate four time subintervals separated by the occurrence of a tilt reversal episode (TR) and
       different kinematics. On the same grid the earthquakes with Md > 1.6 are shown with black triangles
     characterized by different kinematics. On the same grid the earthquakes with Md > 1.6 are shown
       and the area of maximum uplift is shown with a red circle. The light blue circle encompasses the area
     with black triangles and the area of maximum uplift is shown with a red circle. The light blue circle
       where VT seismicity occurred.
     encompasses the area where VT seismicity occurred.

        These points mark the sub-division into four time intervals that seem to be characterized by a
      These points mark the sub-division into four time intervals that seem to be characterized by a
  geometric similarity in response to distinct kinematics:
geometric similarity in response to distinct kinematics:
        Time Interval I: 29 March 2016–27 April 2016
      Time Interval I: 29 March 2016–27 April 2016
        During this time (Figures 3 and 4), the tilting direction at CMP and HDM is perfectly compatible
      During this time (Figures 3 and 4), the tilting direction at CMP and HDM is perfectly compatible
  with that induced by the ground uplift centered at Pozzuoli, while at ECO it is strongly polarized to
with that induced by the ground uplift centered at Pozzuoli, while at ECO it is strongly polarized to
  the NW. Tilting directions show a concave and convex trend respectively at CMP and ECO while HDM
the NW. Tilting directions show a concave and convex trend respectively at CMP and ECO while
  is almost straight.
HDM is almost straight.
Geosciences 2019, 9, 222                                                                                         8 of 24
Geosciences 2019, 9, x FOR PEER REVIEW                                                                          8 of 25

     Figure 4.
     Figure      Tilt direction
              4. Tilt direction patterns
                                  patterns observed
                                           observed atat each
                                                         each borehole
                                                                borehole station
                                                                         station during
                                                                                 during the
                                                                                         the four
                                                                                             four Time
                                                                                                  Time Intervals
                                                                                                        Intervals
     discussed   in the  text and  showed   in Figure 3. Tilt vectors point outwards  from the area of
     discussed in the text and showed in Figure 3. Tilt vectors point outwards from the area of maximummaximum
     uplift (shown
     uplift (shown with
                      with aa red
                              red circle).
                                  circle).

       On 77 October
      On      October 2015,
                       2015, just
                              just before
                                    before the
                                           the seismic
                                               seismic swarm,
                                                       swarm, anan evident
                                                                    evident tilt
                                                                            tilt anomaly
                                                                                 anomaly onon the
                                                                                               the signals
                                                                                                   signals acquired
                                                                                                             acquired
by the
by  the ECO
          ECO station
                station was
                         was observed;
                               observed; inin particular,
                                              particular, the
                                                          the EW
                                                               EW component
                                                                   component of  of the
                                                                                    the borehole
                                                                                        borehole digital
                                                                                                    digital tiltmeter
                                                                                                             tiltmeter
recorded     four  distinct  offsets  ranging   between   0.5 and 2.8 µradians    before four
recorded four distinct offsets ranging between 0.5 and 2.8 μradians before four out of the six  out  of the  six most
                                                                                                                  most
energetic    VTs.  In addition,   a constant  delay of 9  minutes  between   the  negative  and/or   positive
energetic VTs. In addition, a constant delay of 9 minutes between the negative and/or positive offsets           offsets
and the
and   the occurrence
           occurrence ofof the
                           the seismic
                                seismic events
                                         events was
                                                 was surprisingly
                                                     surprisingly observed,
                                                                    observed, while
                                                                               while the
                                                                                      the NS
                                                                                          NS component
                                                                                              component of    of HDM
                                                                                                                  HDM
always    showed    peaks   on the  signal 1 minute  before.  The offset and  peak  amplitudes
always showed peaks on the signal 1 minute before. The offset and peak amplitudes do not depend  do   not  depend    on
the  earthquake     magnitude.    The  pre-seismic  deformation   recorded  by   ECO  was  permanent,
on the earthquake magnitude. The pre-seismic deformation recorded by ECO was permanent, i.e.,             i.e., the site
tilted
the  siteabout
          tilted5 about
                  µradians   W and did
                        5 μradians         not did
                                       W and   recover this deformation
                                                   not recover            (Figure 5).
                                                                this deformation    (Figure 5).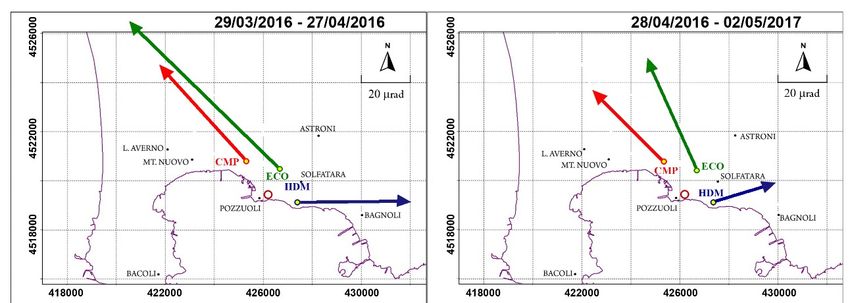
Geosciences 2019, 9, 222 9 of 24
Geosciences 2019, 9, x FOR PEER REVIEW 9 of 25
Figure5.5. Detailed
Figure Detailedanalysis
analysisof
ofthe
the4-hour
4-hourlong
longtime
timeseries
seriesrecorded
recordedbefore
beforeand
and after
afterthe earthquakes
the earthquakes of
October 7, 2015
of October observed
7, 2015 at (a)
observed atECO (EW(EW
(a) ECO component in green)
component and (b)
in green) andHDM (NS component
(b) HDM (NS component in blue).
in
The EWThe
blue). component recorded
EW component four distinct
recorded offsets ranging
four distinct betweenbetween
offsets ranging 0.5 and 0.5
2.8 and
µradians 9 minutes
2.8 μradians 9
before
minutesthebefore
four most energetic
the four VTs (redVTs
most energetic vertical
(red lines);
verticalinstead
lines); the NS component
instead of HDMofalways
the NS component HDM
showed peaks onpeaks
always showed the signal 1 minute
on the signal 1before thebefore
minute VT. (c)the
Location
VT. (c)of the ECOofand
Location theHDM
ECO and tilt stations.
HDM tilt
stations.
Time Interval II: 28 April 2016–2 May 2017
The
Time interval
Interval (Figures 3 and2016–2
II: 28 April 4) startsMaywith a strong tilting reversal (TR1) affecting both components
2017
of ECO.The interval (Figures 3 and 4) starts with where,
This epoch is characterized by kinematics a strong at CMP
tiltingand HDM (TR1)
reversal sites the deformation
affecting both
iscomponents
consistent of withECO.theThis
uplift whereas,
epoch after the by
is characterized reversal, ECOwhere,
kinematics follows at aCMP
NNW andtilting
HDMdirection.
sites the
Differently
deformation from the previous
is consistent withtime
theinterval it is further
uplift whereas, noted
after the that the tilt
reversal, ECOrecorded
follows at aCMP
NNW andtilting
ECO
shows opposite
direction. concavities.
Differently from the previous time interval it is further noted that the tilt recorded at CMP
and Time Interval
ECO shows III: 03 May
opposite 2017–13 July 2018
concavities.
Also in this case (Figures
Time Interval III: 03 May 2017–13 3 and 4), the Julyepoch
2018begins after a tilt reversal episode (TR2) with a perfect
correspondence
Also in thisbetween the deformation
case (Figures 3 and 4), the field generated
epoch begins by lifting
after a tiltofreversal
the ground and(TR2)
episode tilt response.
with a
The tilt at
perfect the three sites radiate
correspondence between outwards from the site
the deformation fieldofgenerated
maximumby deformation,
lifting of the and paths and
ground of CMPtilt
and HDM are unusually straight while ECO shows a concave trajectory.
response. The tilt at the three sites radiate outwards from the site of maximum deformation, and
paths Time
of CMPInterval
and IV:
HDM 14 July 2018–31 December
are unusually straight while2018 ECO shows a concave trajectory.
The
Time ECO tilt pattern
Interval IV: 14 (Figures 3 andDecember
July 2018–31 4) changes completely (TR3 episode) from July 14 because its
2018
direction
The rotates
ECO tiltcounterclockwise
pattern (Figures 3from andNNE to W by
4) changes more than
completely 90 degrees
(TR3 episode)while from CMP
July 14 and HDM
because
its direction
keep rotates counterclockwise
their centripetal trajectory in the samefrom radial
NNE to W by more
direction. thanone
About 90 degrees
and a half while CMPlater,
months and the
HDM tilt
keep
at the their
ECO centripetal
site reachestrajectory
the maximumin the stretching
same radial direction.
towards theAbout one and
W. Similarly toaTR1
halfand
months
TR2,later, the
TR3 also
tilt at the
occurs ECO site reaches the maximum stretching towards the W. Similarly to TR1 and TR2, TR3
aseismically.
also Before
occurs2015,aseismically.
when borehole tiltmeters had yet to be installed, at least two phenomena of tilt reversal,
were Before 2015, when
also recorded borehole
by surface tiltmeters
sensors. In latehadJulyyet2006to at
beOLB
installed,
station,at aleast two corresponding
reversal phenomena of to tilta
reversal,
great change were also
in the recorded
pattern by surface
and intensity sensors.
of the In latethe
tilt, preceded July 2006 atrecorded
seismicity OLB station, a reversal
in September and
corresponding
October of the sameto a great
year [7]change
(Figure in 6a).
the pattern
This change and takes
intensity
place of during
the tilt,anpreceded
increase the seismicity
of the ground
recorded in September and October of the same year [7] (Figure 6a). This change takes place during
an increase of the ground uplift rate (from 1.7 to 5 mm/month) measured by leveling surveys (Figure
Geosciences 2019, 9, 222 10 of 24
Geosciences 2019, 9, x FOR PEER REVIEW 10 of 25
uplift rate (from 1.7 to 5 mm/month) measured by leveling surveys (Figure 2a). In 2010, the same
2a). In 2010,
tiltmeter the same
recorded tiltmeter
another recorded
variation another
of the tilt variation
pattern four daysofbefore
the tiltthe
pattern
seismicfour daysofbefore
swarm March the
30.
seismic swarm of March 30. The anomaly consisted of a reversal followed by a persistence,
The anomaly consisted of a reversal followed by a persistence, from 26 to 30 March, of ground tilt in from 26
to 30 March, of ground tilt
the WNW direction (Figure 6b). in the WNW direction (Figure 6b).
Figure
Figure 6. 6. Plots of thethe tilt
tilt vector
vector recorded
recorded atat OLB
OLB before
before two
two seismic
seismic swarms.
swarms. (a) The The tilt
tilt reversal
reversal
observed
observedininlate lateJuly 2006,
July 2006,indicated with
indicated a semicircular
with a semicircular rightright
arrow, takes takes
arrow, place before the seismic
place before events
the seismic
of September and October of the same year. (b) The tilt reversal recorded on 26
events of September and October of the same year. (b) The tilt reversal recorded on 26 March 2010March 2010 indicated in
red with a semicircular left arrow, occurs four days before the seismic swarm of
indicated in red with a semicircular left arrow, occurs four days before the seismic swarm of late late March of the same
year
March andofinterrupts
the same the yeartilting towards the
and interrupts theN,tilting
forcing it towards
towards the the W. The inset
N, forcing showsthe
it towards theWzoom
. Theofinset
the
tilt reversal
shows and the
the zoom ofarrows
the tiltplaced onand
reversal the hodograph
the arrows showplacedtheondirection of ground
the hodograph tilting.
show the (c) Location
direction of
of the OLB tilt station.
ground tilting. (c) Location of the OLB tilt station.
The
The previous
previous results
results indicate
indicate that
that tilt
tilt variations
variations may
may occur
occur either
either associated
associated with
with seismicity
seismicity or
or
aseismically.
aseismically. This observation, lead us to consider other possible causes (besides the seismic activity)
This observation, lead us to consider other possible causes (besides the seismic activity)
that
that can
can potentially
potentially be be related
related to to tilt
tilt anomalies.
anomalies. In In particular,
particular, the
the effects
effects of
of the
the tidal
tidal forces
forces on
on the
the
ground
ground tilt
tilt will
will be
be analysed
analysed inin the
thenext
nextsubsection.
subsection.
Tidal Analysis of the Ground Tilt
Tidal Analysis of the Ground Tilt
The kinematic analysis of the ground tilt has evidenced the existence of peculiar features at
The kinematic analysis of the ground tilt has evidenced the existence of peculiar features at
medium/long time scales. In order to get more insight into these patterns, the time series were
medium/long time scales. In order to get more insight into these patterns, the time series were
narrow-band filtered around the typical periods of the monthly (Mm) and fortnightly (Mf) tidal
narrow-band filtered around the typical periods of the monthly (Mm) and fortnightly (Mf) tidal
constituents. These constituents were recognized in tilt data by using the Independent Component
constituents. These constituents were recognized in tilt data by using the Independent Component
Analysis, and they are superimposed to the normal deformation trend of the area [65,66]. We estimated
Analysis, and they are superimposed to the normal deformation trend of the area [65,66]. We
the azimuth of the tilt vector corresponding to the filtered signals of each tiltmeter, over sliding time
estimated the azimuth of the tilt vector corresponding to the filtered signals of each tiltmeter, over
windows with length equal to the period of each tidal constituent (Figure 7).
sliding time windows with length equal to the period of each tidal constituent (Figure 7).
For both the Mm and Mf constituents, the azimuth directions, and hence the orientation of the ground
oscillation planes, were nearly E–W, NE–SW and ESE–WNW for CMP, ECO and HDM site, respectively.
These results confirm those obtained in [66] for the 2015–2016 time span, suggesting that, on average,
the dominant oscillation pattern of the Campi Flegrei caldera has not changed in the last two years.
However, at shorter time scales (less than 1 year), [66] pointed out that medium/long period filtered time
series at the ECO tiltmeter shows a difference of about 60◦ in the azimuth values between data recorded in
spring/summer and autumn/winter seasons. Moreover, the authors also noticed that the amplitude of the
Mf constituent has itself a seasonal trend, being less or more evident according to the time of the year.Geosciences 2019, 9, 222 11 of 24
Geosciences 2019, 9, x FOR PEER REVIEW 11 of 25
Figure 7. On the left, rose diagrams of the azimuths of the tilt signals corresponding to the Mm
Figure 7. On the left, rose diagrams of the azimuths of the tilt signals corresponding to the Mm
constituent (red = CMP, green = ECO, blue = HDM); on the right the same for the Mf constituent.
constituent (red = CMP, green = ECO, blue = HDM); on the right the same for the Mf constituent.
These observations, which surely deserve further investigation, lead us to deeply inspect the Mf
For both of
time behavior theECOMmdata.
and Mf constituents,
Indeed, looking the azimuth
carefully directions,
at the and hence
filtered time series the orientation
in the Mf band,of the
four
ground oscillation
oscillating “packets” planes, were amplitude
with large nearly E–W, NE–SW
(and and of
duration ESE–WNW for CMP,
about 45 days) ECO
clearly and HDM
emerge over site,
the
respectively. These results confirm those obtained in [66] for the 2015–2016 time
background signal (Figure 8b): the first one has its maximum amplitude peak in October 2015 and it is span, suggesting
that, on average,
detected theEW
only in the dominant oscillation
component, whilepattern of the Campi
the remaining three Flegrei caldera has
(with maximum not changed
amplitude in the
peaks in
last two years. However, at shorter time scales (less than 1 year), [66] pointed
April 2016, May 2017 and August 2018) occur on both the components, but with the largest amplitude out that medium/long
period
on filtered
the EW. time series
Hereafter, we will atrefer
the ECO tiltmeter
to these shows
packets as LAOa difference of about Oscillations).
(Large Amplitude 60° in the azimuth values
In Figure 8c
between data recorded in spring/summer and autumn/winter seasons. Moreover,
we report the zoom of the temporal pattern of the tilt azimuth for a time window containing each of the authors also
noticed
the that theWe
four LAOs. amplitude
note thatofthetheazimuth
Mf constituent has itself
has a slight a seasonal
variation of abouttrend, being
20◦ for theless or more
October 2015evident
LAO,
according to the time of the year.
while the other three LAOs exhibit azimuth rotations of about 90 . ◦
These observations, which surely deserve further investigation, lead us to deeply inspect the Mf
time behavior of ECO data. Indeed, looking carefully at the filtered time series in the Mf band, four
oscillating “packets” with large amplitude (and duration of about 45 days) clearly emerge over the
background signal (Figure 8b): the first one has its maximum amplitude peak in October 2015 and itGeosciences 2019, 9, 222 12 of 24
Geosciences 2019, 9, x FOR PEER REVIEW 13 of 25
Figure 8. (a) Tilt time series from 1 April 2015 to 31 December 2018 for CMO, ECO and HDM (NS
Figure
and EW 8. components).
(a) Tilt time series
The from 1 April 2015
four vertical grey to 31 December
lines 2018 for CMO,
mark the maximum ECO and
amplitude peakHDM (NS
of the and
LAOs;
EW
(b) ECO tilt time series (NS and EW components) filtered in the period band corresponding to the (b)
components). The four vertical grey lines mark the maximum amplitude peak of the LAOs; Mf
ECO tilt time series (NS and EW components) filtered in the period band corresponding
constituent; (c) temporal pattern of the azimuth of the LAOs over a two-month-long time window (start to the Mf
constituent;
and end time(c) temporal
indicated in pattern of (d)
the label); the solid
azimuth
Earthoftides,
the LAOs over a pressure
atmospheric two-month-long time
and rainfall window
time series.
(start and end time indicated in the label); (d) solid Earth tides, atmospheric pressure
The light-grey boxes in the background mark the wet season of the hydrological year [43]; (e) daily and rainfall time
series. The light-grey boxes in the background mark the wet season of the hydrological
number of VTs; (f) monthly (bar plot) and cumulative (continuous line) number of VTs; (g) monthly year [43]; (e)
daily number of VTs; (f) monthly (bar plot) and cumulative
(bar plot) and cumulative (continuous line) energy release of VTs. (continuous line) number of VTs; (g)
monthly (bar plot) and cumulative (continuous line) energy release of VTs.
To investigate possible relationships between tilt variations and seismic activity, we analysed
Indeed, as recently
the VT seismicity shown in time
in the 2015–2018 [43], range.
the dynamics of Campi
We calculated the Flegrei are strictly
daily, monthly andrelated to both
cumulative VT
endogenous and exogenous phenomena. For example, the VT seismicity is driven by both variations
in the deep magmatic feeding system as well as by tidal and hydrological cycles. Therefore,Geosciences 2019, 9, 222 13 of 24
number (Figure 8e,f) using the seismic catalogue compiled for a station, STH, located in the Solfatara
area (http://www.ov.ingv.it/ov/it/banche-dati.html). In addition, the monthly and cumulative energy
(Figure 8g) was obtained by applying the Gutenberg-Richter relationship for Campi Flegrei [35]:
LogE = 9.9 + 1.9·Md (1)
where E is the energy and Md is the duration magnitude. From this analysis it emerges that a moderate
seismic activity occurred up to August 2016. This phase was then followed by about one year of
scarce seismicity. Since September 2017, moderate/high seismic rates are observed again. The strongest
energy releases occurred in October 2015, July 2016, March 2018 and September 2018.
In Figure 8d, we provide the time series of the theoretical Earth tides generated by the code
ATLANTIDA [67], atmospheric pressure (data from a barometric station located in Solfatara) and
rainfall amount (data for Pozzuoli town, available at the URL https://www.3bmeteo.com/meteo/
pozzuoli/storico).
Indeed,
Geosciences as9,recently
2019, shown
x FOR PEER in [43], the dynamics of Campi Flegrei are strictly related to both endogenous
REVIEW 14 of 25
and exogenous phenomena. For example, the VT seismicity is driven by both variations in the deep
considering
magmatic the joint
feeding influence
system as wellofasasby many
tidalparameters as possible
and hydrological will
cycles. help build
Therefore, a more complete
considering the joint
scenariooffor
influence as the
many interpretation
parameters asofpossible
the caldera dynamics.
will help In this
build a more framework,
complete scenario ourformultiparametric
the interpretation
ofobservations evidence that:
the caldera dynamics. In this framework, our multiparametric observations evidence that:
(1)The
(1) TheOctober
October2015 2015 LAO
LAO occurs
occurs in the wet season
season of
of the
the hydrological
hydrologicalyear,year,when
whenthe
theEarth
Earthtide
tide
potentialisisapproaching
potential approaching its its seasonal
seasonal minimum and and the
the barometric
barometricpressure
pressurehas hasmajor
majorfluctuations.
fluctuations.
TheLAO
The LAOisisconcurrent
concurrentwith withthethemost
most energetic
energetic VT
VT swarm
swarm (7(7 October
October 2015),
2015), in
in aaphase
phaseof ofhigh
highseismic
seismic
energyrelease;
energy release; itsits azimuth
azimuth rotates
rotates about
about 20
20°.. The
◦ The LAO
LAO corresponds
correspondsto tothe
thetilttiltanomaly
anomaly(Figure
(Figure9)9)
observedininthe
observed theunfiltered
unfilteredtimetimeseries
series during
during Time
Time Interval
Interval I.I.
Figure 9. LAOs observed at ECO station in four different time spans discussed in the text. The tilt variations
Figure 9. LAOs observed at ECO station in four different time spans discussed in the text. The tilt
of 7 October 2015, 28 April 2016 (TR1), 3 May 2017 (TR2) and 14 July 2018 (TR3) are evidenced by a
variations of 7 October 2015, 28 April 2016 (TR1), 3 May 2017 (TR2) and 14 July 2018 (TR3) are
semicircular arrow pointing towards the reversal in tilting direction. The points superimposed to the ECO
evidenced by a semicircular arrow pointing towards the reversal in tilting direction. The points
hodograph of the
superimposed toIV
theLAO
ECOmark the observed
hodograph of the daily
IV LAOtilt,mark
so thethe
point spacing
observed is proportional
daily to thespacing
tilt, so the point tilt rate.
Itiscan be observedtohow
proportional the the
tilt tilt rate
rate. It increases from 31 August
can be observed how the2018, stretching
tilt rate the soil
increases from towards the W2018,
31 August until
9stretching
Septemberthe2018, when the rate starts to decrease. The inset shows the zoom of the tilt
soil towards the W until 9 September 2018, when the rate starts to decrease. The inset reversals.
shows the zoom of the tilt reversals.
(2) The other three LAOs (April 2016, May 2017 and August 2018) occur in the dry season of the
hydrological year, when Earth tide potential is approaching its seasonal maximum and the
barometric pressure has minor fluctuations. They match three aseismic tilt reversal episodes (TR1,Geosciences 2019, 9, 222 14 of 24
(2) The other three LAOs (April 2016, May 2017 and August 2018) occur in the dry season of the
hydrological year, when Earth tide potential is approaching its seasonal maximum and the barometric
pressure has minor fluctuations. They match three aseismic tilt reversal episodes (TR1, TR2 and TR3)
detected in the unfiltered data (Figure 9) and occur in phases of low seismic energy release; their
azimuths show a roughly 90◦ rotation.
In addition, although the present observations are limited only to three episodes, the amplitude
of the LAOs corresponding to the aseismic tilt reversals seems to be related to the rain amount of
the preceding wet season, as well as to the level of background seismicity. That is, tilt oscillations
with larger amplitudes occur after wet seasons characterized by heavier rainfalls and higher VT rate.
However, the time record of the present dataset is still too short to asses a cause-effect relationship and
more data need to be gathered over a longer time interval to confirm any possible trends.
To summarize, the occurrence (and maybe the magnitude too) of the LAO episodes at ECO
site appears to be driven by external factors such as rainfall amount and Earth tidal and barometric
pressure cycles.
3.2. Ischia Island
The Ischia Monitoring Tiltmeter Network of INVG-OV has been operating on the island since the
end of April 2015 and includes three tiltmeters (ISC, BRN, FOR) surrounding Mt Epomeo (Figure 10a).
The sensors (model Lily Self-Leveling Borehole) are placed at the bottom of the well, at depths of about
25 m, to record tilt signals not affected by surface thermal disturbances. Ground tilt variations are
measured along two orthogonal directions NS and EW; they are recorded with a sampling rate of
1 sample (defined as the average of 8000 readings) per minute.
The INGV-OV seismic network of Ischia Island originally composed of only permanent stations
(Figure 1), was massively upgraded after the Md 4.0 EQ2017 by adding several mobile installations [10].
The analog and digital permanent dataloggers are equipped with short-period 1 Hz (Mark L4C) and
three-component broadband seismometers (Guralp CMG40T), respectively. The mobile stations are
assembled with three-component short-period (Lennartz LE-3Dlite) and broadband (Lennartz LE3D/5s)
sensors. The seismic network is still under development, so for the most updated configuration refer
to the URL www.ov.ingv.it [10].
Ground tilt pattern recorded in the time span 1 June 2015–21 August 2017 shows a well-defined
polarization toward the NNW, but with a greater inclination in the northeastern sector (Figure 10a).
The EQ2017 (20:57:52, UTC+2) interrupted this trend because, after it, the polarization of the tilting
directions turned clockwise towards the NNE (Figure 10a). The earthquake was also well detected
by the tiltmeter monitoring network and was accompanied by the rotation of the tilting directions.
In the following, we summarize the results of the analysis of the 10-minute long time series recorded
before and after the seismic event. At ISC station, located about 3 km ESE from the epicentral area
(Figure 10a), the first tilt rotation occurred in the SSW direction one minute before the event (20:57).
A second change in the SW direction took place during the event itself (20:58) and finally the site tilted
permanently to NW (20:59 and 21:03) (Figure 10d).Geosciences 2019, 9, 222 15 of 24
Geosciences 2019, 9, x FOR PEER REVIEW 16 of 25
Figure
Figure 10. 10.(a)
(a)Schematic
Schematic map mapof Ischia Island,Island,
of Ischia superimposed on a gridon
superimposed representing the two-dimensional
a grid representing the two-
plane of ground
dimensional inclinations,
plane of ground in inclinations,
which each mesh is equivalent
in which each mesh to a tilt variation ofto50aµradians.
is equivalent The three
tilt variation of 50
sites ISC, FOR and BRN are distinguished by different colors (red, green and
μradians. The three sites ISC, FOR and BRN are distinguished by different colors (red, green and blue, blue, respectively).
The hodographs
respectively). Theobserved
hodographs at each
observedsite in the time
at each span
site in 1 June
the time span 2015–31
1 JuneDecember 2018 show
2015–31 December a
2018
well-defined polarization towards the NNW but with a greater inclination in
show a well-defined polarization towards the NNW but with a greater inclination in the northeastern the northeastern sector.
(The
sector.epicenter of the of
The epicenter EQ2017 is marked
the EQ2017 with with
is marked a yellow star).star).
a yellow (b–d) NS and
(b,c,d) NS EW
and components
EW components of the
of
tilt signals observed at FOR, BRN and ISC in the time interval 20:51–20:59 (red
the tilt signals observed at FOR, BRN and ISC in the time interval 20:51–20:59 (red vertical lines mark vertical lines mark
the EQ2017). (e,f,g)
the EQ2017). (e–g) Plots of the
Plots of the tilt
tiltvectors
vectorsrecorded
recordedatatFOR, FOR,BRN BRNand andISC
ISC between
between 1 July
1 July 2017
2017 andand
21
21 August 2017. The red arrows indicate the permanent coseismic offset and
August 2017. The red arrows indicate the permanent coseismic offset and the black arrows indicate the black arrows indicate
the tilt direction observed during the EQ2017.
the tilt direction observed during the EQ2017.
During the seismic event, a clear clockwise rotation of the tilting direction was observed (Figure 10g).
During the seismic event, a clear clockwise rotation of the tilting direction was observed (Figure
The two clouds (blue color, Figure 10g) of points visible in the hodograph represent the tilt variation
10g). The two clouds (blue color, Figure 10g) of points visible in the hodograph represent the tilt
recorded from 1 July 2017 to 21 August 2017. The spatial concentrations of points are separated at
variation recorded from 1 July 2017 to 21 August 2017. The spatial concentrations of points are
the onset of the earthquake and this spatial offset is owed to a permanent coseismic deformation of
separated at the onset of the earthquake and this spatial offset is owed to a permanent coseismic
6.3 µradians towards the NW. At FOR station, located about 4 km SW of the epicenter (Figure 10a),
deformation of 6.3 μradians towards the NW. At FOR station, located about 4 km SW of the epicenter
(Figure 10a), the first tilt rotation occurred one minute before the event (20:57) but in the SSE direction.Geosciences 2019, 9, 222 16 of 24
the first tilt rotation occurred one minute before the event (20:57) but in the SSE direction. A second
change in the NNW direction then occurred simultaneously with the event (20:58), and subsequently it
tilted permanently to the W-NNW (20:59 and 21:03) (Figure 10b). This time a marked clockwise rotation
of the tilting direction was observed (Figure 10e). The tiltmeter recorded a coseismic tilt of 5.3 µradians
towards the W. Finally, at BRN station, located about 3 km SE of the epicenter (Figure 10a), the rotation
occurred in the SSW direction only during the event itself (20:58) and then to the ESE (20:59), just
after the ground inclination reentered the cloud of points aligned to the NNE tilting direction (21:03)
(Figure 10c). Similar to station FOR, a clear counterclockwise rotation of the tilting direction was
observed (Figure 10f). The BRN tiltmeter did not record any co-seismic tilt.
Considering the structural lineaments of the island, the coseismic tilt of ISC is likely related to the
subsidence of Mt Epomeo and therefore to the deformation of the epicentral area itself. The one recorded
by the station FOR, located in the SW sector, is attributable to the position of the sensor itself, as it is
located at the base of a system of faults that dips to the W and which are well lubricated by subsurface
water circulation. The hinge of the deformation recorded in the time interval 20:51–20:59 seems to
be at BRN, as it is the only one of the three tiltmeters to undergo a rotation that does not end with a
coseismic tilt (Figure 10f). Since this jump is permanent, i.e. it remains after the earthquake, it can be
assumed that the sensor was rotated counterclockwise by about a tenth of a degree at the same time as
the seismic wave is passed through.
The analysis of tilt data at short time scales was complemented by the study of medium/long term
ground oscillation patterns. We narrow-band filtered the entire tilt time series around the periods of
the Mm and Mf tidal constituents, by using the same techniques applied to the Campi Flegrei data.
Considering the average direction over the investigated time interval (June 2015–December 2018),
the orientations of the ground oscillation planes corresponding to the Mm period are nearly NNW-SSE
for the ISC and BRN sites, and WNW-ESE for FOR. In the Mf band, the tilt azimuth is oriented
NNW-SSE for all the three sites (Figure 11). Some LAO episodes appear on the filtered time series,
the most significant is associated with the EQ2017 and detected at ISC and FOR sites (Figure 12c–e).
Possible correlations with the seismicity occurring in the time span 2015–2018 were investigated
by calculating the monthly and cumulative earthquake number and energy (Figure 12d,e) using
the seismic catalogue of OC9 station, located in the area of Casamicciola (http://www.ov.ingv.it/ov/
it/banche-dati.html). As one can note from Figure 12d, the seismicity rate is very low. The most
intense activity occurred in August 2017 (28 earthquakes) when the Md 4.0 EQ2017 struck the island.
This sequence gave rise to the highest release in seismic energy (Figure 12e). Since that date, only a few
low-energy earthquakes has been detected.
From a first joint analysis of the tilt and seismic data, only the EQ2017 is concomitant with a tilt
rotation, while the other small VT sequences do not correspond to any anomalies in the tilt signals.
Instead, from the kinematics inferred by the tilt patterns recorded on Ischia during the strong EQ2017,
emerges a very complex picture of the dynamics. At BRN station, moreover, a magnetic anomaly
contemporary to the earthquake occurred, with the recorded magnetic declination signal jumping
0.11◦ , equivalent to the annual variation of this component of the Earth’s magnetic field This issue be
further studied by using conceptual models that can link the rare seismic activity with conspicuous
effects of ground deformation detected by tiltmeters.You can also read