GENOMIC EPIDEMIOLOGY OF SARS-COV-2 TRANSMISSION LINEAGES IN ECUADOR - OXFORD ACADEMIC JOURNALS
←
→
Page content transcription
If your browser does not render page correctly, please read the page content below
Virus Evolution, 2021, 7(2), 1–12
                                                                                                                    DOI: https://doi.org/10.1093/ve/veab051
                                                                                                                Advance access publication date: 4 June 2021
                                                                                                                                             Research Article

Genomic epidemiology of SARS-CoV-2 transmission
lineages in Ecuador
Bernardo Gutierrez,1,2,† Sully Márquez,3 Belén Prado-Vivar,3 Mónica Becerra-Wong,3 Juan José Guadalupe,4
Darlan Da Silva Candido,1 Juan Carlos Fernandez-Cadena,5 Gabriel Morey-Leon,6 Rubén Armas-Gonzalez,7
Derly Madeleiny Andrade-Molina,5 Alfredo Bruno,8,9 Domenica De Mora,8 Maritza Olmedo,8 Denisse Portugal,8 Manuel Gonzalez,8

                                                                                                                                                                    Downloaded from https://academic.oup.com/ve/article/7/2/veab051/6292076 by guest on 14 November 2021
Alberto Orlando,8 Jan Felix Drexler,10,‡ Andres Moreira-Soto,10 Anna-Lena Sander,10 Sebastian Brünink,10 Arne Kühne,10
Leandro Patiño,8 Andrés Carrazco-Montalvo,11 Orson Mestanza,12,§ Jeannete Zurita,13,14 Gabriela Sevillano,14 Louis Du Plessis,1
John T. McCrone,15 Josefina Coloma,16 Gabriel Trueba,3 Verónica Barragán,3 Patricio Rojas-Silva,3,** Michelle Grunauer,17
Moritz U.G. Kraemer,1 Nuno R. Faria,1,18 Marina Escalera-Zamudio,1 Oliver G. Pybus,1,19,*,†† and Paúl Cárdenas3,*
1
  Department of Zoology, University of Oxford, Oxford, Oxfordshire OX1 3SY, UK, 2 Colegio de Ciencias Biológicas y Ambientales, Universidad San Francisco de
Quito, Quito 170901, Ecuador, 3 Instituto de Microbiología, Universidad San Francisco de Quito, Quito 170901, Ecuador, 4 Laboratorio de Biotecnología Vegetal,
Universidad San Francisco de Quito, Quito 170901, Ecuador, 5 Omics Sciences Laboratory, Faculty of Medical Sciences, Universidad de Especialidades Espíritu
Santo, Samborondón 092301, Ecuador, 6 Faculty of Medical Sciences, Universidad de Guayaquil, Guayaquil 090613, Ecuador, 7 Faculty of Sciences, Escuela Superior
Politécnica del Litoral, Guayaquil 090112, Ecuador, 8 Instituto Nacional de Investigación en Salud Pública, Guayaquil 3961, Ecuador, 9 Universidad Agraria del
Ecuador, Guayaquil 090104, Ecuador, 10 Institute of Virology, Charité-Universitätsmedizin Berlin, corporate member of Freie Universität Berlin,
Humboldt-Universität zu Berlin, and Berlin Institute of Health, Berlin 10117, Germany, 11 Instituto Nacional de Investigación en Salud Pública, Quito 170403,
Ecuador, 12 Servicio de Genética, Instituto Nacional de Salud del Niño San Borja, Lima 15037, Perú, 13 Facultad de Medicina, Pontificia Universidad Católica del
Ecuador, Quito 170143, Ecuador, 14 Unidad de Investigaciones en Biomedicina, Zurita & Zurita Laboratorios, Quito 170104, Ecuador, 15 Institute of Evolutionary
Biology, University of Edinburgh, Edinburgh EH9 3JW, UK, 16 School of Public Health, University of California, Berkeley CA 94704, USA, 17 Escuela de Medicina,
Universidad San Francisco de Quito, Quito 170901, Ecuador, 18 MRC Centre for Global Infectious Disease Analysis, J-IDEA, Imperial College London, London
SW7 2AZ, UK and 19 Department of Pathobiology and Population Sciences, Royal Veterinary College London, London NW1 0TU, UK
†
  http://orcid.org/0000-0002-9220-2739
‡
  http://orcid.org/0000-0002-3509-0232
§
  http://orcid.org/0000-0001-7268-0496
**
   http://orcid.org/0000-0002-9611-3661
††
   http://orcid.org/0000-0002-8797-2667
*Corresponding authors: E-mail: oliver.pybus@zoo.ox.ac.uk; pacardenas@usfq.edu.ec

Abstract
Characterisation of severe acute respiratory syndrome coronavirus-2 (SARS-CoV-2) genetic diversity through space and time can reveal
trends in virus importation and domestic circulation and permit the exploration of questions regarding the early transmission dynam-
ics. Here, we present a detailed description of SARS-CoV-2 genomic epidemiology in Ecuador, one of the hardest hit countries during
the early stages of the coronavirus-19 pandemic. We generated and analysed 160 whole genome sequences sampled from all provinces
of Ecuador in 2020. Molecular clock and phylogeographic analysis of these sequences in the context of global SARS-CoV-2 diversity
enable us to identify and characterise individual transmission lineages within Ecuador, explore their spatiotemporal distributions, and
consider their introduction and domestic circulation. Our results reveal a pattern of multiple international importations across the
country, with apparent differences between key provinces. Transmission lineages were mostly introduced before the implementation
of non-pharmaceutical interventions, with differential degrees of persistence and national dissemination.

Key words: SARS-CoV-2; phylogenetics; molecular epidemiology; phylogeography; transmission lineages.

1. Introduction                                                                    1,428,296 sequence entries by 10 May 2021 (Shu and McCauley
                                                                                   2017), providing an unparalleled data set that permits detailed
The rapid generation of substantial numbers of virus genomic
sequences during the coronavirus-19 (COVID-19) pandemic is                         analyses of virus transmission and dissemination. These achieve-
without precedent. Laboratories and institutes around the world                    ments have provided insights into the sources of SARS-CoV-2
produced and shared over 300,000 whole severe acute respira-                       importation and early transmission dynamics in individual coun-
tory syndrome coronavirus-2 (SARS-CoV-2) genome sequences                          tries and geographical regions (Candido et al. 2020; Geoghegan
in the GISAID repository during 2020 and features a total of                       et al. 2020; Lu et al. 2020; Alteri et al. 2021) and have enabled

© The Author(s) 2021. Published by Oxford University Press.
This is an Open Access article distributed under the terms of the Creative Commons Attribution-NonCommercial License (http://creativecommons.org/
licenses/by-nc/4.0/), which permits non-commercial re-use, distribution, and reproduction in any medium, provided the original work is properly cited. For
commercial re-use, please contact journals.permissions@oup.com
2     Virus Evolution

the exploration of viral transmission history at a global scale              to account for other factors that affect the spread of pathogens,
(Worobey et al. 2020). Phylogenetic methods, including molecular             ranging from human mobility on a global scale (Lemey et al. 2014)
clock models and phylogeographic and phylodynamic methods,                   to particular social networks (Vasylyeva et al. 2016). The analysis
are now used routinely to analyse such genomic data from emerg-              of local- and national-scale data sets during the current pan-
ing outbreaks (Grubaugh et al. 2019a). The resolution level of               demic has provided insights into the processes affecting the intro-
evolutionary and transmission history obtained using these meth-             duction and circulation of the virus into new locations (Moreno
ods is contingent on the virus’ evolutionary rate and the depth              et al. 2020) and provided genomic context for other data sources
and representativeness of sampling of cases across space and                 (Gudbjartsson et al. 2020; Popa et al. 2020; Sekizuka et al. 2020).
time (Duchene et al. 2020). While heterogeneous sampling and                 Indeed, the integration and analysis of multiple data sources
sequencing among countries can bias and affect the output of                 about an emerging epidemic has the potential to compensate for
some phylogeographic methods (Lemey et al. 2020; Kalkauskas                  surveillance blind spots and better understand poorly sampled
et al. 2021), general trends in the transmission of viral lineages           outbreaks (Grubaugh et al. 2019b).
can still be inferred from smaller samples of genomic sequences                 The COVID-19 epidemic in Ecuador was marked by a dramatic
from individual locations.                                                   and widely publicised early phase (Long 2020), with an esti-

                                                                                                                                                          Downloaded from https://academic.oup.com/ve/article/7/2/veab051/6292076 by guest on 14 November 2021
    The utility of pathogen genomic surveillance during outbreaks            mated basic reproductive number (R0 ) of 3.54 (Ortiz-Prado et al.
has developed during various past emerging epidemics (Rambaut                2021). Ecuador is a small middle-income South American country
and Holmes 2009; Park et al. 2015; Faria et al. 2017) and has                with the seventh largest population in the continent; half of the
gained further momentum during the current global health cri-                country’s population lives in Guayas province (host of the coun-
sis. Information about epidemiological trends can be effectively             try’s most populated city, Guayaquil) and Pichincha province (host
complemented with genomic analyses in order to understand                    of the country’s second most populated city, the capital Quito;
case-specific (Meredith et al. 2020) and general transmission pat-           Fig. 1A). The first case was reported in the country on 27 February
terns (Du Plessis et al. 2021). This framework can be extended               2020 (a patient who returned from abroad through Guayaquil

Figure 1. Overview of genomic sampling and SARS-CoV-2 genetic diversity in Ecuador. (A) Number of sequences from Ecuador analysed in this study
per province across the four main geographic regions: the coast (shades of green), the highlands (shades of yellow), the Amazon (shades of orange), and
the Galápagos (blue). (B) Number of deaths (attributed to laboratory-confirmed COVID-19 cases) versus number of whole genome sequences available
per province. Circle radius shows the number of cases per province. (C) Timelines showing collection dates of sequences from the four geographic
regions across time (upper panel) and the COVID-19 epidemiological curves in Ecuador during 2020 (cumulative number of laboratory-confirmed
cases as reported by the Ministry of Health in the blue line, number of daily excess deaths compared to the same dates in 2019 as reported by the
National Institute of Statistics and Census in grey; lower panel). (D) Geographic distribution of SARS-CoV-2 lineages identified in Ecuador.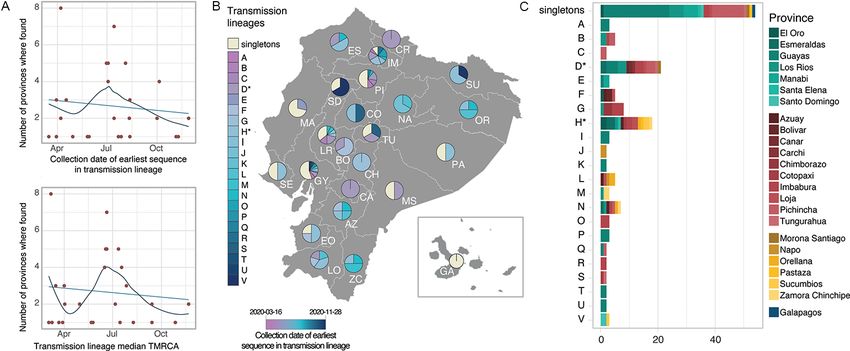
B. Gutierrez et al.   3

with date of symptom onset of February 15) and was followed            (UEES) were obtained from samples collected from the labora-
by the declaration of a National Health Emergency on 11 March          tory’s diagnostic service and selected at random for sequenc-
2020. Public health interventions were implemented shortly there-      ing. Samples collected by the National Institute of Investigations
after: mass gatherings were restricted on 13 March, and a partial      in Public Health (Instituto Nacional de Investigación en Salud
lockdown that included the closure of international borders was        Pública, INSPI) were obtained from the national epidemiologi-
implemented on 17 March. Finally, a full lockdown that included        cal SARS-CoV-2 surveillance system. Samples collected by the
a curfew and the limitation of domestic mobility in private and        Biomedical Research Unit at Zurita & Zurita Laboratories were
public vehicles came into effect on 25 March (Ortiz-Prado et al.       obtained from community patients from Quito who presented
2021). The country’s port city of Guayaquil was the first epicentre    clinical signs of reinfection. This complete Ecuadorian sample set
of the epidemic, facing a severe increase in the numbers of cases      was collected between 9 March and 9 December 2020, with lim-
between late February and early April. The province of Guayas          ited representation during the early months of the epidemic when
reached its highest effective reproductive number Rt (defined as       compared to excess mortality data (Fig. 1C).
the average number of secondary cases caused by a primary cases            From these samples, we generated 160 complete SARS-CoV-2
at a point in time t; Nishiura and Chowell 2009) on 14 March           genomic sequences using different methodologies. From these,

                                                                                                                                               Downloaded from https://academic.oup.com/ve/article/7/2/veab051/6292076 by guest on 14 November 2021
(Rt estimates vary between 3.96 and 4.91), with 1,462 cases            121 genomes represent samples collected between the imple-
reported that day (Fernández-Naranjo et al. 2021), and reported       mentation of the national lockdown (25 March) and the lifting
a cumulative incidence of 146.94 cases per 100,000 people by 18        of restrictions (13 September). IM-USFQ generated 108 whole
April (Ortiz-Prado et al. 2021). The actual number of cases are        genome sequences using Oxford Nanopore MinION sequenc-
likely to have been much higher when evaluated through the lens        ing and the ARTIC Network primer scheme approach as previ-
of excess mortality data (as obtained from the National Institute of   ously described (Marquez et al. 2020). UEES generated 33 whole
Statistics and Census; Instituto Nacional de Estadística y Censos)     genome sequences through Illumina sequencing on a MiniSeq
and would explain why local diagnostic and healthcare services         platform (Illumina, San Diego, CA). INSPI generated 15 sequences
became rapidly overwhelmed (Long 2020; Ortiz-Prado et al. 2021).       either in collaboration with Charité—Berlin University of Medicine
After the peak and decline of the epidemic’s first wave in Ecuador,    (through Illumina sequencing) or on site at the Centre for Multi-
restrictions were maintained during April and May and progres-         disciplinary Research of the Direction of Research, Development
sively relaxed over the following months, as the epicentre of          and Innovation (through Oxford Nanopore MinION sequencing as
Ecuador’s epidemic moved to the capital city of Quito, located in      described in Lopez-Alvarez, Parra, and Cuellar 2020). Zurita &
Pichincha province (which on 23 July 2020 overtook Guayaquil as        Zurita Laboratories generated four sequences through Illumina
the city with the greatest number of COVID-19 confirmed cases).        sequencing on a MiSeq platform (Illumina, San Diego, CA). Details
The last restrictions were finally lifted on 13 September, although    of sample collection, sequencing, and genome assembly are sum-
use of personal protective equipment and physical distancing           marised in Supplementary Table S1. Sample collection dates and
guidelines remained in place.                                          the province-level geographical location of residence of the patient
    To date, the source and diversity of circulating transmis-         were included as metadata for all sequences in the country.
sion lineages in Ecuador and their reach across the country                To determine the viral genetic diversity circulating in the coun-
remain unexplored. International importations are expected to          try during the sampling period, all sequences from Ecuador were
have played an important role in seeding transmission chains in        phylogenetically assigned under the global Pango lineage system
Ecuador, as observed in other countries in Latin America (Candido      using the Pangolin v2.2.2 tool (https://virological.org/t/pangolin-
et al. 2020; Laiton-Donato et al. 2020; Franco et al. 2021) and        web-application-release/482).
elsewhere (Du Plessis et al. 2021). We undertake phylogenetic
analyses of 160 SARS-CoV-2 whole genome sequences sampled
from Ecuadorian cases and place them within the context of             2.2 Global SARS-CoV-2 data sets
global viral genetic diversity in order to characterise the genomic    The Ecuadorian virus sequences were analysed in the context of
epidemiology of SARS-CoV-2 in the country. We identify intro-          global SARS-CoV-2 genomic diversity by including all high-quality
duction events and transmission lineages within Ecuador and            SARS-CoV-2 genome sequences and their accompanying meta-
investigate their spatiotemporal distribution, and we hypothe-         data available in GISAID (Shu and McCauley 2017) on 1 January
sise about the role of domestic seeding on viral transmission          2021 (sequences were retained if they were >29,000 nucleotides
dynamics.                                                              long and
4 Virus Evolution
ated three ‘randomly-subsampled data sets’ consisting of 8,606 Markov Chain Monte Carlo (MCMC) chains were run for 40 mil-
randomly chosen sequences from the full data set, to match the lion steps and subsequently combined after discarding the initial
size of the systematically subsampled data set. These randomly 10 per cent of each run as a burn-in. Convergence of relevant
subsampled data sets were used to evaluate the performance of parameters was assessed by visually inspecting the MCMC trace
the background SARS-CoV-2 sequences as the genomic context plots and posterior probability distributions of parameters from
for the identification of transmission lineages within Ecuador (see independent chains and using effective sample size (ESS) esti-
Section 2.3). Finally, we added the sequences from Ecuador to each mates approaching 100 (for this analysis: median ESS = 87.9;
data set, resulting in a total of 8,766 sequences per data set. interquartile range (IQR) = 50.5–276.2) from the combined chains
Each data set was aligned to the Wuhan-Hu-1 (GenBank acces- using Tracer v1.7.1 (Rambaut et al. 2018). While these ESS values
sion: MN908947.3) reference genome sequence (Wu et al. 2020) are normally considered low for standard Bayesian phylogenetic
using Minimap 2.17 (Li 2018) to generate multiple sequence align- analyses, the high node density of the SARS-CoV-2 phylogeny and
ments. Sites containing >90 per cent gaps relative to the sequences the currently available models in BEAST appeared to affect the
in their respective alignment were masked, whilst the untran- MCMC mixing.
scribed terminal regions were trimmed. After masking and trim- The systematically subsampled data set was analysed
Downloaded from https://academic.oup.com/ve/article/7/2/veab051/6292076 by guest on 14 November 2021
ming, the resulting alignments had a final length of 29,409 with BEAST v1.10.5 (https://github.com/beast-dev/beast-mcmc/
nucleotides, with the shortest partial genome sequences being cut releases/tag/v1.10.5pre_thorney) using a newly implemented
down to 28,955 nucleotides long. method that significantly reduces analysis time by using a sim-
ple model to estimate a time-calibrated tree (see Didelot, Siveroni,
and Volz 2021). This approach takes a previously estimated rooted
2.3 Phylogenetic identification of transmission phylogenetic tree (henceforth called the data tree) instead of an
lineages alignment and rescales branches in this tree into time. Under
We followed a similar rationale and methodology to that described this model, the likelihood of each branch length (in mutations)
in Du Plessis et al. (2021) to identify local transmission lin- is defined as a function of a Poisson distribution with a mean
eages. Phylogenetically linked sequences were inferred to have directly proportional to the clock rate (Volz and Frost 2017; Dide-
descended from a common ancestor if they were associated with lot, Siveroni, and Volz 2021); we therefore used a rate of 6.28 × 10⁻⁴
a single inferred introduction event into Ecuador from an interna- substitutions/site/year, based on the median clock rate estimate
tional location (Candido et al. 2020; Du Plessis et al. 2021). Ecuado- obtained from our exploratory analysis. We defined a coalescent
rian transmission lineages therefore correspond to lineages of Skygrid prior, similar to the one described for the exploratory anal-
sequences sampled within the country that descend from a node ysis, and used the previously mentioned re-rooted ML tree as a
inferred to have also occurred in Ecuador, which must in turn starting data tree. Independent MCMC chains were run for 100
have descended from outside of the country. Given the unstruc- million steps and combined (after discarding 10 per cent of each
tured sampling of the Ecuadorian sequences, some transmission run as burn-in) to produce a posterior tree distribution. Conver-
lineages will likely correspond to epidemiologically linked cases gence was assessed through the examination of trace plots and
(i.e. targeted investigation of epidemiological clusters); these have ESS estimates as previously described.
been identified as such in the text whenever the information was To identify nodes associated with transmission lineages in
available. Ecuador, we used a discrete phylogeographic model consisting
Maximum likelihood (ML) phylogenetic trees were estimated of a two-state discrete trait analysis (DTA; Lemey et al. 2009)
from the systematically subsampled data set and the randomly implemented in BEAST v1.10.4 (Suchard et al. 2018). The posterior
subsampled data sets using IQtree 2.1.1 (Minh et al. 2020) under a distribution of trees generated in the previous step was resam-
GTR + Γ substitution model. Node support was estimated through pled down to 500 time-calibrated trees using LogCombiner v1.10.4,
an SH-like approximate Likelihood Ratio Test using 1,000 repli- and BEAST was used to sample this tree space. Tips were assigned
cates (Guindon et al. 2010). While the randomly subsampled data to one of two possible states (Ecuador vs non-Ecuador), and
sets were not analysed further, the tree for the systematically sub- reconstruction of ancestral node states was undertaken using an
sampled data set was re-rooted by heuristically searching for the asymmetric substitution model (Lemey et al. 2009). The expected
root placement that minimises the mean squared residual of a number of DTA transitions between international locations and
regression of sequence sample date against root-to-tip genetic dis- Ecuador were estimated using a robust counting approach (Minin
tance, calculated using TempEst v1.5.3 (Rambaut et al. 2016), to and Suchard 2008). Two independent MCMC chains of 5 million
maximise the temporal signal of the data set. The same regression steps each were combined for this analysis, after discarding the
was used to assess the clock-like behaviour of the data set. first 500,000 steps of each run as burn-in. A Maximum Clade
Subsequent analyses in our pipeline require an evolution- Credibility (MCC) tree was generated from the DTA posterior tree
ary rate estimation. We performed an exploratory analysis on a distribution by sampling 1,000 trees from the combined MCMC
random selection of 866 genomes from the systematically sub- runs in TreeAnnotator v.1.10. Each internal node was assigned a
sampled data set (∼10 per cent of the sequences, ensuring that posterior probability for its inferred location, and these were used
representatives of the earliest and latest collection dates were to evaluate uncertainty regarding the assignment of potential
included) in order to estimate the evolutionary rate of the data transmission lineages in Ecuador.
set over the sampling period. We used BEAST v.1.10.4 (Suchard
et al. 2018) to obtain a clock rate estimate using the Hasegawa- 2.4 Transmission lineages and transmission
Kishino-Yano (HKY) substitution model and a strict molecular lineage groups
clock with a continuous-time Markov chain prior (Ferreira and All phylogenetic clusters of sequences from Ecuador were
Suchard 2008). We employed a Skygrid coalescent tree prior (Gill inspected visually on the MCC tree to assign individual trans-
et al. 2013) that accounts for the 50 epidemiological weeks over mission lineages. The nomenclature of these country-specific
which the genomes were sampled, plus a cut-off period that pre- transmission lineages followed a one-letter code in alphabeti-
cedes the earliest collected SARS-CoV-2 sequences. Independent cal order, defined by the earliest sample collection date in eachB. Gutierrez et al. 5
transmission lineage. General features of each transmission lin- strongly match trends in reported excess deaths. More samples
eage were summarised, such as the earliest and latest samples were collected in July and August, but fewer genomes were sam-
in each lineage, the number of provinces in which the transmis- pled in the early epidemic months (March to May) despite the
sion lineage had been identified, and the number of sequences high number of excess deaths reported then (Fig. 1C). Sequence
belonging to said lineage (used as a proxy of transmission lineage representation is greater for the coastal provinces during the
size). The consistency with which sequences were grouped into early months of the epidemic (March to June), when the epi-
these transmission lineages was evaluated by visually inspecting centre of the epidemic was based in the port city of Guayaquil
the ML trees for the randomly subsampled data sets and compar- (in the Guayas province; Long 2020), and shifted towards higher
ing the clusters of Ecuadorian sequences to those from the DTA sampling in the highlands and Amazon provinces, as the epi-
analysis. centre of the epidemic shifted towards the capital city of Quito
(in Pichincha province) and as more cases were reported in the
Amazon.
3. Results Virus genomes from Ecuador were assigned to specific Pango
3.1 SARS-CoV-2 genetic diversity in Ecuador lineages (Rambaut et al. 2020) using the pangolin tool (https://
Downloaded from https://academic.oup.com/ve/article/7/2/veab051/6292076 by guest on 14 November 2021
The samples from laboratory-confirmed individuals obtained virological.org/t/pangolin-web-application-release/482). The gen-
across mainland Ecuador (and one sample from the Galápagos omes were assigned to 33 different global lineages and predomi-
Islands) were collected as they became available through differ- nantly B.1.1.74 (39.4 per cent of all Ecuadorian sequences; Fig. 1D),
ent hospitals and laboratories and yielded representative genomes one of the lineages descended from B.1.1, which became one
from all provinces in the country (Fig. 1A). The number of of the most dominant lineages during the early phase of the
sequences per province correlates with the cumulative num- pandemic in Europe and North America (after the virus was
ber of excess deaths per province during 2020 (compared to the introduced from Asia; Rambaut et al. 2020; Alteri et al. 2021).
mean number of deaths per province between 2015 and 2019; The geographic distribution of the SARS-CoV-2 lineage diversity
Spearman’s ρ = 0.556, P = 0.005), suggesting that the number in the country shows distinctive patterns: the most prevalent
of sequences per province is approximately proportional to the Pango lineages (B.1.1.74, B.1, and B.1.1.1) are found in multiple
number of infections (Fig. 1B). Despite the testing limitations provinces, while the majority of the lineages observed at low
in the country throughout 2020, the number of sequences also frequencies were found in more heavily affected (and therefore
correlate to the cumulative number of patients with a positive or better sampled) provinces, particularly Guayas and Pichincha. The
suspected positive COVID-19 PCR test over the sampling period heavily affected (and highly populated) province of Guayas (where
(Spearman’s ρ = 0.603, P = 0.002). Despite the limited number of Guayaquil is located) exhibits a predominance of the B.1.1.74
sequences from Ecuador, the representativeness of our sample lineage (59.1 per cent of all sequences from this province; Fig. 1D).
is similar to that of other countries in the region. We estimate B.1.1.74 is also abundant in the provinces of Los Ríos, which
Ecuador produced 8 sequences for every 10,000 reported cases or neighbours Guayas (49 per cent), and Imbabura, which neigh-
12 sequences for every 1,000 officially reported COVID-19 deaths. bours Pichincha (38.9 per cent). Other common lineages, such
This is more representative than Peru (4 sequences per 10,000 as B.1 (16.9 per cent of all sequences from Ecuador) and B.1.1.1
cases/10 sequences per 1,000 deaths) or Brazil (3 sequences per (6.9 per cent of all sequences from Ecuador), are distributed across
10,000 cases/10 sequences per 1,000 deaths) but less representa- various geographical regions.
tive than Uruguay (159 sequences per 10,000 cases, and a higher
number of SARS-CoV-2 genome sequences than reported deaths)
(Supplementary Fig. S1, File S1). It should be noted however that 3.2 Identification of Ecuadorian transmission
these estimates rely on the testing intensities between provinces lineages
in Ecuador and between different countries; limited testing in We undertook exploratory phylogenetic analyses using differ-
Ecuador could mean that the overall representation is lower than ent sequence subsampling schemes, as the exceptionally large
estimable from official reports. number of available SARS-CoV-2 sequences prevents full anal-
Wide variation in the total numbers of cases across provinces ysis of the complete global data set. We estimated ML trees of
in Ecuador is reflected in the variation in the number of the Ecuadorian sequences in the context of different background
sequences obtained (Supplementary File S2). While heavily data sets and performed Bayesian phylogenetic inference on a
affected provinces such as Pichincha (72,305 confirmed cases until systematically subsampled data set. The clustering patterns of
10 December) and Guayas (26,080 confirmed cases) account for Ecuadorian sequences in the ML trees showed some variation
larger numbers of sequences (47 and 18 for Guayas and Pichin- between data sets but in the majority of cases remained consis-
cha, respectively), less affected provinces in the southern High- tent (Supplementary File S3). We therefore derive our results from
lands (Azuay—12,670 confirmed cases, and Loja—7,252) and the the systematically subsampled data set and discuss these in light
Amazon (Morona Santiago—3,422, Napo—1,605, Orellana—2,100, of the randomly subsampled data sets.
Pastaza—2,360, and Zamora Chinchipe—1,628) are represented by We consistently found that a sizeable proportion of sequences
few sequences (28 in total). Only a single sequence was obtained from Ecuador do not cluster with other sequences from the coun-
from the Galápagos because of the extremely low number of try (54/160 sequences for the systematically subsampled data set,
cases in this province. Manabí province appears to be underrep- 48–51/160 for the randomly subsampled data sets; Supplemen-
resented (14,061 confirmed cases), while Imbabura (5,695 con- tary File S3) and were therefore assigned as singletons and not
firmed cases) and Los Ríos (4,707 confirmed cases) are represented associated with further virus spread within Ecuador detectable
by higher numbers of genomes per death (Fig. 1B). Sequence through genomic analysis. These singletons could in fact repre-
sampling rates for each province (excluding Galápagos) varied sent introduction events that produced no forward transmission
between 3 and 86 sequences per 1,000 deaths (2). The temporal or cases where forward transmission did occur but was not cap-
distribution of samples collected in Ecuador during 2020 does not tured in this study due to the small sample size. We note that6 Virus Evolution
the majority of the singleton sequences were collected before 3.3 Size and persistence of transmission lineages
mid-July (Supplementary Fig. S2); we speculate that they could Initial molecular clock analyses showed that our data set contains
represent predominantly early introduction events that occurred strong temporal signal overall, although many sequences from
before the implementation of a national lockdown on 16 March. Ecuador showed lower than average genetic divergence from the
While it is possible to establish a possible limit of dates on root (Fig. 2C). The inferred TMRCAs of Ecuadorian transmission
which each singleton was introduced, based on the last ances- lineages ranged from February to November 2020 (Table 1); from
tral node inferred to have occurred outside of Ecuador, the precise this list, transmission lineages C and S are composed of pairs of
importation date will fall somewhere between the inferred age sequences that share an epidemiological link.
of this preceding node and the collection date of the singleton The TMRCAs estimated for the two large transmission lin-
sequence. The low sampling density in Ecuador and our subsam- eage groups D* and H* are the earliest in our data; however,
pling schemes are likely to introduce uncertainty in estimating these might not represent true lineage ancestors within Ecuador,
the age of these nodes and we therefore excluded these analyses because each group could represent more than one introduc-
from our results. tion from other countries. After excluding these larger groups,
The remaining sequences (106/160 sequences for the systemat- we still identified six transmission lineages for which the 95 per
Downloaded from https://academic.oup.com/ve/article/7/2/veab051/6292076 by guest on 14 November 2021
ically subsampled data set) fall into two distinct categories. Firstly, cent HPDs of the TMRCA include the date of implementation
20 monophyletic clusters of Ecuadorian sequences were identi- of the national lockdown, 16 March. Therefore, these trans-
fied, capturing multiple introduction events and some local viral mission lineages likely correspond to introduction events that
circulation patterns. These clusters were assigned to be sepa- occurred before restrictions on incoming international flights
rate Ecuadorian transmission lineages, named A through V (with were adopted in Ecuador. An additional four transmission lin-
exceptions detailed in the paragraph below; Fig. 2A, Supplemen- eages have TMRCA estimates between late March and November
tary Figs S3–S9). Each represents a single introduction event of the 2020. These may correspond to more recent introductions (fol-
virus from an international destination, followed by local forward lowing the progressive relaxation of the lockdown in Ecuador
transmission in Ecuador (Du Plessis et al. 2021). between May and September). The most likely exceptions to
Secondly, we identified two large monophyletic clusters that this are transmission lineages C (TMRCA: 2020.2412, 95 per cent
include sequences from international locations and Ecuador. HPD: 2020.2328-2020.2446) and M (TMRCA: 2020.3278, 95 per cent
These were not identified strictly as individual transmission lin- HPD: 2020.1864-2020.4187). Incomplete sampling of these lin-
eages through our DTA approach but rather as genetically simi- eages and detection lags could result in the date of introduction
lar groups of individual transmission lineages. While these may being substantially earlier than the date of the TMRCA (Duchêne,
represent clusters of independent introductions from shared Duchêne, and Ho 2015), which would place the introduction date
sources, there is also a possibility that these groups of trans- for these transmission lineages prior to the implementation of the
mission lineages in fact correspond to single introduction events lockdown.
misidentified by our DTA analysis, given the variation in the Transmission lineages vary in size from sequence pairs (trans-
intensity of SARS-CoV-2 sampling across countries (Lemey et al. mission lineages C, J, K, Q, R, S, T, and U) to larger clusters of
2020; Worobey et al. 2020), including Ecuador, and the limited 16–21 sequences (transmission lineage group D*, depending on
genetic divergence observed in SARS-CoV-2 over the time span whether D* is considered as a single lineage or as multiple lin-
being analysed (Villabona-Arenas, Hanage, and Tully 2020). This eages). The number of sequences in each transmission lineage is
likely resulted in the ancestral nodes being inferred to have existed correlated with the number of days between the earliest and most
outside of Ecuador due to the phylogenetic placement of the recent sampling dates within the lineage (assuming that D* and H*
Ecuadorian sequences (Fig. 2A). While there is a possibility that are composed of multiple individual transmission lineages each).
these in fact represent multiple closely related yet independently However, this result could be driven by the single largest transmis-
introduced transmission lineages, we here identify them as trans- sion lineage in the data set. A similar pattern is observed when
mission lineage groups (labelled with a single letter and high- comparing the time between the inferred TMRCA and the most
lighted with an asterisk, D* and H*) for summary purposes. The recent sequence of each transmission lineage (equivalent to the
remaining unambiguous transmission lineages were each identi- persistence time plus the detection lag; Supplementary Fig. S11).
fied with their own letters and are shown in Supplementary Figs We also observed that lineages that were detected earlier tend
S3–S9. to be larger (contain more sequences) and persist longer but are
Table 1 provides details for each Ecuador transmission lineage not more geographically widespread (Fig. 3A; Supplementary Figs
(named sequentially according to the collection date of the ear- S12–S14). However, transmission lineages first detected or with a
liest sequence in each lineage). We identify 82 (95 per cent HPD: TMRCA between June and August are found on average in a greater
81–84) SARS-CoV-2 introduction events from other countries into number of provinces (from earliest detection of transmission lin-
Ecuador through a robust counting approach (Minin and Suchard eages: mean = 3.27 provinces, median = 3 provinces; from TMR-
2008). This estimate assumes that transmission lineage groups D* CAs of transmission lineages: mean = 3.7 provinces, median = 4
and H* are comprised of two and three individual transmission lin- provinces) compared to transmission lineages first detected at
eages, respectively (with an additional singleton inferred as part any other time of the year (from earliest detection of transmis-
of H*; Fig. 2A). The detection lag (defined as the number of days sion lineages: mean = 2.21 provinces, median = 1.5 provinces; from
between the inferred transmission lineage time to the most recent TMRCAs of transmission lineages: mean = 2 provinces, median = 1
common ancestor (TMRCA) and its earliest sampled sequence) province) (Fig. 3A). Overall, transmission lineages with earlier
ranged between 1 and 140 days (Table 1), with a median of 16 days TMRCAs and that were first detected earlier in the year per-
(IQR: 7–31 days; Fig. 2B, Supplementary Fig. S10). sisted for longer timespans (i.e. there is a greater number of daysB. Gutierrez et al. 7
Downloaded from https://academic.oup.com/ve/article/7/2/veab051/6292076 by guest on 14 November 2021
Figure 2. Time calibrated phylogenetic trees for the major transmission lineages in Ecuador. (A) Subtrees extracted from a time-calibrated Maximum
Clade Credibility (MCC) tree of SARS-CoV-2 whole genome sequences, corresponding to the two largest clusters of sequences from Ecuador. Tree tips
are coloured by sampling location (in Ecuador, red, versus outside of Ecuador, grey); nodes and branches are coloured by inferred location through a
two-state DTA analysis. The province where each sequence was sampled is annotated on the tips, and maps highlight these provinces. Tips that
correspond to sequences that cluster together within the major Ecuadorian clusters are also annotated with the region where the samples were
collected. (B). Detection lag of individual transmission lineages in Ecuador, showing the median TMRCA of each transmission lineage from our data set
(blue) connected by a grey line to the date of the earliest sequence in that transmission lineage (red). (C) Root-to-tip genetic distances (based on a
heuristically rooted maximum likelihood tree) versus sample collection dates for the SARS-CoV-2 data set used in this analysis. Data points
corresponding to sequences collected in Ecuador are highlighted in red, and the linear regression trendline is shown in blue.
between the first detection and the most recent detection of a across multiple regions (Fig. 3C). The large transmission lineage
transmission lineage; Supplementary Fig. S13). It should be noted groups D* and H* include sequences from provinces across three
however that these patterns also resemble the increased sampling geographical regions each (the coastal region, the highlands, and
that occurred over the months of July and September (seen in Fig. the Amazon region) and potentially show internal seeding events
1C), suggesting that these patterns could be explained by sampling of the virus across provincial boundaries (Figs 2A, 3C). Even when
intensity across time. accounting for the possibility that these lineage groups are com-
prised of multiple transmission lineages, sequences from different
provinces and regions clustered together (Fig. 2A).
3.4 Geographical distribution of transmission Consistent with the spatiotemporal sampling patterns
lineages (Fig. 1C), the older transmission lineages (shown in darker blue
Singletons and transmission lineages are found across multiple in Fig. 3B) were identified predominantly in provinces on the
provinces and regions of Ecuador (Fig. 3B–C). Singletons represent coast and highland regions, while younger transmission lin-
an important proportion of the sequences in various provinces eages (shown in lighter blue in Fig. 3B) were identified in specific
across central Ecuador ranging between 33.3 per cent in Tungu- provinces in the north and more broadly in the south. The first
rahua and 52.3 per cent in Guayas (Fig. 3B), an observation that epicentre of the COVID-19 epidemic in Ecuador, the province of
is particularly important for provinces with large numbers of Guayas, is represented by a high frequency of singleton lineages,
sequences (Supplementary Fig. S14). On the other hand, differ- with a high diversity of individual transmission lineages first
ent transmission lineages are found either in single provinces or identified at different times during 2020. A similar pattern is8 Virus Evolution
Table 1. Summary of transmission lineages identified in Ecuador.
Number of
sequences
Transmission (% of total Earliest sample Latest sample Detection lag Provinces where it has
lineage sequences) collection date collection date Median TMRCA (95% HPD) (days)c been sampled
A 3 (1.875) 16/3/2020 23/3/2020 3/3/2020 (25/2/2020– 13 Guayas
9/3/2020)
B 5 (3.125) 30/3/2020 30/6/2020 16/3/2020 (2/3/2020– 14 Imbabura, Los Rios,
30/3/2020) Pichincha
C 2 (1.25) 30/3/2020 30/3/20 29/3/2020 (26/3/2020– 1 Pichincha
30/3/2020)
Da 21 (13.125) 7/4/2020 1/10/2020 2/3/2020b (19/2/2020– 36b Bolivar, Cañar, Carchi,
14/3/2020) Esmeraldas, Guayas,
Imbabura, Loja, Los
Downloaded from https://academic.oup.com/ve/article/7/2/veab051/6292076 by guest on 14 November 2021
Rios, Morona Santiago,
Pichincha, Tungurahua
E 3 (1.875) 7/4/2020 30/6/2020 2/4/2020 (10/3/2020– 5 Guayas, Manabi
7/4/2020)
F 6 (3.75) 13/4/2020 10/10/2020 12/7/2020 (2/6/2020– 23 Azuay, Bolivar, El Oro,
28/7/2020) Guayas, Loja
G 8 (5) 17/4/2020 7/1/2020 1/4/2020 (25/2/2020– 16 Chimborazo, Imbabura,
9/4/2020) Los Rios
Ha 18 (11.25) 17/4/2020 30/11/2020 21/2/2020b (11/2/2020– 56b Azuay, Cotopaxi, El Oro,
28/2/2020) Esmeraldas, Imbabura,
Loja, Orellana, Pastaza,
Santa Elena, Sucumbios,
Zamora Chinchipe
I 3 (1.875) 29/4/2020 7/8/2020 22/3/2020 (24/2/2020– 38 Guayas
8/4/2020)
J 2 (1.25) 26/5/2020 15/6/2020 22/5/2020 (3/5/2020– 4 Napo
26/5/2020)
K 2 (1.25) 29/5/2020 20/7/2020 25/5/2020 (13/5/2020– 4 Guayas
29/5/2020)
L 5 (3.125) 3/7/2020 19/8/2020 16/6/2020 (8/6/2020– 17 Azuay, Loja, Napo,
2/7/2020) Orellana
M 3 (1.875) 14/7/2020 13/8/2020 30/4/2020 (26/3/2020– 75 Los Rios, Zamora
18/6/2020) Chinchipe
N 7 (4.375) 14/7/2020 20/8/2020 20/6/2020 (19/5/2020– 24 Azuay, Esmeraldas,
12/7/2020) Imbabura, Los Rios,
Orellana, Pichincha,
Zamora Chinchipe
O 3 (1.875) 22/7/2020 7/9/2020 15/7/2020 (2/7/2020– 7 Imbabura
22/7/2020)
P 3 (1.875) 27/7/2020 11/4/2020 9/3/2020 (24/2/2020– 140 Guayas
8/4/2020)
Q 2 (1.25) 11/8/2020 26/11/2020 6/7/2020 (22/5/2020– 36 Guayas, Pichincha
24/7/2020)
R 2 (1.25) 12/8/2020 12/8/2020 9/8/2020 (20/7/2020– 3 Imbabura
12/8/2020)
S 2 (1.25) 1/10/2020 5/10/2020 13/9/2020 (16/8/2020– 18 Cotopaxi, Tungurahua
1/10/2020)
T 2 (1.25) 5/11/2020 9/11/2020 27/10/2020 (5/10/2020– 9 Guayas
4/11/2020)
U 2 (1.25) 9/11/2020 9/11/2020 13/9/2020 (16/8/2020– 57 Guayas
1/10/2020)
V 3 (1.875) 28/11/2020 9/12/2020 21/11/2020 7 Santo Domingo de los
(1/11/2020−27/11/2020) Tsachilas, Sucumbios
a
Transmission complex, composed of two or more potential introductions of very genetically similar viruses.
b
TMRCA of various transmission lineages and sequences outside of Ecuador; node not inferred in Ecuador.
c
Number of days between the inferred TMRCA and the earliest collection date in the transmission lineage.
observed for the second epicentre of the epidemic, the province We note that these patterns could be affected by differences in
of Pichincha, but with fewer different transmission lineages and the number of sequences available for each province (Fig. 1A;
less representation of the youngest transmission lineages (Fig. 3A). Supplementary Fig. S15).B. Gutierrez et al. 9
4. Discussion seeding events (which necessarily have to predate the inferred
TMRCA of a lineage) corresponds to the school holiday period in
The early weeks of the COVID-19 epidemic in Ecuador were char-
the coastal region (February to April), when international travel
acterised by a severe spike in the number of cases in the city of
and large social gatherings are more likely to occur. The inferred
Guayaquil, the largest in the country located in the province of
TMRCAs, which can serve as an upper bound for the true introduc-
Guayas, and by high attack rates (i.e. new cases in a population at
tion dates of the largest lineages (assuming these are better repre-
risk divided by the size of that population at risk) across various
sented with the available sequences), show that these transmis-
coastal provinces (Ortiz-Prado et al. 2021). The outbreak over-
sion lineages most likely arrived in Ecuador before the date when
whelmed local healthcare systems, resulting in one of the highest
non-pharmaceutical interventions (NPIs) were implemented and
excess death rates in the world during early 2020 (Long 2020).
before travel restrictions came into place.
Information about the importation of SARS-CoV-2 into Ecuador
The genetic diversity of SARS-CoV-2 can be quantified using
and the domestic spread of the virus is needed to explain the dras-
the Pango dynamic nomenclature system. Pango lineages reflect
tic effects of the pandemic in the country during March and April
the history of significant events in the epidemic and geographic
2020 and to explain the large difference in disease burden between
spread of the virus (Fountain-Jones et al. 2020) and can be used to
Downloaded from https://academic.oup.com/ve/article/7/2/veab051/6292076 by guest on 14 November 2021
Guayaquil and the capital, Quito.
explore likely source locations of virus importations, for example,
An important determinant of the early dynamics of COVID-19
the high representation of lineages descended from B.1.1 in the
outbreaks has been human mobility and the number of introduc-
province of Guayas (Fig. 1D). The emergence of B.1.1 in Europe
tion events of the virus into a new location with an immunolog-
and North America around February 2020 (Rambaut et al. 2020)
ically naïve population, as was observed during the early stages
might suggest these regions contributed to seeding the epidemic
of the emergence of SARS-CoV-2 in China (Kraemer et al. 2020).
in this province of Ecuador (despite the limitations on identifying
The large proportion of singletons observed in Guayas and various
exact source locations due to poor surveillance in many coun-
other coastal provinces, particularly given their tendency to occur
tries). B.1.1.74, the most prevalent lineage in Ecuador, descended
early in the epidemic (Supplementary Fig. S2), could be suggestive
from B.1.1 and was more frequently sampled in Guayas dur-
of multiple independent introduction events with limited forward
ing the early months of the epidemic (Supplementary Fig. S16).
transmission. This would also explain why the earliest sequences
This further reveals that locations where B.1.1 was prevalent dur-
in the local transmission lineages and the sequences assigned to
ing the epidemic’s first wave likely played a role as importation
the most common Pango lineage in Ecuador (B.1.1.74) were pre-
sources. However, the high proportion of singletons observed in
dominantly sampled in coastal provinces during the early weeks
Guayas also suggests that onward transmission of introduced
of the epidemic (Fig. 2A, Supplementary Fig. S16).
virus was less common. Insights from regions sampled at very
Two additional factors support the hypothesis that Guayas high intensities, such as the United Kingdom, show that the
played an important role in seeding of viral transmission to other majority of introductions lead to small, transient, dead-end trans-
regions in Ecuador: (i) the city of Guayaquil hosts the second mission lineages, whereas a smaller number of introductions
busiest international airport in the country and one of only two lead to larger and longer-lasting transmission lineages (Du Plessis
in the coastal region (the second international airport located in et al. 2021). If this phenomenon is a general property of the first
the province of Manabí hosts limited flights to a few international wave of SARS-CoV-2 transmission, as appears to be the case
destinations; Hidalgo et al. 2020) and (ii) the overall timing of the given similar early observations in Brazil (Candido et al. 2020),
Figure 3. SARS-CoV-2 transmission lineages in Ecuador. (A) Summary of the geographic spread of transmission lineages in Ecuador, showing the
number of provinces where each transmission lineage is found compared to the collection date of the earliest sequence in each transmission lineage
(upper panel) or the inferred median TMRCA for each transmission lineage (lower panel). The trend lines show a linear regression in light blue and a
fitted local polynomial regression in dark blue. (B) Contribution of individual transmission lineages and singleton sequences in each province.
Transmission lineages (shades of blue) are ordered based on the earliest sample collection date in the group from earliest (darker) to more recent
(lighter). (C) Bar plot summarising the provinces where each transmission lineage was sampled over the study sampling period.10 Virus Evolution
Panama (Franco et al. 2021), Uruguay (Elizondo et al. 2021), Spain mobility can help to maximise the utility of smaller samples,
(Díez-Fuertes et al. 2021), and the Netherlands (Oude Munnink collected in settings where the sequencing of large numbers of
et al. 2020), we can expect that many of the introductions to genomes lies beyond local technological or financial capacity, or
Guayas led to few new cases and that most of the ongoing trans- where high sampling densities are unfeasible (e.g. in remote loca-
mission was derived from only a few introductions. This pattern tions). Moreover, the broad range of lag times between the inferred
of transmission heterogeneity would emerge due to the over- TMRCAs and the earliest sampled sequence per transmission lin-
dispersion of SARS-CoV-2 transmission (Lloyd-Smith et al. 2005; eage suggest that a considerable number of transmission lineages
Li, Grassly, and Fraser 2017), a phenomenon that could play an are not detected immediately after being introduced to the coun-
important role in the viral epidemic dynamics (Adam et al. 2020; try, reducing our capacity to identify a potential port of entry
Du Plessis et al. 2021; Geidelberg et al. 2021). and delaying the possibility of responding rapidly to new seeding
The larger transmission lineages identified here suggest that events. This can be particularly relevant for the identification of
virus transmission was high between neighbouring and well- variants of concern, where their potential for higher transmissi-
connected provinces. This might have been an important deter- bility (Faria et al. 2021; Tegally et al. 2021; Volz et al. 2021) could
minant of the transmission dynamics between the main cities in require faster response times to identify the sources of impor-
Downloaded from https://academic.oup.com/ve/article/7/2/veab051/6292076 by guest on 14 November 2021
the country. In contrast to Guayaquil, Quito is the second-largest tation and establish effective contact tracing to contain further
city in the country and presented a much less severe first epi- spread.
demic wave, despite hosting the busiest international airport in The first year of the COVID-19 pandemic has shown how global
the country. The city is located in the province of Pichincha, which connectivity plays a key role in the development of national
exhibits a large proportion of singletons but fewer distinct global epidemics caused by respiratory viruses, reminiscent of other
and transmission lineages overall. Importantly, the transmission pathogens such as influenza viruses (Lemey et al. 2014). Our
lineages observed in Pichincha are mostly not shared with Guayas. results from Ecuador showcase the relevance of importations in
This suggests that either independent international introductions establishing local viral circulation and the potential consequences
or domestic seeding events likely drove the early epidemic in of interprovincial mobility for highly connected locations. In par-
Pichincha. Our phylogenetic analyses suggest that some transmis- ticular, it shows that importations have been a common occur-
sion lineages in Pichincha were introduced from other provinces rence even after the implementation of lockdown measures and
(Fig. 2A, e.g., the monophyletic Pichincha clade in lineage group travel restrictions and that seeding events across provinces can
D*; Supplementary Fig. S6), suggesting that domestic travel might occur frequently. While air travel is limited between provinces,
have played an important role in the establishment of SARS-CoV-2 the connectivity provided by land travel can serve as a means
transmission in this region. It is also possible that a later burst for pathogen spread, highlighting the vulnerability of highly con-
of international introductions of new lineages occurred after air nected and remote locations alike. The notion that two large
travel and lockdown measures were lifted; however, the sampling cities with busy international airports can manifest such different
dates of singleton genomes from Pichincha (between March and transmission dynamics and viral genetic diversity is also relevant,
July) suggest that introductions into this province likely occurred as it shows that a combination of multiple factors determines the
before the lockdown and not during the relaxation of NPIs. The outcome of an epidemic within a specific location. Ultimately, the
Pichincha singletons account for the earliest sequences of this type of interventions chosen to mitigate this high degree of con-
kind in our data set but could represent instances where limited nectivity, the necessity of an early implementation of these inter-
or no additional spread occurred following their introduction. ventions, and the adherence to these by the general population
Ultimately, more comprehensive analyses on the sources and are paramount in determining their efficacy.
drivers of transmission would require a deeper sampling of key
locations where transmission was high, and the inclusion of Data availability
complementary data sources such as real-time mobility and
transportation data could provide a better overview of the forces The newly generated sequences have been publicly shared
shaping the observed viral genetic diversity in Ecuador. Provinces through the GISAID platform. The data sets (including Min-
such as Azuay, Guayas, and Pichincha represent the main air istry of Health and National Institute of Statistics and Census
travel entry points but the role of land mobility across the north- data) and code used to generate the analyses presented in
ern border with Colombia and the southern border with Peru this study, as well as a list of accession numbers for the
should also be considered to further understand the role of other Ecuador SARS-CoV-2 genome sequences analysed here are avail-
Latin American countries in regional viral transmission. able through GitHub at https://github.com/BernardoGG/SARS-
Our analysis highlights some important patterns but is lim- CoV-2_Genomic_lineages_Ecuador. We thank Andrés N. Robalino
ited by various factors. Most notably, the number of genome and Carlos Oporto for their contribution to the open licence Ecua-
sequences in our study, although large by historical standards, is covid repository (https://github.com/andrab/ecuacovid) used to
small compared to the current trends for virus genome sequenc- extract epidemiological data for this study.
ing during the COVID-19 pandemic. The sample size restricts
our ability to infer further details about local virus transmission Supplementary data
dynamics from sequence data alone. The trajectories of individual Supplementary data is available at Virus Evolution online.
lineages, from their international sources to their spread across
the country and their subsequent local circulation, are best anal-
ysed from larger data sets, or in conjunction with additional data
Acknowledgements
sources to manage and ameliorate the potential consequences We would like to thank all the clinical personnel from numerous
of sampling biases (De Maio et al. 2015; Kalkauskas et al. 2021). public and private healthcare institutions who provided access to
Incorporating data from self-reported travel histories and human laboratory-confirmed samples to generate SARS-CoV-2 genomicYou can also read