REVEALING COVID-19 TRANSMISSION IN AUSTRALIA BY SARS-COV-2 GENOME SEQUENCING AND AGENT-BASED MODELING - NATURE
←
→
Page content transcription
If your browser does not render page correctly, please read the page content below
Letters
    https://doi.org/10.1038/s41591-020-1000-7

Revealing COVID-19 transmission in Australia by
SARS-CoV-2 genome sequencing and agent-based
modeling
Rebecca J. Rockett 1,2,10, Alicia Arnott 1,2,3,10, Connie Lam 1,2, Rosemarie Sadsad 1,2,4,
Verlaine Timms 1,2, Karen-Ann Gray 1,2, John-Sebastian Eden 1,5, Sheryl Chang 6, Mailie Gall 3,
Jenny Draper 3, Eby M. Sim 2,3, Nathan L. Bachmann 2,3, Ian Carter 3, Kerri Basile 3,
Roy Byun 7, Matthew V. O’Sullivan 1,2,3, Sharon C-A Chen1,2,3, Susan Maddocks3, Tania C. Sorrell1,2,8,
Dominic E. Dwyer1,2,3, Edward C. Holmes 1,9, Jen Kok 1,2,3, Mikhail Prokopenko 1,6 and
Vitali Sintchenko 1,2,3,8 ✉

In January 2020, a novel betacoronavirus (family                                   The World Health Organization (WHO) declared COVID-19 a
Coronaviridae), named severe acute respiratory syndrome                        pandemic on 11 March 2020, when 118,000 cases had been reported
coronavirus 2 (SARS-CoV-2), was identified as the etiologi-                    from 110 countries. At the time of writing (18 April 2020), the num-
cal agent of a cluster of pneumonia cases occurring in Wuhan                   ber of global cases had surpassed 2,000,000 after multiple indepen-
City, Hubei Province, China1,2. The disease arising from                       dent importations of infection from visitors and returned travelers,
SARS-CoV-2 infection, coronavirus disease 2019 (COVID-19),                     making the control of this disease of prime global public health
subsequently spread rapidly causing a worldwide pandemic.                      importance3,4. Major outbreaks have been documented in South
Here we examine the added value of near real-time genome                       Korea, Iran, the United States and Europe2,3 and person-to-person
sequencing of SARS-CoV-2 in a subpopulation of infected                        transmission has been documented primarily through household
patients during the first 10 weeks of COVID-19 containment                     contacts5, with up to 85% of human-to-human transmission occur-
in Australia and compare findings from genomic surveil-                        ring in family or household clusters6,7. To date, our understanding of
lance with predictions of a computational agent-based model                    the mechanisms of disease spread is limited.
(ABM). Using the Australian census data, the ABM generates                         These events, combined with estimations from epidemic mod-
over 24 million software agents representing the population of                 els, have led to unprecedented measures of disease control being
Australia, each with demographic attributes of an anonymous                    implemented by national governments with profound costs to
individual. It then simulates transmission of the disease over                 citizens and economies. Epidemic models of COVID-19 have sug-
time, spreading from specific infection sources, using contact                 gested that virus transmission can be substantially disrupted by
rates of individuals within different social contexts. We report               rapid detection and quarantine of infectious cases and their con-
that the prospective sequencing of SARS-CoV-2 clarified the                    tacts8. However, validation of COVID-19 modeling predictions has
probable source of infection in cases where epidemiological                    become increasingly important since many models were built using
links could not be determined, significantly decreased the                     incomplete data and thus produced divergent outcomes9,10, affect-
proportion of COVID-19 cases with contentious links, docu-                     ing confidence in public health policy directives. In this study, we
mented genomically similar cases associated with concurrent                    used the combination of near real-time SARS-CoV-2 genomic and
transmission in several institutions and identified previ-                     public health surveillance data to verify inferences from computa-
ously unsuspected links. Only a quarter of sequenced cases                     tional models. Genomic epidemiology is a high-resolution tool for
appeared to be locally acquired and were concordant with pre-                  public health surveillance and disease control11–13. Genomics can
dictions from the ABM. These high-resolution genomic data                      augment conventional epidemiological methods by consolidating
are crucial to track cases with locally acquired COVID-19 and                  contentious links and minimizing the impact of case recall bias,
for timely recognition of independent importations once bor-                   which is particularly important in the context of mild or asymp-
der restrictions are lifted and trade and travel resume.                       tomatic infection.

1
 Marie Bashir Institute for Infectious Diseases and Biosecurity, University of Sydney, Sydney, New South Wales, Australia. 2Centre for Infectious Diseases
and Microbiology–Public Health, Westmead Hospital, Westmead, New South Wales, Australia. 3Centre for Infectious Diseases and Microbiology
Laboratory Services, NSW Health Pathology–Institute of Clinical Pathology and Medical Research, Westmead, New South Wales, Australia. 4Sydney
Informatics Hub, Core Research Facilities, University of Sydney, Sydney, New South Wales, Australia. 5Centre for Virus Research, Westmead Institute
for Medical Research, Westmead, New South Wales, Australia. 6Centre for Complex Systems, Faculty of Engineering, University of Sydney, Sydney, New
South Wales, Australia. 7Health Protection NSW, NSW Ministry of Health, Sydney, New South Wales, Australia. 8Centre for Infectious Diseases and
Microbiology, Westmead Institute for Medical Research, Westmead, New South Wales, Australia. 9School of Life and Environmental Sciences and School
of Medical Sciences, University of Sydney, Sydney, New South Wales, Australia. 10These authors contributed equally: Rebecca J. Rockett, Alicia Arnott.
✉e-mail: vitali.sintchenko@sydney.edu.au

1398                                                                    Nature Medicine | VOL 26 | September 2020 | 1398–1404 | www.nature.com/naturemedicine
NATURE MEDICInE Letters
a c
1,400
Cumulative number of samples
Sequenced Confirmed 250 Date collected
1,200 Date sequenced
200
Number of cases
1,000
800 150
600 100
400
50
200
0 0
19 26 2 9 16 23 1 8 15 22
b
b
b
n
n
n
ar
ar
ar
r
Ap
Fe
Fe
Fe
Ja
Ja
Ja
M
M
M
January February March
30
20
10
29
19
9
9
10
20
30
b d
90 Local—no known contact 2.1 (n = 12)
80 Local—confirmed epidemiological link/known cluster 3.1 (n = 9)
70 1.0 (n = 15)
Number of cases
Acquired overseas 6.0 (n = 7)
60
9.0 (n = 6)
50 100% 0% 16 (n = 6)
40 12 (n = 35)
30 3.0 (n = 5)
20 17.2 (n = 17)
10 17.3 (n = 10)
13 (n = 5)
0
19 26 2 9 16 23 1 8 15 22 19 26 2 9 16 23 1 8 15 22
January February March January February March
Fig. 1 | Timeline of COVID-19 cases and SARS-CoV-2 genome sequencing in NSW. a, Weekly proportions of confirmed COVID-19 cases (gray) that
underwent genome sequencing (orange) during the study period. b, Total counts and proportions of imported (red) and locally acquired cases, both
epidemiologically linked (orange) and of unknown source (yellow) during the study period by epidemiological week. c, Turnaround time of genome
sequencing during the first phase of the epidemic. The date of collection (blue) and date of whole-genome sequencing (orange) for each of the 209
samples included in this study are shown. d, Timelines of genomically defined clusters. Cluster number and the number of cases (in brackets) are indicated
next to the bars. (Only clusters containing five or more cases are shown.) The color gradient reflects the proportion of overseas-acquired cases within the
cluster, with the darkest red representing 100% overseas-acquired cases and yellow representing zero overseas-acquired cases in the cluster.
The COVID-19 pandemic has also triggered unrivaled efforts in SARS-CoV-2 with predictions of a computational ABM. This com-
real-time genome sequencing of SARS-CoV-2. Indeed, thousands parison was performed to assess the impact of potential sampling
of SARS-CoV-2 genomes have already been sequenced interna- bias in genomic surveillance and validate model-based inferences
tionally and made publicly available from the Global Initiative on using experimental data. The synergistic use of high-resolution
Sharing All Influenza Data (GISAID)14. Importantly, the ongoing genomic surveillance and computational agent-based modeling
analysis of this global dataset suggests no notable links between not only improves our understanding of SARS-CoV-2 transmission
SARS-CoV-2 genome sequence variation and virus transmissibil- chains in the community and the evolution of this new virus but
ity or disease severity15. However, even during these early stages of is also important to help mitigate community-based transmissions.
the pandemic, genomic surveillance has been applied to differenti- Between 21 January and 28 March 2020, 1,617 cases of COVID-
ate currently circulating strains into distinct, geographically based 19 were diagnosed and reported to the NSW Ministry of Health. All
lineages and reveal multiple SARS-CoV-2 importations into geo- patients resided in metropolitan Sydney. Before 29 February 2020,
graphical regions of China and the United States16,17. only 4 cases of COVID-19 were detected in NSW, all of which were
Australia, as an island country between the Pacific and Indian imported. The first locally acquired case in NSW was reported on 3
oceans with strong movement of people to and from COVID-19 March 2020, after which a sharp spike in both imported and locally
hotspots in Asia, Europe and North America, has experienced acquired cases occurred during the week commencing 15 March
unique challenges and opportunities in responding to the pan- 2020 (Fig. 1a). Between 1 and 21 March 2020, the weekly proportion
demic. The first laboratory-confirmed COVID-19 patients were of imported cases was between 5 and 20%. During the same period,
diagnosed in Melbourne and Sydney on 25 and 26 January 2020, cases epidemiologically defined as ‘unknown origin/under investi-
respectively. Since then, and as of the end of this study period on gation’ increased from none during the week beginning 1 March
28 March 2020, 3,635 cases had been confirmed in Australia with 2020 to between 31 and 35% from 8 to 21 March 2020 (Fig. 1b).
1,617 cases (44.5%) occurring in New South Wales (NSW), the Of the 1,617 COVID-19 cases reported during the study period,
most populous state of Australia (24.5 per 100,000 population)18. complete viral genomes were obtained from 209 (13%) (Fig. 1a).
The Australian Government introduced progressive epidemic miti- Following an initial delay of 21 d between the date of sample col-
gation measures from 23 March 2020 to limit social interactions, lection and sequencing for the first 3 samples received, the median
reduce virus spread and prevent community-based transmissions. number of days between clinical sample collection and sequenc-
This strategy has been supported by widely available testing for ing was 5 d (range: 1–21 d; Fig. 1c). The proportion of COVID-19
SARS-CoV-2 in NSW, with 1,541 tests performed per 100,000 resi- cases sequenced weekly peaked during the week commencing 1
dents during that time19. March 2020, at 25%. Consensus genome sequences were obtained
In this study, we examine the value of near real-time genome from all specimens with reverse transcription PCR (RT–PCR) cycle
sequencing of SARS-CoV-2 in understanding local transmission threshold values ≤30. The amplicon sequencing method used in
pathways during the containment stage of the COVID-19 epi- this study provided consistently complete, high-quality consensus
demic and compare findings from the genomic surveillance of sequences with a median coverage depth between 227 and 3,409
Nature Medicine | VOL 26 | September 2020 | 1398–1404 | www.nature.com/naturemedicine 1399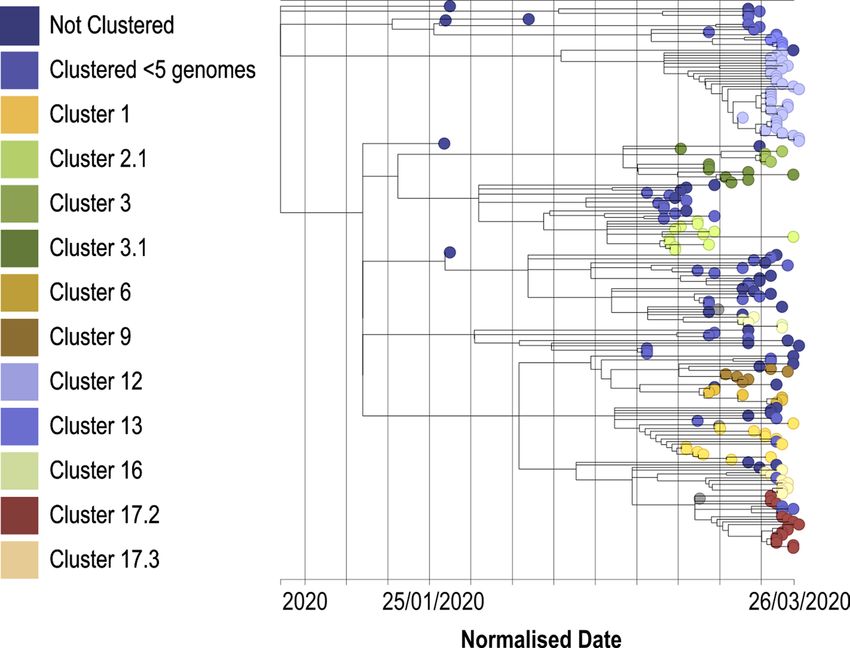
Letters NATURE MEDICInE
a Region b Acquired
Oceania Locally acquired—contact not identified
Asia Locally acquired—known epidemiological
link or cluster
Europe
Acquired overseas
Middle East
Unknown
North America
Cluster identified by genomics
South America
Africa Cluster
Lineage 1
A 2.1
A.1 3
A.2 3.1
A.3 6
A.4 9
A.5 12
B 13
B.1 16
B.2 17.2
B.3 17.3
B.4
B.5
Lineage
B.6
B.7 A
B.8 A.1
B.9 A.2
B.11 A.3
B
State
B.1
NSW
B.2
Northern Territory
B.3
Queensland
Victoria B.4
Western Australia B.6
Fig. 2 | Phylogenetic analysis of SARS-CoV-2 genomes. a, SARS-CoV-2 genomes from Australia in the global context provided by GISAID. Australian
SARS-CoV-2 genomes are color-coded by the state of the initial diagnosis. The inner ring represents global phylogenetic lineages inferred from the final
alignment using pangolin (https://github.com/hCoV-2019/pangolin). The outer ring shows the country of origin of the GISAID genomes. b, Phylogenetic
relationships between SARS-CoV-2 genomes recovered from patients in NSW. The inner ring represents the allocation of clusters in NSW (only clusters
equal or larger than five genomes are presented). The outer ring shows the classification of cases as locally or overseas-acquired based on genomic and
epidemiological data. Bootstrap data for lineage inference is presented in Supplementary Table 1.
(Supplementary Table 1). No important genomic changes were iden- international genomes clustered closely and would fall within 2
tified in the amplicon primer sites of the genomes produced in this SNPs of our index cases, thus supporting the requirement for epi-
study. However, changes in primer binding sites must be monitored demiological evidence of local acquisition and contact tracing to
to ensure the ongoing ability to produce complete SARS-CoV-2 confirm genomic clustering. The phylodynamics of the epidemic
genomes from clinical samples. in NSW were also investigated (Extended Data Fig. 1). However,
The 209 NSW SARS-CoV-2 genomes were dispersed across the because genomic clusters were sampled for a limited period (maxi-
global SARS-CoV-2 phylogeny (Fig. 2a). All major genomic lineages mum 19 d) they displayed only weak temporal structure (R2 = 0.171
of SARS-CoV-2 were detected in NSW (Fig. 2a and Supplementary in a root-to-tip regression). The tracking of cluster evolution over
Table 1), including the introduction and then local transmission time will become important to identify active clusters over a longer
of lineage B.4.2, which is dominated by genomes from Australia sampling period.
that were likely imported from Iran (Fig. 2b). Phylogenetic analy- Genomic surveillance identified previously unsuspected links to
sis identified multiple independent introductions of SARS-CoV-2 other cases and decreased the proportion of COVID-19 cases with
into NSW over time. Most of the genomes from imported NSW contentious links (Fig. 3b,c). Figure 3 quantifies the added clarity
cases grouped with viral sequences from the country of origin. offered by genomics by illuminating the potential sources of infec-
SARS-CoV-2 genomes from ten patients (that is, five household tions that could not be identified using conventional epidemiologi-
contact pairs) were indistinguishable (three of five pairs) or dif- cal methods. Genomic evidence was used to cluster 38.7% (81 out
fered by one single single-nucleotide polymorphism (SNP) (two of 209) of cases for which the available epidemiological data could
of five pairs). However, institutional outbreaks, where cases could not identify direct links (Fig. 3c). This included clustering 12.4%
have only contracted the virus within the institution, demonstrated (26 out of 209) of cases with a history of recent arrival from over-
more genomic diversity. Three institutional outbreaks representing seas with other cases without a travel history and 5.3% (11 out of
35, 17 and 12 cases demonstrated up to 2 SNP differences (a single 209) of locally acquired cases with unknown epidemiological links.
linked case had three SNP differences) between genomes during the Twenty-two (10.5%) of the 209 cases included in this study were
outbreak. The duration of these three institutional outbreaks was epidemiologically classified as ‘locally acquired—contact not iden-
between 6 and 17 d (detailed in Supplementary Table 1). Therefore, tified’. Genomic evidence reduced the proportion of such cases from
we chose to define clusters as sequences that differed by no more 10.5% (22 out of 209) to 3.3% (7 out of 209); 15 out of 22 (68.2%)
than 2 SNPs from the index case in each outbreak (Fig. 3a), with were identified as belonging to 9 genomic clusters containing cases
the index case being the earliest observation of a given sequence. In with known epidemiological links (Fig. 3b). The remaining seven
this study, 27 clusters were identified, of which 8 (29.6%) consisted cases were genomic singletons, not clustering with other genomes.
of 2 cases and 11 (40.7%) contained 5 or more cases. With a single These findings highlight the use of genomic information in the con-
exception, all clusters remained active during the study period (that text of defining disease clusters to inform public health action.
is, they were associated with continuing onward transmission). The In the ABM, the COVID-19 pandemic spread in Australia
11 clusters consisting of 5 or more cases were associated with dif- originated from overseas, with some infections probabilistically
ferent institutions with no overlapping epidemiological connections generated in proportion to the average daily number of incoming
(Fig. 1d). The largest cluster contained 35 cases linked by COVID- passengers at airports, and binomially distributed within a 50-km
19 exposure in a single institution (Fig. 3b). Due to the low genetic radius of each airport20. Figure 4a presents a network formed by
diversity of SARS-CoV-2, both genomic and epidemiological data community transmission chains, or clusters of linked cases, pro-
were needed to define SARS-CoV-2 clusters. Indeed, when compar- duced by an ABM run simulating the period corresponding to the
ing the NSW genomes to the international GISAID dataset, many time interval between weeks 6 and 10 of the study, that is, the period
1400 Nature Medicine | VOL 26 | September 2020 | 1398–1404 | www.nature.com/naturemedicine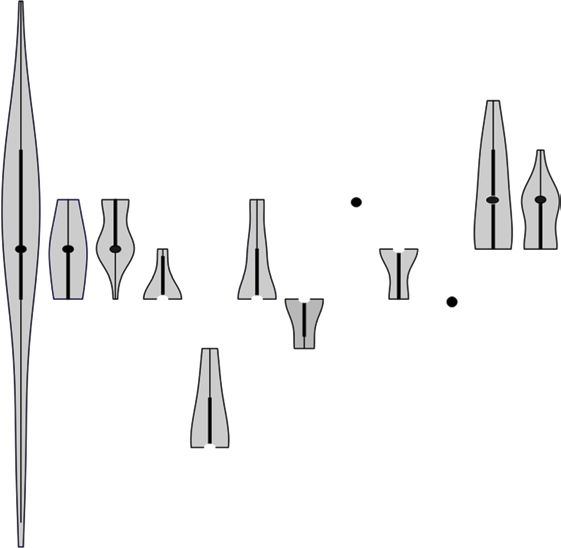
NATURE MEDICInE Letters
a b
14
40
12
10
30
No. of genomes
No. of SNPs
8
20
6
4
10
2
0
Not clustered
Cluster 17.3
Cluster 17.2
Cluster 17.1
Cluster 16
Cluster 13
Cluster 12
Cluster 9
Cluster 6
Cluster 5
Cluster 3.1
Cluster 3
Cluster 2.1
Cluster 2.0
Cluster 1.1
Cluster 1
Clustered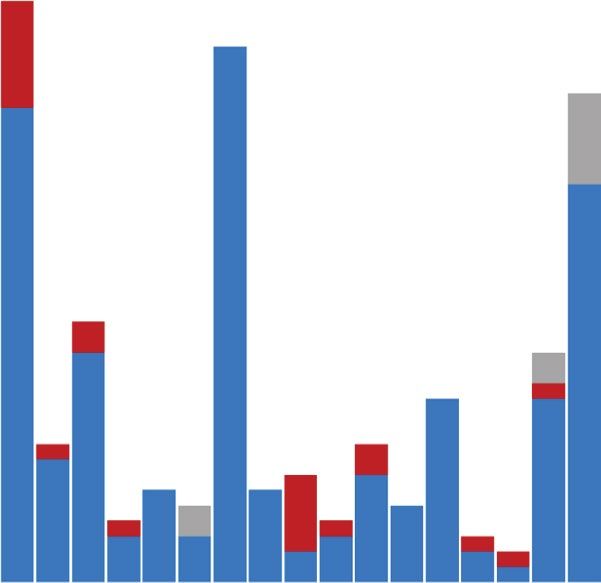
Letters                                                                                                                                                                                               NATURE MEDICInE

                                                   a                                                                                                                                     Household links
                                                                                                                                                                                         Household cluster links
                                                                                                                                                                                         SLA links

                  b                               35                                                      c                       40

                                                                                                                                  35                                   34.9
                                                  30
                  number of transmission chains

                                                                                                                                  30
                  Count of genomic clusters per

                                                                                                         Local transmission (%)
                                                  25                                                                                   25.8
                                                                                                                                  25                                           24.4

                                                  20                                                                              20
                                                                                                                                       18.3            18.6

                                                                                                                                  15
                                                  15
                                                                                                                                                       11.9                        Cumulative local
                                                                                                                                  10                                               transmission
                                                  10
                                                                                                                                                                                   Local transmission at
                                                                                                                                   5                                               week 10
                                                   5                                                                                    Genomic          ABM-derived      ABM-derived (SLA)
                                                                                                                                       surveillance      (household +
                                                                                                                                                       household cluster)
                                                   0
                                                       1   3   5   7     9     11    13     15      17                            19     21       23     25       27          29        31      33         35
                                                                       Number of cases genomic cluster or cases in a transmission chain

                                                                                    Genomic surveillance                               Model-derived

Fig. 4 | Network of SARS-CoV transmission cases generated by the ABM. a, Network of transmission chains originated by initial infections simulated by
the ABM and detected within a given social (mixing) context, such as households, household clusters and SLAs. A directed household (household cluster
or SLA) link connects two infected individuals in the same household (household cluster or local area), with the direction inferred from the corresponding
simulation time steps. A local transmission is defined as any chain formed by links detected within these mixing contexts and may include links across
several contexts. b, Distribution of chain lengths contrasted with the sizes of genome sequencing-defined clusters. Examples of a transmission chain
with 2 cases linked in a household and a transmission chain of 17 cases where cases are linked within household, household cluster and SLA contexts are
shown. c, Comparison of local transmission rates in NSW defined by SARS-CoV-2 genome sequencing and simulated in Australia by the ABM model. The
average over the ten simulation runs is depicted and the error bars represent the minimum and maximum percentages of estimated local transmission
events. Genomic surveillance indicates that 25.8% of SARS-CoV-2 cases in NSW are classified as community-based transmission events over the study
period, with 18.3% of cases collected in the last week of the study classified as community-based transmission.

investigate local transmission of COVID-19. Strengths of this study                                                     probably represents the general population with a spectrum of clini-
include integration of high-resolution genomic data with local epi-                                                     cal disease. We relied on an average sequence depth greater than 200
demiological data and inferences made by agent-based modeling,                                                          to ensure the quality of short read mapping and genome compari-
providing context and confirmation for the genomic results and                                                          sons in line with previous reports21,26, although further optimiza-
clustering. The fine-scale resolution provided by the genomic analy-                                                    tion may be required for sustainable and cost-effective SARS-CoV-2
ses presented in this study is increasingly important for the contain-                                                  surveillance.
ment of local outbreaks through identification of secondary cases                                                           The multiple lineages of SARS-CoV-2 in Australia can be
and providing context for cases of community transmission without                                                       explained by numerous recent, concurrent and independent intro-
apparent epidemiological links21.                                                                                       ductions of COVID-19 from regions with a high frequency of local
    Our findings extend the value of genomic surveillance in depict-                                                    transmission of COVID-19, such as Asia, Western Europe and
ing transmission pathways and evolution of emerging patho-                                                              North America (Fig. 2a). These observations confirm the domi-
gens13,22,23. They also improve our understanding and support the                                                       nance of overseas-acquired infections in these early stages of the
implementation of genomically enhanced surveillance for more                                                            epidemic in Australia before the implementation of border control
efficient COVID-19 control strategies and the investigation of cases                                                    measures on 20 March 2020. Our phylogenetic analysis of unique
with unclear infection sources, with a short turnaround-time16,17,22,23.                                                sequences suggested or confirmed the country of origin in spe-
The power of such surveillance is augmented by international shar-                                                      cific cases and correlated genomically clustered cases with epide-
ing of SARS-CoV-2 genomic data collected by researchers and pub-                                                        miologically linked cases (Fig. 1b). This analysis also documented
lic health microbiology service providers24,25. Our clinical specimens                                                  genomically similar cases associated with concurrent transmis-
originated from a mixture of private and public pathology provid-                                                       sion in several institutions. This observation was based on the first
ers serving hospitals and primary care settings; thus, our sample                                                       10 weeks of the SARS-CoV-2 epidemic in Australia and does not

1402                                                                                             Nature Medicine | VOL 26 | September 2020 | 1398–1404 | www.nature.com/naturemedicine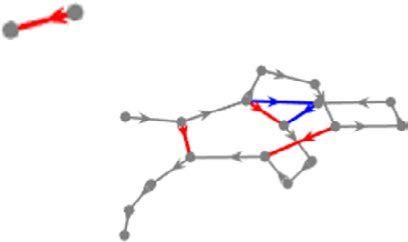
NATURE MEDICInE                                                                                                                            Letters
capture the impact of border control and social/physical distancing                 Our team has implemented an ongoing real-time SARS-CoV-2
measures introduced during this study. The duration of this study               surveillance system to inform public health response. This genomic
was too short to delineate active and inactive clusters. It was also            survey of SARS-CoV-2 in a subpopulation of infected patients
not possible to infer a directionality of virus spread during these             in the first 10 weeks of COVID-19 activity in Australia enabled
early stages of the epidemic since the rate of virus transmission was           proactive monitoring of local transmission events in the criti-
greater than the rate of evolutionary change in the virus genome16.             cal time of implementation of national COVID-19 control mea-
Although the genomic surveillance results are based on a relatively             sures. Only a quarter of cases appeared to be locally acquired and
small number of COVID-19 cases in Australia’s most populous                     genomics-derived local transmission rates were concordant with
state, they offer a high-resolution picture of virus spread in the com-         predictions from the computational ABM. This convergent assess-
munity; the concordance of results from genomic surveillance and                ment improves our understanding of the transition of COVID-19
agent-based modeling reinforces our conclusions.                                from outbreak to pandemic. Integrated analysis of outputs from
    This study leveraged the high resolution of inferences offered              SARS-CoV-2 genomic surveillance and computational models can
by agent-based infectious disease models in contrast to the simula-             refine our understanding of the evolution of the COVID-19 pan-
tion of population-level dynamics models that have been typically               demic and are equally relevant for assessment and informing policy
employed for public health policy decisions. ABMs capture the                   for other emerging pathogens. Application of this high-resolution
interactions of individuals in time and space using government cen-             genomic analysis will be crucial to not only track, trace and place
sus data and detailed transmission pathways, providing insight into             locally acquired COVID-19 cases to ensure targeted and informed
settings where transmission is occurring and how clusters emerge.               public health action, but also for the identification of independent
In our case, the ABM revealed the predominance of early COVID-                  importations once current international border restrictions are
19 transmission at the household and local community level. The                 lifted and trade and travel resume.
convergent estimates of local transmission from the computational
model and genome sequencing not only validated COVID-19 mod-                    Online content
eling predictions but also suggested that our sampling of COVID-19              Any methods, additional references, Nature Research report-
cases has been adequate for discovery and monitoring of local trans-            ing summaries, source data, extended data, supplementary infor-
mission events in the time of co-circulation of genomically similar             mation, acknowledgements, peer review information; details of
strains of SARS-CoV-2.                                                          author contributions and competing interests; and statements of
    While genomic surveillance and the ABM produced congru-                     data and code availability are available at https://doi.org/10.1038/
ent results, they still show some difference, for example, recent               s41591-020-1000-7.
transmission estimates from ABM were slightly higher than the
findings from genomic surveillance, reflecting differences in the               Received: 21 April 2020; Accepted: 25 June 2020;
scope and detection capacity of these approaches. In addition, the              Published online: 9 July 2020
genomic study did not describe transmissions from asymptomatic
carriage, while the ABM did not explicitly simulate transmissions
in hospitals, residential age care facilities, or introduced by mari-           References
                                                                                1. Wu, F. et al. A new coronavirus associated with human respiratory disease in
time traffic, for example, cruise ships. At the same time, the two                  China. Nature 579, 265–269 (2020).
approaches reinforced one another largely by addressing these                   2. Coronavirus Disease 2019 (COVID-19). Situation Report 48
important limitations. Genomic analysis identified transmission                     https://www.who.int/docs/default-source/coronaviruse/situation-reports/20200
occurring in households, the local community and in institutions                    308-sitrep-48-covid-19.pdf?sfvrsn=16f7ccef_4 (World Health Organization,
                                                                                    2020).
within the state of NSW, and the ABM captured the complexity                    3. Coronavirus Disease 2019 (COVID-19). Situation Report 67 https://www.who.
of different mixing contexts across the entire nation, including                    int/docs/default-source/coronaviruse/situation-reports/20200327-sitrep-
schools and workplaces, with different age-dependent transmis-                      67-covid-19.pdf?sfvrsn=b65f68eb_4 (World Health Organization, 2020).
sion rates and heterogeneous contact patterns, accounting for                   4. Li, R. et al. Substantial undocumented infection facilitates the rapid
both symptomatic and asymptomatic infections. The observa-                          dissemination of novel coronavirus (SARS-CoV2). Science 368, 489–493 (2020).
                                                                                5. Ghinai, I. et al. First known person-to-person transmission of severe acute
tions of community transmissions obtained using genomic sur-                        respiratory syndrome coronavirus 2 (SARS-CoV-2) in the USA. Lancet 395,
veillance (25.8% cumulative, with 18.3% during the last week) lay                   1137–1144 (2020).
within the uncertainty intervals estimated by the ABM: house-                   6. Report of the WHO-China Joint Mission on Coronavirus Disease 2019
hold/neighborhood-related transmissions (lower bound: 18.6%                         (COVID-19) https://www.who.int/publications/i/item/
cumulative, with 11.9% during the last week); and local govern-                     report-of-the-who-china-joint-mission-on-coronavirus-disease-2019-
                                                                                    (covid-19) (World Health Organization, 2020).
ment area-related estimates (upper bound: 34.9% cumulative, with                7. Chan, J. F.-W. et al. A familial cluster of pneumonia associated with the 2019
24.4% during the last week; Fig.4c).                                                novel coronavirus indicating person-to-person transmission: a study of a
    The synergistic use of genomic surveillance and ABM                             family cluster. Lancet 395, 514–523 (2020).
highlighted the role of transmission within households and local                8. Anderson, R. M., Heesterbeek, H., Klinkenberg, D. & Hollingsworth, T. D.
communities, even within a large metropolis such as Sydney, and                     How will country-based mitigation measures influence the course of the
                                                                                    COVID-19 epidemic? Lancet 395, 931–934 (2020).
that genomics data in our context may be less affected by assump-               9. Verity, R. et al. Estimates of the severity of coronavirus disease 2019: a
tions required for phylogenetic inference and other biases such                     model-based analysis. Lancet Infect. Dis. 20, 669–677 (2020).
as sampling density, timing of sample collection and quality of                 10. Lourenco, J. et al. Fundamental principles of epidemic spread highlight the
sequencing. Thus, the multimethod ‘socio-genomic’ approach pre-                     immediate need for large-scale serological surveys to assess the stage of the
sented in this study for the examination of emerging epidemics                      SARS-CoV-2 epidemic. Preprint at medRxiv https://doi.org/10.1101/2020.03.2
                                                                                    4.20042291(2020).
makes our findings more robust and aligned with recent calls for                11. Grubaugh, N. D. et al. Tracking virus outbreaks in the twenty-first century.
caution in applying virus genomic data to public health investiga-                  Nat. Microbiol. 4, 10–19 (2019).
tions27,28. Fusion of these two approaches to infer local transmissions         12. Sintchenko, V., Gallego, B., Chung, G. & Coiera, E. Towards
reduced overall uncertainty in the scale of the community transmis-                 bioinformatics assisted infectious disease control. BMC Bioinformatics 10,
                                                                                    S10 (2008).
sion, presenting actionable inputs for public health policymakers. It
                                                                                13. Gardy, J. L. & Loman, N. J. Towards a genomics-informed, real-time, global
must be noted that the actual transmission paths remain uncertain,                  pathogen surveillance system. Nat. Rev. Genet. 19, 9–20 (2018).
presenting an open challenge to disease surveillance and warranting             14. Shu, Y. & McCauley, J. GISAID: Global Initiative on Sharing All Influenza
further research.                                                                   Data: from vision to reality. Euro Surveill. 22, 30494 (2017).

Nature Medicine | VOL 26 | September 2020 | 1398–1404 | www.nature.com/naturemedicine                                                                      1403
Letters NATURE MEDICInE
15. Bedford, J. et al. COVID-19: towards controlling of a pandemic. Lancet 395, 23. Lu, R. et al. Genomic characterisation and epidemiology of 2019 novel
1015–1018 (2020). coronavirus: implications for virus origins and receptor binding. Lancet 395,
16. Deng, X. et al. Genomic surveillance reveals multiple introductions of 565–574 (2020).
SARS-CoV-2 into Northern California. Science eabb9263 (2020). 24. Hadfield, J. et al. Nextstrain: real-time tracking of pathogen evolution.
17. Lu, J. et al. Genomic epidemiology of SARS-CoV-2 in Guangdong Province, Bioinformatics 34, 4121–4123 (2018).
China. Cell 181, 997–1003.e9 (2020). 25. Dos S Ribeiro, C., Koopmans, M. P. & Haringhuizen, G. B. Threats to timely
18. Australian Government Department of Health. Coronavirus (COVID-19) sharing of pathogen sequencing data. Science 362, 404–406 (2018).
current situation and case numbers https://www.health.gov.au/news/ 26. Shen, Z. et al. Genomic diversity of SARS-CoV-2 in coronavirus disease 2019
health-alerts/novel-coronavirus-2019-ncov-health-alert/coronavirus-covid- patients. Clin. Infect. Dis. ciaa203 (2020).
19-current-situation-and-case-numbers (2020). 27. Sintchenko, V., Iredell, J. R. & Gilbert, G. L. Genomic profiling of pathogens
19. NSW COVID-19 Case Statistics by Local Health District (NSW Government, for disease management and surveillance. Nat. Rev. Microbiol. 5, 464–470
2020); https://www.health.nsw.gov.au/Infectious/covid-19/Pages/ (2007).
recent-case-updates.aspx 28. Villabona-Arenas, C. J., Hanage, W. P. & Tully, D. C. Phylogenetic
20. Chang, S. L., Harding, N., Zachreson, C., Cliff, O. M. & Prokopenko, M. interpretation during outbreaks requires caution. Nat. Microbiol. 5,
Modelling transmission and control of the COVID-19 pandemic in Australia. 876–877 (2020).
Preprint at arXiv https://arxiv.org/abs/2003.10218 (2020).
21. Gudbjartsson, D. F. et al. Spread of SARS-CoV-2 in the Icelandic population.
N. Engl. J. Med. 382, 2302–2315 (2020). Publisher’s note Springer Nature remains neutral with regard to jurisdictional claims in
22. Sintchenko, V. & Holmes, E. C. The role of pathogen genomics in assessing published maps and institutional affiliations.
disease transmission. BMJ 350, h1314 (2015). © The Author(s), under exclusive licence to Springer Nature America, Inc. 2020
1404 Nature Medicine | VOL 26 | September 2020 | 1398–1404 | www.nature.com/naturemedicineNATURE MEDICInE Letters
Methods SNP-dists (excluding ambiguities). SNP differences between the 11 clusters
Samples for genomic surveillance. All clinical respiratory samples collected containing 5 or more cases were represented by violin plots using BoxPlotR40 (http://
between 21 January and 28 March 2020, which tested positive by RT–PCR for shiny.chemgrid.org/boxplotr/). Temporal structure and distribution of genomic
SARS-CoV-2 at the Institute of Clinical Pathology and Medical Research (ICPMR) clusters in NSW was visualized using TreeTime (version 0.7.3)41. Phylogenetic trees
were included in the study. The RT–PCR assay used WHO-recommended primers were constructed using the R package ggtree (version 1.99.1)42.
and probes targeting regions in the E gene and RdRp domain.29 Samples were
submitted directly to the ICPMR for RT–PCR testing and also referred from other Synthesis of genomic and epidemiological information. ‘Genomic transmission’
NSW Health Pathology and private pathology laboratories for genome sequencing. in the context of this study refers to the identification of pairs or clusters of cases
Genome sequencing was attempted on all PCR-positive samples with a RT–PCR between which the virus appears to have been transmitted based on high genomic
cycle threshold value ≤30. similarity of no more than 2 SNPs. Epidemiological information was used to
validate and confirm these genomic links. In instances where a discrepancy
Epidemiological data and case definitions. Public health follow-up was between the probable source of acquisition based on genomic and epidemiological
conducted in parallel for each COVID-19 case. Travel histories were collected and data occurred, the source identified on the basis of genomic data was accepted.
used to determine whether infections were acquired locally or overseas. The origin This was implemented to overcome any limitations of epidemiological
and number of confirmed COVID-19 cases detected in NSW during the study information, such as incomplete or incorrect case recall regarding whereabouts and
period were publicly available and obtained from the NSW Health website30. close contacts during their infectious period.
An imported case was defined as a person who tested SARS-CoV-2 RT– All data described in this study were reported and used to inform public health
PCR-positive and reported international travel in the 14 d before illness onset. A action in NSW. As such, on the basis of combined genomic and epidemiological
locally acquired case was a person who tested SARS-CoV-2 RT–PCR-positive and information, all cases were categorized using classifications applied by NSW
had not traveled outside Australia in the 14 d before illness onset. Locally acquired Health, that is, overseas-acquired, local transmission with a confirmed
cases were further classified on epidemiological grounds as confirmed contacts of epidemiological link/part of a known cluster or local transmission with no known
a case, as part of a known cluster or of unknown origin (that is, no known contact epidemiological links. Local, or local genomic, transmission refers to cases who did
with a case). Close contacts were defined as individuals who had been in the same not report overseas travel in the 14 d before illness onset.
closed space for at least 2 h with a laboratory-confirmed case (that is, someone who Cases with no known genomic or epidemiological links were classified as
tested positive for COVID-19) when that person was infectious31. follows. Genomically, these genomes were classified as ‘singletons’ and reported
The decision to close the Australian border to all except Australian citizens, as not clustering with other genomes. If the case had traveled overseas during the
residents and immediate family members was announced on 20 March 2020. Stage 14 d before illness onset, such a case would have been classified as ‘not clustered,
1 and 2 restrictions were implemented on 23 and 26 March 2020, respectively. overseas-acquired’. If the case had not traveled during the 14 d before illness
Stage 1 restrictions included closure of all restaurants, gymnasiums, cinemas and onset, the case was classified as ‘not clustered, local transmission with no known
places of worship, as well as avoiding nonessential travel, outdoor gatherings of epidemiological links’. To identify links between all sequenced cases, each new
>500 and indoor gatherings of >100 people. Stage 2 restrictions were an extension genome generated was analyzed in the context of all others sequenced to date
of stage 1 and included advising the public to stay at home unless going to work from NSW and indeed, internationally. Continued and prospective analysis of all
or education, shopping for essential supplies, undertaking personal exercise or sequences against our expanding local dataset often subsequently revealed links
attending medical appointments or compassionate visits31. between new cases and those that did not cluster previously. In the event that
cases with no known links subsequently clustered with those newly sequenced, the
SARS-CoV-2 genome sequencing. We undertook SARS-CoV-2 whole-genome classification for the case in question was updated in our analysis and reported to
sequencing using an existing amplicon-based Illumina sequencing approach32,33. NSW Health to inform public health action.
Briefly, RT–PCR-positive samples were reverse-transcribed using SuperScript IV
VILO Master Mix (Thermo Fisher Scientific). The viral cDNA was used as input ABM. We used an ABM developed to trace the ongoing COVID-19 epidemic in
for multiple overlapping PCR reactions (approximately 2.5 kilobases each) that Australia20. This model has been specifically calibrated to reproduce several key
spanned the viral genome using Platinum SuperFi PCR Master Mix (Thermo characteristics of COVID-19 transmission in Australia, including its reproductive
Fisher Scientific). Amplicons were then pooled equally, purified and quantified number (R0 = 2.27), the length of incubation and generation periods (5.0 and
before Nextera XT library preparation and multiplex sequencing on an Illumina 6.4 d, respectively), age-dependent fractions of the symptomatic cases (0.669 and
iSeq or MiniSeq (150 cycles)34. All consensus SARS-CoV-2 genomes identified in 0.134 for adults and children, respectively) and the probability of transmission
the study have been uploaded to GISAID (Supplementary Table 1). from asymptomatic/presymptomatic agents (0.3 of symptomatic individuals). The
ABM comprises approximately 24 million software agents, each with attributes
SARS-CoV-2 genome analysis. The raw sequence data were subjected to an of an anonymous individual, matching key demographic statistics from the 2016
in-house quality control procedure before further analysis. Demultiplexed reads Australian census data as well as other data from the Australian Bureau of Statistics
were quality-trimmed using Trimmomatic (version 0.36; sliding window of 4, and the Australian Curriculum, Assessment and Reporting Authority. Contact
minimum read quality score of 20, leading/trailing quality of 5)35. The taxonomic and transmission rates were set to differ across distinct social contexts such as
identification of the sample was verified using Centrifuge v.1.0.4, based on a households, household clusters, local neighborhoods, schools, classrooms and
database compiled from human, prokaryote and viral sequences (including workplaces. The ABM simulation processes and updates agents’ states over time,
SARs-CoV-2 RefSeq sequences available before March 2020)36. All samples had starting from initial infections, seeded in international airports around Australia,
>99% assignment to the genus ‘betacoronavirus’. Reference mapping and consensus using demographics and mobility layers previously developed and applied to trace
calling was performed using iVar v.1.2 (ref. 32). Briefly, reads were mapped to the influenza pandemics43,44.
reference SARS-CoV-2 genome (National Center for Biotechnology Information The ABM simulated several social (mixing) contexts, including households,
(NCBI) GenBank accession MN908947) using Burrows–Wheeler Aligner-MEM household clusters comprising 4 adjacent houses and SLAs, mapped to statistical
v.0.7.17, with unmapped reads discarded. iVar trim was used to soft-clip reads area level 2 in the 2016 census (SLAs are local government areas or part thereof).
containing primer sequences and discard reads 10 and any two infected individuals with the same household identifier, the same
quality >20 with a minimum frequency threshold of 0.1. The 5′ and 3′ untranslated neighborhood (household cluster) label or the same wider community (SLA)
regions were masked from the consensus due to the poor quality of these regions. index. A direction of each link represented the temporal lag, as determined by
QUAST v.5.0.2 was used to evaluate consensus sequence quality in addition the simulation steps when their (symptomatic) infections were detected by the
to manual inspection in Geneious Prime v.2020.0.5 (ref. 37). The SARS-CoV-2 ABM. A local transmission was defined as any chain formed by links detected
genomes from NSW were compared with one another as well as with complete, within these mixing contexts and could include links across several contexts. For
or near-complete, global genomes available at GISAID (www.gisaid.org, accessed example, individuals A1 and A2, infected in the same household A, at different
28 March 2020; see Supplementary Table 2 for the complete list of international simulation steps were considered to form a transmission link A1→A2. Similarly,
genomes used in this study). The quality of GISAID genomes was evaluated using when two infections were detected in the same household cluster, for example,
QUAST, with sequences retained only if they were >28,000-base pairs in length across two households A and B, a directed link was formed, for example, A1→B1,
and containedLetters NATURE MEDICInE
reflects the uncertainty in identifying the transmission source (C1→A2 or A1→A2 39. Guindon, S. & Gascuel, O. A simple, fast, and accurate algorithm
in our example), being informed only by temporal dependencies and the context to estimate large phylogenies by maximum likelihood. Syst. Biol. 52,
labels. Thus, the inclusion of SLA-wide transmissions provides an upper bound on 696–704 (2003).
the extent of community transmission. In other words, transmissions occurring 40. Spitzer, M., Wildenhain, J., Rappsilber, J. & Tyers, M. BoxPlotR: a web tool
across the wider community are detected to investigate the overall connectivity for generation of box plots. Nat. Methods 11, 121–122 (2014).
of emerging local ‘clusters’. The COVID-19 model has been validated with the 41. Sagulenko, P., Puller, V. & Neher, R. A. TreeTime: maximum-likelihood
most recent disease surveillance data, being able to predict both the incidence and phylodynamic analysis. Virus Evol. 4, vex042 (2018).
prevalence peaks in early to mid-April 2020 (ref. 20). 42. Yu, G., Smith, D. K., Zhu, H., Guan, Y. & Lam, T. T.-Y. ggtree: an R package
for visualization and annotation of phylogenetic trees with their covariates
Statistical methods. Descriptive statistics were employed and measurements were and other associated data. Methods Ecol. Evol. 8, 28–36 (2017).
taken from distinct samples. For genome comparison, continuous variables are 43. Cliff, O. M. et al. Investigating spatiotemporal dynamics and synchrony of
presented as the median (range: min–max); discrete variables are presented using influenza epidemics in Australia: an agent-based modelling approach. Simul.
violin plots to display the median, interquartile range and distribution. Categorical Model. Pract. Theory 87, 412–431 (2018).
variables are presented as counts and percentages. For the ABM output analysis, 44. Zachreson, C. et al. Urbanization affects peak timing, prevalence, and
averages and s.d. values were calculated from ten simulation runs. bimodality of influenza pandemics in Australia: results of a census-calibrated
model. Sci. Adv. 4, eaau5294 (2018).
Ethics statement. Clinical specimens were routinely processed at the ICPMR and 45. Fournet, J. & Barrat, A. Epidemic risk from friendship network data: an
deemed not research. A nonresearch determination for this project was granted by equivalence with a non-uniform sampling of contact networks. Sci. Rep. 6,
Health Protection NSW since it was a designated communicable disease control 24593 (2016).
activity. 46. Milo, R. et al. Network motifs: simple building blocks of complex networks.
Science 298, 824–827 (2002).
Reporting Summary. Further information on research design is available in the
Nature Research Reporting Summary linked to this article.
Acknowledgements
Data availability Members of the ICPMR SARS-CoV-2 Study Group include L. Donovan, S. Kumar,
The original/raw SARS-CoV-2 genome sequencing data are available at the NCBI T. Tran, H. Rahman, D. Ko, T. Sivaruban, E. Martinez, A. Ginn, Q. Wang and K.
GenBank (BioProject no. PRJNA633948). The consensus genome sequences for Pey. Members of the ABM team include N. Harding, C. Zachreson and O. Cliff.
national and international genomes are available from GISAID (www.gisaid. We acknowledge the Sydney Informatics Hub and use of the University of Sydney’s
org; see Supplementary Tables 1 and 3). The results of the ABM simulations are high-performance computing cluster, Artemis. We thank the NSW Pathology partner
presented in Supplementary Table 2 and the ABM data sources have been detailed laboratories, ACT Pathology, Douglass Hanly Moir, Australian Clinical Laboratories
elsewhere42,43. and Laverty Pathology for referring samples for genomic surveillance. Expert advice and
epidemiological information provided by the NSW public health surveillance units at
the NSW Health Protection are also gratefully acknowledged. The authors are indebted
Code availability to all researchers and their organizations who have shared SARS-CoV-2 genome data on
No unique pipelines or source code were developed for this project. GISAID. This study was supported by the Prevention Research Support Program funded
by the NSW Ministry of Health and the National Health and Medical Research Council
References Centre for Research Excellence in Emerging Infectious Diseases (no. GNT1102962). V.S.
29. Laboratory Testing for 2019 Novel Coronavirus (2019-nCoV) in Suspected and M.P. are supported by an Australian Research Council grant (no. DP200103005).
Human Cases. Interim Guidance https://www.who.int/publications-detail/ The funders of this study had no role in study design, data collection, data analysis and
laboratory-testing-for-2019-novel-coronavirus-in-susp interpretation, or writing of the article.
ected-human-cases-20200117 (World Health Organization, 2020).
30. Coronavirus Disease 2019 (COVID-19). Control Guideline for Public Health
Units https://www.health.nsw.gov.au/Infectious/controlguideline/Pages/ Author contributions
novel-coronavirus.aspx (NSW Government, 2020). V.S., R.J.R., A.A., D.E.D., J.K., J.-S.E., E.C.H. and M.P. conceived and designed the study.
31. Limits on Public Gatherings for Coronavirus (COVID-19) https://www.health. R.J.R., C.L., V.T., K.-A.G., E.M.S., N.L.B. and I.C. processed and tested the samples.
gov.au/news/health-alerts/novel-coronavirus-2019-ncov-health-alert/ R.J.R., C.L., R.S., V.T., K.-A.G., J.-S.E., M.G., J.D., K.B., R.B., V.S. and E.C.H. carried
how-to-protect-yourself-and-others-from-coronavirus-covid-19/ out the sequencing and analysis. S.C. and M.P. carried out the agent-based modeling.
limits-on-public-gatherings-for-coronavirus-covid-19 (Australian Goverment V.S., S.C.-A.C., M.V.O., S.M., T.C.S., D.E.D. and J.K. coordinated the study. V.S., R.J.R.
Department of Health, 2020). and A.A. wrote the first manuscript draft with editing from E.C.H., R.S., T.C.S, D.E.D.,
32. Grubaugh, N. D. et al. An amplicon-based sequencing framework for S.C.-A.C. and M.P. The final manuscript was approved by all authors.
accurately measuring intrahost virus diversity using PrimalSeq and iVar.
Genome Biol. 20, 8 (2019).
33. Di Giallonardo, F. et al. Evolution of human respiratory syncytial virus (RSV)
Competing interests
The authors declare no competing interests.
over multiple seasons in New South Wales, Australia. Viruses 10, 476 (2018).
34. Eden, J.-S. et al. An emergent clade of SARS-CoV-2 linked to returned
travellers from Iran. Virus Evol. 6, veaa027 (2020).
35. Bolger, A. M., Lohse, M. & Usadel, B. Trimmomatic: a flexible trimmer for Additional information
Extended data is available for this paper at https://doi.org/10.1038/s41591-020-1000-7.
Illumina sequence data. Bioinformatics 30, 2114–2120 (2014).
36. Kim, D., Song, L., Breitwieser, F. P. & Salzberg, S. L. Centrifuge: rapid and Supplementary information is available for this paper at https://doi.org/10.1038/
sensitive classification of metagenomic sequences. Genome Res. 26, s41591-020-1000-7.
1721–1729 (2016). Correspondence and requests for materials should be addressed to V.S.
37. Gurevich, A., Saveliev, V., Vyahhi, N. & Tesler, G. QUAST: quality assessment
Peer review information Jennifer Sargent was the primary editor on this article and
tool for genome assemblies. Bioinformatics 29, 1072–1075 (2013).
managed its editorial process and peer review in collaboration with the rest of the
38. Katoh, K., Misawa, K., Kuma, K.-I. & Miyata, T. MAFFT: a novel method for
editorial team.
rapid multiple sequence alignment based on fast Fourier transform. Nucleic
Acids Res. 30, 3059–3066 (2002). Reprints and permissions information is available at www.nature.com/reprints.
Nature Medicine | www.nature.com/naturemedicineNATURE MEDICInE Letters Extended Data Fig. 1 | Phylodynamics of SARS-CoV-2 clusters in NSW. Timestamped tree with selected genomic clusters (five or more cases); first Australian case was used as reference point. The genomic clusters were sampled for a limited period (maximum 19 days) and displayed weak temporal signal (R2 = 0.171). Nature Medicine | www.nature.com/naturemedicine
nature research | reporting summary
                                                                                                    Corresponding author(s): Sintchenko NMED-L103844C
                                                                                                    Last updated by author(s): Jun 19, 2020

Repor�ng Summary
Nature Research wishes to improve the reproducibility of the work that we publish. This form provides structure for consistency and transparency
in repor�ng. For further informa�on on Nature Research policies, see our Editorial Policies and the Editorial Policy Checklist.

Sta�s�cs
For all sta�s�cal analyses, confirm that the following items are present in the figure legend, table legend, main text, or Methods sec�on.
n/a Confirmed
           The exact sample size (n) for each experimental group/condi�on, given as a discrete number and unit of measurement
           A statement on whether measurements were taken from dis�nct samples or whether the same sample was measured repeatedly
           The sta�s�cal test(s) used AND whether they are one- or two-sided
           Only common tests should be described solely by name; describe more complex techniques in the Methods section.

           A descrip�on of all covariates tested
           A descrip�on of any assump�ons or correc�ons, such as tests of normality and adjustment for mul�ple comparisons
           A full descrip�on of the sta�s�cal parameters including central tendency (e.g. means) or other basic es�mates (e.g. regression coefficient)
           AND varia�on (e.g. standard devia�on) or associated es�mates of uncertainty (e.g. confidence intervals)

           For null hypothesis tes�ng, the test sta�s�c (e.g. F, t, r) with confidence intervals, effect sizes, degrees of freedom and P value noted
           Give P values as exact values whenever suitable.

           For Bayesian analysis, informa�on on the choice of priors and Markov chain Monte Carlo se�ngs
           For hierarchical and complex designs, iden�fica�on of the appropriate level for tests and full repor�ng of outcomes
           Es�mates of effect sizes (e.g. Cohen's d, Pearson's r), indica�ng how they were calculated
                                               Our web collection on statistics for biologists contains articles on many of the points above.

So�ware and code
Policy informa�on about availability of computer code
  Data collec�on         No so�ware was used for collec�on, 2008 near complete genomes were sourced from GISAID (www.gisaid.org: accessed 28th March 2020).

  Data analysis          Demul�plexed reads were trimmed using Trimmoma�c (version 0.36). The taxonomic iden�fica�on of the sample was verified using
                         Centrifuge version 1.0.4. iVar version 1.2 and BWA-mem version 0.7.17 were used for reference mapping. QUAST version 5.0.2 was used to
                         evaluate the consensus sequence quality in addi�on to manual inspec�on in Geneious Prime (2020.0.5). The GISAID and NSW genomes were
                         aligned with MAFFT v7.402. Phylogene�c analysis was performed using the maximum likelihood approach (IQTree v1.6.7). SARS-CoV-2
                         genomic lineages were inferred using Phylogene�c Assignment of Named Global Outbreak LINeages (PANGOLIN) (h�ps://github.com/
                         hCoV-2019/pangolin). Total SNP numbers between the index SARS-CoV-2 genome from NSW (GISAID Accession: NSW01/EPI-ISL-407893) and
                         each genome in the study was calculated using SNP-dists (h�ps://github.com/tseemann/snp-dists version 0.6). SNP differences by violin plots
                         using BoxPlotR. Temporal structure and distribu�on of genomic clusters in NSW was visualised using Tree�me (version 0.7.3). Phylogene�c
                         trees were constructed using R package ggtree (version 1.99.1).
For manuscripts u�lizing custom algorithms or so�ware that are central to the research but not yet described in published literature, so�ware must be made available to editors and
reviewers. We strongly encourage code deposi�on in a community repository (e.g. GitHub). See the Nature Research guidelines for submi�ng code & so�ware for further informa�on.
                                                                                                                                                                                          April 2020

                                                                                                                                                                                              1
Data
nature research | reporting summary
Policy information about availability of data
All manuscripts must include a data availability statement. This statement should provide the following information, where applicable:
- Accession codes, unique identifiers, or web links for publicly available datasets
- A list of figures that have associated raw data
- A description of any restrictions on data availability
The original/raw SARS-CoV-2 genome sequencing data is available in the National Center for Biotechnology Information (NCBI) GenBank (BioProject PRJNA633948).
Consensus genome sequences for national and international genomes are available from the GISAID, (the Global Initiative on Sharing All Influenza Data;
www.gisaid.org) (see Supplementary Tables S1 and S3 for data file details). The ABM simulation data is provided in Supplementary Table S2. NSW Health COVID-19
reports can be accessed at https://www.health.nsw.gov.au/Infectious/controlguideline/Pages/novel-coronavirus.aspx
Field-specific reporting
Please select the one below that is the best fit for your research. If you are not sure, read the appropriate sections before making your selection.
Life sciences Behavioural & social sciences Ecological, evolutionary & environmental sciences
For a reference copy of the document with all sections, see nature.com/documents/nr-reporting-summary-flat.pdf
Life sciences study design
All studies must disclose on these points even when the disclosure is negative.
Sample size All clinical samples initially positive by RT-PCR for SARS-CoV-2 in the study period in our laboratory and the network of laboratories referring
samples to our laboratory were subjected to culture-independent genome sequencing. Our sample represents 13% of all cases diagnosed in
NSW in the study period.
Data exclusions Duplicate samples and sequential positive samples from same patients were excluded from virus population analysis to minimise sampling
bias
Replication Bootstrap analysis was conducted on phylogenetic tree approximation. 1000 bootstraps were achieved successfully. The agent-based model
simulation was repeated ten times to estimate reproducibility of model estimates.
Randomization Randomization was not applicable as we did not have intervention and control arms in the study. It would be ethically challenging to decline
genome sequencing for some of COVID-19 cases and to separate public health investigations between cases or clusters within the same
geographic area or jurisdiction
Blinding Scientists involved in genome data analysis were not blinded to the epidemiological data in order to establish and verify initial criteria for virul
genome clustering
Reporting for specific materials, systems and methods
We require information from authors about some types of materials, experimental systems and methods used in many studies. Here, indicate whether each material,
system or method listed is relevant to your study. If you are not sure if a list item applies to your research, read the appropriate section before selecting a response.
Materials & experimental systems Methods
n/a Involved in the study n/a Involved in the study
Antibodies ChIP-seq
Eukaryotic cell lines Flow cytometry
Palaeontology and archaeology MRI-based neuroimaging
Animals and other organisms
Human research participants
Clinical data
April 2020
Dual use research of concern
2You can also read