Collecting Tweets to Investigate Regional Variation in Canadian English
←
→
Page content transcription
If your browser does not render page correctly, please read the page content below
Proceedings of the 12th Conference on Language Resources and Evaluation (LREC 2020), pages 6255–6264
                                                                                                                                Marseille, 11–16 May 2020
                                                                              c European Language Resources Association (ELRA), licensed under CC-BY-NC

       Collecting Tweets to Investigate Regional Variation in Canadian English
                            Filip Miletic, Anne Przewozny-Desriaux, Ludovic Tanguy
                                               CLLE, CNRS & University of Toulouse
                                                           Toulouse, France
                                   {filip.miletic, anne.przewozny, ludovic.tanguy}@univ-tlse2.fr

                                                                  Abstract
We present a 78.8-million-tweet, 1.3-billion-word corpus aimed at studying regional variation in Canadian English with a specific focus
on the dialect regions of Toronto, Montreal, and Vancouver. Our data collection and filtering pipeline reflects complex design criteria,
which aim to allow for both data-intensive modeling methods and user-level variationist sociolinguistic analysis. It specifically consists
in identifying Twitter users from the three cities, crawling their entire timelines, filtering the collected data in terms of user location and
tweet language, and automatically excluding near-duplicate content. The resulting corpus mirrors national and regional specificities of
Canadian English, it provides sufficient aggregate and user-level data, and it maintains a reasonably balanced distribution of content
across regions and users. The utility of this dataset is illustrated by two example applications: the detection of regional lexical and topical
variation, and the identification of contact-induced semantic shifts using vector space models. In accordance with Twitter’s developer
policy, the corpus will be publicly released in the form of tweet IDs.

Keywords: Twitter, corpus construction, Canadian English, regional variation

                     1.    Introduction                                   As we were unable to find any existing corpus that could
                                                                          meet these criteria, we turned to Twitter, which provides
This paper presents a 1.3-billion-word corpus aimed at
                                                                          large amounts of geotagged linguistic data together with ba-
studying regional variation in Canadian English. It is part
                                                                          sic user information. We collected tweets by identifying
of a wider research effort which builds on previous sociolin-
                                                                          speakers geolocated in three cities corresponding to dis-
guistic studies (Poplack et al., 2006; Boberg, 2012; Rouaud,
                                                                          tinct dialect regions — Toronto, Montreal and Vancouver
2019) and specifically seeks to investigate contact-induced
                                                                          — and then crawling their Twitter timelines. We verified
semantic shifts in Quebec English. We aim to identify these
                                                                          the pertinence of the collected data by filtering the location
linguistic traits by contrasting the English used in Quebec,
                                                                          information indicated in the user profile, eliminating non-
where the majority of population is French-speaking, to va-
                                                                          English tweets, and automatically excluding near-duplicate
rieties of English spoken in Canadian regions where the use
                                                                          content. The resulting corpus contains 78.8 million tweets
of French is limited. Our approach relies on data-intensive
                                                                          posted by 196,000 recently active users, with the content
methods such as distributional semantic models, but we
                                                                          roughly equally distributed across the three regions. Its
maintain a variationist sociolinguistic perspective (Labov,
                                                                          utility is illustrated by two case studies, respectively focus-
1972; Tagliamonte, 2006) grounded in fine-grained analy-
                                                                          ing on the detection of regionally-specific lexical variants
sis of the linguistic behavior of individual speakers.
                                                                          and of contact-induced semantic shifts. In accordance with
This methodological framework translates to the following                 Twitter’s developer policy, the corpus will be released as a
corpus design criteria: (1) the corpus should reflect the                 list of tweet IDs together with instructions on how to collect
specificities of the English spoken in Canada, as opposed                 the complete data using off-the-shelf software.1
to corpora of other national varieties of English or more                 The remainder of this paper is organized as follows. Section
generic datasets; (2) additional geographic metadata is nec-              2 presents an overview of related work; Section 3 discusses
essary to compare different regional varieties of Canadian                data collection and filtering methods; Section 4 outlines
English: the province of origin of individual texts in the                the corpus structure; Section 5 introduces the case studies
corpus is required as a minimum; (3) each regional subcor-                conducted on the corpus; Section 6 provides a conclusion
pus must meet a minimum size threshold of ≈ 100 million                   and possible directions of future work.
words in order for the proposed data processing methods
to produce reliable results; (4) the reliance of these meth-                                   2.    Related work
ods on features such as co-occurrence frequencies entails                 Diachronic semantic change, a research question closely re-
the need to limit sources of bias such as an irregular dis-               lated to synchronic semantic variation, has been addressed
tribution of content across authors or a pervasive presence               in recent years using distributional semantic models, which
of spam or other types of noise; (5) sociolinguistic analy-               represent each word as a vector whose values reflect its co-
sis of ongoing synchronic language variation requires data                occurrence statistics. A frequent approach involves train-
that is recent, largely contemporaneous, and produced in a                ing distributional models on large corpora from different
reasonably spontaneous communicative context by individ-                  time periods, and then comparing vector representations
ually traceable speakers; (6) the identification of individual            of a single word across the periods in order to detect se-
speakers should allow us to examine inter-speaker variation               mantic change (Gulordava and Baroni, 2011; Kim et al.,
within the local community: a description of the languages                2014; Hamilton et al., 2016; Dubossarsky et al., 2017;
the individuals speak is necessary given Canada’s multilin-
                                                                          1
gual environment and our focus on language contact.                           http://redac.univ-tlse2.fr/corpora/canen.html

                                                                     6255
Del Tredici et al., 2019). Limited comparable work has also
been done on synchronic semantic variation across domains
(Del Tredici and Fernández, 2017; Fišer and Ljubešić,
2018).
The approach outlined above can be applied to the detection
of synchronic semantic variation across Canadian regions
by training distributional models on corpora from different
regions. However, while large generic diachronic corpora of
English are readily available, that is not the case for regional
varieties of English used in Canada.
Corpus Tokens Geographic information
Strathy 50m country text metadata
GloWbE 134m country text metadata
iWeb 308m country website domain
NOW 898m country text metadata
ENCOW16 222m city website IP address
JSI 1.3b city place of publication
Table 1: Existing corpora containing Canadian English
data, with the size of the Canadian section (best estimates
at the time of writing) and the granularity and origin of
geographic information
Existing publicly available corpora of Canadian English are
presented in Table 1 above. They include the Strathy Corpus
of Canadian English (Strathy Language Unit, 2011), com-
prised of written and oral texts covering a variety of genres
and historical periods, as well as the Canadian sections
of multinational corpora such as Global Web-based En-
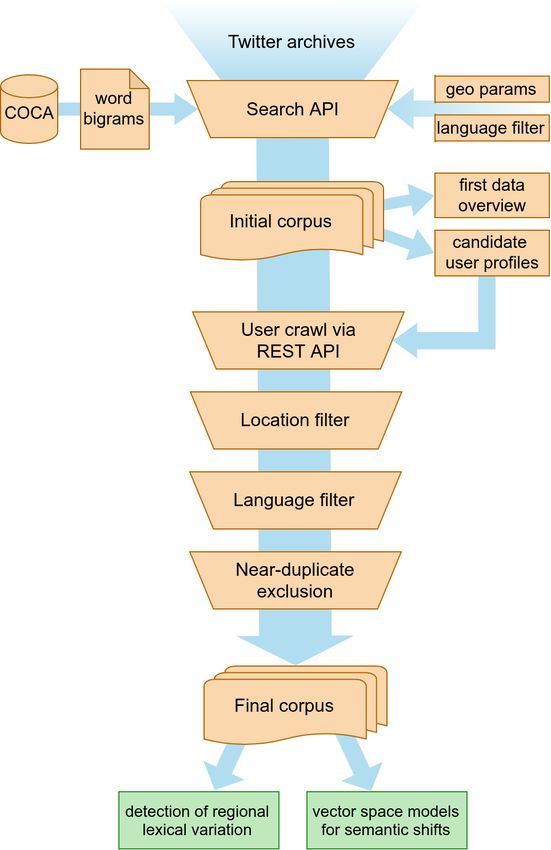
glish (GloWbE) (Davies, 2013a), News on the Web (NOW) Figure 1: Data collection and filtering pipeline with
(Davies, 2013b), and iWeb (Davies, 2018). However, these possible applications of the corpus
are all of limited utility in studies of regional variation, as
the only provided geographic information is the country
from which individual texts originate. steps: (1) an initial data collection which principally aims
City-level geolocation is available in two large web-based to identify Twitter users in geographic areas of interest; and
corpora with Canadian content, but it is of questionable reli- (2) a subsequent crawl of the indexed users’ timelines.
ability. ENCOW16 (Schäfer and Bildhauer, 2012; Schäfer, The first step was implemented by repeatedly querying Twit-
2015) derives geographic information from website IP ad- ter’s Search API in conjunction with geographic and linguis-
dresses, meaning that it locates the servers hosting the web- tic filters. We used as search terms the 20,000 most frequent
sites rather than their users. In contrast, the JSI Newsfeed word bigrams in the 1-billion-word Corpus of Contempo-
Corpus (Bušta et al., 2017) geotags online journalistic con- rary American English (COCA) (Davies, 2011). COCA
tent based on its place of publication, but the solidity of this is composed of texts that are roughly equally distributed
information is counterbalanced by considerable divergences over 30 years (1990-2019) and 8 genres, ranging from aca-
in the amount of data originating from different Canadian demic to spoken language. While the most frequent bi-
regions. Moreover, other corpus design criteria, such as grams in the list are sequences of function words (e.g. of
the ability to identify all linguistic content produced by the the), the majority include content words in commonly oc-
same speaker, are not met by any of the 6 cited corpora. curring patterns (e.g. they work, my car, interest in). Our
As for Twitter, it has been used to study variation and change approach is similar to the use of mid-frequency words to
in different regional varieties of languages including En- crawl web corpora (Baroni and Bernardini, 2004; Schäfer
glish (Doyle, 2014; Eisenstein et al., 2014; Huang et al., and Bildhauer, 2012), but like Scheffler (2014) we found that
2016; Shoemark et al., 2017) and Spanish (Gonçalves and high-frequency search terms were more efficient on Twitter.
Sánchez, 2014; Donoso and Sánchez, 2017). External de- Overall, this stage allowed us to identify English-speaking
mographic information has been used to approximate vari- users living in Toronto, Montreal and Vancouver, and more
ables such as gender (Bamman et al., 2014) and ethnicity generally to gain an initial insight into the gathered data.
(Jones, 2015; Jørgensen et al., 2015; Blodgett et al., 2016). The second step consisted in collecting all available tweets
published by the initially indexed users. The aim was to
3. Data collection and filtering increase the amount of available data while balancing the
Similarly to previous work on collecting geotagged Twitter size of the regional subcorpora, as well as to obtain enough
data (Ljubešić et al., 2014; Barbaresi, 2016), our data col- tweets published by individual users to analyze speaker-
lection pipeline, illustrated in Figure 1, comprises two main specific linguistic patterns. Tweets written in all languages
6256were initially retained to allow for a description of the overall
linguistic profile of the corpus.
The collected data were subsequently filtered by (1) veri-
fying user profile locations to confirm that they reference
one of the targeted cities; (2) excluding tweets written in
languages other than English; (3) excluding near-duplicate
tweets to limit the impact of repetitive or automatically gen-
erated messages.
3.1. Choice of geographic areas
Tweet collection was geographically constrained to
Canada’s three most populous cities: Toronto (Ontario),
Montreal (Quebec), and Vancouver (British Columbia).
From a practical point of view, the choice of these cities Figure 2: Cumulative number of identified users per
was motivated by the need for a sufficiently large local user subcorpus
base allowing us to collect enough data over a reasonably
short period of time. Moreover, and more crucially, the previously unavailable data.
cities belong to distinct dialect regions (Boberg, 2005), as A total of 50 iterations were completed between mid-
is also evidenced by their demographic profile. January and mid-November 2019. The resulting corpus
Montreal is home to 80% — or around 890,000 — of Que- contains 58,451,998 tweets published by 679,785 distinct
bec’s English speakers, but they represent only 22% of users. As shown in Figure 2, 50.6% of users were identified
the city’s population. Conversely, in Toronto and Vancou- in the first 5 iterations, but subsequent queries still provided
ver the dominant language is English, with only 1.7% and a constant and non-negligible flow of new data. However,
1.3% of population, respectively, speaking French (Statistics the number of collected tweets per user varies considerably
Canada, 2017). We aim to detect contact-related phenom- (top 1% of users account for 36.6% of tweets), as does the
ena, and limit the impact of those deriving from unrelated number of identified users across regions (108,383 in Mon-
regional variation, by examining the linguistic properties treal, 158,762 in Vancouver and 412,640 in Toronto). That
that are specific to Montreal and distinguish it from both said, this initial dataset is a valuable starting point for more
Toronto and Vancouver. controlled user-level tweet collection.
Data collection was limited to tweets sent from the The search method was chosen over the better-known
metropolitan areas of the three cities, all of which are highly Streaming API, which returns a real-time sample of tweets,
multicultural. This means that our corpus may contain mes- as it yielded considerably more data. For comparison,
sages posted by non-native speakers of English. We there- we ran the Streaming API for 30 days in October 2019
fore attempted to create corpora of smaller, more homo- with comparable geographic parameters, obtaining 925,668
geneous communities (West Island of Montreal; Oshawa– tweets published by 57,218 individual users. Over the same
Whitby, ON; Victoria, BC), but this led to a multifold de- period of time, 6 iterations of the Search method were
crease in collected data and was deemed too inefficient. completed, yielding 8,332,629 tweets published by 303,538
users. In other words, the use of the Streaming API led to
3.2. Initial tweet collection a roughly ninefold decrease in collected data and a fivefold
An initial corpus was created using Twitter’s Search API, decrease in identified users compared to our approach.
which looks up queries in a sample of recently published This is largely due to the fact that the Streaming API only
tweets. The queries were filtered geographically by indicat- takes into account tweet-level location data: precise geolo-
ing the targeted areas as a radius around a point of interest, cation, when the tweet is tagged with the precise geographic
defined using geographic coordinates. Since this stage only coordinates of the user’s location at the time of tweeting; or
aimed to identify English speakers, data collection was re- manual geolocation, when the user chooses the place asso-
stricted to tweets tagged by Twitter as written in English. ciated with the tweet from a list of proposed options or by
Moreover, search parameters were used to exclude retweets looking up a specific place. These features are only avail-
from the results: the diffusion of content posted by oth- able on mobile devices and are actively used by a fraction of
ers may be indicative of the popularity of different subjects all users, which limits the availability of geotagged tweets.
across regions, but our focus is on individual users’ linguis- In our case, this is further affected by tight geographic con-
tic production rather than their topical interests. straints and a comparatively small number of targeted users
As mentioned above, we queried the Search API using the (especially English-speaking Montrealers). An alternative
20,000 most frequent word bigrams from COCA. For each solution was proposed for the German Twitter Snapshot
bigram in the list, all available tweets in the targeted ge- (Scheffler, 2014), which collected tweets published in Ger-
ographic areas were collected. As a single iteration over many by tracking words specific to German rather than ap-
the entire list takes an average of 5 days, repeating itera- plying geographic filtering. We could not implement this
tions allows us to move chronologically through Twitter’s method, as only a fraction of all English-language tweets
archives. By the time an iteration is completed, the temporal are posted in Canada.
window of available tweets (6–9 days preceding the query) As for the Search API, it maximizes the amount of data re-
also shifts, meaning that the next iteration mostly returns turned by geographic queries by interpreting non-geotagged
6257tweets (93% of our initial dataset) as sent from the location tweets. Others still may have been retained even though
indicated in the user profile. In related previous work, cor- multiple cities are indicated in their profile.
pora were created for three closely related languages with We therefore used a heuristic to additionally filter the places
limited coverage in the Streaming API — Croatian, Serbian indicated in the location field in the user profile. In
and Slovene — by querying the Search API using words order for a user to be retained, the field must include the
specific to the targeted languages, without geographic pa- name of one of the examined cities (e.g. Montreal). It may
rameters (Ljubešić et al., 2014). While this approach avoids additionally include the name of the corresponding province
issues related to the reliability of geolocation, it is not di- (e.g. Quebec), the name of the country (e.g. Canada), as well
rectly applicable to our case. Lexical variants distinguish- as generic geographic descriptors (e.g. north, greater, metro
ing dialect regions are both less numerous and less frequent etc.). No other elements were accepted.
than words differentiating distinct languages, which would In the Montreal subcorpus, profile locations were indicated
impact the efficiency of this method and would potentially in 7,719 distinct ways (after being lowercased and stripped
introduce a bias towards speakers who use regionalisms of punctuation and diacritics). Of these, 46 meet the above
more frequently. criteria and were used by 69% of the identified users. The
Although both tweet-based and profile-based geolocation individual realizations differ in terms of the order and preci-
may introduce a demographic bias (Pavalanathan and Eisen- sion of included information (Montreal vs. Montreal West,
stein, 2015), our reliance on manually indicated user profile Quebec), orthographic choices (Montreal vs. Montréal), use
location is justified by a considerable increase in collected of abbreviations (Quebec vs. QC) and punctuation. Out of
data as well as by its sociolinguistic significance: this lo- the 7,673 rejected locations, 6,872 (used by 22% of users) in-
cation corresponds to the place users consciously associate dicate multiple targeted cities (Montreal & Toronto), places
with their online presence. Moreover, precise tweet-level outside of the search area (Ottawa) or insufficient geo-
geolocation will become limited to tweets containing pho- graphic information (Canada). The remaining 801 loca-
tos or videos,2 which will affect data collection pipelines tions (used by 9% of users) refer to neighborhoods (Plateau
relying on this type of geographic information. Mont-Royal) or points of interest (McGill University) in the
search area, but were excluded due to the presence of lex-
3.3. User profile crawling ical items which are too specific to include in the filtering
After identifying a sufficient number of users, their entire heuristic. Based on the number of classified users, the
timelines were crawled subject to the Twitter-imposed limit Montreal subcorpus heuristic obtained an F-score of 0.94.
of 3,200 most recent tweets per user (including retweets). Comparable patterns were also observed in the Toronto and
In order for the final regional subcorpora to be compara- Vancouver subcorpora.
ble in size, we included the 108,383 users indexed in the
initial Montreal subcorpus, as well as the same number of 3.5. Language identification
randomly sampled users in each of the larger Toronto and As previously mentioned, the populations of Toronto, Mon-
Vancouver subcorpora. The crawl was performed for two treal and Vancouver are all highly multilingual. While the
batches of users, in April and November 2019, respectively. initial data collection parameters ensure that the identified
In addition to excluding retweets based on Twitter metadata, users have sent at least one tweet tagged as English, crawl-
we followed common practice in eliminating the messages ing their entire timelines provides a clearer picture of the
that contain the RT @ string in their text. This case, affect- languages they actually use. The distribution of language
ing 0.7% of collected tweets, corresponds to comments of tags outlined in Table 2 shows that English is by far the
other users’ messages embedded in tweet text so it has the most frequent language in the corpus, but, in addition to the
potential to distort user-level word frequencies. Moreover, expected use of French in Montreal, immigrant languages
we only retained tweets with at least 2 words in addition to are also present. Since we only aim to investigate regional
any hashtags, user handles and URLs. While this led to the differences affecting English, tweets tagged as written in
exclusion of 8.7% of collected tweets, it ensured that each other languages (15.5% overall) were excluded.
retained tweet contained at least some linguistic content as
opposed to being a list of Twitter-related entities. Unlike in Montreal Toronto Vancouver
the initial data collection, no language restrictions were sent en 69.7% en 93.4% en 92.4%
to the Twitter API in order to allow for a subsequent analysis fr 22.6% es 1.2% es 1.6%
of the languages that are actively used by individual users. es 2.3% tl .8% pt 1.1%
3.4. Location filtering pt .7% pt .7% tl .9%
Since we are interested in the linguistic communities of ar .6% fr .6% fr .6%
Toronto, Montreal and Vancouver, we aim to restrict data other 4.1% other 3.3% other 3.5%
collection to the users who explicitly declare that they live total 100.0% total 100.0% total 100.0%
in these cities. While the geographic parameters used with
Table 2: Distribution of tweets across the top language tags
the Search API correspond to these areas, some users in
(components may not sum to totals due to rounding)
the corpus may have been identified independently of their
profile locations, based solely on individually geotagged
The decision to use Twitter-provided language tags was pre-
2
https://twitter.com/TwitterSupport/status/ ceded by an evaluation of third-party systems on a manu-
1141039841993355264 ally annotated sample of 494 monolingual English tweets
6258and 420 monolingual French tweets, grouped into balanced 3.6. Near-duplicate exclusion
categories with 2, 5, 10, 15 or 20 words per tweet. We A frequent issue in Twitter-based corpora is the presence of
focused on English and French because, in addition to be- near-duplicate messages generated by both automated spam
ing Canada’s two official languages and the center of our accounts and prolific human users. Attempts are usually
research objectives, they correspond to the most frequent made to filter out this content as it can bias word frequen-
language tags in the corpus. We tested three widely used off- cies. A common approach consists in excluding accounts
the-shelf language identification systems — langid.py that exceed defined cut-off points in terms of the number of
(Lui and Baldwin, 2012), cld2 (McCandless, 2014) and tweets, followers, followees etc., or in excluding all tweets
langdetect (Nakatani, 2010) — and a majority-vote sys- containing URLs or other specific strings. These method-
tem combining the three methods, proposed in an earlier ological decisions are based on the potential link between
evaluation (Lui and Baldwin, 2014). The results in Table 3 these user account features and spam production (Yardi et
show that all systems are consistently reliable except on very al., 2010).
short tweets. As expected, the vote-based system performs Such solutions, however, do not take into account the fact
on par with or improves on the best individual F-scores. that user behavior on Twitter is often heterogeneous. We
We further compared the performance of the evaluated sys- manually analyzed the 20 users in our corpus with the high-
tems to the language tags indicated in tweet metadata. While est number of posted tweets in their profiles. We observed
we are unable to report the quantitative results because Twit- that 7 accounts indeed publish exclusively near-duplicate
ter’s developer policy3 prohibits the benchmarking of their content such as song titles played by radio stations, while
services, we do not find it necessary to implement a third- another 2 post a mix of similarly generated tweets and spon-
party language identification system in our pipeline. The taneous messages. However, the remaining 11 accounts are
systems we evaluated on English and French occasionally all consistent with genuine human communication.
provide marginal improvements compared to Twitter’s tags, As 2 of these are corporate Twitter profiles where different
but their performance is overall less consistent. social media managers interact with the public, we focused
on the 9 accounts which are used by individual speakers.
Words per tweet To varying extents, they all produce genuine tweets as well
System
2 5 10 15 20 all as ones that are automatically generated by, for example,
langid .822 .964 .989 .994 1.000 .963 posting content on other social media sites. In some cases,
langdetect .896 .917 .989 .989 1.000 .963 the high number of published tweets is actually driven by
cld2 .793 .898 .971 .967 1.000 .935 retweets, while the content of original posts is similar to that
vote .902 .976 .994 .994 1.000 .979 of average accounts. Moreover, while some tweets contain-
ing URLs merely reference external content (e.g. titles of
Table 3: Macro-averaged F-score on manually annotated linked videos), others include fully acceptable messages.
English and French tweets of different lengths Taking into account this variety of behaviors, we imple-
mented a system whose aim is not to exclude all tweets
However, the use of Twitter’s language tags raises an- posted by the users most likely to produce spam, but rather
other potential issue. Practices such as borrowing and to distinguish, within the production of each individual user,
codeswitching are frequent among bilingual speakers, the tweets that are of genuine interest from near-duplicate
meaning that multiple languages may be used in a tweet, content. For each user, a distance matrix was calculated
whereas only one language tag is indicated in the metadata. for all their tweets. We used Levenshtein’s distance, which
This problem was evaluated on a balanced sample of 1,000 quantifies the difference between two strings of characters
tweets tagged by Twitter as English or French. We manually as the number of edit operations (character insertions, dele-
identified other-language content in 65 tweets: 60 written tions or substitutions) necessary to modify one string of
in these two languages, and 5 written in English or French characters into the other.
and another language. Note that most identified tweets (56 As our aim is to exclude messages with similar linguistic
out of 65) were tagged as French. content independently of Twitter-specific entities, we re-
We attempted to automatically identify the languages in moved hashtags, user handles and URLs from tweet text.
multilingual tweets using the top 2 predictions produced In calculating the absolute Levenshtein’s distance, replace-
by each of the tested language identification methods. A ment operations were assigned a weight of 2 in order for
majority vote system was also implemented based on the 2 the distance between entirely different strings of characters
most frequent language tags from the individual predictions. to be equal to the sum of their lengths. This distance was
The best accuracy was obtained by langdetect, which then normalized by dividing it with the total number of
correctly analyzed 25% of tweets. characters in a pair of tweets. A normalized score of 0 cor-
Given the relative rarity of other-language items and the poor responds to identical strings, and a score of 1 to strings with
performance of the tested language identification systems, no overlapping characters.
multilingual content filtering has not been implemented. After calculating the distance matrix, near-duplicate tweets
Word-level language identification may provide more pre- were identified using hierarchical clustering. We excluded
cise results and is a possible direction of future work. all clusters where the distance between individual tweets
did not exceed 0.45. This cut-off point was determined
3 empirically, as it was found to correspond to a reasonable
https://developer.twitter.com/en/
developer-terms/agreement-and-policy balance between precision and recall. While the identifi-
6259cation of near-duplicates published by different users may display text range, i.e. tweet text stripped of tweet-initial
further improve the quality of our data, it is computationally user handles referring to conversation chains and of tweet-
prohibitively expensive with the current method. final URLs mostly used to embed media. This represents
We more closely examined the performance of our sys- 97.7% of analyzed text content. No further removal of
tem by focusing on precision; recall was not evaluated at Twitter-related entities was performed, as they are often
this stage due to the significantly higher complexity of the syntactically integrated in the tweet text and can also provide
task for human annotators. We analyzed a random sam- insights into bilingual communication (e.g. hashtags used
ple of 10 user profiles, for which we had collected a total in a language different from the rest of the tweet).
of 6,317 English-language tweets. The system excluded
1,956 tweets, grouped into 691 distinct clusters, as near- Subcorpus Users Tweets Tokens
duplicates. For each cluster, we manually annotated the Montreal 72,305 23,469,526 384,740,451
degree of similarity of the identified tweets: strong, for Toronto 64,164 28,442,928 481,126,844
tweets that are near-identical in form and meaning; partial, Vancouver 59,962 26,924,158 473,322,674
when repetitions concern parts of the text, while the mean- Total 196,431 78,836,612 1,339,189,969
ing remains similar across the tweets; weak, when isolated
words are shared between tweets whose overall meaning is Table 5: Corpus structure
not strongly related; none, when similarity is only reflected
by character patterns rather than words. We initially crawled 325,000 Twitter profiles across the three
cities. Of these, nearly 11,000 were inaccessible at the time
Similarity Clusters Tweets of the crawl because they had been deleted or had become
Strong 209 30.2% 896 45.8% private following their initial identification. While this is a
Partial 278 40.2% 645 33.0% tolerable loss of data (3.2% of accounts), we plan to improve
Weak 165 23.9% 337 17.2% the efficiency of our pipeline by crawling individual user
None 39 5.6% 78 4.0% profiles as soon as they are identified by the Search API.
Total 691 100.0% 1,956 100.0% More significantly, 118,000 accounts (36.2%) were ex-
cluded based on their profile location. Out of the 132 million
Table 4: Analysis of clusters of tweets identified as tweets retained after user-level geographic filtering, 15.5%
near-duplicates (components may not sum to were rejected because they were not written in English and a
totals due to rounding) further 24.7% were excluded as near-duplicates. The filters
we implemented led to a considerable reduction in corpus
As indicated in Table 4 above, 21.2% of analyzed tweets size, but they ensure the reliability of collected data.
were affected by some type of misclassification, i.e. exclu- Before the exclusion of non-English-language content from
sions based on weak or inexistent similarity. However, the the corpus, the users were analyzed according to the lan-
latter category, corresponding to clearly erroneous exclu- guages they use on Twitter. For each user, we calculated the
sions related to the simplicity of Levenshtein’s distance as a proportion of English language tweets (out of all English
similarity measure, was limited to 4% of tweets. As for the and French tweets) and the proportion of tweets in English
tweets presenting weak similarity (17.2%), they are admit- and French (out of all tweets). Figure 3 above suggests
tedly related to minor overlaps in content, but it is difficult that we identified predominantly English-speaking individ-
to estimate how beneficial their inclusion would have been uals, as well as some demonstrably bilingual speakers. As
for the corpus as they are often limited size or informational expected, the use of French is more frequent in the data col-
value. Moreover, these exclusions are related to structural lected in Montreal compared to the other two cities, whereas
similarity rather than, for example, specific topics, so they
are not expected to negatively affect co-occurrence statis-
tics. We overall consider this loss of data to be outweighed
by the benefits of cleaner, less repetitive content.
4. Corpus description
The corpus obtained after crawling individual user profiles,
performing language and location filtering and excluding
near-duplicate content contains 78.8 million tweets posted
by 196,431 individual users. After tokenizing the corpus
with twokenize (Gimpel et al., 2011; Owoputi et al.,
2013), this corresponds to 1.3 billion tokens. On average
401 tweets were collected per user; the top 1% of users ac-
count for 6.2% of tweets, which represents a considerable
improvement compared the initial stage of data collection.
Figure 3: Left: proportion of tweets in English per user
The data is roughly equally distributed across the three re-
(out of tweets in English and French). Right: proportion of
gional subcorpora.
tweets in English and French per user (out of tweets in all
The structure of the final corpus is presented in Table 5
languages). Results based on language tags produced by
below. Token counts were limited to the metadata-indicated
Twitter prior to the exclusion of non-English content.
6260the use of non-official languages (i.e. languages other than related issue is a higher prevalence of apostrophe dropping
English and French) is comparable across the subcorpora. in Montreal, as in youre (vs. you’re). While more work is
needed to explain these two patterns, other cases, such as
5. Example applications the frequent use of accented letters in words such as café,
5.1. Regional lexical and topical variation appear more directly related to the influence of French.
Following previous studies on social media (Eisenstein, Some chatspeak featues also seem to reproduce patterns
2015; Chandrasekharan et al., 2017; Shoemark et al., 2018), typical of French. The variants of lol ‘laugh out loud’ typ-
we investigated the most distinctive regional lexical variants ical of Montreal emphasize the final consonant (loll, lolll),
in the corpus using the publicly available Python implemen- similalrly to the corresponding French initialism mdr (e.g.
tation4 of the Sparse Additive Generative model (SAGE) mdrr, mdrrr), based on the expression mort de rire, literally
(Eisenstein et al., 2011). SAGE estimates the deviation meaning ‘dead of laughter’. Conversely, the forms salient
in log-frequencies of terms in a corpus of interest rela- for Toronto feature an orthographic lengthening of the vowel
tive to their log-frequencies in a background corpus using (e.g. lool, loool). As for the abbreviation fkn ‘fucking’, its
the maximum-likelihood criterion, with a regularization pa- prevalence in Montreal may be related to the widespread use
rameter ensuring that rare terms are not overemphasized. A of the expletive fuck and derived forms in Quebec French,
high value of the deviation estimate indicates that a term is where they are stripped of the vulgar connotation present
overrepresented in a given corpus, and a low value that it is in English (Meney, 2017). Given the influence of French,
underrerpresented. bilinguals may perceive the term as inoffensive in both lan-
We more closely examined the 100 most distinctive lexical guages and therefore use it more frequently in English, but
items from the Montreal subcorpus and manually catego- this hypothesis should be tested more extensively.
rized them into distinct types of lexical phenomena. Repre- Finally, a number of French items were identified due to
sentative examples for each category are presented in Table their use in messages with both French and English content.
6 and further discussed below. As we have previously argued, codeswitching is overall rare
in this dataset; the prominence of these items is related to
Category Examples the higher relative frequency of codeswitching in the Mon-
Regionalisms metro (57.7), supper (19.5) treal subcorpus. We observe that the attested codeswitching
Local referents montreal (791.3), habs (228.1), patterns vary in structure and thereby reflect real-life usage.
drouin (20.3), poutine (35.5) Consider the following examples:
Spelling café (14.6), center (65.7), youre (43.1) 1. On devrait juste interdire les commentaires. That’s
Chatspeak loll (24.5), lolll (14.9), fkn (54.4) it. Then again, no more FB or Twitter...
French items une (16.7), dans (16.7), merci (32.4) They should just forbid comments. That’s it. Then
again, no more FB or Twitter...
Table 6: Categories of lexical items specific to Montreal,
with frequency per million words indicated in brackets 2. Hi there, guys! We always appreciate the support.
You’re the best! Merci!
As expected, this method identified known regional variants Hi there, guys! We always appreciate the support.
that are related to contact with French. The word metro is You’re the best! Thanks!
associated with the French term métro, used as the official In example (1), the user produced a complete sentence in
name of Montreal’s underground railway system. The pref- French and then switched to English for the remainder of
erence for the term supper may likewise be related to the the tweet; the switch was possibly triggered by the use of
similarity of the corresponding Quebec French term souper the fixed expression that’s it. In example (2), only the term
(Boberg and Hotton, 2015). Importantly, the alternative merci was used in an otherwise English-language tweet.
variants used in other regions (subway and dinner, respec- Since the message was addressed to a user from the United
tively) feature among the most underrepresented items in States, this can be seen as an expression of local identity.
the Montreal subcorpus. Overall, this analysis shows that our corpus captures differ-
Some lexical items are more frequent in Montreal than else- ences in the use of known lexical variants as well as locally-
where because of the local importance of their referents. specific topics, confirming the regional representativeness
This is the case of the French borrowing poutine, which and comparability of the data. Moreover, the variety of ob-
denotes the typical Quebec dish consisting of French fries served codeswitching patterns shows that language contact
topped with gravy and cheese. This category also includes can manifest itself on Twitter in many of the ways it does
local toponyms, as well as the names of sports teams (habs in spoken language. Other, as yet understudied types of
‘Habs’, the nickname of the Montreal Canadiens hockey variation, such as regional spelling and abbreviation prefer-
team) and of their players (drouin ‘Jonathan Drouin’). ences, are specific to online communication and represent
Other identified lexical items point to understudied regional an added value of Twitter in sociolinguistic research.
spelling preferences. For instance, the American spelling
variant center is overrepresented in the Montreal subcor- 5.2. Contact-induced semantic shifts
pus, whereas the British variant centre, typically associated Having established the presence of regional linguistic fea-
with Canadian English, is underrepresented. A potentially tures in the corpus, we explored the detection of contact-
induced semantic shifts using distributional semantic mod-
4
https://github.com/jacobeisenstein/SAGE els. We used word2vec (Mikolov et al., 2013) to train
6261an embeddings model for each regional subcorpus. Default semantic variants, while the availability of user-level data
hyperparamaters were applied (skip-gram architecture with contributes to a more complete understanding of the precise
negative sampling rate of 5, window size of 5, embeddings patterns of variation that are at play.
of size 100, subsampling rate of 10−3 , number of iterations
set to 5) with the minimum word frequency set to 100. 6. Conclusion and future work
This method produces low-dimensional vector spaces, in We have presented a new 78.8-million-tweet corpus aimed
which vector dimensions are not naturally aligned to the at studying regional variation in Canadian English. Tweets
same coordinate axis, meaning that the models are not di- posted by users based in Toronto, Montreal and Vancouver
rectly comparable. We followed work on diachronic em- were collected using a time-efficient pipeline complemented
beddings (Hamilton et al., 2016) and aligned the models by location, language and near-duplicate filtering. The re-
using Orthogonal Procrustes, available in a Python imple- sulting corpus meets the initially defined design criteria: it
mentation.5 This allowed us to directly compute the cosine- mirrors both national and regional specificities of Canadian
distance between each word’s vectors in all pairs of models English, it is sufficiently large for data-intensive model-
so as to detect the most prominent divergences in Montreal. ing methods as well as fine-grained user-level analysis, and
This approach successfully identified a number of words ex- it maintains a reasonably balanced distribution of reliable
hibiting contact-induced meanings. Examples including ex- content across regions and users. Although Twitter’s terms
position ‘exhibition’ and terrace ‘restaurant patio’ reflect the of use preclude us from publishing the entire corpus, the
findings of previous sociolinguistic studies (Boberg, 2012), release of pre-filtered tweet IDs provides a useful starting
while newly identified cases such as definitively ‘definitely’ point for other studies of Canadian English.
present comparable contact-related influence: the uncon- The presented example applications show that the corpus
ventional meanings are all likely related to French cog- facilitates the study of both previously described and novel
nates (exposition, terrasse and définitivement, respectively). regional linguistic variants. The large amount of available
Other regional semantic variants are of more limited inter- data allowed us to use methods such as word embeddings,
est for sociolinguistics, as they are related to proper nouns which otherwise could not have been applied to regional
(plateau denoting the borough of Plateau-Mont-Royal in variation in Canadian English, whereas the focus on in-
Montreal) or cultural factors (chum referring to a species of dividual users brought more clarity to the precise status of
salmon in Vancouver, which lies on the Pacific Ocean). regional linguistic variants. These observations are comple-
The obtained models tend to strongly emphasize a single mented by ongoing work aiming to identify distinct profiles
meaning for each word. In the Montreal model, this creates of users based on the use of contact-related linguistic vari-
the impression that language contact may have completely ants and on associated extra-linguistic factors reflected by
altered the way in which a word is used by an entire speech Twitter metadata. This line of inquiry will allow us to move
community, whereas the identified words are in fact attested beyond Twitter-focused analysis and formulate more pre-
with a variety of meanings. A clear case is illustrated by the cise research hypotheses on the status and representations
following tweets, both posted by users from Montreal: of regional linguistic forms in spoken Canadian English.
While previous studies have suggested that aggregate ge-
3. My fav thing about my new job is the rooftop terrace ographic patterns observed on Twitter correlate with tra-
4. Nothing like drinks on the terrace of your fave pub to ditional dialectological studies (Doyle, 2014), we aim to
end the semester shed more light on the precise relationship between user-
level linguistic choices observed on Twitter and real-life
In example (3), the word terrace is used with the conven- sociolinguistic behaviors. We seek to further investigate
tional meaning referring to a flat roof; in example (4) it is the computationally identified linguistic variants and their
attested with the meaning typical of the French word ter- social correlates through sociolinguistic fieldwork. This
rasse, denoting an outdoor seating area. specifically involves a face-to-face survey based on a well-
A manual analysis suggests that the contact-related mean- established methodological framework (Durand and Prze-
ings of this and other words are overall more frequent in wozny, 2012), focusing on a sample of native Canadian
Montreal, but that they are mostly used by users who tweet English speakers who reflect the linguistic profiles identi-
in both English and French, including those who live in fied in our corpus. Our objective is to explicitly evaluate the
Toronto and Vancouver. This has important implications for reliability of linguistic information and metadata provided
the sociolinguistic status of contact-induced semantic shifts, by anonymous Twitter users in the context of variationist
as they appear to represent a variation in usage limited to sociolinguistic studies. This will in turn help inform future
bilinguals rather than being established regional variants work on the collection and interpretation of linguistic data
typical of Quebec English. on social media.
We intend to refine these results using context-informed
word representations such as BERT (Devlin et al., 2018), 7. Acknowledgments
which should allow us to explicitly account for polysemy and We are grateful to the anonymous reviewers for their com-
more easily quantify aggregate and speaker-specific prefer- ments and suggestions. Experiments presented in this paper
ences. Already at this stage, though, we have shown that our were carried out using the OSIRIM computing platform,
corpus can be used for the automatic detection of regional which is administered by IRIT and supported by CNRS,
the Région Midi-Pyrénées, the French Government, and the
5
https://github.com/williamleif/histwords ERDF (see https://osirim.irit.fr/site/en).
62628. Bibliographical References social media. In Proceedings of the 14th Conference of
Bamman, D., Eisenstein, J., and Schnoebelen, T. (2014). the European Chapter of the Association for Computa-
Gender identity and lexical variation in social media. tional Linguistics, pages 98–106.
Journal of Sociolinguistics, 18(2):135–160, April. Dubossarsky, H., Weinshall, D., and Grossman, E. (2017).
Barbaresi, A. (2016). Collection and indexing of tweets Outta control: Laws of semantic change and inherent bi-
with a geographical focus. In Tenth International Con- ases in word representation models. In Proceedings of the
ference on Language Resources and Evaluation (LREC 2017 Conference on Empirical Methods in Natural Lan-
2016), pages 24–27. guage Processing, pages 1136–1145, Copenhagen, Den-
Baroni, M. and Bernardini, S. (2004). BootCaT: Bootstrap- mark, September. Association for Computational Lin-
ping corpora and terms from the web. In LREC, page guistics.
1313. Durand, J. and Przewozny, A. (2012). La phonologie de
Blodgett, S. L., Green, L., and O’Connor, B. (2016). De- l’anglais contemporain : usages, variétés et structure.
mographic dialectal variation in social media: A case Revue française de linguistique appliquée, 17(1):25–37.
study of African-American English. In Proceedings of Eisenstein, J., Ahmed, A., and Xing, E. P. (2011). Sparse
the 2016 Conference on Empirical Methods in Natural additive generative models of text. In Proceedings of the
Language Processing, pages 1119–1130. International Conference on Machine Learning (ICML),
Boberg, C. and Hotton, J. (2015). English in the Gaspé pages 1041–1048.
region of Quebec. English World-Wide, 36(3):277–314. Eisenstein, J., O’Connor, B., Smith, N. A., and Xing, E. P.
Boberg, C. (2005). The north american regional vocabulary (2014). Diffusion of lexical change in social media. PLoS
survey: New variables and methods in the study of north ONE, 9(11):e113114, November.
american english. American Speech, 80(1):22–60. Eisenstein, J. (2015). Written dialect variation in online
Boberg, C. (2012). English as a minority language in Que- social media. Charles Boberg, John Nerbonne, and Dom
bec. World Englishes, 31(4):493–502. Watt, editors, Handbook of Dialectology. Wiley.
Bušta, J., Herman, O., Jakubíček, M., Krek, S., and Novak, Fišer, D. and Ljubešić, N. (2018). Distributional modelling
B. (2017). JSI Newsfeed corpus. In The 9th International for semantic shift detection. International Journal of Lex-
Corpus Linguistics Conference, Birmingham, UK. icography, 32(2):163–183.
Chandrasekharan, E., Pavalanathan, U., Srinivasan, A., Gimpel, K., Schneider, N., O’Connor, B., Das, D., Mills,
Glynn, A., Eisenstein, J., and Gilbert, E. (2017). You D., Eisenstein, J., Heilman, M., Yogatama, D., Flanigan,
can’t stay here: The efficacy of reddit’s 2015 ban exam- J., and Smith, N. A. (2011). Part-of-speech tagging for
ined through hate speech. Proceedings of the ACM on Twitter: Annotation, features, and experiments. In Pro-
Human-Computer Interaction, 1(CSCW):31. ceedings of the 49th Annual Meeting of the Association
Davies, M. (2011). N-grams data from the Corpus of Con- for Computational Linguistics: Human Language Tech-
temporary American English (COCA). nologies, pages 42–47.
Davies, Mark. (2013a). Corpus of Global Web-Based En- Gonçalves, B. and Sánchez, D. (2014). Crowdsourcing
glish: 1.9 billion words from speakers in 20 countries dialect characterization through Twitter. PLoS ONE,
(GloWbE). 9(11):e112074, November.
Davies, Mark. (2013b). Corpus of News on the Web Gulordava, K. and Baroni, M. (2011). A distributional
(NOW): 3+ billion words from 20 countries, updated similarity approach to the detection of semantic change
every day. in the google books ngram corpus. In Proceedings of
Davies, Mark. (2018). The 14 Billion Word iWeb Corpus. the GEMS 2011 Workshop on GEometrical Models of
Del Tredici, M. and Fernández, R. (2017). Semantic varia- Natural Language Semantics, GEMS ’11, pages 67–71,
tion in online communities of practice. In IWCS 2017 - Stroudsburg, PA, USA. Association for Computational
12th International Conference on Computational Seman- Linguistics.
tics - Long papers. Hamilton, W. L., Leskovec, J., and Jurafsky, D. (2016).
Del Tredici, M., Fernández, R., and Boleda, G. (2019). Diachronic word embeddings reveal statistical laws of
Short-term meaning shift: A distributional exploration. semantic change. In Proceedings of the 54th Annual
In Proceedings of the 2019 Conference of the North Meeting of the Association for Computational Linguis-
American Chapter of the Association for Computational tics (Volume 1: Long Papers), pages 1489–1501, Berlin,
Linguistics: Human Language Technologies, Volume 1 Germany, August. Association for Computational Lin-
(Long and Short Papers), June. guistics.
Devlin, J., Chang, M.-W., Lee, K., and Toutanova, K. Huang, Y., Guo, D., Kasakoff, A., and Grieve, J. (2016).
(2018). Bert: Pre-training of deep bidirectional trans- Understanding U.S. regional linguistic variation with
formers for language understanding. arXiv preprint Twitter data analysis. Computers, Environment and Ur-
arXiv:1810.04805. ban Systems, 59:244–255, September.
Donoso, G. and Sánchez, D. (2017). Dialectometric anal- Jones, T. (2015). Toward a description of African American
ysis of language variation in Twitter. In Proceedings of Vernacular English dialect regions using “Black Twitter”.
the Fourth Workshop on NLP for Similar Languages, Va- American Speech, 90:403–440.
rieties and Dialects (VarDial4). Jørgensen, A., Hovy, D., and Søgaard, A. (2015). Chal-
Doyle, G. (2014). Mapping dialectal variation by querying lenges of studying and processing dialects in social media.
6263In Proceedings of the Workshop on Noisy User-generated Istanbul, Turkey. European Language Resources Associ-
Text, pages 9–18. ation (ELRA).
Kim, Y., Chiu, Y.-I., Hanaki, K., Hegde, D., and Petrov, Schäfer, R. (2015). Processing and querying large web
S. (2014). Temporal analysis of language through neural corpora with the COW14 architecture. In Proceedings
language models. In Proceedings of the ACL 2014 Work- of Challenges in the Management of Large Corpora 3
shop on Language Technologies and Computational So- (CMLC-3), Lancaster. UCREL, IDS.
cial Science, pages 61–65, Baltimore, MD, USA, June. Shoemark, P., Sur, D., Shrimpton, L., Murray, I., and Gold-
Association for Computational Linguistics. water, S. (2017). Aye or naw, whit dae ye hink? Scot-
Labov, W. (1972). Sociolinguistic patterns. University of tish independence and linguistic identity on social media.
Pennsylvania Press. In Proceedings of the 15th Conference of the European
Ljubešić, N., Fišer, D., and Erjavec, T. (2014). TweetCaT: Chapter of the Association for Computational Linguis-
a tool for building Twitter corpora of smaller languages. tics, pages 1239–1248.
In Proceedings of LREC. Shoemark, P., Kirby, J., and Goldwater, S. (2018). Inducing
Lui, M. and Baldwin, T. (2012). langid. py: An off-the- a lexicon of sociolinguistic variables from code-mixed
shelf language identification tool. In Proceedings of the text. In Proceedings of the 2018 EMNLP Workshop W-
ACL 2012 system demonstrations, pages 25–30. Associ- NUT: The 4th Workshop on Noisy User-generated Text,
ation for Computational Linguistics. pages 1–6, Brussels, Belgium, November. Association
Lui, M. and Baldwin, T. (2014). Accurate language iden- for Computational Linguistics.
tification of Twitter messages. In Proceedings of the 5th Statistics Canada. (2017). First official language spoken,
workshop on language analysis for social media (LASM), language spoken most often at home, age and sex for the
pages 17–25. population excluding institutional residents of Canada,
McCandless, M. (2014). Chromium Compact Lan- provinces and territories, census metropolitan areas and
guage Detector. https://code.google.com/p/ census agglomerations (table). 2016 Census.
chromium-compact-language-detector. Strathy Language Unit. (2011). Strathy Corpus of Canadian
English.
Meney, L. (2017). Le français québécois entre réalité et
idéologie: un autre regard sur la langue: étude sociolin- Tagliamonte, S. A. (2006). Analysing sociolinguistic vari-
guistique. Presses de l’Université Laval. ation. Cambridge University Press.
Yardi, S., Romero, D. M., Schoenebeck, G., and boyd, d.
Mikolov, T., Chen, K., Corrado, G., and Dean, J. (2013).
(2010). Detecting spam in a Twitter network. First Mon-
Efficient estimation of word representations in vector
day, 15(1).
space. In Proceedings of Workshop at ICLR.
Nakatani, S. (2010). Language detection library (slides).
https://www.slideshare.net/shuyo/
language-detection-library-for-java.
Owoputi, O., O’Connor, B., Dyer, C., Gimpel, K., Schnei-
der, N., and Smith, N. A. (2013). Improved part-of-
speech tagging for online conversational text with word
clusters. In Proceedings of the 2013 Conference of the
North American chapter of the Association for Computa-
tional Linguistics: Human Language Technologies, pages
380–390.
Pavalanathan, U. and Eisenstein, J. (2015). Confounds and
Consequences in Geotagged Twitter Data. In Proceed-
ings of the 2015 Conference on Empirical Methods in
Natural Language Processing, pages 2138–2148, Lisbon,
Portugal. Association for Computational Linguistics.
Poplack, S., Walker, J. A., and Malcolmson, R. (2006). An
English ‘like no other’?: Language contact and change in
Quebec. Canadian Journal of Linguistics, 51(2-3):185–
213.
Rouaud, J. (2019). Lexical and phonological integration
of French loanwords into varieties of Canadian English
since the seventeenth century. Ph.D. thesis, Université
Toulouse - Jean Jaurès.
Scheffler, T. (2014). A German Twitter snapshot. In Pro-
ceedings of LREC, pages 2284–2289.
Schäfer, R. and Bildhauer, F. (2012). Building large corpora
from the web using a new efficient tool chain. In Proceed-
ings of the Eight International Conference on Language
Resources and Evaluation (LREC’12), pages 486–493,
6264You can also read