Shared Mobility Services 3.6 - TCC-GSR
←
→
Page content transcription
If your browser does not render page correctly, please read the page content below
Tr a n s p o r t a n d C l i m a t e C h a n g e G l o b a l S t a t u s R e p o r t - 2 n d e d i t i o n

3.6
Shared Mobility
Services

Key findings

   Demand trends                                                                                                 Emission trends
  Car-sharing membership doubled between 2016                                                                   According to some studies, electric scooter and bike-
  and 2018, surpassing 30 million globally, with 70% of                                                         sharing services have reduced emissions by shifting
  members registered with services in Asia.                                                                     trips from polluting transport modes; in contrast, ride-
  Use of ride-hailing services has spiked since 2016,                                                           hailing services increase vehicle-kilometres travelled
  increasing passenger vehicle travel an estimated 10-20%                                                       and result in more emissions.
  in urban areas and 45-60% in suburban areas globally.                                                         Many ride-hailing operators have accelerated the roll-
  The peak popularity of bike-sharing systems was                                                               out of electric vehicles to achieve zero-emission fleets,
  reached in 2017, and by late 2020 a quarter of                                                                and some sub-national governments have adopted
  originally launched bike-sharing systems were no                                                              electric vehicle regulations and targets. Replacing
  longer in operation. Africa is highly underrepresented                                                        conventional ride-hailing vehicles with electric vehicles
  in the bike-sharing market with just six services                                                             has the potential to deliver three times the emission
  launched since 2016.                                                                                          reductions compared to conventional vehicles.

  System installations of shared e-scooter services, which
  were widely launched in 2018, increased 580% in 2019,                                                          Policy measures
  including expansion in several countries in Europe and                                                        Regulation of new services and business models has
  Latin America and the Caribbean.                                                                              been a key determinant of the pace of deployment of
  The initially strong venture capital backing enjoyed by                                                       shared mobility services, with a number of cities and
  global micromobility companies declined 64% from                                                              countries enacting stricter controls.
  2018 to 2019, leading services to cut staff or cease                                                          New partnerships, tools and guidelines have emerged
  operations entirely.                                                                                          to increase co-ordination among public and private
  Autonomous vehicles, widely used in shared                                                                    actors in planning and operating shared mobility
  applications, have not seen increased market                                                                  services.
  momentum, with 80% fewer cities introducing vehicle                                                           Africa has been prominent in a surge of tech-based
  trials during 2019 than in 2017.                                                                              improvements in analysis, information and operating
                                                                                                                platforms for formal and informal shared mobility services.
R e s p o n s e s t o A d d r e s s C l i m a t e C h a n g e i n t h e Tr a n s p o r t S e c t o r
Tr a n s p o r t a n d C l i m a t e C h a n g e G l o b a l S t a t u s R e p o r t - 2 nd e d i t i o n
infrastructure), access to public transport and the general built
environment. Enhanced data and information on these services, and
Impacts of the COVID-19 pandemic a greater array of services for different purposes, have the potential
Several ride-hailing services lost ridership during to improve the economic conditions of lower-income populations.
pandemic lockdowns, leading to job losses in the
sector, with ride-hailing company Ola cutting 35% The development and positioning of shared mobility services has
of its workforce in India, and Uber cutting 23% of its been mostly led by the private sector. However, in recent years there
global workforce. has been an increase in alliances and partnerships led by both the
Demand for bike-sharing services increased private sector and non-governmental organisations, indicating a
sharply in a number of cities in 2020, while in shared agenda towards increasing the presence of shared mobility
other cities, demand for bike sharing struggled to services and improving their environmental performance. Yet in
reach 2019 levels due to lockdowns and service many cases, shared mobility services are still struggling to find a
restrictions.
well-established regulatory framework in which to operate.
In response to the COVID-19 pandemic, many ride-hailing
companies shifted their activities from moving people to moving
goods (especially food delivery) in Asia and North America. The
Overview pandemic has had an asymmetric impact across shared mobility
services, with bikes and e-scooters generally faring better than ride-
“Shared mobility” is the deployment of innovative transport services
hailing services (see Box 1).3 Recent reductions in funding (often
using emerging technologies and original business models , based
linked to drops in revenue spurred by the pandemic) have put
on shareability and the provision of on-demand service. Shared
into question the financial sustainability of current shared mobility
mobility services include car sharing, ride-hailing, micromobility
services business models.
(bike sharing, shared electric kick scooters) and on-demand micro-
transit. Shared autonomous vehicle applications are also a rapidly
emerging area, as many autonomous vehicles are likely to be initially
Demand trends
deployed in the context of shared mobility services.1
When shared mobility services are well deployed, managed and Car-sharing membership doubled between 2016 and 2018,
regulated, they have the potential to reduce the demand for private surpassing 30 million globally, with 70% of members registered
cars, thus reducing associated emissions.2 However, the impacts with services in Asia (see Figure 1).4 The total number of car-sharing
of shared mobility can vary depending on the kind of service, vehicles increased from 157,000 to 198,000 during this period, and
the specific operating context (including walking and cycling by 2019, 236 car-sharing services were operating in 59 countries.5
Figure 1. Global car-sharing membership by region and total number of vehicles, 2006-2018
35 200
Global Carsharing Vehicles in Thousands
Members in
180 Africa,
Global Carsharing Members in Millions
30 Latin America
and Oceania
160
25 140
120 Members in
20
North America
100
15
80
Members in
10 60 Europe
40
5 Members in
20 Asia
0 0
2006 2008 2010 2012 2014 2016 2018
Source: See endnote 4 for this section.
2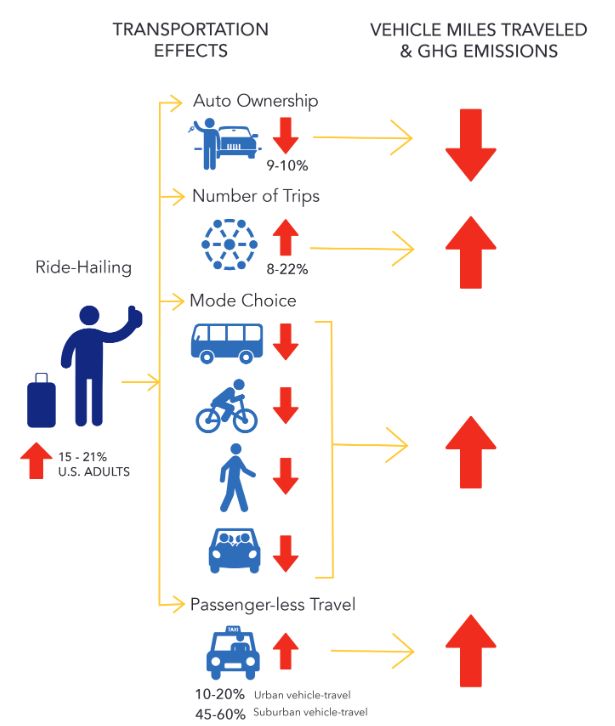
R e s p o n s e s t o A d d r e s s C l i m a t e C h a n g e i n t h e Tr a n s p o r t S e c t o r
                                                                                                                        Shared Mobility Services

    China, India and the Republic of Korea lead in car sharing,                Of the 39 million trips using shared bicycle systems in the USA
    accounting for more than three-quarters of the Asian market                in 2019, 35% were undertaken to connect to public transport.23
    since 2015.    6
                       Overcrowded public transport facilities and             Uber purchased Jump Bikes in 2018 and then sold it to Lime in
    population growth are the main variables explaining the switch             April 2020, greatly reducing the service’s staff and operations.24
    to shared cars.7 Worsening air pollution has also driven Asian             Lime ceased operations in 12 major cities in Latin America and
    governments to adopt measures aimed at reducing the overall                the Caribbean by the end of 2019.25
    number of vehicles on the road.   8
                                                                           System installations of shared e-scooter services, which were
    Major car-sharing players in the Asia-Pacific region include
                                                                           widely launched in 2018, increased 580% in 2019, including
    Car2Go, CarShare Australia, Hertz Corporation, Locomute and
                                                                           expansion in several countries in Europe and Latin America
    Zipcar. These companies often propose innovations to expand
                                                                           and the Caribbean.26 In total, around 265 cities worldwide had
    their regional presence.9
                                                                           e-scooter services as of 2020, most of them in the USA and Europe
Use of ride-hailing services has spiked since 2016, increasing             (see Figure 4).27
passenger vehicle travel an estimated 10-20% in urban areas and
                                                                           In the past few years, e-scooter services have overtaken bike sharing
45-60% in suburban areas globally.10 A study in Denver, United
                                                                           with large-scale deployment across many major cities. By the
States (USA) found that ride-hailing leads to around 83.5% more
                                                                           beginning of 2020, the e-scooter phenomenon was accompanied
vehicle-kilometres travelled than if ride-hailing did not exist.11
                                                                           by the reduced presence of dockless bicycle services, leading to
    In Bangladesh, 10 companies were awarded ride-hailing                  a reduction in micromobility services overall. Some companies
    service licences in July 2019; that year, the country’s USD 26         argue that the limitations on the number of devices a company
    billion ride-hailing industry represented 23% of the transport         can introduce force them to follow popular trends and to prioritise
    sector, recording more than 7.5 million trips per month.12             e-scooters over shared bicycles.28
    Ride-hailing led to a dramatic increase in motorbikes and cars
                                                                               In Europe, nearly 100 cities across 27 countries had an
    in Dhaka, Bangladesh, with 40 new cars being registered
                                                                               e-scooter sharing scheme as of 2020, and in Latin America and
    every day.13
                                                                               the Caribbean 32 cities across 7 countries had such a scheme.29
    Based on a survey in Santiago, Chile, ride-hailing services
                                                                               In the USA, the number of trips using micromobility (shared
    increase the number of vehicles kilometres travelled, but
                                                                               bikes, e-bikes and e-scooters) increased from 84 million in 2018
    this effect can be lessened if occupancy rises to at least 2.9
                                                                               to 132 million in 2019.30 Between 2010 and 2019, a third of the
    passengers per vehicle.14
                                                                               total 1 billion trips made in the USA were done on e-scooters
    A study on the impacts of ride-hailing services in Bogotá,
                                                                               and shared bikes.31
    Colombia found that 33% of public transport trips could
                                                                               The most popular use of e-scooters in the USA in 2018 was to
    potentially shift to ride-hailing, increasing the vehicle-kilometres
                                                                               commute to work (28%).32
    travelled by 14.5 times.15
    In early 2020, Nigeria banned the commercial use of                    The initially strong venture capital backing enjoyed by global
    motorcycles and tricycles operated by ride-hailing companies           micromobility companies declined 64% from 2018 to 2019,
    in Lagos, claiming the need for urgent measures to improve             leading services to cut staff or cease operations entirely.33 Investors
    security and safety on the road. These so-called okadas provide        appear to have reached an inflection point in the micromobility
    access to zones where public transport is not fully deployed.16        market segment, pivoting from subsidised companies aiming to
                                                                           gain users towards profitable and revenue-oriented businesses.34
The peak popularity of bike-sharing systems was reached in
2017, and by late 2020 a quarter of originally launched bike-                  More than 40 micromobility companies were founded in 2018,
sharing systems were no longer in operation.17 Africa is highly                but in 2019 and 2020 this fell to only 17 and 8 companies
underrepresented in the bike-sharing market with just six services             respectively starting operations.35
launched since 2016 (see Figure 2).18 Since 2017, the major                    In 2019 and 2020, four e-scooter sharing companies
expansions in the bike-sharing market were in free-floating systems.           representing more than USD 190 million in combined venture
The use of e-bikes in shared systems has also grown strongly since             funding were acquired, three companies closed, and two
2017 (see Figure 3), and a study found that 35% of shared electric             others merged.36
bike trips substituted car travel, while 30% substituted walking.19 As         In early 2020, Lime announced that it would lay off 14% of its
of August 2020, some 2,015 bike-sharing systems were in operation              staff (100 people) and cease operations in dozens of USA cities,
around the world.20                                                            including Atlanta, San Diego, San Antonio and Phoenix. By
                                                                               that time, Scoot, Lyft and Skip had already announced similar
    An electric bike sharing system was launched in Kigali, Rwanda
                                                                               measures.37
    in 2019.21
                                                                               Bird shed 30% of its employees in late March 2020, after having
    Dubai, United Arab Emirates aims to roll out 3,500 public shared
                                                                               brought USD 75 million in venture capital a few months before.38
    bicycles with 350 stations between 2020 and 2025.22

                                                                                                                                                     3
R e s p o n s e s t o A d d r e s s C l i m a t e C h a n g e i n t h e Tr a n s p o r t S e c t o r
Tr a n s p o r t a n d C l i m a t e C h a n g e G l o b a l S t a t u s R e p o r t - 2 nd e d i t i o n
Figure 2. Total number and annual additions of bike-sharing systems, by region, 2007-2019
Total
Dockless bikesharing systems
550 2500
Dockless Systems
Total number of bikesharing systems (lines)
500 Oceania
Bikesharing Services per Year (bars)
450 Standard Systems Standard 2000
400 North America
350
1500
300 Latin America
and the Caribbean
250
1000
200 Europe
150
500
100
Asia
50
0 0
Africa
2007 2008 2009 2010 2011 2012 2013 2014 2015 2016 2017 2018 2019
Source: See endnote 18 for this section.
Figure 3. Number and purpose of bike sharing, shared e-bike and shared e-scooter trips in the USA, 2010-2019
2018 survey:
E-scooter use:
Work commute
28%
160 To/from public transport
25%
140 Social
E-scooter 21%
120 sharing Recreation
Million of trips in the US
26%
100 Electric
bikesharing
80
Traditional
Bikesharing use:
60 bikesharing Work commute
27%
40 To/from public transport
35%
20 Social
28%
0 Recreation
2010 2011 2012 2013 2014 2015 2016 2017 2018 2019 10%
Source: See endnote 19 for this section.
4R e s p o n s e s t o A d d r e s s C l i m a t e C h a n g e i n t h e Tr a n s p o r t S e c t o r
Shared Mobility Services
Figure 4. Urban scooter services by region, early 2020
Europe
37%
Latin America and
the Caribbean
12%
Asia
8%
Oceania
3%
Other North
America
United States of 1%
America
39%
Source: See endnote 27 for this section.
Autonomous vehicles, widely used in shared applications, have Figure 5. New autonomous vehicle trials in cities, by region,
2017-2019
not seen increased market momentum, with 80% fewer cities
introducing vehicle trials during 2019 than in 2017 (see Figure 5).39
Towards the end of 2018, the deployment of autonomous vehicles in 90
Cities introducing autonomous vehicle trials
many cities around the world was seen as a rising trend.40 However,
80
technical problems with the vehicles and mistrust from users,
coupled with road safety concerns and a slow-moving regulatory 70
environment, have slowed this growth. Prospects surrounding the
41
60
future of automated freight (both long-haul travel in trucks and short
last-mile delivery by small robots) have been delayed for similar 50
reasons. 40
In countries where autonomous vehicles have been tested 30
(China, Germany and several USA states), significant
20
deployments occurred in cities between 2018 and 2020, and
regulatory oversight was strengthened.42 10
Frankfurt, Germany started operating a public autonomous
0
shuttle on a 700-metre closed street in 2019.43
In Singapore, a full-sized autonomous bus began testing on the 2017 2018 2019
campus of Nanyang Technological University in March 2019.44
In the freight sector, a self-driving truck completed the first
Africa Asia Europe LAC North America Oceania
successful cross-country trip in the USA in December 2019.45
Automaker GM announced in January 2020 its allocation of USD
2.2 billion for electric and autonomous vehicle production.46
Source: See endnote 39 for this section.
5R e s p o n s e s t o A d d r e s s C l i m a t e C h a n g e i n t h e Tr a n s p o r t S e c t o r
Tr a n s p o r t a n d C l i m a t e C h a n g e G l o b a l S t a t u s R e p o r t - 2 nd e d i t i o n
Emission trends
While there is potential for shared mobility services to reduce One study found that ride-hailing leads to around 83.5% more
emissions from the transport sector, there is no clear consensus on vehicle-kilometres travelled than if ride-hailing had not existed.53
the environmental impact of these services. Improved monitoring, Another study found that ride-hailing accounts for a 10-20%
measuring and evaluation can ensure that research results are valid increase in vehicle travel in urban areas and a 45-60% increase
and can make the case for increased investment in shared mobility in vehicle travel in suburban areas (see Figure 6).54
across new geographies and market segments. In a study of cities with large concentrations of ride-hailing
services, carpooling trips led to at least a doubling of vehicle-
According to some studies, electric scooter and bike-sharing services
kilometres travelled when compared to the transport modes
have reduced emissions by shifting trips from polluting transport
they replaced.55
modes; in contrast, ride-hailing services increase vehicle-kilometres
Research indicates a slight increase in emissions when
travelled and result in more emissions. Shared mobility appears to
implementing car sharing because it provides access to
offer a solution for providing first- and last-mile connectivity to and from
automobiles to those who did not own them.56
public transport, increasing its access and use.
Many ride-hailing operators have accelerated the roll-out of
However, validating data on shared mobility and its impacts is
electric vehicles to achieve zero-emission fleets, and some
challenging: most services are fairly new, and data series are limited.
sub-national governments have adopted electric vehicle
Private sector studies tend to focus on specific providers’ data and
regulations and targets. Replacing conventional ride-hailing
show potential bias; academic studies often lack comprehensive
vehicles with electric vehicles has the potential to deliver three
datasets; and life-cycle analyses often make assumptions that are not
times the emission reductions compared to conventional
reliable. Government-led studies appear to have greater validity but
vehicles.57 Due to impacts caused by the increasing use of ride-
generally rely on less data and are based mostly on surveys. Further
hailing systems, both public and private sector actors have taken
research by independent centres and academic institutions is needed.
recent action to electrify shared fleets.
Positive reported impacts on
emission reductions Figure 6. The effects of increased ride-hailing on transport
trends, vehicle-kilometres travelled and greenhouse
E-scooters emit 75% fewer CO2 emissions than passenger gas emissions in a USA study
cars (based on life-cycle analysis that includes production),
according to Bird.47
Lime estimates that its e-scooter services in Paris, France
replaced 1.2 million vehicle trips and avoided more than 330
tonnes of CO2 between 2018 and 2019, while representing
between 0.8 to 1.9% of all trips.48 Lime estimates that this is the
equivalent of taking 1,320 cars off the road.49
A shift to lightweight electric vehicles (scooters and electric
bicycles) results in mitigation levels of up to 68% by 2030,
according to a case study of Paris, France.50
An official report on an e-scooter pilot in Portland, Oregon, US
found that the scooters replaced around 301,856 vehicle-miles
and prevented around 122 tonnes of CO2 emissions, equivalent
to removing nearly 27 average passenger vehicles from the
road for a year.51
Negative reported impacts on
emission reductions
A 2019 life-cycle analysis of e-scooter use by North Carolina
State University reported much higher emissions than other
modes of transport such as high-ridership buses or electric
bicycles. The main sources of pollution are the vehicles
used to redistribute the scooters and the materials used to
Source: See endnote 54 for this section.
manufacture them.52
6R e s p o n s e s t o A d d r e s s C l i m a t e C h a n g e i n t h e Tr a n s p o r t S e c t o r
Shared Mobility Services
speed of 20 kilometres per hour.67 Several other Latin American
Public sector actions
and Caribbean countries (Chile, Colombia, Mexico and Peru)
California, USA passed a regulation targeting 100% electrification
implemented similar regulations in 2019.68
of ride-hailing fleets by 2030.58
Singapore prohibited the use of e-scooters on all footpaths
In London, UK, new licenced private-hire vehicles must be zero
from November 2019. Since the policy discouraging the
emission beginning in 2021.59
use of personal mobility devices on roads is still in place,
Shenzhen, China set a goal for 100% of its ride-hailing fleet to
e-scooters can be used only on cycling paths and park
be electric by 2020. 60
connector networks.69
In 2019, Los Angeles, USA began requiring operators of shared
Private sector actions two-wheelers to submit real-time location data, using a shared
Lime has committed to 100% zero-emission operations for its fleet mobility data specification programme that enables the city to
vehicles (e.g., the trucks transporting the e-scooters) by 2030.61 track the location of each unit.70
The ride-hailing service Lyft has committed to electrifying its E-scooters were regulated in 46 of 50 USA states as of the end
entire fleet by 2030.62 of 2020, and were illegal to use on sidewalks in 11 USA states.71
In Singapore, the ride-hailing service Grab added 200 electric
cars to its fleet in 2019.63 New partnerships, tools and guidelines have emerged to increase
Uber aims for 50% of its rides in seven European capitals to co-ordination among public and private actors in planning and
be in zero-emission vehicles by 2025, and globally it aims for operating shared mobility services. A substantial redefinition
all rides to be in zero-emission vehicles, public transport and of several aspects of shared mobility services (for example,
micromobility by 2040.64 partnerships, data collection, regulations) has demonstrated the
need to expand these services to a larger share of the population
in order to achieve significant and measurable positive impacts on
Policy measures emission reductions.
During 2019 and 2020, funders showed greater caution towards The New Mobility Alliance (NUMO), launched in 2019,
shared mobility services. Overall, the integration of shared, electric brings together cities, non-governmental organisations,
and autonomous transport services has fallen short of its potential, companies, mobility service operators and community
given the challenges related to achieving a proper balance between advocates from diverse sectors to operationalise the Shared
the public and private sectors, developing adequate regulations Mobility Principles for Livable Cities to increase urban equity
and identifying appropriate market deployment. However, some and accessibility.72
regions have developed shared mobility services policies, stringent The World Economic Forum’s Global Future Council on
regulations and mobility standards. Mobility has created a set of guidelines to help strengthen
partnerships among cities and mobility companies through
Regulation of new services and business models has been a
greater collaboration on sharing trip data, managing public
key determinant of the pace of deployment of shared mobility
space and addressing community needs.73
services, with a number of cities and countries enacting stricter
controls. Because shared mobility services are generally market- Africa has been prominent in a surge of tech-based improvements
led, regulations have typically been protective. Differences in analysis, information and operating platforms for formal and
between the public and private sector, the need for clearer informal shared mobility services that provide access to transport
goals for these services, and the difficulty in creating adequate for those with internet connectivity. Regional models and tools
regulations (or the lag between market-led deployment and are being developed to facilitate better organisation of paratransit
reactive regulations in different levels of government) have made (sometimes called “informal transport”) services in Africa. These
it more difficult to move towards a well-co-ordinated environment tools hold promise for increasing information about services
for shared mobility services. This has reduced the initial interest deployed and for improved user connectivity to existing transport
of many companies to deploy such services, and of governments networks (e.g., providing solutions for first- and last-mile trips to
to implement decisive policies. access public transport).
In Estonia, an amendment to the Traffic Act passed at the end Between 2010 and 2019, 180 mobility-related start-ups
of 2020 put e-scooters in a new category of “light mobility were launched across Africa. Shared mobility accounted
vehicles” and created a set of comprehensive regulations for for 57% of these companies, including ride-hailing and ride-
scooter use.65 sharing services and app-based motorcycle services, such
Between 2019 and 2020, European countries including as SafeBoda.74 Other initiatives address product innovation,
Germany, Italy and North Macedonia enacted sidewalk bans, commuter experience and data-driven decision making.
age restrictions and speed limits for e-scooter use.66 Additional apps include GoMetro and WhereIsMyTransport
In March 2019, São Paulo, Brazil enacted a law limiting the use (travel maps and planning), Little (to request services such as
of e-scooters to only roads and bicycle lanes with a maximum matatus and boda bodas) and Epesi (trip planning).75
7R e s p o n s e s t o A d d r e s s C l i m a t e C h a n g e i n t h e Tr a n s p o r t S e c t o r
Tr a n s p o r t a n d C l i m a t e C h a n g e G l o b a l S t a t u s R e p o r t - 2 nd e d i t i o n
SWVL, a start-up founded in Egypt, merges tech with Africa’s Efforts have been undertaken in Nairobi, Kenya; Gaborone,
established traditional mobility offering. It provides better Botswana; and Accra, Ghana to leverage GPS-enabled
demand forecasting, market accessibility and certainty to smartphones, open crowdsourced databases and other
ride-hailing suppliers, while giving users planned rides, app- technologies to enhance paratransit operation.77
supported transactions and seat bookings in minibus taxis.76
Initiatives supporting shared mobility services
The Shared Mobility Principles for Livable Cities, launched societal and environmental impacts.82 The group publishes
in 2017, include 10 principles to support the development of research on the environmental and social impacts of innovative
sustainable, inclusive, prosperous and resilient cities and are and emerging mobility technologies, such as shared mobility.
endorsed by countries, international organisations and mobility The Shared-Use Mobility Center is a public interest partnership
service providers. This initiative constituted the starting point
78
working to foster collaboration around shared mobility and
for the New Urban Mobility Alliance. helping to connect the growing industry with public transport
The New Urban Mobility Alliance (NUMO) is a global alliance agencies, cities and communities across the USA.83
that “channels tech-based disruptions in urban transport to The Mobility as a Service (MaaS) Alliance is a partnership aiming
create joyful cities where sustainable and just mobility is the to establish the common principles for mobility as a service by
new normal”.79 As of late 2020, NUMO had more than 280 facilitating a single, open market and full deployment of these
allies (cities, non-governmental organisations, companies, services. It brings together the public and private sectors as well
mobility service operators, and community advocates from as associations willing to centre mobility on users’ needs.84
diverse sectors) to leverage the significant mobility revolutions The Mobility on Demand Alliance, launched by the Intelligent
to address urban challenges such as equity, sustainability, Transportation Society of America, aims to shape the future
accessibility and labour, among others.80 of mobility by promoting the benefits of mobility-on-demand
The Global New Mobility Coalition, curated by the World services and sharing ideas and opportunities around it.85
Economic Forum, is a diverse community of more 150 global The New Mobility Services Initiative, part of the Sustainable
experts, non-governmental organisations and companies. It Urban Mobility Action Cluster, intends to integrate and manage
aims to accelerate the shift to a Shared, Electric and Autonomous urban transport, develop collective systems for multi-modal
Mobility (SEAM) system that provides for healthier cities, mobility, and create an open and collaborative marketplace for
reduces carbon emissions 95%, improves mobility efficiency new mobility services in Europe.86
70%, and decreases commuting costs 40%, while tapping into
a USD 600 billion business.81
The Innovative Mobility Research Group at the Transportation
Sustainability Research Center at the University of California,
Berkeley explores innovative mobility technologies and services
that could improve transport options while reducing their negative
8R e s p o n s e s t o A d d r e s s C l i m a t e C h a n g e i n t h e Tr a n s p o r t S e c t o r
Shared Mobility Services
Key indicators
2017* 2019* % change
Policy Landscape Indicators
Countries with shared mobility regulations (# of countries) N/A 17 –
Market Development Indicators
Car-sharing services (# of services in cities) N/A 4,139 –
Bike-sharing systems (# of systems) 1,766 2,015 +14%
Car-sharing vehicles (# of vehicles) 157,357 (2016) 198,418 (2018) +26%
Autonomous vehicle systems in trial (# of countries) 26 44 +69%
(*) Data are for the indicated year unless noted otherwise.
Source: See endnote 87 for this section.
9R e s p o n s e s t o A d d r e s s C l i m a t e C h a n g e i n t h e Tr a n s p o r t S e c t o r
Tr a n s p o r t a n d C l i m a t e C h a n g e G l o b a l S t a t u s R e p o r t - 2 nd e d i t i o n
Box 1. Impacts of the COVID-19 pandemic on shared mobility services
Several ride-hailing services lost ridership during of July 2020, some 137 operations had been relaunched
pandemic lockdowns, leading to job losses in the after being previously suspended, 285 operations remained
sector, with ride-hailing company Ola cutting 35% of its suspended, and 56 operations ceased to exist. In March
workforce in India, and Uber cutting 23% of its global 2021, New York City, USA lifted its ban on e-bikes and
workforce. During the pandemic, the transport sector e-scooters in order to support food delivery.
has faced the challenge of balancing user safety with the
In a 2021 survey on transport mode choices in the USA, the
financial stability of services. The need for social distancing
UK, France, Germany, Italy, Spain, Singapore and China ,
and the imposition of lockdowns in 2020 led to a surge in
respondents said they aimed to maintain or increase their
deliveries, which was made more dynamic through the use
use of micromobility and ride-hailing services compared to
of mobile apps to improve the seamlessness between the
pre-COVID-19 levels.
customer and the delivery service. For Grab, the demand
for its food delivery services overtook demand for its ride- Lessons learned from the COVID-19 pandemic can be
hailing services. applied in order to preserve the improvements of app-based
shared mobility services. Ongoing deployment of tactical
Demand for bike-sharing services increased sharply in
urbanism measures ((local, short-term, low-cost activities
a number of cities in 2020, while in other cities, demand
that are city- and citizen-led) can also increase flexibility in
for bike sharing struggled to reach 2019 levels due to
shared mobility implementation, which can help to increase
lockdowns and service restrictions (see Figure 1). CitiBike
mobility options and enhance economic resilience.
in New York City, USA saw a 67% year-on-year increase in
usage before the spring 2020 lockdowns went into effect, Source: See endnote 3 for this section.
and, afterwards, usage quickly increased to levels similar to
2019. However, many shared mobility systems suffered. As
Figure 7. Changes in bike-sharing use during the COVID-19 pandemic, in selected cities
London Mexico City New York City
1400000 900000 3000000
800000
1200000
2500000
Bikesharing rides
Bikesharing rides
Bikesharing rides
700000
1000000
600000 2000000
800000 500000
1500000
600000 400000
300000 1000000
400000
200000
500000
200000
100000
0 0 0
Jan Feb March April May June July Aug Sept Oct Nov Dec Jan Feb March April May June July Aug Sept Oct Nov Dec Jan Feb March April May June July Aug Sept Oct Nov Dec
2018 2019 2020 2018 2019 2020 2018 2019 2020
Paris Seoul Taipei
6000000 3500000 4000000
3000000 3500000
5000000
Bikesharing rides
Bikesharing rides
Bikesharing rides
3000000
2500000
4000000
2500000
2000000
3000000 2000000
1500000
1500000
2000000
1000000
1000000
1000000
500000 500000
0 0 0
Jan Feb March April May June July Aug Sept Oct Nov Dec Jan Feb March April May June July Aug Sept Oct Nov Dec Jan Feb March April May June July Aug Sept Oct Nov Dec
2018 2019 2020 2018 2019 2020
2018 2019 2020
10Methodological Note
Tr a n s p o r t a n d C l i m a t e C h a n g e G l o b a l S t a t u s R e p o r t - 2 nd e d i t i o n
Annex: Methodological Note
Data usage
Time period for data: Secondary data:
The report strives to utilise the most recent SLOCAT relies on secondary data and
publicly available data and information information collected and provided
just prior to the time of publication (as of by SLOCAT partners and other entities
31 May 2021). The figures in the report and does not make use of any internal
were developed between September and modelling tools.
December 2020 using the most recent
data available.
Data on sustainable mobility: A call to action EDGAR provides estimates for fossil CO2 emissions from all
The report benefits directly from data collected by a wide range anthropogenic activities with the exception of land use, land-use
of stakeholders working in different areas of transport. change, forestry and the large-scale burning of biomass. The
main activities covered are CO2 emissions emitted by the power
Data are important for providing a comprehensive picture of the
sector (i.e., power and heat genertion plants), by other industrial
status of sustainable, low carbon transport and are essential for
combustion (i.e., combustion for industrial manufacturing and fuel
both policy and investment decision making. In these times of
production) and by buildings and other activities such as industrial
change, it is critical to upgrade data and policy collection and
process emissions, agricultural soils and waste. Transport activities
interpretation capacities to better understand progress and the
covered within EDGAR include road transport, non-road transport,
hurdles that must be addressed.
domestic aviation, and inland waterways on a country level, as well
The data limitations mentioned below are not new. Obtaining as international aviation and shipping.1
regular, reliable and public data across regions and transport
For the world, regions and countries, the CO2 emission data
modes remains an outstanding issue. When an increasing
(provided by EDGAR) span through 2019. In a few places in the
number of stakeholders are collecting data and policy information,
report, CO2 data for 2020 are shown to illustrate the impact of the
more and better open-access data and capacity building efforts
COVID-19 pandemic; however, these data are based on a different
for data interpretation are supported by many multi-stakeholder
methodology than the EDGAR dataset and should not be compared
partnerships in the sustainable, low carbon movement.
directly with the data from previous years.
If you share our passion for open-access data and knowledge
The latest CO2 emission data for individual transport modes are for
towards greater impact on policy and investment decision
2018 and have been compiled only at the global level. For passenger
making worldwide and/or would like to contribute data or
and freight transport, the data on global CO2 emissions are for 2017,
knowledge to our collective efforts on this report, please reach
as this is the latest year with robust data. Data on passenger activity
out to the research team in the SLOCAT Secretariat at tcc-
(passenger-kilometres) and freight activity (tonne-kilometres) –
gsr@slocatpartnership.org.
provided mainly in the country fact sheets – are based on the latest
available year, as indicated in the report analysis.
Specific data used in this report Information on greenhouse gas emissions – provided in CO2 equivalent
Data on emissions (CO2eq) – include not only CO2 but also methane, nitrous oxide, and
industrial gases such as hydrofluorocarbons, perfluorocarbons, sulphur
The data in this edition of the report point to the direct carbon
hexafluoride and nitrogen trifluoride.2 These data are less up-to-date. As
emissions from transport activity; they do not cover the indirect
of 31 May 2021, data on greenhouse gas emissions were not readily
emissions and land-use impacts associated with certain modes of
available for the period 2019-2020. In some cases, additional data
transport. The report primarily utilises CO2 emission data compiled in
sources were used to provide detailed information about other climate
the Emissions Database for Global Atmospheric Research (EDGAR)
pollutants besides CO2.
from the Joint Research Centre of the European Commission, as this
represents the most recent, comprehensive dataset on transport All data on CO2 and other greenhouse gas emissions, as well as
CO2 emissions. However, this global dataset does not convey in full CO2eq, are provided in metric tonnes.
detail the unique situations of individual countries.
11Methodological Note
Annex
Data on car ownership Criteria for selection
Information on car ownership rates is based on a global dataset The report covers policies, targets, emission reductions (achieved or
from the International Organization of Motor Vehicle Manufacturers envisioned) and market measures. To merit inclusion in the analysis,
(OICA), with the latest release (as of 31 May 2021) dating from the policies, projects and trends must have been announced or
2015.3 Although newer information is available for some individual completed between 2018 and 2020. Significant developments from
countries, using these data would hinder accurate global January through May 2021 were included when deemed relevant, with
comparisons. Data on passenger and commercial vehicle sales the understanding that the next edition of the Transport and Climate
were available only up to 2019. Change Global Status Report will cover a period starting in 2021.
Policy landscape data Pre- and post-COVID-19 pandemic trends
The policy-related information presented in this report is not intended The year 2020 was pivotal for the world, and the COVID-19
to be comprehensive. The data for the policy landscape indicators pandemic has had substantial impacts on many of the transport
provided in Section 3 were gathered through desk research unless trends monitored in this report. This edition attempts to differentiate
otherwise indicated. Barriers to accessing such information include between long-term trends and impacts due to the pandemic. To the
language and limited availability of information through online extent possible, the analysis notes “pre-pandemic” (up to the end
media (e.g., websites, press releases and news articles). of 2019 or latest by February 2020) and “during pandemic” trends
(starting in March 2020 until the end of 2020), as in some cases the
Data in country fact sheets
pandemic led to reversals in long-term trends, at least for a specific
Information in the fact sheets is based on desk research and
period of time. In each section, a box describes the impacts that the
on contributions from the national focal points. The data were
pandemic has had on specific regions and sub-sectors.
collected to the best of the authors’ knowledge and based on data
availability, and thus may not be complete or show the most recent
status. When no information was available for a given indicator, the Assembling the report
term “Not available” is used. Global Strategy Team
This edition of the report was guided by a global strategy team
Data gaps
consisting of 20 experts in the field who provided inputs over the
Major data gaps exist in areas where there is no globally accepted
span of six meetings between September 2019 and October 2020.
data collection methodology. For example, the mapping of cycling
Additionally, small group consultations were organised in February
and walking infrastructure is not currently done in all regions.
2021, following the peer review process.
Also, the modal share can be surveyed through different methods,
leading to inconsistencies in available data. In addition, data on Authors and contributors
paratransit (informal transport), a predominant form of transport The report was collaboratively drafted by 22 authors and contributors
in many parts of the world, are largely lacking. This results in an from 16 organisations, led by the SLOCAT Secretariat. This includes
incomplete picture of the impact of transport on climate change and additions and high-level inputs from the copy editor and from the
sustainable development. special advisor who also co-authored the Executive Summary.
Authors researched and compiled relevant facts and figures for
the five sections of the report, including the Focus Features, with
Methodological approach
supporting review and inputs from several other organisations.
Countries and regions
The report follows the M49 Standard of the United Nations Statistics Peer review: A peer review process was carried out from 18
Division.4 In total, 196 countries have official United Nations December 2020 to 20 January 2021 with 1,700 comments received
membership and are also party to the United Nations Framework from 74 reviewers. Each comment was individually reviewed by the
Convention on Climate Change. The available data have been put in SLOCAT Secretariat and considered in finalising the report.
a common structure for the United Nations member countries, regions
National focal points: The report benefited from the contributions
and income groups to enable a consistent assessment. Income groups
of voluntary national focal points, or experts from various regions
are based on the World Bank’s classification of 2019.5
and countries who have been essential to overcome language
Economic calculations and information barriers. A public call for participation to provide
The per capita and gross domestic product (GDP) calculations are information on policies and data resulted in several hundred initial
based on the United Nations World Population Prospects 2019 and registrations. Out of these registrations, 78 national focal points
on World Bank GDP data using constant 2010 USD.6 provided inputs through a first survey from 24 January to 3 February
2020; and through a second survey (focused on the country fact
Spatial and temporal scales
sheets) from 6 to 30 August 2020. All national focal points that
The geographic scale (global, national, city-level, etc.) as well as time
contributed to the surveys are listed in the Acknowledgements.
scale (annual, monthly, daily) used in this report depends largely on
the available dataset, as noted in the relevant figures and text. The
detailed data forming the basis of the calculations and analysis are
provided in the SLOCAT Transport Knowledge Base.7
12Endnotes
Tr a n s p o r t a n d C l i m a t e C h a n g e G l o b a l S t a t u s R e p o r t - 2 nd e d i t i o n
Endnotes
tion-bikesharing.pdf; J. Zhang et al. (2021), “Life duration of bike sharing systems”,
3.6 Shared Mobility Services Case Studies on Transport Policy, Vol. 9/2, Elsevier Ltd, pp. 674-80, https://doi.
org/10.1016/j.cstp.2021.03.005.
1 A compilation of studies on shared autonomous vehicles and a discussion of ex- 18 Figure 3 from SLOCAT calculations based on P. Demalo et al. (2020), “The Meddin
pected demand patterns and required policy frameworks is found in S. Narayanan, Bike-sharing World Map”, PBSC, https://bikesharingworldmap.com.
E. Chaniotakis and C. Antoniou (2020), “Shared autonomous vehicle services: A 19 Figure 4 from National Association of City Transportation Officials (NACTO)
comprehensive review”, Transportation Research Part C: Emerging Technologies. (2020), Shared Micromobility in the U.S.: 2019, New York, https://nacto.org/
Vol. 11, Elsevier Ltd, pp. 255-93, https://www.sciencedirect.com/science/article/ shared-micromobility-2019, and from NACTO (2019), Shared Micromobility in
abs/pii/S0968090X19303493?via%3Dihub. the U.S.: 2018, New York, https://nacto.org/wp-content/uploads/2019/04/NAC-
2 See, for example, J. Edwards (2019), “Carpocalyspe now: Lyft’s founders are right TO_Shared-Micromobility-in-2018_Web.pdf. D. Fitch, H. Mohiuddin and S. Handy
– we’re in the endgame for traditional ‘car ownership’”, Business Insider, 3 March, (2020), Investigating the Influence of Dockless Electric Bike-share on Travel Behav-
https://www.businessinsider.com/carpocalypse-cars-automobile-sales-data-us-eu- ior, Attitudes, Health and Equity, University of California Institute of Transportation
rope-2019-3. Studies, Davis, https://escholarship.org/uc/item/2x53m37z.
3 Box based on the following sources: Reuters (2020), “Ola to cut about 35% 20 SLOCAT, op. cit. note 18.
workforce amid COVID-19 crisis”, The Wire, 20 May, https://thewire.in/business/ 21 B. B. Kabeja (2019), “E-bikes to revolutionize mobility in Rwanda”, Clean Leap, 15
ola-to-cut-about-35-workforce-amid-covid-19-crisis; Reuters (2020), “Food delivery March, https://cleanleap.com/e-bikes-revolutionize-mobility-rwanda.
overtakes ride-hailing as Grab’s biggest business in Covid-19 crisis”, The Straits
22 International Association of Public Transport (UITP), “Mena”, https://mena.uitp.
Times, 14 August, https://www.straitstimes.com/business/companies-markets/
org/dubai-rta-and-careem-operate-3500-bikes-and-350-stations (accessed 31 May
covid-19-delivers-to-grab-its-first-crisis-lessons; Kuntzman (2020), “BOOM! New
2021).
Citi Bikes stats show cycling surge is real – but mayor is not acting”, StreetsBlog
NYC, 12 March, https://nyc.streetsblog.org/2020/03/12/boom-new-citi-bike-stats- 23 NACTO (2020), op. cit. note 19.
show-cycling-surge-is-real-but-mayor-is-not-acting; July 2020 status from New 24 K. Canales and G. Rapier (2020), “The rise and fall of the Jump bike, the electric
Urban Mobility Alliance (NUMO) (2020), “NUMO New Mobility Atlas Update – July machine that wooed Uber into a $200 million sale and is now being discarded
1 2020”, 1 July, https://www.numo.global/news/new-mobility-atlas-update-ju- by the thousands”, Business Insider, 26 June, https://www.businessinsider.com/
ly-1-2020; D. Meyer (2020), “NYC suspends e-bike crackdown as eateries move to what-happened-to-jump-bike-rise-and-fall-uber-2020-6.
takeout, delivery-only”, New York Post, 16 March, https://nypost.com/2020/03/16/
25 M. López (2020), “E-scooter startup Lime retreats in Latam, a warning sign for
nyc-suspends-e-bike-crackdown-as-eateries-move-to-takeout-delivery-only; T.
Grow?” Contxto, 10 January, https://www.contxto.com/en/brazil/electric-scooter-
Bellon (2020), “New York City legalizes electric bikes and scooters, will create
startup-lime-retreats-latam-warning-sign-grow.
e-scooter pilot program”, Reuters, 25 June, https://www.reuters.com/article/
us-new-york-city-scooters/new-york-city-legalizes-electric-bikes-and-scooters-will- 26 Esferasoft Solutions, “Global e-scooter market trends and statistics: Increasing
create-e-scooter-pilot-program-idUSKBN23W3GR; M. Kelley (2021), “Micromobility popularity of e-scooter sharing services to boost market growth”, https://www.
Is thriving in the new ‘safety economy’”, Brink, 17 March, https://www.brinknews. esferasoft.com/blog/global-escooter-market-trends-statistics-and-micromobili-
com/how-bicycle-and-scooter-sharing-are-likely-to-thrive-in-a-new-safety-corona- ty-report (accessed 31 May 2021).
virus-economy. Figure 1 from SLOCAT Partnership on Sustainable, Low Carbon 27 Figure 5 from NUMO, “New Mobility Atlas”, https://www.numo.global/new-mobili-
Transport calculations based on bike-sharing data from individual cities; see ty-atlas#2/51.94/12.25 (accessed 31 May 2021).
SLOCAT (2021), Transport Knowledge Base, https://www.slocat.net/trakb.
28 A. Schmitt (2018), “Is pedal dockless bike share going extinct”, StreetsBlog USA,
4 Figure 2 from S. Shaheen and A. Cohen (2020), Innovative Mobility: Carsharing 10 October, https://usa.streetsblog.org/2018/10/10/is-pedal-dockless-bike-share-
Outlook; Carsharing Market Overview, Analysis, and Trends, University of California, going-extinct.
Berkeley, https://escholarship.org/uc/item/61q03282.
29 NUMO, op. cit. note 27.
5 Ibid.; S. Phillips (2019), “Carsharing market and growth analysis 2019”, Movmi, 10
July, https://movmi.net/carsharing-market-growth-2019. 30 NACTO (2020), op. cit. note 19; NACTO (2019), op. cit. note 19.
6 P. Wadhwani and P. Saha (2020), Car Sharing Market Size by Model (P2P, Sta- 31 NACTO (2020), op. cit. note 19.
tio-Base, Free-Floating), By Business Model (Round Trip, One Way), By Application 32 NACTO (2019), op. cit. note 19.
(Business, Private), Industry Analysis Report, Regional Outlook, Application Poten- 33 L. Hodgson (2020), “Investors bet on micromobility’s post-COVID-19 future”, Pitch-
tial, Price Trend, Competitive Market Share and Forecast, 2020-2026, Global Market Book, 1 June, https://pitchbook.com/news/articles/investors-bet-on-micromobili-
Insights, Selbyville, https://www.gminsights.com/industry-analysis/carsharing-mar- tys-post-covid-19-future.
ket.
34 K. Wilson (2020), “Why do micromobility companies keep losing money?” Streets-
7 Ibid. Blog USA, 14 January, https://usa.streetsblog.org/2020/01/14/why-do-micromobil-
8 Movmi (2018), “South East Asia”, 16 October, https://movmi.net/shared-mobility- ity-companies-keep-losing-money.
south-east-asia. 35 J. Eliasen (2021), “The future of micromobility”, Medium, 15 January, https://medi-
9 Graphic Research (2018), Asia Pacific Car Sharing Market Size by Model (P2P, Sta- um.com/swlh/the-future-of-micromobility-2d4d96d4e2dd.
tio-Base, Free-Floating), By Business Model (Round Trip, One Way), By Application 36 Ibid.
(Business, Private), Industry Analysis Report, Regional Outlook (China, Japan, South
Korea, India, Taiwan, Malaysia, Singapore, Australia), Growth Potential, Competitive 37 Red Herring (2020), “Layoffs hit hard as unicorns place new focus on profitability”,
Market Share and Forecast, 2018-2024, Pune, https://www.graphicalresearch.com/ 13 January, https://www.redherring.com/north-america/layoffs-hit-hard-as-uni-
industry-insights/1001/asia-pacific-car-sharing-market. corns-place-new-focus-on-profitability.
10 C. Rodier and J. Michaels (2019), The Effects of Ride-Hailing Services on Green- 38 Hodgson, op. cit. note 33.
house Gas Emissions, University of California, Davis, https://escholarship.org/uc/ 39 Figure 6 from Bloomberg Philanthropies (2020), “Initiative on Cities and Autono-
item/4vz52416. mous Vehicles”, https://avsincities.bloomberg.org (accessed 8 October 2020).
11 A. Henao and W. E. Marshall (2019), “The impact of ride-hailing on vehicle miles 40 Reuters (2019), “Elon Musk on Telsa’s self-driving capabilities”, 22 April,
traveled,” Transportation, Vol. 46/6, Springer, pp. 2173-94, https://doi.org/10.1007/ https://www.reuters.com/article/us-tesla-autonomous-factbox/fact-
s11116-018-9923-2. box-elon-musk-on-teslas-self-driving-capabilities-idUSKCN1RY0QY. For predic-
12 O. R. Tarek and S. Amit (2020), “With 7.5m rides a month, ridesharing services tions from Elon Musk and others, see D. Faggella, “The self-driving car timeline
take over Bangladesh”, The Business Standard, 17 February, https://tbsnews.net/ – predictions from the top 11 global automakers”, Emerj, 14 March, https://emerj.
economy/75m-rides-month-ridesharing-services-take-over-bangladesh-45453. com/ai-adoption-timelines/self-driving-car-timeline-themselves-top-11-automak-
ers.
13 N. Akter, F. N. Rahman and M. I. Hossain (2019), “Transforming ride-sharing into
sustainable business”, The Daily Star, 29 October, https://www.thedailystar.net/ 41 J. Plautz (2019), “Survey: 57% of people willing to ride in AV’s”, Smart Cities Dive,
business/news/transforming-ride-sharing-sustainable-business-1820065. 5 June, https://www.smartcitiesdive.com/news/survey-57-of-people-willing-to-
ride-in-avs/556194; A. Short (2019), “Brake time: Autonomous vehicle testing
14 A. Tirachini and A. Gomez-Lobo (2020), “Does ride-hailing increase or decrease endangers pedestrians”, StreetsBlog USA, 21 August, https://usa.streetsblog.
vehicle kilometers traveled (VKT)? A simulation approach for Santiago de Chile,” org/2019/08/21/brake-time-automatic-vehicle-testing-endangers-pedestrians; K.
International Journal of Sustainable Transportation, Vol. 14/3, Taylor and Francis Wiggers (2019), “11 companies propose guiding principles for self-driving vehi-
Ltd., pp. 187-204, https://doi.org/10.1080/15568318.2018.1539146. cles”, Venture Beat, 2 July, https://venturebeat.com/2019/07/02/self-driving-car-re-
15 D. Oviedo, I. Granada and D. Perez-Jaramillo (2020), Ridesourcing and Travel port-safety-first-for-automated-driving; Daimler (2019), “Safety First for Automated
Demand: Potential Effects of Transportation Network Companies in Bogotá, Driving (SaFAD)”, 2 July, https://www.daimler.com/innovation/case/autonomous/
Multidisciplinary Digital Publishing Institute (MDPI), Basel, https://www.mdpi. safety-first-for-automated-driving-2.html; P. Koopman (2019), “An overview of
com/2071-1050/12/5/1732/pdf. draft UL4600: ‘Standard for Safety for the Evaluation of Autonomous Products’”,
16 Y. Kazeem (2020), “Lagos has banned its most effective methods of transport Medium, 20 June, https://medium.com/@pr_97195/an-overview-of-draft-ul-4600-
– including bikehailing startups”, Quartz Africa, 28 January, https://qz.com/afri- standard-for-safety-for-the-evaluation-of-autonomous-products-a50083762591; H.
ca/1792504/lagos-bans-okada-oride-gokada-keke-tricycles. Grabar (2019), “The hyperloop has taken a detour”, Slate Group, 31 May, https://
slate.com/technology/2019/05/elon-musks-hyperloop-is-borrowing-ideas-from-
17 C. Moon-Miklaucic et al. (2019), The Evolution of Bike Sharing: 10 Questions on trains-and-cars.html.
the Emergence of New Technologies, Opportunities, and Risks, World Resources
Institute, Washington, D.C., https://wrirosscities.org/sites/default/files/the-evolu- 42 M. Bayern (2020), “Autonomous vehicles: How 7 countries are handling the
regulatory landscape”, Tech Republic, 5 February, https://www.techrepublic.com/
13Endnotes
article/autonomous-vehicles-how-7-countries-are-handling-the-regulatory-land- %283%29.pdf; Republika (2019), “Driving electric scooters to be regulated by law,
scape. Government decides”, 29 October, https://english.republika.mk/news/macedonia/
43 FFM Aktuell (2019), “Getting on board for the future – test operation for autono- driving-electric-scooters-to-be-regulated-by-law-government-decides.
mous vehicles in Frankfurt”, Frankfurt-Tipp, 10 January, https://www.frankfurt-tipp. 67 Library of Congress (2019), “Brazil: City of São Paolo enacts decree regulating use
de/en/news/s/ugc/getting-started-in-the-future-test-operation-for-autonomous-ve- of electric scooters”, 23 May, https://www.loc.gov/law/foreign-news/article/brazil-
hicles-in-frankfurt.html. city-of-so-paulo-enacts-degree-regulating-use-of-electric-scooters.
44 Sustainable Bus (2019), “Artificial Intelligence under the bonnet. Volvo Buses 68 Unagi, “The Comprehensive Guide to Electric Scooter Laws”, https://unagiscoot-
unveiled the first driverless bus in Singapore”, 6 March, https://www.sustain- ers.com/articles/the-comprehensive-guide-to-electric-scooter-laws (accessed 31
able-bus.com/news/artificial-intelligence-under-the-bonnet-volvo-buses-un- May 2021).
veiled-the-first-driverless-bus-in-singapore. 69 Land Transport Authority Singapore (2019), “E-scooters to be prohibited on
45 A. Dellinger (2019), “Self-driving truck completes first cross-country freight deliv- all footpaths following safety review”, 4 November, https://www.lta.gov.sg/
ery”, Mic, 11 December, https://www.mic.com/p/self-driving-truck-completes-first- content/ltagov/en/newsroom/2019/11/1/e-scooters_tobe_prohibited_on_allfoot-
cross-country-freight-delivery-19440102. paths_following_safety_review.html. For an analysis of the regulations around
46 A. J. Hawkins (2020), “GM will spend $2.2 billion to build electric and autono- micromobility, see J. Halfon (2019), “A lawyer explains why electric scooter laws
mous vehicles at Detroit plant”, The Verge, 27 January, https://www.theverge. don’t work”, Bloomberg CityLab, 28 June, https://www.bloomberg.com/news/
com/2020/1/27/21083356/gm-cruise-ev-av-production-announcement-de- articles/2019-06-28/electric-scooter-laws-are-defective-a-lawyer-says.
troit-hamtramck-origin. 70 For a review of this standard and some of the concerns related to it, see A.
47 Bird Cities Blog (2020), “Life cycle analysis reveals vast CO2 emissions gap J. Hawkins (2019), “New startup aims to bring controversial scooter track-
between cars and scooters, 27 April, https://www.bird.co/blog/life-cycle-analysis- ing system to more cities”, The Verge, 23 September, https://www.theverge.
co2-emissions-gap-between-cars-scooters. com/2019/9/23/20872421/lacuna-startup-mds-scooter-tracking-ladot-data-collec-
tion.
48 Lime (2019), “New report examines the sustainability impact of e-scooters in
Paris”, 10 October, https://www.li.me/second-street/new-report-examines-sustain- 71 Unagi, op. cit. note 68.
ability-impact-e-scooters-paris. 72 NUMO, “About NUMO”, https://www.numo.global/about (accessed 2 June 2021);
49 Lime (2019), “E-scooters and Earth Day: Measuring micromobility’s impact on the R. Chase (2017), “Shared Mobility Principles for Livable Cities”, https://www.
environment”, 22 April, https://www.li.me/second-street/e-scooters-earth-day-mea- sharedmobilityprinciples.org.
suring-micromobility-impact-environment. 73 NUMO (2020), “World Economic Forum releases guidelines for city mobility: Steer-
50 A. Schuller and M. Aboukrat (2019), White Paper: The Role of E-scooters and Light ing towards collaboration”, 17 March, https://www.numo.global/news/world-eco-
Electric Vehicles in Decarbonizing Cities, Carbone 4, http://www.carbone4.com/ nomic-forum-releases-guidelines-city-mobility-steering-towards-collaboration;
wp-content/uploads/2019/09/Carbone-4-for-Bird-E-Scooter-and-Cities-decarbon- World Economic Forum (2020), Guidelines for City Mobility: Steering Towards
ization.pdf. Collaboration, Geneva, https://www.weforum.org/reports/guidelines-for-city-mobil-
ity-2020.
51 Portland Bureau of Transportation (2018), 2018 E-Scooter Findings Report, Port-
land, Oregon, https://www.portlandoregon.gov/transportation/article/709719. 74 B. Welle and T. Fried (2019), “Tech startups offer new answers to African transport
woes. How can cities capitalize?” The City Fix, 14 November, https://thecityfix.com/
52 North Carolina State University (2019), “Shared e-scooters aren’t always as ‘green’ blog/tech-startups-offer-new-answers-african-transport-woes-can-cities-capitalize-
as other transport options”, ScienceDaily, 2 August, https://www.sciencedaily.com/ ben-welle-travis-fried.
releases/2019/08/190802104535.htm.
75 GoMetro, http://www.getgometro.com (accessed 31 May 2021); WhereIsMy-
53 A. Henao and W. E. Marshall (2019), “The impact of ride-hailing on vehicle miles Transport, “Trusted Mobility Data and Solutions for Emerging-Market Cities”,
traveled”, Transportation, Vol. 46/6, Springer, pp. 2173-94, https://doi.org/10.1007/ https://www.whereismytransport.com (accessed 31 May 2021); SafeBoda, “Why
s11116-018-9923-2. SafeBoda?” https://safeboda.com/ng (accessed 31 May 2021); A .L. Dahir (2019),
54 Figure 6 from Rodier and Michaels, op. cit. note 10. “Ride-hailing services want to disrupt – and bring order to – Kenya’s unruly
public bus system”, Quartz Africa, 23 January, https://qz.com/africa/1531062/
55 B. Schaller (2021), “Can sharing a ride make for less traffic? Evidence from Uber
kenyas-matatu-buses-face-disruption-by-little-swvl-safiri; J. Mueni (2019), “Matatu
and Lyft and implications for cities,” Transport Policy, Vol. 102, Elsevier Ltd, pp.
hailing app launches for Nairobi commuters”, Capital Business, 7 March, https://
1-10, https://doi.org/10.1016/j.tranpol.2020.12.015.
www.capitalfm.co.ke/business/2019/03/matatu-hailing-app-launched-for-nairo-
56 S. Shaheen et al. (2019), Shared Mobility Policy Playbook, Transportation Sus- bi-commuters.
tainability Research Center, University of California at Berkeley, Berkeley, https://
76 D. Taylor (2020), “How technology is upgrading traditional mobility services in
escholarship.org/uc/item/9678b4xs.
Africa”, World Economic Forum, 27 November, https://www.weforum.org/agen-
57 J. Khurana (20201), “Ride-hailing platforms will lead the global EV transition”, da/2020/11/south-africa-mobility-technology.
World Business Council for Sustainable Development, 25 January, https://www.
77 T. Fried and I. Abubaker (2019), “In African cities, mapping paratransit makes for
wbcsd.org/Overview/News-Insights/WBCSD-insights/Ride-hailing-platforms-will-
smarter mobility”, The City Fix, 27 May, https://thecityfix.com/blog/african-cit-
lead-the-global-EV-transition.
ies-mapping-paratransit-makes-smarter-mobility-travis-fried-iman-abubaker.
58 D. Gardiner (2021), “California requires Uber, Lyft to switch mostly to electric cars
78 R. Chase (2017), “Shared Mobility Principles for Livable Cities”, https://www.
by 2030”, San Francisco Chronicle, 21 May, https://www.sfchronicle.com/politics/
sharedmobilityprinciples.org (accessed 31 May 2021).
article/California-requires-Uber-Lyft-to-switch-mostly-16194997.php.
79 NUMO, https://www.numo.global (accessed 31 May 2021).
59 D. Hall, M. Nicholas and M. R. Bernard (2021), Guide to Electrifying Ride-hailing
Vehicles for Cities, International Council on Clean Transportation (ICCT), https:// 80 For a good overview of global initiatives, see Micromobility Industries (2021), “The
theicct.org/sites/default/files/publications/Ride-hailing-cities-guide-mar2021.pdf. Micromobility Landscape”, https://micromobility.io/landscape (accessed 31 May
2021).
60 D. Hall et al. (2020), Electric Vehicle Capitals: Cities Aim for All-electric Mobility,
ICCT, Washington, D.C., https://theicct.org/sites/default/files/publications/ev-capi- 81 World Economic Forum, “Global New Mobility Coalition”, https://www.weforum.
tals-update-sept2020.pdf. org/projects/global-new-mobility-coalition (accessed 31 May 2021).
61 Lime (2020), “Lime commits to 100% zero-emissions operations fleet vehicles”, 6 82 Innovative Mobility, “About IMR”, http://innovativemobility.org/?page_id=47 (ac-
February, https://v1.li.me/second-street/lime-commits-to-100-zero-emissions-oper- cessed 31 May 2021); University of California at Berkeley, “About TSRC”, https://
ations-fleet-vehicles. tsrc.berkeley.edu/about (accessed 31 May 2021).
62 Lyft (2020), “Leading the transition to zero emissions: Our commitment to 100% 83 Shared-Use Mobility Center, “About us”, https://sharedusemobilitycenter.org/
electric vehicles by 2030”, 17 June, https://www.lyft.com/blog/posts/lead- about-us (accessed 31 May 2021).
ing-the-transition-to-zero-emissions. 84 MaaS Alliance, “Join MaaS Alliance”, https://maas-alliance.eu/join (accessed 31
63 Connected to India (2019), “Singapore’s Grab adds 200 electric vehicles to its May 2021).
fleet”, 10 January, https://www.connectedtoindia.com/singapores-grab-adds-200- 85 Mobility on Demand Alliance, “Why an Alliance?” https://static1.square-
electric-vehicles-to-its-fleet-4970.html. space.com/static/5b1e8a4be2ccd113109d86d9/t/5d214a189813d8000
64 E. Bannon (2020), “Uber to electrify half of its rides in Europe after T&E public 1c21546/1562462744462/MOD+Alliance+Fact+Sheet+July+2019.pdf (accessed
appeal”, Transport and Environment, 8 September, https://www.transportenviron- 31 May 2021).
ment.org/press/uber-electrify-half-its-rides-europe-after-te-public-appeal; Uber, 86 European Commission (2018), “1st Partner Meeting of the EIP – SCC New Mobility
“Millions of rides a day. Zero emissions.”, https://www.uber.com/be/en/about/ Services Initiative”, 26 February, https://smart-cities-marketplace.ec.europa.eu/
sustainability (accessed 31 May 2021). news-and-events/news/2018/1st-partner-meeting-eip-scc-new-mobility-ser-
65 M. Beedham (2020), “Estonia is finally gearing up to regulate e-scooters on its vices-initiative.
roads – EU adoption increasing”, TNW, 7 May, https://thenextweb.com/news/esto- 87 If not stated otherwise, then the assessment of policy landscape indicators is
nia-government-amend-laws-that-pave-way-for-e-scooters-uk-trials. based on desk research with a focus on the 31 country factsheets and information
66 A. Tidey (2019), “Germany legalizes e-scooters but bans them from the pavement”, outlined in the section. More countries might have such policies in place or similar
Euronews, 20 May, https://www.euronews.com/2019/05/17/germany-legalises- policies implemented. SLOCAT, op. cit. note 18; Carsharing Association (2021),
e-scooters-but-bans-them-from-the-pavement; Uffici di Diretta Collaborazione “Carsharing World Map”, https://carsharing.org/carsharing-world-map (accessed
del Ministro Dipartimento per I Transporti (2019), Il Ministro delle infrastrutture e 20 April 2021); S. Shaheen and A. Cohen (2020), “Innovative mobility: Carsharing
dei transporti, Governo Italiano, http://www.mit.gov.it/sites/default/files/media/ outlook”, https://escholarship.org/uc/item/61q03282 (accessed 20 October 2020);
notizia/2019-06/schema%20DM%20micromobilit%C3%A0%20229_2019%20 Bloomberg Philanthropies, op. cit. note 39.
14You can also read