Viscosity and phase state of aerosol particles consisting of sucrose mixed with inorganic salts - Recent
←
→
Page content transcription
If your browser does not render page correctly, please read the page content below

Atmos. Chem. Phys., 21, 10215–10228, 2021
https://doi.org/10.5194/acp-21-10215-2021
© Author(s) 2021. This work is distributed under
the Creative Commons Attribution 4.0 License.

Viscosity and phase state of aerosol particles consisting of
sucrose mixed with inorganic salts
Young-Chul Song1,2 , Joseph Lilek3 , Jae Bong Lee4 , Man Nin Chan5,6 , Zhijun Wu7 , Andreas Zuend3 , and
Mijung Song1,2,8
1 Department   of Earth and Environmental Sciences, Jeonbuk National University, Jeonju, Republic of Korea
2 The Earth and Environmental Science System Research Center, Jeonbuk National University, Jeonju, Republic of Korea
3 Department of Atmospheric and Oceanic Sciences, McGill University, Montréal, Quebec, Canada
4 Innovative System Safety Research Division, Korea Atomic Energy Research Institute, Daejeon, Republic of Korea
5 Earth System Science Programme, Faculty of Science, The Chinese University of Hong Kong, Hong Kong, China
6 The Institute of Environment, Energy, and Sustainability, The Chinese University of Hong Kong, Hong Kong, China
7 Key Joint Laboratory of Environmental Simulation and Pollution Control, College of Environmental Sciences and

Engineering, Peking University, Beijing, China
8 Department of Environment and Energy, Jeonbuk National University, Jeonju, Republic of Korea

Correspondence: Mijung Song (mijung.song@jbnu.ac.kr)

Received: 5 February 2021 – Discussion started: 22 February 2021
Revised: 10 June 2021 – Accepted: 10 June 2021 – Published: 7 July 2021

Abstract. Research on the viscosity and phase state of            creased from ∼ 3 × 10⁻² to greater than ∼ 1 × 10⁸ Pa s for
aerosol particles is essential because of their significant in-   RH values from ∼ 75 % to ∼ 5 %. Compared to the vis-
fluence on the particle growth rate, equilibration times, and     cosities of the Ca(NO3 )2 / H2 O particles, higher viscosities
related evolution of mass concentration as well as heteroge-      were observed for the ternary sucrose / Ca(NO3 )2 / H2 O par-
neous reactions. So far, most studies of viscosity and phase      ticles, with values increased by about 1 order of magni-
state have been focused on organic aerosol particles, yet         tude at 50 % RH and about 6 orders of magnitude at 35 %
data on how viscosity can vary when the organic materials         RH. Moreover, we applied a thermodynamics-based group-
are mixed with inorganic salts remain scarce. Herein, us-         contribution model (AIOMFAC-VISC, Aerosol Inorganic–
ing bead-mobility and poke-and-flow techniques, we quan-          Organic Mixtures Functional groups Activity Coefficients
tified viscosities at 293 ± 1 K for binary mixtures of organic    Viscosity) to predict aerosol viscosities for the studied sys-
material / H2 O and inorganic salts / H2 O, as well as ternary    tems. The model predictions and viscosity measurements
mixtures of organic material / inorganic salts / H2 O over the    show good agreement within ∼ 1 order of magnitude in vis-
atmospheric relative humidity (RH) range. Sucrose as the          cosity. The viscosity measurements indicate that the studied
organic species and calcium nitrate (Ca(NO3 )2 ) or magne-        mixed organic–inorganic particles range in phase state from
sium nitrate (Mg(NO3 )2 ) as the inorganic salts were ex-         liquid to semi-solid or even solid across the atmospheric RH
amined. For binary sucrose / H2 O particles, the viscosities      range at a temperature of 293 K. These results support our
gradually increased from ∼ 3 × 10⁻² to &1 × 10⁸ Pa s as RH        understanding that organic / inorganic / H2 O particles can
decreased from ∼ 75 % to ∼ 25 %. Compared with the re-            exist in a liquid, semisolid, or even a solid state in the tro-
sults for the sucrose / H2 O particles, binary Ca(NO3 )2 / H2 O   posphere.
and Mg(NO3 )2 / H2 O particles showed drastic enhancements
to &1 × 10⁸ Pa s at low RH close to the efflorescence RH.
For ternary mixtures of sucrose / Ca(NO3 )2 / H2 O or su-
crose / Mg(NO3 )2 / H2 O, with organic-to-inorganic mass ra-
tios of 1 : 1, the viscosities of the particles gradually in-

Published by Copernicus Publications on behalf of the European Geosciences Union.
10216                                                           Y.-C. Song et al.: Viscosity and phase state of aerosol particles

1   Introduction                                                     from . 10−3 to & 108 Pa s, which is approximately equal to
                                                                     the range of viscosities between that of water and tar pitch,
Aerosol particles are emitted from various natural (e.g.,            depending on the RH, oxidation state, and chemical compo-
the ocean and plants) and anthropogenic (e.g., transporta-           sition (Mikhailov et al., 2009; Virtanen et al., 2010; Vaden
tion and fuel combustion) sources, as well as being pro-             et al., 2011; Koop et al., 2011; Saukko et al., 2012; Renbaum-
duced by gas-to-particle conversion and equilibration pro-           Wolff et al., 2013a; Hao et al., 2014; Kidd et al., 2014; Bate-
cesses due to chemical processing of gaseous species in the          man et al., 2015; Y. Zhang et al., 2015; Athanasiadis et al.,
atmosphere (e.g., sulfur dioxide, nitrogen oxides, ammonia,          2016; Grayson et al., 2016, 2017; Hinks et al., 2016; Hosny
and volatile organic compounds). Submicron-sized aerosol             et al., 2016; Rothfuss and Petters, 2017; Yli-Juuti et al., 2017;
particles mainly consist of organic materials and inorganic          Petters et al., 2019; M. Song et al., 2015, 2016, 2019; Gervasi
salts (Jimenez et al., 2009; Huang et al., 2015; Cheng et al.,       et al., 2020). In addition to the viscosity of SOA, the viscos-
2016). Depending on the location and the season, the organic         ity effects of inorganic salts should also be investigated to
mass fraction of submicron particles ranges from ∼ 20 % up           better understand the viscosities and phase states of atmo-
to ∼ 90 % (Zhang et al., 2007; R. Zhang et al., 2015; Jimenez        spherically relevant mixed particles.
et al., 2009; Hao et al., 2014; Huang et al., 2015; Cheng               Only a few studies have investigated the viscosity and
et al., 2016; Wang et al., 2016). Field measurements have            phase state of aerosol particles consisting of organic ma-
shown that organic materials and inorganic salts are often in-       terials and inorganic salts. Power et al. (2013) showed us-
ternally mixed in an aerosol particle (Murphy et al., 2006;          ing holographic optical tweezers that the viscosity of su-
Y. C. Song et al., 2010, 2013). They can significantly affect        crose / H2 O particles is significantly greater than that of
the local air quality (Kulmala et al., 2011; Wang et al., 2015a;     NaCl / H2 O particles at any RH. They also showed that the
R. Zhang et al., 2015; Schmedding et al., 2020), regional cli-       viscosity of mixed sucrose / NaCl / H2 O particles decreased
mate (Russell et al., 1997; Kaufman et al., 2002; Kanakidou          as the NaCl concentration increased at a certain RH. Rov-
et al., 2005; Kulmala et al., 2011), and human health (Bhat-         elli et al. (2019) used a different inorganic salt and observed
tarai et al., 2020). However, the physicochemical properties         that the viscosity of sucrose / NaNO3 / H2 O particles de-
of internally mixed particles such as the relative humidity          creased as the NaNO3 mass fraction increased at a certain
(RH)-dependent viscosities and morphologies remain poorly            RH. Richards et al. (2020a) reported that inorganic salt in or-
characterized.                                                       ganic and inorganic mixtures increased viscosity by the ion–
   The viscosity of aerosols can vary based on the RH and re-        molecule effect. Based on field measurements using a par-
lated water uptake, chemical composition, and temperature,           ticle rebound technique, Bateman et al. (2017) showed that
with effects on the size distribution (Shiraiwa et al., 2013;        the phase state of atmospheric submicron aerosol particles
Zaveri et al., 2014, 2018), mass concentration of aerosol par-       consisting of biogenic organic compounds, sulfate, and black
ticles (Shiraiwa and Seinfeld, 2012; Yli-Juuti et al., 2017;         carbon in central Amazonia assumed a non-liquid state (i.e.,
Kim et al., 2019), ice nucleation efficiency (Murray et al.,         viscosity > 102 Pa s) even at relatively high RH values during
2010; Ladino et al., 2014; Knopf et al., 2018), and crys-            periods of anthropogenic influence. They reported that the
tallinity of salts (Murray, 2008; Song et al., 2013; Ji et al.,      aerosol particles influenced by a plume of urban pollution
2017; Wang et al., 2017). Depending on the viscosity, the            and biomass burning existed in a non-liquid state (viscos-
phase state of aerosol particles can be determined; commonly         ity > 102 Pa s). Liu et al. (2019) observed atmospheric sub-
the dynamic viscosity of a liquid is characterized as being          micron aerosol particles in a liquid phase state at RH > 60 %
less than 102 Pa s, that of a semi-solid is between 102 and          upon the enhancement of the aerosol nitrate fraction in Shen-
1012 Pa s, and that of a glassy or crystalline solid is typically    zhen, which is a subtropical coastal urban city in China. Con-
greater than 1012 Pa s (Zobrist et al., 2008; Koop et al., 2011;     sidering the wide variety of complex atmospheric aerosol
Reid et al., 2018).                                                  compositions, more information on the viscosity of mixed
   Most studies on this topic have focused on the determina-         organic–inorganic particles is needed.
tion of the viscosities and phase state of secondary organic            Using the bead-mobility and poke-and-flow techniques, at
aerosols (SOAs) (Mikhailov et al., 2009; Virtanen et al.,            293 ± 1 K, we measured the RH-dependent aerosol viscosi-
2010; Koop et al., 2011; Vaden et al., 2011; Saukko et al.,          ties of binary mixtures of organic material / H2 O and inor-
2012; Renbaum-Wolff et al., 2013; Hao et al., 2014; Kidd             ganic salts / H2 O, as well as ternary mixtures of organic ma-
et al., 2014; Bateman et al., 2015; M. Song et al., 2015, 2016,      terial / inorganic salts / H2 O under dehydration conditions.
2019; Athanasiadis et al., 2016; Grayson et al., 2016; Hinks         Sucrose was selected as the model organic substance, be-
et al., 2016; Hosny et al., 2016; Yli-Juuti et al., 2017; Petters    cause previous studies have frequently applied it as a sur-
et al., 2019; Wallace and Preston, 2019; Gervasi et al., 2020;       rogate species for SOA (Zobrist et al., 2011; Power et al.,
Schmedding et al., 2020). Different types of SOAs generated          2013; Grayson et al., 2017; Y. C. Song et al., 2016, 2020;
in environmental chambers and flow reactors have been ex-            Rothfuss and Petters, 2017; Rovelli et al., 2019). Ca(NO3 )2
amined. The dynamic viscosities of some types of SOA par-            and Mg(NO3 )2 were used as model inorganic salts, because
ticles (e.g., generated from toluene and diesel vapors) ranged       they have been commonly observed in mineral dust particles

Atmos. Chem. Phys., 21, 10215–10228, 2021                                            https://doi.org/10.5194/acp-21-10215-2021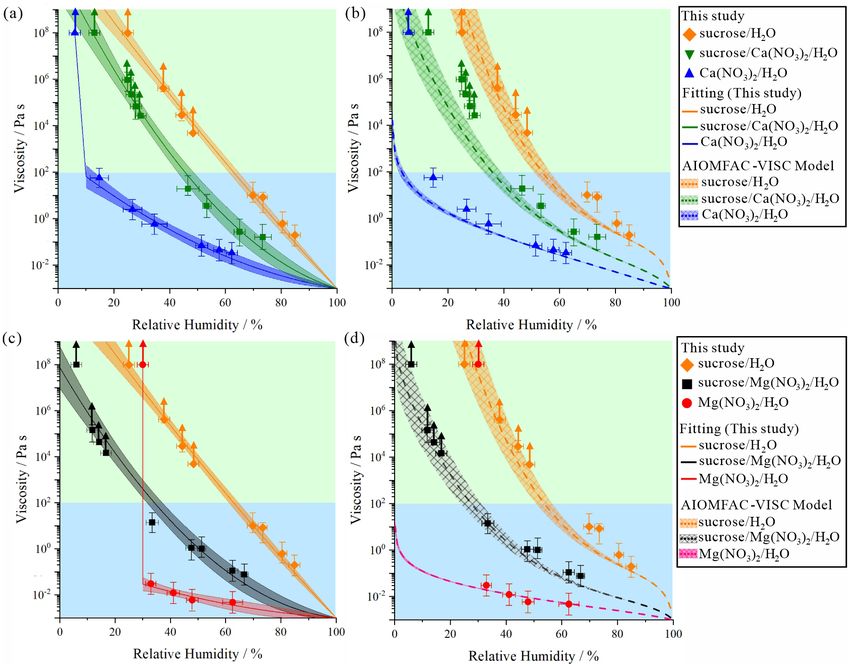
Y.-C. Song et al.: Viscosity and phase state of aerosol particles                                                           10217

(Usher et al., 2003; Laskin et al., 2005; Sullivan et al., 2007),   in diameter were selected for the optical observation. All vis-
and sea-salts (Gupta et al., 2015; Zieger et al., 2017) in the      cosity measurements were carried out at a temperature of
atmosphere (Usher et al., 2003; Laskin et al., 2005; Sullivan       293 ± 1 K.
et al., 2007; Shi et al., 2008; Song et al., 2010, 2013; Pan
et al., 2017). Moreover, both of these nitrate salts have a rel-    2.2   Bead-mobility technique
atively low efflorescence RH in aqueous solutions, enabling
viscosity measurements of crystal-free solutions from high          The bead-mobility technique was utilized, which can quan-
RH down to at least 30 % RH. Using these binary and ternary         tify a range of viscosities from ∼ 10−3 to ∼ 103 Pa s
mixtures, we explore how the viscosities vary as a function         (Renbaum-Wolff et al., 2013b). At the beginning of the bead-
of RH and associated aerosol compositions. Such viscosity           mobility experiments, insoluble melamine beads (cat. no.
studies can provide a better knowledge of the physicochem-          86296, Sigma-Aldrich), which were ∼ 1 µm in diameter and
ical properties of atmospherically relevant aerosol particles       dispersed in pure water, were incorporated directly into the
consisting of organic material and inorganic salts.                 droplets deposited on the hydrophobic substrate. Aerosol
                                                                    particles were then placed into the flow cell, as described
                                                                    in Sect. 2.1. The total gas flow in the cell was 1200 sccm
2     Experimental                                                  for the bead-mobility experiments. The continuous gas flow
                                                                    generates a shear stress on a particle’s surface, which yields
2.1    Generation of particles                                      internal circulations of the beads in the particles during mea-
                                                                    surements. The movement of the beads at 293 ± 1 K was
Sucrose (99.5 % purity, Sigma-Aldrich), Ca(NO3 )2 q4H2 O            recorded every 1 s with a CMOS camera (MSC-M 3.0 UC-
(99.997 % purity, Sigma-Aldrich), and Mg(NO3 )2 q6H2 O              MOS, China) and then quantified at a target RH. The viscos-
(99.99 % purity, Sigma-Aldrich) were purchased. Solutions           ity was calculated from the bead speeds using a calibration
containing each compound were prepared at 10 wt.% in pure           line, which produced bead speeds for the sucrose particles
water (resistivity ≥ 18.2 M cm, Merck Millipore Synergy,           at different RH values (see Fig. S1 in the Supplement). Fig-
Germany). For ternary mixtures, solutions were prepared at          ure S2 in the Supplement illustrates the mean bead speeds
an organic-to-inorganic dry mass ratio (OIR) of 1 : 1. This         of each system as a function of the RH. When the bead
dry mass ratio was chosen since it is expected to reveal            speeds within a particle are too slow to be observed with
well the effects of mixing of substantial amounts of both           this technique (i.e., below ∼ 10−6 µm m s−1 corresponding
the organic and salt components on overall water uptake and         to ∼ 102 Pa s; see Figs. S1 and S2), we used the poke-and-
viscosity. For the bead-mobility and poke-and-flow experi-          flow technique (Sect. 2.3). For example, the movement of
ments, the aqueous solutions were nebulized on a hydropho-          the beads within Mg(NO3 )2 / H2 O particles at ∼ 35 % RH
bic substrate (Hampton Research, Canada). After nebuliz-            was too slow to be readily observed (Fig. S2). Further infor-
ing, the substrate with droplets was set in a flow cell which       mation on the calibration and the bead-mobility technique is
was placed below an objective mounted on an optical mi-             given in Sect. S1 in the Supplement.
croscope (Olympus CKX53 with 40× objective) (Pant et al.,
2006; Bertram et al., 2011; Song et al., 2012; Ham et al.,          2.3   Poke-and-flow technique
2019). The RH in the cell was adjusted by controlling the
N2 mixing ratio of the dry and wet gas flows. The RH in             Murray et al. (2012) developed the poke-and-flow technique
the flow cell was continuously monitored by a digital humid-        for phase state determination, which was expanded for the
ity sensor (Sensirion, SHT C3, Switzerland). The RH read-           quantification of viscosities & 102 Pa s by Renbaum-Wolff
ing from the flow cell was calibrated by measurement and            et al. (2013a), Grayson et al. (2015), and Song et al. (2015).
comparison to the deliquescence RH (DRH) at 293 ± 1 K of            This technique uses a small hole on the top of the flow cell
saturated aqueous solutions of ammonium sulfate (80.5 %),           to allow us to poke the particles on the hydrophobic sub-
sodium chloride (76.0 %), and potassium carbonate (44.0 %)          strate using a sterilized sharp needle (Jung Rim Medical In-
(Winston and Bates, 1960). The uncertainty of the RH of the         dustrial Co., South Korea). Using a micromanipulator (Nar-
humidified N2 flow was ± 1.5 % RH based on the calibra-             ishige, model MO-152, Japan), the needle was controlled in
tion tests. At the initiation of the bead-mobility and poke-        the x, y, and z directions. The needle was passed through
and-flow experiments, the RH was maintained at ∼ 85 %, and          from the top to the bottom of a particle and then the needle
the particles equilibrated for ∼ 20 min. Then, the RH was re-       was removed. After poking, the geometrical change of a de-
duced to the target RH (∼ 80 % to ∼ 0 % RH) and equili-             posited particle was observed and recorded by an optical mi-
brated for ∼ 30 min for the bead-mobility experiments and           croscope (Olympus CKX53 with 40× objective) with a CCD
for & 2 h for the poke-and-flow experiments to give suffi-          camera (MSC-M 3.0 UCMOS, China). All experiments were
cient time for reaching equilibrium with the surrounding wa-        carried out at 293 ± 1 K.
ter vapor (Grayson et al., 2015, Song et al., 2019; Maclean            Figure S3 in the Supplement shows an example
et al., 2021). At a given RH, particles that were 20–100 µm         of the geometrical changes in the sucrose / H2 O, su-

https://doi.org/10.5194/acp-21-10215-2021                                         Atmos. Chem. Phys., 21, 10215–10228, 2021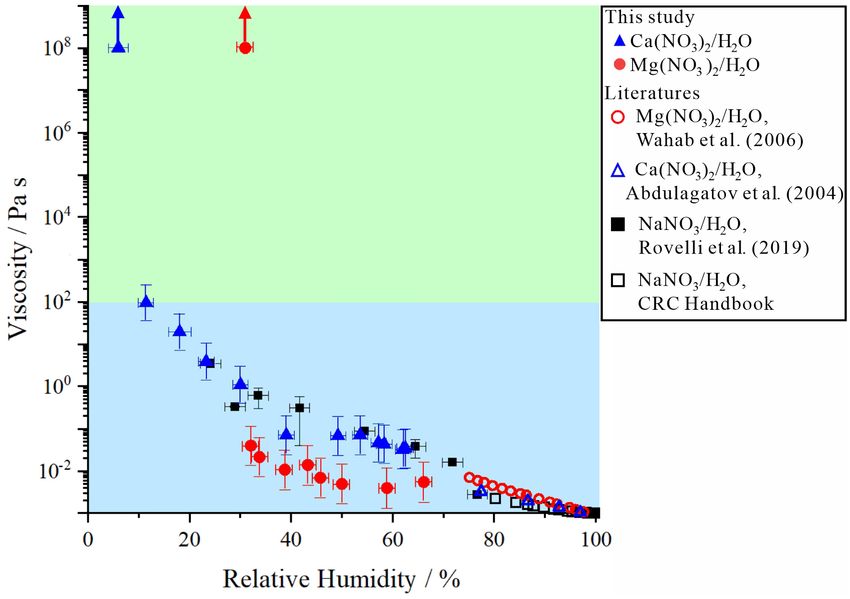
10218                                                         Y.-C. Song et al.: Viscosity and phase state of aerosol particles

crose / Ca(NO3 )2 / H2 O, and sucrose / Mg(NO3 )2 / H2 O           tions as a function of temperature, ion activities, and ionic
particles during pre-poking, poking, and post-poking.              strength. Model parameters for the aqueous ion interac-
Before poking by the needle, the particles had a geometry          tion approach were simultaneously fitted to room tempera-
of a spherical cap. After poking by a needle, a half-torus         ture viscosity measurements aggregated by Laliberté (2007,
geometry with an inner hole in the particle was observed.          2009) for many electrolyte solutions. The training dataset for
As time progressed, the particle recovered by adopting its         AIOMFAC-VISC did not include measurements for the ni-
original geometry by filling of the hole to minimize the           trate salts investigated in this study. For aqueous electrolyte
surface energy. The experimental flow time (τ(exp, flow) ) was     solutions, AIOMFAC-VISC predictions currently achieve an
obtained when the area of the inner hole just after poking         excellent level of accuracy, comparable to that of the fitted
(t = 0 s. Fig. S3) decreased to 1/4 of the initial inner hole      expressions by Laliberté (2007). Furthermore, to more ac-
area (Renbaum-Wolff et al., 2013a; Grayson et al., 2015,           curately capture the water uptake behavior of sucrose as a
2016; Song et al., 2019). Figure S4 in the Supplement shows        function of equilibrium RH (i.e., water activity of the solu-
the τ(exp, flow) at different RH values for sucrose / H2 O,        tion), the version of AIOMFAC-VISC used to produce the
sucrose / Mg(NO3 )2 / H2 O, and sucrose / Ca(NO3 )2 / H2 O         viscosity predictions for the sucrose-containing systems in
particles. The τ(exp, flow) of the particles was converted to      this work includes an improved treatment of the ether-group–
the lower limit to the viscosity using the equation reported       water interactions of sucrose. Thus, viscosity predictions in
in Sellier et al. (2015). Using the poke-and-flow technique,       this study for aqueous sucrose differ slightly from those of
the upper limit to viscosity is unknown in this work. For          the AIOMFAC-web model version.
binary mixtures of inorganic salts / H2 O, we were unable             For the viscosities of ternary mixtures, a Zdanovskii–
to determine the viscosity between 102 to 108 Pa s because         Stokes–Robinson (ZSR) type mixing rule is applied to pre-
the poke-and-flow technique is not accessible for droplets         dict the viscosity of the ternary mixtures of organic mate-
that are supersaturated with respect to a crystalline state of     rial / inorganic salts / H2 O. This mixing rule is here adopted
involved inorganic salts. We also measured the RH value            for viscosity applications since the AIOMFAC-VISC model
and corresponding viscosity at which the particles cracked.        does presently not include explicit ion–organic interaction
When the particles cracked upon poking, without any                effects on viscosity (only on activity coefficients). There-
detectable flow after a duration of > 5 h at a given RH, we        fore, a mixing rule is required to combine the predictions of
defined a lower limit to the viscosity of 1 × 10⁸ Pa s based on    the viscosity contributions from the electrolyte-free subsys-
the results of Renbaum-Wolff et al. (2013a), Grayson et al.        tem (sucrose / H2 O) and those from the organic-free aque-
(2015, 2016), and Song et al. (2019). Further details on these     ous electrolyte subsystem for the viscosity estimation of the
experiments can be found in Sect. S2 of the Supplement.            full mixture. Generally, the ZSR approach involves combin-
                                                                   ing some physical property of two or more (binary) mix-
2.4   AIOMFAC-VISC model                                           tures at the same RH, often to determine the water content
                                                                   of the whole multicomponent mixture (Zdanovskii, 1936,
The Aerosol Inorganic–Organic Mixtures Functional groups           1948; Stokes and Robinson, 1966). Following the experi-
Activity Coefficients Viscosity model (AIOMFAC-VISC) is            mental conditions, the AIOMFAC-VISC predictions for the
a thermodynamics-based group-contribution model for pre-           ternary systems use an OIR of 1 : 1, which constrains at each
dicting the viscosity of aqueous organic mixtures (Gervasi         RH level the fractional contributions of mass (f1 , f2 ) from
et al., 2020). It is an extension module to the AIOMFAC            each of the subsystems, sucrose / H2 O (1) or salt / H2 O (2).
model, which explicitly describes interactions among organic       The viscosity of the overall mixture is then obtained as
                                                                            ◦               ◦              ◦         ◦
functional groups, inorganic ions, and water (Zuend et al.,        ln(η/η ) = f1 ln(η1 /η )+f2 ln(η2 /η ), with η denoting unit
2008, 2011). The AIOMFAC-VISC model offers predic-                 viscosity (1 Pa s); see details in Sect. S5 in the Supplement.
tive estimates of mixture viscosity covering the range from
liquid-like low-viscosity aqueous solutions to highly viscous
organic-rich amorphous solutions in the atmospherically rel-       3     Results and discussion
evant temperature range. An online version of AIOMFAC
(AIOMFAC-web), which includes viscosity predictions for            3.1    Viscosities of particles consisting of sucrose / H2 O
aqueous organic mixtures, can be run at https://aiomfac.lab.
mcgill.ca (last access: 2 July 2021).                              Figure 1 shows the RH-dependent viscosities of su-
   Aside from the focus on the viscosity effects of organic        crose / H2 O particles obtained using the bead-mobility and
compounds, in recent work AIOMFAC-VISC has been fur-               poke-and-flow techniques. The viscosities of sucrose / H2 O
ther developed to enable the prediction of the viscosity of        particles were determined to be between ∼ 2 × 10⁻¹ and
aqueous electrolyte solutions and aqueous inorganic–organic        ∼ 1 × 101 Pa s for RH values of ∼ 85 %–69 % and between
mixtures; with details provided elsewhere (Lilek and Zuend,        ∼ 5 × 10³ and ∼ 2 × 10⁶ Pa s for RH values of ∼ 50 %–37 %
2021). Briefly, a semi-empirical approach was introduced to        (Fig. 1). The particles containing sucrose / H2 O cracked at
predict the mixture viscosity of aqueous electrolyte solu-         ∼ 23 % RH when poked with a needle, and restorative flow

Atmos. Chem. Phys., 21, 10215–10228, 2021                                           https://doi.org/10.5194/acp-21-10215-2021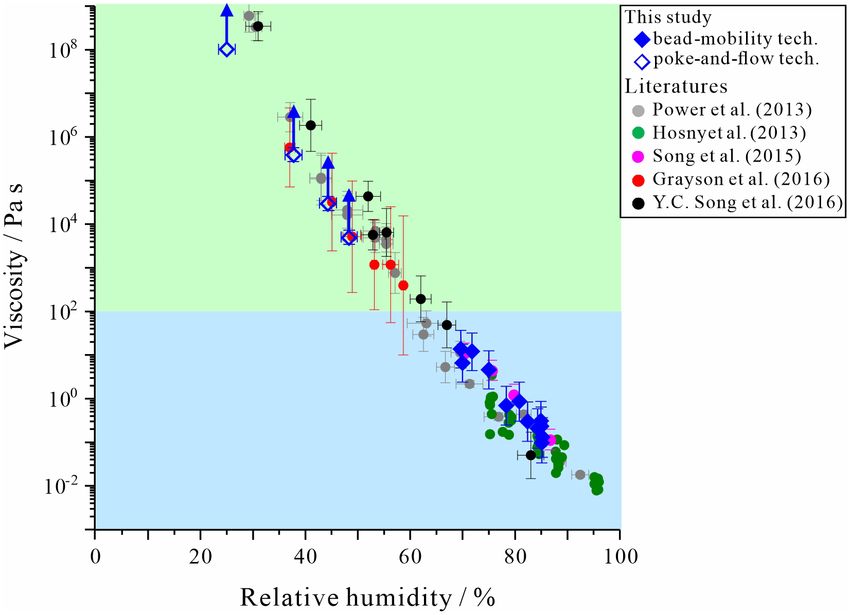
Y.-C. Song et al.: Viscosity and phase state of aerosol particles                                                                10219

                                                                         the RH-dependent viscosity was quantified for particles con-
                                                                         sisting of Mg(NO3 )2 / H2 O or Ca(NO3 )2 / H2 O determined
                                                                         at 293 ± 1 K upon dehydration using the bead-mobility and
                                                                         poke-and-flow techniques.
                                                                            Figure 3 illustrates the RH-dependent viscosities of
                                                                         Mg(NO3 )2 / H2 O or Ca(NO3 )2 / H2 O particles upon dehy-
                                                                         dration. The obtained viscosities of the Mg(NO3 )2 / H2 O
                                                                         particles varied from ∼ 6 × 10⁻³ to ∼ 4 × 10⁻² Pa s for RH
                                                                         values from ∼ 70 % to ∼ 35 %, whereas the values for
                                                                         Ca(NO3 )2 / H2 O ranged from ∼ 3 × 10⁻² to ∼ 9 × 101 Pa s
                                                                         for RH values from ∼ 65 % to ∼ 10 %. Previous stud-
                                                                         ies have reported the viscosities of Ca(NO3 )2 / H2 O and
                                                                         Mg(NO3 )2 / H2 O solutions only at high RH values based
                                                                         on bulk solution measurements (Fig. 3) (Abdulagatov et al.,
                                                                         2004; Wahab et al., 2006). The values of the viscosities of
Figure 1. Measured dynamic viscosities of sucrose / H2 O particles       the particles at high RH are consistent with our results within
compared with previous studies at 293 K (Hosny et al., 2013, fluo-       ∼ 1 order magnitude despite a limited number of data points
rescent lifetime imaging; Power et al., 2013, and Y. C. Song et al.,     due to the solubility limit restricting bulk solution measure-
2016, aerosol optical tweezers; Grayson et al., 2015, and Song et al.,   ments to the RH range above 70 %. In addition, Fig. 3 shows
2015, bead-mobility and poke-and-flow techniques) and this study.        the viscosities of NaNO3 / H2 O particles measured by other
The error bars in relative humidity (RH) were generated from the         groups (Haynes, 2015; Rovelli et al., 2019). The viscosities
calibrated RH uncertainty and the standard deviation from grouped        of the NaNO3 / H2 O particles were similar to those of the
viscosity data (grouped by RH ranges), which included at least three     Ca(NO3 )2 / H2 O particles for the RH range from ∼ 30 % to
data points. The error bars in viscosities were produced by 95 %
                                                                         ∼ 100 %.
prediction bands of viscosities (Fig. S1). Upward arrows represent
lower limit to the viscosities of the particles that calculated by the
                                                                            During       the    poke-and-flow       experiments,     the
experimental flow time and the equation reported in Sellier et al.       Mg(NO3 )2 / H2 O or Ca(NO3 )2 / H2 O particles cracked
(2015). Details are described in Fig. S2. Light blue and green re-       when poked with a needle at RH values of 30 % and 5 %,
gions indicate liquid and semi-solid regions, respectively.              respectively. At these RH levels, noticeable restorative flow
                                                                         did not occur for over 5 h (Fig. 2b and c), which resulted
                                                                         in a lower estimated limit for the viscosity (∼ 108 Pa s) at
did not occur over a time span of 5 h (Fig. 2a). Consequently,           the given RH values. The RH value where the particles
only a lower limit for the viscosity of ∼ 108 Pa s was obtained          shattered is similar to the efflorescence RH (ERH) of
(Renbaum-Wolff et al., 2013a; Grayson et al., 2015, 2016;                Mg(NO3 )2 / H2 O. The ERH of Mg(NO3 )2 / H2 O is known
Song et al., 2015a, 2019). Figure 1 also includes results from           to be ∼ 30 % at 298 K (Li et al., 2008; Wang et al., 2015b)
previous studies for the viscosities of sucrose / H2 O particles         and RH of crystallization for Ca(NO3 )2 / H2 O is reported to
using different techniques such as bead-mobility, poke-and-              be ∼ 7 % at 298 K (Liu et al., 2008). In this study, we opti-
flow, holographic optical tweezers, and fluorescence life-               cally observed an ERH of 32.0 ± 2.5 % for Mg(NO3 )2 / H2 O
time imaging microscopy (Hosny et al., 2013, Power et al.                particles (i.e., Fig. S5b), but we did not optically observe
2013, Grayson et al., 2015, Song et al., 2015; Y. C. Song                the ERH of Ca(NO3 )2 / H2 O at 293 ± 1 K with decreasing
et al., 2016). As shown in Fig. 1, the viscosities for the su-           RH (Fig. S5c). Liu et al. (2008) also observed optically no
crose / H2 O particles from this study and previous studies are          efflorescence point for Ca(NO3 )2 / H2 O particles down to
consistent within ∼ 1 order of magnitude at given RH values.             0 % RH using an optical microscope, but they confirmed the
Using the entire dataset, it suggests that the sucrose / H2 O            crystallization for Ca(NO3 )2 / H2 O particles at RH of ∼ 7 %
particle are in a liquid phase state for RH &65 %, in a semi-            by Raman spectroscopy at 298 K. The RH values at which
solid phase state for ∼ 25 % < RH . 65 %, and in a semi-                 shattering of particles occurred for the binary inorganic
solid or solid phase state for RH . 23 %.                                salt particles of Mg(NO3 )2 / H2 O or Ca(NO3 )2 / H2 O
                                                                         were close to their reported ERH values and/or the RH of
3.2   Viscosities of particles consisting of                             crystallization. When comparing the two inorganic salts,
      Mg(NO3 )2 / H2 O or Ca(NO3 )2 / H2 O                               Ca(NO3 )2 / H2 O particles showed slightly higher viscosities
                                                                         than the Mg(NO3 )2 / H2 O particles, i.e., approximately 1
Despite the abundant mass of inorganic species in the atmo-              order of magnitude higher at equivalent RH for the RH
sphere (Jimenez et al., 2009; Cheng et al., 2016), few studies           range from ∼ 60 % to 30 % (Fig. 3). The difference in
have reported the viscosity of single particles consisting of            viscosities is likely due to the higher hygroscopicity of
inorganic species covering the RH range to high salt con-                dissolved Mg(NO3 )2 compared to Ca(NO3 )2 (Guo et al.,
centrations (Power et al., 2013; Rovelli et al., 2019). Herein,          2019). The Ca(NO3 )2 / H2 O particles were a liquid phase

https://doi.org/10.5194/acp-21-10215-2021                                              Atmos. Chem. Phys., 21, 10215–10228, 2021
10220 Y.-C. Song et al.: Viscosity and phase state of aerosol particles
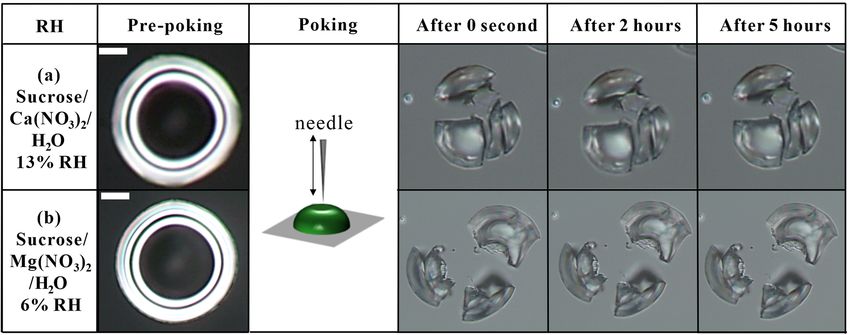
Figure 2. Optical images during poke-and-flow experiments at the points of pre-poking, poking, and post-poking for particles consisting of
(a) sucrose / H2 O, (b) Mg(NO3 )2 / H2 O, and (c) Ca(NO3 )2 / H2 O for relative humidity (RH) where the particles shattered. The scale bar is
5 µm.
state at RH & 10 % and a semi-solid or solid phase state at
RH . 5 %. The Mg(NO3 )2 / H2 O particles were a liquid
phase state at RH & 35 % and a semi-solid or solid phase
state at RH . 30 %. Based on the viscosity measurement,
both inorganic particles underwent a phase change from
liquid (< 102 Pa s) to semi-solid or solid (> 102 Pa s ) within
a narrow RH range (Fig. 3) compared to the sucrose / H2 O
particles (Fig. 1). Indeed, this discontinuity in viscosity with
decreasing RH suggests a phase transition.
3.3 Viscosities of particles consisting of
sucrose / Ca(NO3 )2 / H2 O or
sucrose / Mg(NO3 )2 / H2 O
To explore the viscosity of more atmospherically relevant
aerosol particle configurations, we investigated ternary sys-
tems containing sucrose mixed with either Ca(NO3 )2 or
Mg(NO3 )2 for OIR of 1 : 1 at 293 ± 1 K. Shown in Fig. 4
Figure 3. Viscosities of inorganic salts containing Ca(NO3 )2 / H2 O are the viscosities for the sucrose / Ca(NO3 )2 / H2 O (Fig. 4a)
and Mg(NO3 )2 / H2 O, as well as previous results (Abdulagatov and sucrose / Mg(NO3 )2 / H2 O particles (Fig. 4c) upon de-
et al., 2004; Wahab et al., 2006; Haynes, 2015; bulk measurements) hydration using the bead-mobility and the poke-and-flow
and this study. Also, viscosities of NaNO3 / H2 O from previous measurement techniques.
studies are included (CRC Handbook; Rovelli et al., 2019, aerosol The viscosities of the sucrose / Ca(NO3 )2 / H2 O
optical tweezers). Upward arrows represent a lower limit for the
particles ranged from ∼ 3 × 101 to ∼ 3 × 10⁻² Pa s at
viscosities of the particles calculated by the experimental flow time
∼ 45 < RH . 80 % and from ∼ 9 × 10⁵ to ∼ 3 × 10⁴ Pa s at
and the equation reported in Sellier et al. (2015). The error bars in
relative humidity (RH) were generated from combined RH sensor ∼ 25 < RH . 30 % (Fig. 4a). At ∼ 13 % RH, when poked
uncertainty and the standard deviation from the grouped viscosity with a needle, the sucrose / Ca(NO3 )2 / H2 O particles
data by RH, which included at least three data points. The error cracked. Thereafter, the particles did not exhibit any notable
bars in viscosities were produced by 95 % prediction bands of vis- flow behavior for over 5 h (Fig. 5a), producing a lower
cosities (Fig. S1). Light blue region indicates a liquid phase, and limit for the viscosity of ∼ 108 Pa s. This result indicates
light green region indicates a semi-solid phase. that the sucrose / Ca(NO3 )2 / H2 O particles were in a
liquid phase state at RH & 45 %, in a semi-solid state at
∼ 25 % < RH . 30 %, and in a semi-solid or solid state for
RH . 13 %.
Atmos. Chem. Phys., 21, 10215–10228, 2021 https://doi.org/10.5194/acp-21-10215-2021Y.-C. Song et al.: Viscosity and phase state of aerosol particles 10221 Figure 4. Comparison of viscosities of binary and ternary systems obtained from the bead-mobility and poke-and-flow experiments. (a) Mean viscosities of sucrose / H2 O, Ca(NO3 )2 / H2 O, and sucrose / Ca(NO3 )2 / H2 O particles with polynomial fits from measured viscosities for an organic-to-inorganic mass ratio (OIR) of 1 : 1. All data at a temperature of 293 ± 1 K, (b) Mean viscosities of sucrose / H2 O, Ca(NO3 )2 / H2 O (grouped by relative humidity (RH) using data from Fig. 3), and sucrose / Ca(NO3 )2 / H2 O particles with AIOMFAC- VISC model predictions, (c) mean viscosities of sucrose / H2 O, Mg(NO3 )2 / H2 O (grouped by RH using data from Fig. 3), and su- crose / Mg(NO3 )2 / H2 O particles with polynomial fits from measured viscosities for an OIR of 1 : 1, (d) mean viscosities of sucrose / H2 O, Mg(NO3 )2 / H2 O, and sucrose / Mg(NO3 )2 / H2 O particles with AIOMFAC-VISC model predictions. The error bars in RH were generated from the RH uncertainty and the standard deviation of individual data grouped by RH. The error bars in viscosity represent grouped viscosity by RH including at least three data points. Symbols marked with upward arrows represent lower limits of the viscosities of the particles calculated based on the experimental flow time period and the equation reported in Sellier et al. (2015). Fitting (solid line curves and shaded areas) from measured viscosities are based on second-order polynomial curve fits with 95 % confidence bands. Predictions (dash line curves with checker shaded areas) are based on from AIOMFAC-VISC model. The parameterizations are described in Sect. S3 and Table S1 in the Supplement. Light blue and green regions represent liquid and semi-solid phase state ranges, respectively. For sucrose / Mg(NO3 )2 / H2 O particles, the viscosities order of magnitude lower at 50 % RH and ∼ 6 orders of mag- ranged from ∼ 7 × 10⁻² to ∼ 1 × 101 Pa s for RH values nitude lower at 35 % RH than the sucrose / Ca(NO3 )2 / H2 O ranging from ∼ 70 % to ∼ 35 % and from ∼ 2 × 10⁴ to particles over the same RH range. Both particles experienced ∼ 2 × 10⁵ Pa s for the RH ranging from ∼ 17 % to ∼ 11 % a phase state change from a liquid phase state to a semi- (Fig. 4c). The sucrose / Ca(NO3 )2 / H2 O particles cracked at solid or even solid phase state with decreasing RH. Finally, ∼ 6 % RH without flow over 5 h (Fig. 5b); and thus the lower although not confirmed by our measurements, it is possible limit of the viscosity was determined to be ∼ 108 Pa s. These that in one or both of these ternary mixtures a gel phase tran- results imply that the sucrose / Ca(NO3 )2 / H2 O particles are sition may occur upon sufficient dehydration, as has been in a liquid phase state at RH & 35 %, a semi-solid phase state observed in mixtures of gluconic acid with CaCl2 (Richards for 17 % < RH < 11 %, and a semi-solid or solid phase state et al., 2020a, b). at RH . 6 %. As shown in Fig. 4a and c, the viscosities of the sucrose / Mg(NO3 )2 / H2 O particles are approximately 1 https://doi.org/10.5194/acp-21-10215-2021 Atmos. Chem. Phys., 21, 10215–10228, 2021
10222                                                               Y.-C. Song et al.: Viscosity and phase state of aerosol particles

Figure 5. Optical images during poke-and-flow experiments at the points of pre-poking, poking, and post-poking for particles consisting of
(a) sucrose / Ca(NO3 )2 / H2 O particles and (b) sucrose / Mg(NO3 )2 / H2 O particles for relative humidity (RH) where the particles shattered.
The scale bar indicates 5 µm.

3.4   Model–measurement comparison of viscosity                           sucrose / Mg(NO3 )2 / H2 O solutions, AIOMFAC-VISC vis-
                                                                          cosity predictions show agreement with the measurements
Figure 4b and d show the model–measurement comparison                     within about 1 order of magnitude from high RH to about
of the RH-dependent viscosities of the binary and ternary                 30 % RH (considering measurement uncertainty). In the case
systems. For the viscosities of sucrose / H2 O, the viscosities           of the ternary sucrose / Ca(NO3 )2 / H2 O system, the model–
from the AIOMFAC-VISC model prediction agreed with the                    measurement deviation increases to about 1.5 orders of mag-
measurements within ∼ 1 order of magnitude. For the vis-                  nitude in viscosity at 30 % RH and lower, with AIOMFAC-
cosities of Ca(NO3 )2 / H2 O and Mg(NO3 )2 / H2 O, the vis-               VISC underestimating the measured viscosity. This result
cosity prediction from the AIOMFAC-VISC model showed                      may be explained at least in part by the model predicting sub-
a good agreement until the measured inorganic salt vis-                   stantially lower viscosities for the binary aqueous Ca(NO3 )2
cosities change steeply, indicating crystallization or another            system in this lower RH range, which affects the predic-
phase transition that the model ignores. When comparing                   tions for the ternary system via the deployed mixing rule.
AIOMFAC-VISC viscosity predictions to the measurements                    The good agreement between model and measurements for
in this study, note that AIOMFAC-VISC assumes that mix-                   the ternary sucrose / Mg(NO3 )2 / H2 O system, even at low
tures remain in a metastable state to low water activity (or              RH levels, may be interpreted as indicative of suppressed salt
high solution concentration) and that solutes do not crystal-             crystallization in the presence of sucrose, since no disconti-
lize, which may explain the discrepancy among the model                   nuities in viscosity are observed (in contrast to the measure-
predictions and the measurements in the low RH region                     ments for the binary salt particles).
shown in Fig. 4b and d. Moreover, we note that the training
of the AIOMFAC-VISC electrolyte solution model parame-
ters did not include data from this study. The model predic-              4   Conclusion and atmospheric implications
tions at RH levels below ∼ 20 % represent extrapolations of
the model beyond the range of experimental data used in its               Herein, we measured the RH-dependent viscosities at
training.                                                                 293 ± 1 K for particles consisting of organic material / H2 O,
   In AIOMFAC-VISC, the prediction of the temperature-                    inorganic salt / H2 O, and organic material / inorganic
dependent pure-component viscosity is based on the exper-                 salt / H2 O upon dehydration using the bead-mobility and
imentally determined, yet uncertain, glass transition RH. As              poke-and-flow techniques. We selected sucrose as the
such, we include error thresholds of ± 5 % in the pure-                   organic species as previous studies have frequently applied
component glass transition RH in Fig. 4 (Gervasi et al.,                  it as a surrogate species of SOA, and this organic offers
2020). Such uncertainty estimates are not necessary for aque-             favorable properties for measurements. Ca(NO3 )2 and
ous electrolyte mixtures, so the AIOMFAC-VISC model sen-                  Mg(NO3 )2 were selected as the inorganic salts for viscosity
sitivity is shown instead, which is defined as the viscos-                measurements as these inorganic salts have been frequently
ity change due to a ± 2 % change in the mass fraction of                  observed from mineral dust and sea salt particles (Usher
water of the solution, while the ratio of the other compo-                et al., 2003; Laskin et al., 2005; Sullivan et al., 2007). For the
nents is preserved (Gervasi et al., 2020). The uncertainty                binary mixtures, the obtained viscosity of the sucrose / H2 O
in the aqueous sucrose viscosity dominates the modeled                    particles agreed well with those reported in previous studies,
uncertainty of viscosity estimates for the ternary mixtures.              i.e., mixture viscosities < 102 Pa s at RH & 65 %, which
For the viscosities of ternary sucrose / Ca(NO3 )2 / H2 O or              corresponds to a liquid phase state; mixture viscosities of

Atmos. Chem. Phys., 21, 10215–10228, 2021                                                   https://doi.org/10.5194/acp-21-10215-2021
Y.-C. Song et al.: Viscosity and phase state of aerosol particles 10223
∼ 102 to 108 Pa s at RH values between ∼ 65 % and ∼ 25 %, equilibration of semivolatile organics and inorganics. Added
which correspond to a semi-solid phase state; and mixture complexity in particle morphology, such as phase separation,
viscosities &108 Pa s at RH . 25 %, which correspond to can also influence the equilibration timescale (e.g., Huang
semi-solid or amorphous (or crystalline) solid phase states et al., 2021); however, our systems did not exhibit phase sep-
(Power et al., 2013; Grayson et al., 2017; Y. C. Song et al., aration for the studied mixing ratios. Additional investiga-
2016; Rothfuss and Petters, 2017; Rovelli et al., 2019). tions are required to further explore and quantify how the
Upon dehydration, we also quantified the viscosities of the viscosities and phase states of mixed organic–inorganic par-
inorganic salts. The viscosities of the Mg(NO3 )2 / H2 O ticles vary with the OIR, temperature, and functional group
particles were . 4 × 10⁻² Pa s for RH & 35 % and & 108 Pa s complexity.
for RH . 31 %, whereas those of the Ca(NO3 )2 / H2 O
particles were . 9 × 100 Pa s for RH & 10 % and & 108 Pa s
for RH . 10 %. The particles containing either of these two Data availability. Underlying material and related data for this pa-
inorganic salts cracked upon poking when the RH reached per are provided in the Supplement.
a value near the salt’s ERH and/or the phase transition
RH from a droplet to a solid phase state. These inorganic
particles exhibited a sudden enhancement in the viscosity Supplement. The supplement related to this article is available on-
when the particle effloresced. In contrast, sucrose / H2 O line at: https://doi.org/10.5194/acp-21-10215-2021-supplement.
particles showed a smooth enhancement in the viscos-
ity with decreasing RH; this means that the viscosity of
Author contributions. MS and YCS designed this study. MS and
sucrose / H2 O particles gradually approached their glass
JBL setup and calibrated the viscosity instrument. YCS and MS
transition RH. The AIOMFAC-VISC model prediction and
conducted viscosity experiments and analyzed the data. JL and AZ
viscosity measurements showed a good agreement within conducted AIOMFAC-VISC model predictions. YCS and MS pre-
∼ 1 order of magnitude, especially at RH levels above 30 %, pared the article with contributions from JL, JBL, AZ, ZJ, and
where applicable. For sucrose / Ca(NO3 )2 / H2 O particles MNC.
and sucrose / Mg(NO3 )2 / H2 O, predicted and measured
viscosities showed good agreement over the whole RH
range. Competing interests. The authors declare that they have no conflict
The phase states of aerosol particles have an impact on rate of interest.
and potential for heterogeneous reactions as well as conse-
quences for the resulting mass concentration of aerosol par-
ticles. The uptake coefficient of gas-phase oxidants depends Disclaimer. Publisher’s note: Copernicus Publications remains
on the phase states of aerosol particles (George and Abbatt, neutral with regard to jurisdictional claims in published maps and
2010; Xiao and Bertram, 2011; Kuwata and Martin, 2012; institutional affiliations.
Slade and Knopf, 2014; Davies and Wilson, 2015; Berke-
meier et al., 2016; Li et al., 2020; Xu et al., 2020). For ex-
ample, ozone uptake coefficients (γ O3 ) decreased by an or- Acknowledgements. Mijung Song gives thanks to Dongwan Ham
for the technical support.
der of magnitude in a semi-solid phase state compared to a
liquid phase state (Steimer et al., 2015). Moreover, the ef-
fective mass concentration of aerosol particles can depend
Financial support. This work was supported by the National Re-
on the (assumed or modeled) phase state of aerosol parti- search Foundation of Korea (NRF) grant funded by the Korean
cles (Shiraiwa and Seinfeld, 2012; Yli-Juuti et al., 2017; Kim government (MSIT) (grant no. NRF-2019R1A2C1086187) and by
et al., 2019). If a liquid aerosol phase state is assumed, the the Fine Particle Research Initiative in East Asia Considering Na-
mass concentration may be overpredicted by up to 1 order of tional Differences (FRIEND) project (2020M3G1A1114548). This
magnitude (Shiraiwa and Seinfeld, 2012). Based on the mea- project was undertaken with the financial support of the govern-
surements and calculations, our results show that the studied ment of Canada through the federal Department of Environment
aerosol particles consisting of organic material / inorganic and Climate Change (grant no. GCXE20S049). This work was also
salt / H2 O range from liquid to semi-solid or solid phase supported by Alfred P. Sloan Foundation under Prime Award no.
states depending on the RH. A caveat is that a single OIR of G-2020-13912 and the Regents of the University of California.
1 : 1 and relatively simple aerosol systems were used com-
pared to the multicomponent, multiphase particles likely oc-
curring in the real atmosphere (Murphy et al., 2006; Jimenez Review statement. This paper was edited by Daniel Knopf and re-
viewed by two anonymous referees.
et al., 2009; Song et al., 2010, 2013; Huang et al., 2015;
Cheng et al., 2016). Further studies are needed to confirm the
equilibrating timescales of mixed organic–inorganic parti-
cles under ambient conditions, including the timescale for the
https://doi.org/10.5194/acp-21-10215-2021 Atmos. Chem. Phys., 21, 10215–10228, 202110224 Y.-C. Song et al.: Viscosity and phase state of aerosol particles
References ous organic aerosol, Atmos. Chem. Phys., 20, 2987–3008,
https://doi.org/10.5194/acp-20-2987-2020, 2020.
Grayson, J. W., Song, M., Sellier, M., and Bertram, A. K.: Vali-
Abdulagatov, I. M., Zeinalova, A. A., and Azizov, N. D.: Viscosity dation of the poke-flow technique combined with simulations of
of the aqueous Ca(NO3 )2 solutions at temperatures from 298 to fluid flow for determining viscosities in samples with small vol-
573 K and at pressures up to 40 MPa, J. Chem. Eng. Data, 49, umes and high viscosities, Atmos. Meas. Tech., 8, 2463–2472,
1444–1450, https://doi.org/10.1021/je049853n, 2004. https://doi.org/10.5194/amt-8-2463-2015, 2015.
Athanasiadis, A., Fitzgerald, C., Davidson, N. M., Giorio, C., Grayson, J. W., Zhang, Y., Mutzel, A., Renbaum-Wolff, L., Böge,
Botchway, S. W., Ward, A. D., Kalberer, M., Pope, F. D., and O., Kamal, S., Herrmann, H., Martin, S. T., and Bertram, A.
Kuimova, M. K.: Dynamic viscosity mapping of the oxidation of K.: Effect of varying experimental conditions on the viscos-
squalene aerosol particles, Phys. Chem. Chem. Phys., 18, 30385– ity of α-pinene derived secondary organic material, Atmos.
30393, https://doi.org/10.1039/C6CP05674A, 2016. Chem. Phys., 16, 6027–6040, https://doi.org/10.5194/acp-16-
Bateman, A. P., Bertram, A. K., and Martin, S. T.: Hygro- 6027-2016, 2016.
scopic influence on the semisolid-to-liquid transition of sec- Grayson, J. W., Evoy, E., Song, M., Chu, Y., Maclean, A., Nguyen,
ondary organic materials, J. Phys. Chem. A, 119, 4386–4395, A., Upshur, M. A., Ebrahimi, M., Chan, C. K., Geiger, F. M.,
https://doi.org/10.1021/jp508521c, 2015. Thomson, R. J., and Bertram, A. K.: The effect of hydroxyl func-
Bateman, A. P., Gong, Z., Harder, T. H., de Sá, S. S., Wang, B., tional groups and molar mass on the viscosity of non-crystalline
Castillo, P., China, S., Liu, Y., O’Brien, R. E., Palm, B. B., Shiu, organic and organic–water particles, Atmos. Chem. Phys., 17,
H.-W., Cirino, G. G., Thalman, R., Adachi, K., Alexander, M. 8509–8524, https://doi.org/10.5194/acp-17-8509-2017, 2017.
L., Artaxo, P., Bertram, A. K., Buseck, P. R., Gilles, M. K., Guo, L., Gu, W., Peng, C., Wang, W., Li, Y. J., Zong, T., Tang,
Jimenez, J. L., Laskin, A., Manzi, A. O., Sedlacek, A., Souza, Y., Wu, Z., Lin, Q., Ge, M., Zhang, G., Hu, M., Bi, X., Wang,
R. A. F., Wang, J., Zaveri, R., and Martin, S. T.: Anthropogenic X., and Tang, M.: A comprehensive study of hygroscopic prop-
influences on the physical state of submicron particulate mat- erties of calcium- and magnesium-containing salts: implication
ter over a tropical forest, Atmos. Chem. Phys., 17, 1759–1773, for hygroscopicity of mineral dust and sea salt aerosols, At-
https://doi.org/10.5194/acp-17-1759-2017, 2017. mos. Chem. Phys., 19, 2115–2133, https://doi.org/10.5194/acp-
Berkemeier, T., Steimer, S. S., Krieger, U. K., Peter, T., Pöschl, 19-2115-2019, 2019.
U., Ammann, M., and Shiraiwa, M.: Ozone uptake on glassy, Gupta, D., Eom, H.-J., Cho, H.-R., and Ro, C.-U.: Hygroscopic
semi-solid and liquid organic matter and the role of reactive oxy- behavior of NaCl–MgCl2 mixture particles as nascent sea-
gen intermediates in atmospheric aerosol chemistry, Phys. Chem. spray aerosol surrogates and observation of efflorescence dur-
Chem. Phys., 18, 12662–12674, 2016. ing humidification, Atmos. Chem. Phys., 15, 11273–11290,
Bertram, A. K., Martin, S. T., Hanna, S. J., Smith, M. L., https://doi.org/10.5194/acp-15-11273-2015, 2015.
Bodsworth, A., Chen, Q., Kuwata, M., Liu, A., You, Y., and Ham, S., Babar, Z. B., Lee, J. B., Lim, H.-J., and Song, M.: Liquid–
Zorn, S. R.: Predicting the relative humidities of liquid-liquid liquid phase separation in secondary organic aerosol particles
phase separation, efflorescence, and deliquescence of mixed par- produced from α-pinene ozonolysis and α-pinene photooxida-
ticles of ammonium sulfate, organic material, and water using the tion with/without ammonia, Atmos. Chem. Phys., 19, 9321–
organic-to-sulfate mass ratio of the particle and the oxygen-to- 9331, https://doi.org/10.5194/acp-19-9321-2019, 2019.
carbon elemental ratio of the organic component, Atmos. Chem. Hao, L. Q., Kortelainen, A., Romakkaniemi, S., Portin, H., Jaatinen,
Phys., 11, 10995–11006, https://doi.org/10.5194/acp-11-10995- A., Leskinen, A., Komppula, M., Miettinen, P., Sueper, D., Pa-
2011, 2011. junoja, A., Smith, J. N., Lehtinen, K. E. J., Worsnop, D. R., Laak-
Bhattarai, G., Lee, J. B., Kim, M. H., Ham, S., So, H. S., Oh, S., sonen, A., and Virtanen, A.: Atmospheric submicron aerosol
Sim, H. J., Lee, J. C., Song, M., and Kook, S. H.: Maternal expo- composition and particulate organic nitrate formation in a boreal
sure to fine particulate matter during pregnancy induces progres- forestland–urban mixed region, Atmos. Chem. Phys., 14, 13483–
sive senescence of hematopoietic stem cells under preferential 13495, https://doi.org/10.5194/acp-14-13483-2014, 2014.
30 impairment of the bone marrow microenvironment and aids Haynes, W. M.: CRC handbook of chemistry and physics, 97rd edn.,
development of myeloproliferative disease, Leukemia 34, 1481– CRC Press, New York, 2015.
1484, https://doi.org/10.1038/s41375-019-0665-8, 2020 Hinks, M. L., Brady, M. V, Lignell, H., Song, M., Grayson, J. W.,
Cheng, Z., Luo, L., Wang, S., Wang, Y., Sharma, S., Shimadera, H., Bertram, A. K., Lin, P., Laskin, A., Laskin, J., and Nizkorodov,
Wang, X., Bressi, M., de Miranda, R. M., Jiang, J., Zhou, W., S. A.: Effect of viscosity on photodegradation rates in complex
Fajardo, O., Yan, N., and Hao, J.: Status and characteristics of secondary organic aerosol materials, Phys. Chem. Chem. Phys.,
ambient PM2.5 pollution in global megacities, Environ. Int., 89– 18, 8785–8793, https://doi.org/10.1039/c5cp05226b, 2016.
90, 212–221, https://doi.org/10.1016/j.envint.2016.02.003, 2016. Hosny, N. A., Fitzgerald, C., Tong, C., Kalberer, M., Kuimova, M.
Davies, J. F. and Wilson, K. R.: Nanoscale interfacial gra- K., and Pope, F. D.: Fluorescent lifetime imaging of atmospheric
dients formed by the reactive uptake of OH radicals aerosols: a direct probe of aerosol viscosity, Faraday Discuss.,
onto viscous aerosol surfaces, Chem. Sci., 6, 7020–7027, 165, 343–356, https://doi.org/10.1039/C3FD00041A, 2013.
https://doi.org/10.1039/C5SC02326B, 2015. Hosny, N. A., Fitzgerald, C., Vysniauskas, A., Athanasiadis,
George, I. J. and Abbatt, J. P. D.: Heterogeneous oxidation of at- T., Berkemeier, T., Uygur, N., Pöschl, U., Shiraiwa, M.,
mospheric aerosol particles by gas-phase radicals, Nat. Chem., Kalberer, M., Pope, F. D., and Kuimova, M. K.: Direct
2, 713–722, 2010. imaging of changes in aerosol particle viscosity upon hy-
Gervasi, N. R., Topping, D. O., and Zuend, A.: A predic-
tive group-contribution model for the viscosity of aque-
Atmos. Chem. Phys., 21, 10215–10228, 2021 https://doi.org/10.5194/acp-21-10215-2021Y.-C. Song et al.: Viscosity and phase state of aerosol particles 10225
dration and chemical aging, Chem. Sci., 7, 1357–1367, Kidd, C., Perraud, V., Wingen, L. M., and Finlayson-Pitts, B. J.:
https://doi.org/10.1039/C5SC02959G, 2016. Integrating phase and composition of secondary organic aerosol
Huang, R. J., Zhang, Y., Bozzetti, C., Ho, K. F., Cao, J. J., Han, Y., from the ozonolysis of α-pinene, P. Natl. Acad. Sci. USA, 111,
Daellenbach, K. R., Slowik, J. G., Platt, S. M., Canonaco, F., Zot- 7552–7, https://doi.org/10.1073/pnas.1322558111, 2014.
ter, P., Wolf, R., Pieber, S. M., Bruns, E. A., Crippa, M., Ciarelli, Kim, Y., Sartelet, K., and Couvidat, F.: Modeling the effect of non-
G., Piazzalunga, A., Schwikowski, M., Abbaszade, G., Schnelle- ideality, dynamic mass transfer and viscosity on SOA formation
Kreis, J., Zimmermann, R., An, Z., Szidat, S., Baltensperger, U., in a 3-D air quality model, Atmos. Chem. Phys., 19, 1241–1261,
El Haddad, I., and Prévôt, A. S. H.: High secondary aerosol con- https://doi.org/10.5194/acp-19-1241-2019, 2019.
tribution to particulate pollution during haze events in China, Na- Knopf, D. A., Alpert, P., and Wang, B.: The role
ture, 514, 218–222, https://doi.org/10.1038/nature13774, 2015. of organic aerosol in atmospheric ice nucleation –
Huang, Y., Mahrt, F., Xu, S., Shiraiwa, M., Zuend, A., and Bertram, A Review, ACS Earth Sp. Chem., 2, 168–202,
A. K.: Coexistence of three liquid phases in individual at- https://doi.org/10.1021/acsearthspacechem.7b00120, 2018.
mospheric aerosol particles, P. Natl. Acad. Sci. USA, 118, Koop, T., Bookhold, J., Shiraiwa, M., and Pöschl, U.: Glass tran-
e2102512118, https://doi.org/10.1073/pnas.2102512118, 2021. sition and phase state of organic compounds: dependency on
Ji, Z. R., Zhang, Y., Pang, S. F., and Zhang, Y. H.: Crystal nucle- molecular properties and implications for secondary organic
ation and crystal growth and mass transfer in internally mixed aerosols in the atmosphere, Phys. Chem. Chem. Phys., 13,
sucrose/NaNO3 particles, J. Phys. Chem. A, 121, 7968–7975, 19238–19255, https://doi.org/10.1039/c1cp22617g, 2011.
https://doi.org/10.1021/acs.jpca.7b08004, 2017. Kulmala, M., Asmi, A., Lappalainen, H. K., Baltensperger, U.,
Jimenez, J. L., Canagaratna, M. R., Donahue, N. M., Prevot, a. S. Brenguier, J.-L., Facchini, M. C., Hansson, H.-C., Hov, Ø.,
H., Zhang, Q., Kroll, J. H., DeCarlo, P. F., Allan, J. D., Coe, H., O’Dowd, C. D., Pöschl, U., Wiedensohler, A., Boers, R.,
Ng, N. L., Aiken, a. C., Docherty, K. S., Ulbrich, I. M., Grieshop, Boucher, O., de Leeuw, G., Denier van der Gon, H. A. C., Fe-
A. P., Robinson, a. L., Duplissy, J., Smith, J. D., Wilson, K. R., ichter, J., Krejci, R., Laj, P., Lihavainen, H., Lohmann, U., Mc-
Lanz, V. a., Hueglin, C., Sun, Y. L., Tian, J., Laaksonen, A., Figgans, G., Mentel, T., Pilinis, C., Riipinen, I., Schulz, M.,
Raatikainen, T., Rautiainen, J., Vaattovaara, P., Ehn, M., Kul- Stohl, A., Swietlicki, E., Vignati, E., Alves, C., Amann, M.,
mala, M., Tomlinson, J. M., Collins, D. R., Cubison, M. J., Dun- Ammann, M., Arabas, S., Artaxo, P., Baars, H., Beddows, D.
lea, J., Huffman, J. A., Onasch, T. B., Alfarra, M. R., Williams, P. C. S., Bergström, R., Beukes, J. P., Bilde, M., Burkhart, J. F.,
I., Bower, K., Kondo, Y., Schneider, J., Drewnick, F., Borrmann, Canonaco, F., Clegg, S. L., Coe, H., Crumeyrolle, S., D’Anna,
S., Weimer, S., Demerjian, K., Salcedo, D., Cottrell, L., Grif- B., Decesari, S., Gilardoni, S., Fischer, M., Fjaeraa, A. M., Foun-
fin, R., Takami, a., Miyoshi, T., Hatakeyama, S., Shimono, A., toukis, C., George, C., Gomes, L., Halloran, P., Hamburger, T.,
Sun, J. Y., Zhang, Y. M., Dzepina, K., Kimmel, J. R., Sueper, D., Harrison, R. M., Herrmann, H., Hoffmann, T., Hoose, C., Hu,
Jayne, J. T., Herndon, S. C., Trimborn, a. M., Williams, L. R., M., Hyvärinen, A., Hõrrak, U., Iinuma, Y., Iversen, T., Josipovic,
Wood, E. C., Middlebrook, A. M., Kolb, C. E., Baltensperger, U., M., Kanakidou, M., Kiendler-Scharr, A., Kirkevåg, A., Kiss, G.,
Worsnop, D. R., Dunlea, E. J., Huffman, J. A., Onasch, T. B., Al- Klimont, Z., Kolmonen, P., Komppula, M., Kristjánsson, J.-E.,
farra, M. R., Williams, P. I., Bower, K., Kondo, Y., Schneider, J., Laakso, L., Laaksonen, A., Labonnote, L., Lanz, V. A., Lehti-
Drewnick, F., Borrmann, S., Weimer, S., Demerjian, K., Salcedo, nen, K. E. J., Rizzo, L. V., Makkonen, R., Manninen, H. E.,
D., Cottrell, L., Griffin, R., Takami, a., Miyoshi, T., Hatakeyama, McMeeking, G., Merikanto, J., Minikin, A., Mirme, S., Morgan,
S., Shimono, A., Sun, J. Y., Zhang, Y. M., Dzepina, K., Kim- W. T., Nemitz, E., O’Donnell, D., Panwar, T. S., Pawlowska, H.,
mel, J. R., Sueper, D., Jayne, J. T., Herndon, S. C., Trimborn, Petzold, A., Pienaar, J. J., Pio, C., Plass-Duelmer, C., Prévôt,
a. M., Williams, L. R., Wood, E. C., Middlebrook, A. M., Kolb, A. S. H., Pryor, S., Reddington, C. L., Roberts, G., Rosen-
C. E., Baltensperger, U., Worsnop, D. R., Dunlea, J., Huffman, feld, D., Schwarz, J., Seland, Ø., Sellegri, K., Shen, X. J., Shi-
J. A., Onasch, T. B., Alfarra, M. R., Williams, P. I., Bower, K., raiwa, M., Siebert, H., Sierau, B., Simpson, D., Sun, J. Y.,
Kondo, Y., Schneider, J., Drewnick, F., Borrmann, S., Weimer, Topping, D., Tunved, P., Vaattovaara, P., Vakkari, V., Veefkind,
S., Demerjian, K., Salcedo, D., Cottrell, L., Griffin, R., Takami, J. P., Visschedijk, A., Vuollekoski, H., Vuolo, R., Wehner, B.,
A., Miyoshi, T., Hatakeyama, S., Shimono, A., Sun, J. Y., Zhang, Wildt, J., Woodward, S., Worsnop, D. R., van Zadelhoff, G.-
Y. M., Dzepina, K., Kimmel, J. R., Sueper, D., Jayne, J. T., Hern- J., Zardini, A. A., Zhang, K., van Zyl, P. G., Kerminen, V.-
don, S. C., Trimborn, A. M., Williams, L. R., Wood, E. C., Mid- M., S Carslaw, K., and Pandis, S. N.: General overview: Euro-
dlebrook, A. M., Kolb, C. E., Baltensperger, U., and Worsnop, pean Integrated project on Aerosol Cloud Climate and Air Qual-
D. R.: Evolution of organic aerosols in the atmosphere, Science, ity interactions (EUCAARI) – integrating aerosol research from
326, 1525–1529, https://doi.org/10.1126/science.1180353, 2009. nano to global scales, Atmos. Chem. Phys., 11, 13061–13143,
Kanakidou, M., Seinfeld, J. H., Pandis, S. N., Barnes, I., Dentener, https://doi.org/10.5194/acp-11-13061-2011, 2011.
F. J., Facchini, M. C., Van Dingenen, R., Ervens, B., Nenes, A., Kuwata, M. and Martin, S. T.: Phase of atmospheric secondary or-
Nielsen, C. J., Swietlicki, E., Putaud, J. P., Balkanski, Y., Fuzzi, ganic material affects its reactivity, P. Natl. Acad. Sci. USA, 109,
S., Horth, J., Moortgat, G. K., Winterhalter, R., Myhre, C. E. 17354-17359, 2012.
L., Tsigaridis, K., Vignati, E., Stephanou, E. G., and Wilson, J.: Ladino, L. A., Zhou, S., Yakobi-Hancock, J. D., Aljawhary, D., and
Organic aerosol and global climate modelling: a review, Atmos. Abbatt, J. P. D.: Factors controlling the ice nucleating abilities
Chem. Phys., 5, 1053–1123, https://doi.org/10.5194/acp-5-1053- of α-pinene SOA particles, J. Geophys. Res., 119, 9041–9051,
2005, 2005. https://doi.org/10.1002/2014JD021578, 2014.
Kaufman, Y. J., Tanré, D., and Boucher, O.: A satellite view of
aerosols in the climate system, Nature, 419, 215–223, 2002.
https://doi.org/10.5194/acp-21-10215-2021 Atmos. Chem. Phys., 21, 10215–10228, 2021You can also read