Playing by the rules? Phenotypic adaptation to temperate environments in an American marsupial - PeerJ
←
→
Page content transcription
If your browser does not render page correctly, please read the page content below

Playing by the rules? Phenotypic
                                   adaptation to temperate environments
                                   in an American marsupial
                                   Sergio F. Nigenda-Morales1 ,2 , Ryan J. Harrigan3 and Robert K. Wayne1
                               1
                                 Department of Ecology and Evolutionary Biology, University of California, Los Angeles, CA,
                                 United States of America
                               2
                                 National Laboratory of Genomics for Biodiversity, Center for Research and Advanced Studies, Irapuato,
                                 Guanajuato, Mexico
                               3
                                 Center for Tropical Research, Institute of the Environment and Sustainability, University of California,
                                 Los Angeles, CA, United States of America

                                       ABSTRACT
                                       Phenotypic variation along environmental gradients can provide evidence suggesting
                                       local adaptation has shaped observed morphological disparities. These differences, in
                                       traits such as body and extremity size, as well as skin and coat pigmentation, may affect
                                       the overall fitness of individuals in their environments. The Virginia opossum (Didelphis
                                       virginiana) is a marsupial that shows phenotypic variation across its range, one that has
                                       recently expanded into temperate environments. It is unknown, however, whether the
                                       variation observed in the species fits adaptive ecogeographic patterns, or if phenotypic
                                       change is associated with any environmental factors. Using phenotypic measurements
                                       of over 300 museum specimens of Virginia opossum, collected throughout its distri-
                                       bution range, we applied regression analysis to determine if phenotypes change along
                                       a latitudinal gradient. Then, using predictors from remote-sensing databases and a
                                       random forest algorithm, we tested environmental models to find the most important
                                       variables driving the phenotypic variation. We found that despite the recent expansion
                                       into temperate environments, the phenotypic variation in the Virginia opossum follows
                                       a latitudinal gradient fitting three adaptive ecogeographic patterns codified under
Submitted 9 February 2017
Accepted 25 February 2018              Bergmann’s, Allen’s and Gloger’s rules. Temperature seasonality was an important
Published 27 March 2018                predictor of body size variation, with larger opossums occurring at high latitudes with
Corresponding author                   more seasonal environments. Annual mean temperature predicted important variation
Sergio F. Nigenda-Morales,             in extremity size, with smaller extremities found in northern populations. Finally,
snigenda@ucla.edu                      we found that precipitation and temperature seasonality as well as low temperatures
Academic editor                        were strong environmental predictors of skin and coat pigmentation variation; darker
Virginia Abdala                        opossums are distributed at low latitudes in warmer environments with higher
Additional Information and             precipitation seasonality. These results indicate that the adaptive mechanisms underly-
Declarations can be found on           ing the variation in body size, extremity size and pigmentation are related to the resource
page 19
                                       seasonality, heat conservation, and pathogen-resistance hypotheses, respectively. Our
DOI 10.7717/peerj.4512                 findings suggest that marsupials may be highly susceptible to environmental changes,
    Copyright                          and in the case of the Virginia opossum, the drastic phenotypic evolution in northern
2018 Nigenda-Morales et al.            populations may have arisen rapidly, facilitating the colonization of seasonal and colder
                                       habitats of temperate North America.
Distributed under
Creative Commons CC-BY 4.0

OPEN ACCESS

                                   How to cite this article Nigenda-Morales et al. (2018), Playing by the rules? Phenotypic adaptation to temperate environments in an
                                   American marsupial. PeerJ 6:e4512; DOI 10.7717/peerj.4512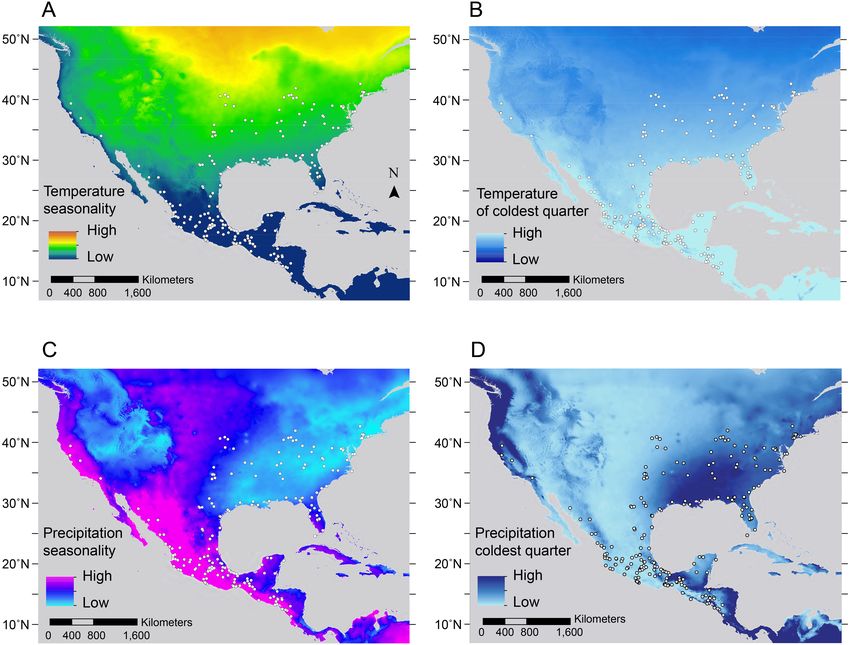
Subjects Biogeography, Evolutionary Studies, Zoology, Anatomy and Physiology
                                   Keywords Body size, Didelphis, Phenotypic variation, Extremity size, Skin pigmentation, Coat
                                   coloration, Central America, North America, Virginia opossum, Random forest

                                   INTRODUCTION
                                   Clinal geographic variation can arise as local adaptation within environmental gradients
                                   across the geographic range of a species, and can contribute to phenotypic divergence
                                   among populations (Mayr, 1956; Endler, 1977). Some of the most conspicuous traits
                                   capable of such responses to changes in the environment are body size, coloration, and
                                   body extremity dimensions, especially in species with large geographic ranges (Millien et al.,
                                   2006). These traits are functionally important, as they can affect numerous physiological
                                   and ecological processes in animals (Caro, 2005; Lomolino & Perault, 2007; Tattersall et al.,
                                   2012). It is well-known that geographic variation of these traits between populations may
                                   follow general ecogeographic patterns; these include Bergmann’s (larger body sizes in high,
                                   colder latitudes; Bergmann, 1847), Allen’s (shorter extremities in higher latitudes; Allen,
                                   1877) and Gloger’s (less pigmentation in high latitudes; Gloger, 1833) rules. These patterns
                                   are thought to be the result of adaptations to selective pressures imposed by gradients
                                   in environmental variables (Mayr, 1956; Millien et al., 2006) and several hypotheses have
                                   been proposed to explain them. For example, thermoregulation, primary productivity
                                   and resource seasonality-fasting endurance have all been advanced as explanations for
                                   body size variation (Bergmann, 1847; Rosenzweig, 1968; Boyce, 1979; Lindstedt & Boyce,
                                   1985). Similarly, heat conservation may explain size change in extremities (Allen, 1877)
                                   and concealment, thermoregulation, prevention of cold injury and pathogen resistance
                                   may account for skin and coat pigmentation variation (Post, Daniels & Binford, 1975;
                                   Mackintosh, 2001; Caro, 2005).
                                       However, during or after a process of population expansion into new environments,
                                   the ecogeographic patterns may not be observed, possibly because not enough time has
                                   elapsed for adaptive changes to occur, or because trait plasticity may be more likely
                                   to drive phenotypic differences during expansion (Ghalambor et al., 2007; Pfennig et al.,
                                   2010). Nevertheless, if evidence for phenotypic adaptations is found, traits likely evolved
                                   quickly to match these new environmental regimes (Hairston et al., 2005; Bradshaw &
                                   Holzapfel, 2006). Finding the environmental variables associated with geographic variation
                                   is important to elucidate the evolutionary processes and mechanisms underlying phenotypic
                                   change (Kamilar et al., 2012).
                                       The ecogeographic patterns mentioned above broadly apply to mammals (Ashton,
                                   Tracy & De Queiroz, 2000; Meiri & Dayan, 2003), but limited studies have been done
                                   in marsupials (Yom-Tov & Nix, 1986; Lindenmayer et al., 1995; Quin, Smith & Norton,
                                   1996; Cooper, 1998), and to our knowledge no studies have explored the effect of
                                   environmental variables on phenotypic patterns in American marsupials. Marsupials
                                   represent the ancestor group of Eutherian mammals; they have lower metabolism and
                                   body temperatures than Eutherians, probably making them more susceptible to selective
                                   pressures related to environmental fluctuation (McNab, 1978; Tyndale-Biscoe, 2005).

Nigenda-Morales et al. (2018), PeerJ, DOI 10.7717/peerj.4512                                                                  2/25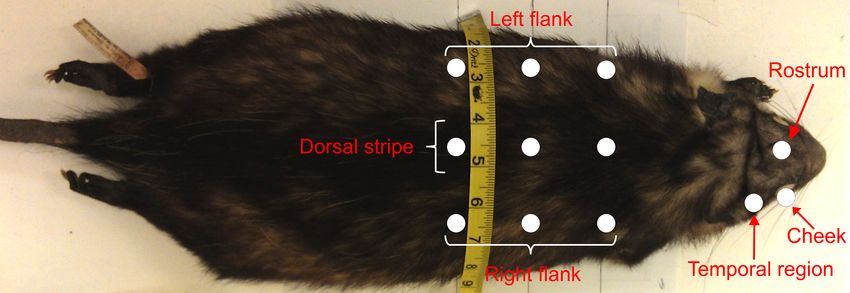
The Virginia opossum (Didelphis virginiana Kerr, 1792) is a nocturnal marsupial widely
                                   distributed from northwestern Costa Rica to southern Ontario and British Columbia in
                                   Canada. The species likely originated in tropical Central America (Gardner, 1973; Jansa,
                                   Barker & Voss, 2014), and the fossil record and paleoclimate data suggest it recently
                                   expanded its range into the seasonal temperate habitats of North America, during the
                                   last 15–11 kyr (thousand years) (Graham et al., 1996; Bartlein et al., 1998; Morgan, 2008;
                                   Graham & Lundelius, 2010). Although widely distributed, the Virginia opossum is mostly
                                   absent in xeric environments, and habitats with extremely low temperatures (Gardner &
                                   Sunquist, 2003). This species has poor thermoregulatory capabilities at low temperatures
                                   due to its high thermo-neutral temperature (Lustick & Lustick, 1972). However, individuals
                                   in northern populations develop a higher fur density during the colder months (Gardner,
                                   1973), which might be an adaptation to low temperatures in seasonal habitats. These
                                   observations, combined with the tropical origin of the species and its recent expansion into
                                   temperate climates, indicate the species is sensitive to low temperatures and adaptations to
                                   these new environments may have evolved over a short period of time.
                                      The Virginia opossum shows phenotypic variation across its range for some body
                                   dimension and coloration traits. Southern opossum populations have lower body weights
                                   and longer tails, (although not necessarily shorter bodies) than those in northern localities
                                   (Gardner & Sunquist, 2003). In addition, the proportion of the skin depigmented on the
                                   naked ears, feet, and tails is greater in northern populations, which also have lighter
                                   pelage coloration of the face and the dorsal part of the torso (Gardner, 1973; Gardner &
                                   Sunquist, 2003). These phenotypic characteristics may have been generated as a plastic
                                   response to the expansion into colder climates or by rapid adaptive evolution in those
                                   environments. Previous research has only generally described patterns of phenotypic
                                   variation across the distribution range of the Virginia opossum, and had not considered
                                   associations with environmental variables (Gardner, 1973; Koch, 1986; Gardner & Sunquist,
                                   2003). Consequently, the evolutionary processes driving the extensive geographic variation
                                   in this species and other marsupials are poorly understood.
                                      Due to its tropical origin, recent colonization of temperate regions, sensitivity to
                                   environmental variables and phenotypic geographic variation, the Virginia opossum is
                                   a good model species to study the evolutionary processes that have shaped phenotypic
                                   variation in marsupial mammals. Here we test if the phenotypic variation observed in the
                                   Virginia opossum follows ecogeographic patterns and attempt to determine the adaptive
                                   mechanisms that may be driving this variation. If no evidence of ecogeographic patterns are
                                   found, it would suggest population structure or plastic responses may have played a greater
                                   role in driving the phenotype diversity in the species. We implemented a machine learning
                                   algorithm to assess the association of geographic variation with environmental variables
                                   and test different adaptive hypotheses. We used environmental predictors corresponding to
                                   a wide range of habitat features, including temperature, precipitation, elevation, moisture,
                                   and vegetation coverage, that have been suggested to affect coloration, body and extremity
                                   size variation (Lindsay, 1987; Ashton, Tracy & De Queiroz, 2000; Chaplin, 2004; Caro, 2005;
                                   Kamilar et al., 2012; Terada, Tatsuzawa & Takashi, 2012). We expect different sets of
                                   environmental variables to be important predictors of geographic variation depending

Nigenda-Morales et al. (2018), PeerJ, DOI 10.7717/peerj.4512                                                               3/25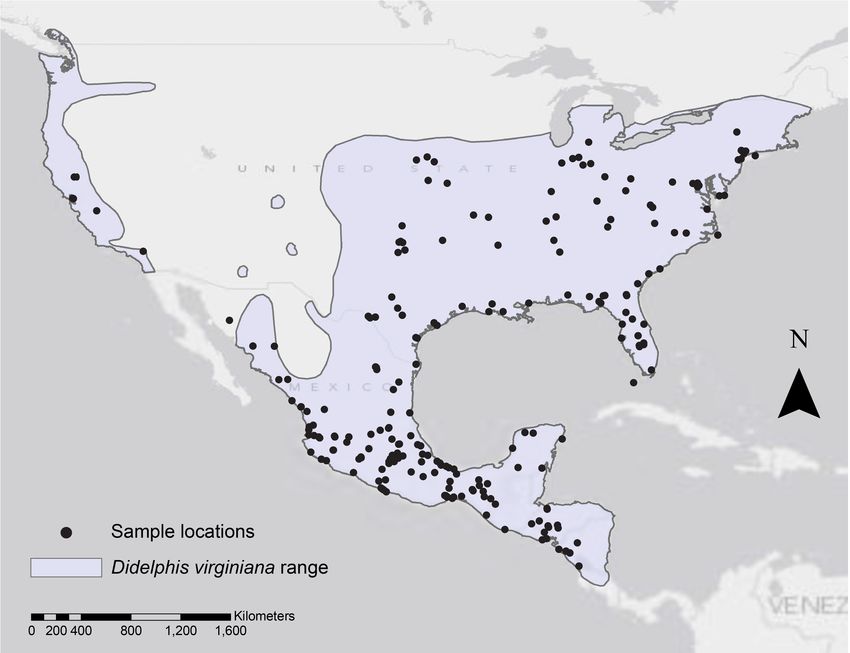
on the adaptive hypotheses explaining this variation. For example, we predict that if
                                   thermoregulation is the major adaptive explanation of body size variation in the Virginia
                                   opossum, it can be expected that variables related to low temperatures to be the most
                                   important predictors for this trait. In contrast, seasonality variables (for temperature or
                                   precipitation) would be more important if resource availability is playing a larger role in the
                                   evolution of body size. In the case of extremity size, we predict temperature or temperature
                                   changes would be important explaining extremity size if heat-conservation strategies have
                                   played a role in the adaptation of opossums to temperate environments. For skin and coat
                                   pigmentation traits, we would expect low temperature variables to be important predictors
                                   if thermoregulation or cold injury are the selective mechanisms underlying their variation.
                                   Conversely, if variables related to vegetation coverage are better predictors of pigmentation,
                                   concealment probably has a more important adaptive role.

                                   MATERIALS & METHODS
                                   Museum specimens
                                   We examined 352 (163 females and 189 males) study skins of Virginia opossum museum
                                   specimens to measure body and extremity dimensions, and 345 (159 females and 186
                                   males) specimens for skin pigmentation and coat coloration analysis (Table S1). The
                                   specimens belong to five different natural history collections and were collected over
                                   145 years (1865–2010; Table S2) along the geographic range of the species, from southern
                                   Nicaragua to the northern east coast of the United States (US), including some specimens
                                   from the western US in California (Fig. 1). We obtained the coordinates for each specimen
                                   collecting locality using two different approaches: (1) the coordinates provided by the
                                   original collectors; or (2) we located the collecting site provided by the original collector
                                   using the Google Earth program and extracted the geographic coordinates. Table S2,
                                   provides the geographic coordinates, year and country in which the specimens were
                                   collected. To avoid the confounding effects of age, all specimens measured for this study
                                   were adults. We determined the age following Gardner & Sunquist’s (2003) age estimation
                                   method based on tooth eruption. For each specimen, we took measurements to identify
                                   variation in body size, body extremities size, proportion of pigmented skin of the extremities
                                   and, body and facial coat coloration. Twelve phenotypic traits were measured in total, and
                                   because some specimens had damaged body parts, not all specimens were measured for all
                                   traits (see Table S1 ). The variation in some of the traits is shown in Fig. 2. This study was
                                   done following UCLA’s Office of Animal Research Oversight protocols #2011-121-02 and
                                   #2011-121-03.

                                   Phenotypic measurements
                                   To quantify variation in body size, we measured body length (head and body; Fig. 2A) and
                                   left hindfoot length (heel to tip of middle digit). Hindfoot size is often used as an alternative
                                   to represent body size because these traits frequently co-vary (Suttie & Mitchell, 1983;
                                   Martin et al., 2013). Consequently, since these measurements were positively correlated
                                   with each other (r = 0.547; P < 0.001), we used hindfoot length as an additional body size
                                   measurement in subsequent analysis, instead of as a measurement of extremity size. For

Nigenda-Morales et al. (2018), PeerJ, DOI 10.7717/peerj.4512                                                                   4/25
Figure 1 Geographic range of Didelphis virginiana and collecting localities. The shaded light purple
area represents the reported distribution range for the species (Pérez-Hernandez, Lew & Solari, 2016) and
the collecting localities for the museum specimens analyzed in this study are marked by black dots.
Full-size DOI: 10.7717/peerj.4512/fig-1
appendage size, we measured the tail length (base to tip; Fig. 2B) and posterior aspect of
the ear length (from base to most superior part of the pinna). We measured the posterior
aspect of the ear because most specimens had their ears folded and it was impossible to
measure the anterior part of the pinnae (the more commonly used measurement). For
simplicity, hereafter, we will refer to the posterior aspect of ear length as ear length. All
measurements were taken in centimeters to the nearest 0.1 decimal.
We measured four skin pigmentation traits by recording the proportion of the tail,
ear, ventral and dorsal aspect of the hindfoot’s middle digit that was visibly pigmented
(Figs. 2B, 2C). We measured the proportion of pigmentation on both the ventral and dorsal
part of the middle digit because populations in the US have hindfeet with light pigmentation
on the sole and ventral part of the toes, and in the most northern populations, the light
pigmentation reaches the dorsal part of the toes (Gardner, 1973).
Body and facial coat coloration measurements were taken using the tristimulus
colorimeter Minolta ChromaMeter CR-200 (Minolta, Osaka, Japan). This colorimeter
measures the reflectance of a xenon flash light and records the color in the three-dimensional
color space CIELab. The lightness axis (L*) expresses color brightness, with values ranging
between 100 and 0 for white and black surfaces, respectively, whereas the a* and b* axes are
Nigenda-Morales et al. (2018), PeerJ, DOI 10.7717/peerj.4512 5/25Figure 2 Phenotypic variation in Didelphis virginiana. Phenotypic differences between specimens from
southern and northern populations. (A) Differences in body size (i.e., head and body) and coat coloration
of the face and dorsal part of the torso. (B) Variation in tail length, proportion of tail pigmentation, and
ventral and dorsal hindfoot toes pigmentation. (C) Dissimilarities in the proportion of ear pigmentation.
Full-size DOI: 10.7717/peerj.4512/fig-2
Nigenda-Morales et al. (2018), PeerJ, DOI 10.7717/peerj.4512 6/25Figure 3 Sites on Didelphis virginiana museum skin from which reflectance measurements were
taken. Nine sites were measured on the torso (three on each flank and three on the dorsal stripe) and
three sites on the face (i.e., rostrum, cheek and temporal regions).
Full-size DOI: 10.7717/peerj.4512/fig-3
the color coordinates (Fullerton & Keiding, 1997; Clarys et al., 2000). Since the phenotypes
of coat coloration in the Virginia opossum range from dark to light (Fig. 2A) we only used
the information of the lightness axis (L*) in our analysis. The probe with the light source was
held at 90◦ angle to the surface parallel to the body axis, and the reflectance readings were
recorded manually. All reflectance measurements in each site were measured in triplicate
and averaged to calculate the total lightness value per site. We recorded reflectance values
of lightness from three facial traits (rostrum, cheek and temporal region) and from the
torso of the body in nine sites (i.e., three on the right flank, three on the dorsal stripe, and
three on the left flank; see Fig. 3). The mean of the torso measurements was used as the
average torso lightness value.
Environmental data
For each locality where specimens were collected, we obtained information at 1-km spatial
resolution on 12 environmental variables, which have been reported to affect body and
extremity size, and pigmentation in mammal species (Lindsay, 1987; Ashton, Tracy &
De Queiroz, 2000; Chaplin, 2004; Caro, 2005; Cordero & Epps, 2012; Kamilar et al., 2012;
Terada, Tatsuzawa & Takashi, 2012). Eight bioclimatic variables related to temperature
(annual mean temperature, mean temperature of warmest quarter, mean temperature
of coldest quarter), precipitation (annual precipitation, precipitation of coldest quarter),
temperature seasonality (mean diurnal range, temperature seasonality) and precipitation
seasonality were obtained from the WorldClim database (Hijmans et al., 2005; Table S3).
These variables maximize variation in North America while minimizing correlation
(Harrigan et al., 2014). In addition, four variables were extracted from remote-sensing
databases: the maximum value of the normalized difference vegetation index (NDVIMAX)
that is related to vegetation density and productivity (Tucker & Sellers, 1986; Buermann et
al., 2008); the vegetation continuous field product as an estimate of the percentage of tree
coverage (TREECOV; Hansen et al., 2002); the monthly backscatter measurements that
capture attributes related to surface moisture (ROUGH) (Long et al., 2001); and elevation
(ELEV) (Table S3 ). Elevation was included in the analyses due to its relationship with
Nigenda-Morales et al. (2018), PeerJ, DOI 10.7717/peerj.4512 7/25temperature variation, which can influence the variance of several traits we examined
(Blackburn & Ruggiero, 2001; Symonds & Tattersall, 2010; Kamilar & Bradley, 2011).
Data analysis
We carried out Shapiro–Wilk normality and Bartlett homoscedasticity tests for all the
traits and analyzed them accordingly. There is important sexual dimorphism in body and
appendages size in opossums (Gardner & Sunquist, 2003); however, these measurements
were normally distributed and a preliminary analysis of our data showed that they have
similar patterns of latitudinal variation for males and females (Figs. S1A–S1D). To insure
adequate sample size for body and extremity size measurements, we controlled for the
effect of sex on these traits, and used the residuals to analyze both sexes together. To test if
there were differences in skin pigmentation and coat coloration traits between males and
females we used analysis of variance (ANOVA) or Wilcoxon rank-sum test depending on
the normality of the data. All traits had homogeneity of variance, but only cheek and torso
lightness were normally distributed and were the only coloration traits statistically different
between males and females (cheek lightness: F = 29.85, P < 0.001; coat lightness: F = 8.85,
P = 0.003), therefore we analyzed them separately for both sexes. All tests were done using
their standard functions in the R statistical framework version 3.1.3 (R Core Team, 2015).
Tests of correlation with latitude
To determine the relationship between the phenotypic traits and latitude, we carried out
Pearson (r) or Spearman (rs ) correlation analyses depending on the normality of the
data in the R statistical framework (R Core Team, 2015). Additionally, using the ggplot2
package in R (Wickham, 2009), we plotted the trait values against latitude, implementing
the non-linear regression loess function to graphically show the trend of correlations and
the latitudes for which there is a change in this trend.
Association with environmental variables
To detect if spatial autocorrelation was present in our phenotypic data, we calculated
Moran’s I weighted by the Euclidean distance between two points for each trait using
the ape package v. 4.1 (Paradis, Claude & Strimmer, 2004) in R. To identify the best
environmental models for predicting the phenotypic variation in the Virginia opossum,
we ran random forest analyses using the randomForest package v. 4.6-12 in R (Liaw &
Wiener, 2002; Prasad, Iverson & Liaw, 2006). Considering measurements from museum
specimens that were collected in the same geographic location could contribute to increase
spatial autocorrelation in our data; therefore, we averaged the phenotypic values of those
specimens (Dataset S1) for the random forest analyses. To run the random forest analyses,
we used the values of each phenotypic trait as response variables, and the 12 environmental
variables and two geographic variables (i.e., latitude and longitude; Table S3) as predictors.
The two geographic variables were included because incorporating geographic information
in random forest models allows an evaluation of how much variation in response is
explained by environmental variation as compared to simply geographic proximity (Evans
et al., 2011; Mascaro et al., 2014). Decision trees (regression or classification) and random
forest methods have no a priori assumptions about the relationship between predictor
Nigenda-Morales et al. (2018), PeerJ, DOI 10.7717/peerj.4512 8/25and response variables, allowing for the possibility to analyze non-linear relationships
with complex interactions (Breiman, 2001; Cutler et al., 2007; Strobl, Malley & Tutz, 2009;
Evans et al., 2011). Random forests analyses are iterations of large number of decision trees,
which recursively partition the data into binary homogeneous groups splitting the response
variable by the predictor variable explaining most of the remaining variance. The amount
of variation in the response variable explained by each predictor is incorporated in the
model. Applying a randomized bootstrapping (bagging) method, random forest analysis
uses a subset of both response and predictor variables randomly permuted to construct
each regression tree and assess the robustness of the model based on the remaining data
not included in the tree. If the accuracy of the model decreases appreciably when a variable
is left out of the model, that variable is considered an important predictor of the data
(Breiman, 2001; Prasad, Iverson & Liaw, 2006; Strobl, Malley & Tutz, 2009).
We ran 10,000 regression trees for each random forest run, and after each run we
eliminated the least important variables in the model and re-ran random forest until we
identified the most predictive, least complex models, which were composed of three to five
predictors that explained the largest amount of variation for each trait. We compared these
combined models (which included environmental and geographic variables) with models
composed only by the two geographic variables and models including environmental
variables only. This was done to detect the role that geography or environment alone
play in explaining phenotypic variation in the opossum. Finally, we also tested for spatial
autocorrelation in the residuals of the combined models using the Moran’s I statistic to be
confident that spatial autocorrelation has not affected the results of those models.
RESULTS
Latitudinal variation
Body and extremities size
We found correlation with latitude for all body dimension measurements (see Table 1;
Figs. 4A–4D). The correlations with latitude for body size and hindfoot length were
positive (r = 0.314, P < 0.001 and r = 0.284, P < 0.001, respectively), increasing after 27◦ N
(Figs. 4A, 4B). In contrast, the correlations for tail length and ear length were negative (see
Table 1). Tail length, was smaller above 27◦ N, whereas for ear length smaller values occur
only in latitudes above 37◦ N (Figs. 4C, 4D). In general, opossums with smaller bodies but
larger tails were distributed in latitudes below 27◦ N, and larger individuals with shorter
tails were found in higher latitudes. This pattern of variation follows both Bergmann’s and
Allen’s rule for body and extremity size, respectively.
Skin and coat pigmentation
There was negative correlation between all skin pigmentation traits and latitude (see
Table 1; Figs. 4E–4H). The correlation was strong for tail pigmentation (rs = −0.701,
P < 0.0001) and moderate for toe’s ventral pigmentation (rs = −0.583, P < 0.0001). The
proportion of skin pigmentation was lower above 26◦ N for all traits (Figs. 4E–4H). For
facial coat coloration traits, lightness had a positive correlation with latitude (see Table 1),
particularly noticeable for the rostrum (rs = 0.679, P < 0.0001) and temporal regions
Nigenda-Morales et al. (2018), PeerJ, DOI 10.7717/peerj.4512 9/25Table 1 Pearson and Spearman correlation between Didelphis virginiana phenotypic traits and lati-
tude.
Trait Sample size Pearson correlation Spearman correlation
**
Body length 348 0.314 n.a.
Hindfoot length 345 0.284** n.a.
**
Tail length 348 −0.613 n.a.
Ear length 185 −0.172* n.a.
Tail pigmentation 340 n.a. −0.701***
Ear pigmentation 293 n.a. −0.559***
Toe ventral pigmentation 334 n.a. −0.583***
Toe dorsal pigmentation 338 n.a. −0.548***
Rostrum lightness 345 n.a. 0.679***
Temporal region lightness 345 n.a. 0.719***
Cheek lightness
F 159 0.517*** n.a.
***
M 186 0.512 n.a.
Torso lightness
F 159 0.298** n.a.
**
M 186 0.251 n.a.
Notes.
F, Females; M, Males; n.a, Not applicable.
*P < 0.05.
**
P < 0.001.
***
P < 0.0001.
(rs = 0.718, P < 0.0001). These traits were darkly or lightly pigmented below 25–26◦ N
or above 30–31◦ N, respectively, with a steep cline between these latitudes (Figs. 4I, 4J).
This is a common pattern we observed across many body dimension and pigmentation
traits where opossums below 27◦ N or above 31◦ N are phenotypically similar among them
(Fig. 4), suggesting that phenotypic variation is mainly driven by individuals in the range
between these latitudes probably due to environmental conditions transitioning from
tropical to temperate within this range. Finally, males were lighter than females for cheek
(F = 29.85, P < 0.001) and torso coloration (F = 8.84, P = 0.031). For both sexes, cheek
lightness had larger values above 24◦ N (Fig. 4K). Weak but significant correlation with
latitude was found for torso lightness in both sexes (Table 1), with lightness increasing
around 29◦ N (Fig. 4L). Overall, our skin and coat pigmentation data follow Gloger’s rule:
opossums have higher proportion of their skin pigmented and darker fur coloration on
their face and torso in lower latitudes, whereas less pigmented individuals with lighter face
and torso are found at higher latitudes.
Association with environmental variation
Concordant with our results of latitudinal variation, we found that all phenotypic traits show
positive spatial autocorrelation (Table S4) and the most important variable for the models
of these traits was latitude, whereas longitude was not consistently among the top variables
(Fig. 5). Despite this association between morphology and latitude, environment also
helped predict morphological characteristics; models with environmental or geographic
Nigenda-Morales et al. (2018), PeerJ, DOI 10.7717/peerj.4512 10/25A B C
15 1.5
Residuals body length
Residuals hindfoot length
10
Residuals tail length
10 1.0
5
5 0.5
0
0 0.0
−5
−5 −0.5
−10
−10 −1.0
−15
−1.4
15 20 25 30 35 40 15 20 25 30 35 40 15 20 25 30 35 40
Latitude degrees Latitude degrees Latitude degrees
D E F
1.0 1.0
% tail pigmentation
% ear pigmentation
Residuals ear length
0.8
0.5
0.9
0.0 0.6
−0.5 0.8
0.4
−1.0
0.2 0.7
15 20 25 30 35 40 15 20 25 30 35 40 15 20 25 30 35 40
Latitude degrees Latitude degrees Latitude degrees
G H I
1.00 1.00 80
% toe dorsal pigmentation
% toe ventral pigmentation
Rostrum lightness
70
0.75 0.75
60
0.50 0.50 50
0.25 0.25 40
30
0.00 0.00 25
15 20 25 30 35 40 15 20 25 30 35 40 15 20 25 30 35 40
Latitude degrees Latitude degrees Latitude degrees
J K L
80 60
80
70
Temporal lightness
Cheek lightness
50
Torso lightness
60 70
50 40
60
40
30
30 50
25
20 45
15 20 25 30 35 40 15 20 25 30 35 40 15 20 25 30 35 40
Latitude degrees Latitude degrees Latitude degrees
Figure 4 Scatter plots of the relationship between phenotypic traits and latitude. The non-linear loess
function line is shown, indicating the trend of the relationship. (A) body length, (B) hindfoot length, (C)
tail length, (D) ear length, (E) proportion of tail pigmentation, (F) proportion of ear pigmentation, (G)
proportion of toe ventral pigmentation, (H) proportion of toe dorsal pigmentation, (I) rostrum lightness,
(J) temporal region lightness, (K) cheek lightness, (L) torso lightness. For cheek and torso lightness, the
grey triangles and line represent the data for males while the black circles and line represent the data for fe-
males.
Full-size DOI: 10.7717/peerj.4512/fig-4
Nigenda-Morales et al. (2018), PeerJ, DOI 10.7717/peerj.4512 11/25Table 2 Random forest models for each phenotypic trait and the percentage of phenotypic variance they explain. For most traits, the combined
models that include environmental and geographic variables together explain more of the phenotypic variation than the environmental only and ge-
ographic only models. When LONG is in cursive it means that it was not among the top variables of that particular model (Fig. 5), but was included
to take into account spatial autocorrelation. The most important variable of the models is on the left, diminishing in importance towards the right.
Traits Best models including % of phenotypic % of phenotypic % of phenotypic
environmental and geographic variation explained variation explained variation explained
variables. by the models in- by environmental by geographic
cluding environmen- variables only variables only
tal and geographic (i.e., LAT, LONG)
variables.
Body Dimensions
Body length LAT, Bio4, Bio11, Bio2, LONG 14.95% 11.82% 9.96%
Hindfoot length Bio11, LONG, LAT, Bio4 12.75% 3.39% 10.77%
Tail length LAT, LONG, Bio4, Bio1, Bio11 47.42% 36.91% 50.05%
Ear length Bio1, LAT, Bio4, ROUGH, LONG 13.11% 11.51% −1.73%
Skin Pigmentation
Tail pigmentation LONG, LAT, Bio4, Bio11, Bio15 62.56% 60.0% 61.14%
Ear pigmentation LONG, Bio15, Bio4, LAT 62.18% 49.07% 60.78%
Toe ventral pigmentation LAT, Bio 19, LONG, Bio4, Bio11 59.86% 57.57% 58.9%
Toe dorsal pigmentation LAT, Bio11, Bio15, Bio1, LONG 31.17% 27.38% 34.5%
Face coloration
Rostrum lightness LAT, Bio4, LONG, Bio11, Bio19 76.04% 73.64% 74.82%
Temporal lightness LONG, LAT, Bio4, Bio11, Bio15 78.34% 72.29% 79.04%
Cheek lightness
F LAT, Bio4, Bio11, Bio19, LONG 13.75% 5.74% 16.87%
M LAT, Bio11, Bio4, Bio15, LONG 29.75% 27.65% 24.06%
Torso lightness
F Bio4, Bio12, LAT, Bio11, LONG 19.88% 18.45% 14.76%
M Bio4, Bio11, LAT, Bio12, LONG 14.41% 15.78% 0.25%
Notes.
F, Females; M, Males; Bio1, annual mean temperature; Bio2, mean diurnal range; Bio4, temperature seasonality; Bio11, mean temperature of coldest quarter; Bio12, an-
nual precipitation; Bio15, precipitation seasonality; Bio19, precipitation of coldest quarter; ROUGH, surface moisture; LAT, latitude; LONG, longitude.
variables alone explained less of the Virginia opossum phenotypic variation than the
combined models including environmental and geographic variables together (Table 2).
Further, the residuals of these combined models showed small negative Moran’s I values,
most of them were slightly significant or not significant (Table S5), which indicates the
models are appropriate for our analyses since they control for spatial autocorrelation. As
such, we explore and explain these more predictive, combined models below.
Body and extremity size
Combined models explained 12.75% and 14.95% of the total variation in hindfoot and
body length, respectively, and 47.42% of tail length variation (Table 2). Aside from latitude,
the most important environmental predictors for both body size and hindfoot length were
temperature of the coldest quarter (Bio11) and temperature seasonality (Bio4; Table 2;
Figs. 5A, 5B), (Wigginton & Dobson, 1999). The temperature of the coldest quarter (Bio11)
was also the most important environmental predictor of tail length (Table 2; Fig. 5C),
Nigenda-Morales et al. (2018), PeerJ, DOI 10.7717/peerj.4512 12/25A B C D
LAT LAT LAT LAT
Bio11 Bio11 LONG Bio1
Bio4 Bio2 Bio11 Bio12
Bio2 Bio4 Bio15 Bio11
Bio1 Bio1 Bio19 LONG
Bio15 LONG Bio4 ELEV
Bio19 Bio19 Bio1 Bio4
LONG Bio15 Bio10 Bio10
Bio12 ELEV ELEV ROUGH
ELEV Bio10 Bio2 Bio2
Bio10 Bio12 Bio12 Bio15
ROUGH NDVIMAX TREECOV Bio19
NDVIMAX ROUGH ROUGH TREECOV
TREECOV TREECOV NDVIMAX NDVIMAX
10 20 30 40 50 60 70 10 20 30 40 50 60 10 30 50 70 15 25 35 45
% increase mean square error
E F G H
LAT LONG LAT LAT
Bio4 LAT Bio19 Bio15
LONG Bio15 LONG Bio11
Bio11 Bio4 Bio4 LONG
Bio15 Bio11 Bio11 Bio4
Bio1 ELEV Bio15 Bio1
Bio19 Bio19 Bio1 Bio10
Bio12 TREECOV Bio10 Bio19
Bio2 Bio1 ELEV ELEV
ELEV ROUGH Bio12 Bio12
Bio10 Bio10 Bio2 Bio2
TREECOV Bio2 ROUGH ROUGH
ROUGH NDVIMAX TREECOV TREECOV
NDVIMAX Bio12 NDVIMAX NDVIMAX
0 20 40 60 80 20 40 60 80 0 20 40 60 80 100 0 20 40 60
% increase mean square error
I J K L
LAT LAT LAT LAT
Bio4 LONG Bio4 Bio11
Bio11 Bio4 Bio11 Bio4
LONG Bio11 Bio1 Bio1
Bio1 Bio15 Bio15 Bio15
Bio15 Bio1 Bio19 Bio12
Bio19 Bio10 LONG Bio19
Bio10 Bio19 Bio10 LONG
ELEV ELEV ELEV Bio10
Bio12 Bio12 NDVIMAX Bio2
ROUGH TREECOV Bio12 NDVIMAX
NDVIMAX ROUGH Bio2 ROUGH
Bio2 NDVIMAX ROUGH ELEV
TREECOV Bio2 TREECOV TREECOV
20 40 60 80 100 20 40 60 80 100 −20 −10 0 10 20 30 40 10 20 30 40 50 60
% increase mean square error
M N
Bio12 LAT
Bio4 Bio4
LAT Bio11
Bio11 Bio12
LONG Bio1
ELEV Bio15
Bio1 Bio2
Bio10 Bio19
TREECOV ELEV
ROUGH LONG
Bio2 Bio10
NDVIMAX ROUGH
Bio15 TREECOV
Bio19 NDVIMAX
10 20 30 40 50 0 10 20 30 40 50
% increase mean square error
Figure 5 Importance scores for each predictor variable (including geographic variables) used as input
to random forest combined models for all phenotypic traits. Variables with higher mean square error
(calculated as the average increase in squared residuals when the variable is permuted) are more impor-
tant. Variables shown with a black circle are those that remained (continued on next page. . . )
Full-size DOI: 10.7717/peerj.4512/fig-5
Nigenda-Morales et al. (2018), PeerJ, DOI 10.7717/peerj.4512 13/25Figure 5 (...continued)
important as the model was refined. (A) body length, (B) hindfoot length, (C) tail length, (D) ear length,
(E) proportion of tail pigmentation, (F) proportion of ear pigmentation, (G) proportion of toe ventral
pigmentation, (H) proportion of toe dorsal pigmentation, (I) rostrum lightness, (J) temporal region light-
ness, (K) cheek lightness in females, (L) cheek lightness in males, (M) torso lightness in females, (N) torso
lightness in males. Bio1, annual mean temperature; Bio2, mean diurnal range; Bio4, temperature season-
ality; Bio10, mean temperature warmest quarter, Bio11, mean temperature of coldest quarter; Bio12, an-
nual precipitation; Bio15, precipitation seasonality; Bio19, precipitation of coldest quarter; NDVIMAX,
normalized difference vegetation index maximum value; TREECOV, percent tree cover; ELEV, elevation;
ROUGH, surface moisture; LAT, latitude; LONG, longitude.
whereas 13.11% of the ear length variance was explained by the model (and its main
environmental predictor, annual mean temperature (Bio1)) (Table 2; Fig. 5D). Together,
the distribution of the opossums and the combined models indicate that larger opossums
occur (above 27◦ N) where there is higher temperature seasonality (Fig. 6A). Whereas for
the extremity size variation, tail length was reduced above 27◦ N, in regions where the mean
temperature during the winter (i.e., the coldest quarter) is relatively low (Fig. 6B).
Skin and coat pigmentation
Combined models explained 31.17–62.56% of the variation in skin pigmentation, 13.75–
78.34% in face coloration, and 14.41–19.88% in torso coloration (Table 2). The most
important and consistent environmental predictors for explaining phenotypic variation in
skin pigmentation and face coloration traits were temperature seasonality, temperature of
coldest quarter, along with two precipitation variables: precipitation seasonality (Bio15)
and precipitation of the coldest quarter (Bio19; Table 2; Figs. 5E–5L). According to the
distribution of these predictors and of the opossums, individuals with more depigmented
skin and lighter face (distributed above 27◦ N) were found in localities where temperatures
during the coldest quarter (i.e., winter; Fig. 6B) and precipitation seasonality are low
(Fig. 6C), while temperature seasonality (Fig. 6A) and precipitation of the coldest quarter
are higher (Fig. 6D).
In contrast with other pigmentation traits, the combined models explained relatively
less of the variation in torso lightness, for males (14.41%) and females (19.88%), with
temperature seasonality, temperature of the coldest quarter and annual precipitation
(Bio12) being the most important environmental predictors (Table 2; Figs. 5M, 5N). A
pattern of lighter torso coloration was found where temperature seasonality was higher
and temperature of the coldest quarter and annual precipitation were lower. These results
together with our latitudinal distribution results suggest opossums have high proportion
of skin pigmented and darker pelage on the face and torso in humid tropical environments
below 26◦ N, where conditions are warmer, less seasonal and with higher precipitation
variability, whereas they are less pigmented towards seasonal, drier and colder habitats
above 31◦ N.
Nigenda-Morales et al. (2018), PeerJ, DOI 10.7717/peerj.4512 14/25Figure 6 Maps of geographic variation for the most important environmental predictors associated
with trait variation in Didelphis virginiana. (A) Temperature seasonality, (B) temperature of the coldest
month, (C) precipitation seasonality and (D) precipitation of the coldest quarter. The white dots show the
distribution of Virginia opossum specimens used in this study.
Full-size DOI: 10.7717/peerj.4512/fig-6
DISCUSSION
Adaptation to temperate and seasonal environments
Our results indicate that there is a dramatic phenotypic change between tropical and
temperate Virginia opossum populations. This change may be driven by natural selection
since they adjust to three ecogeographic patterns. The facts that the traits show spatial
autocorrelation (Table S4) and that latitude was the most important variable for most
of the models (Fig. 5) is not surprising, given the latitudinal gradient we observed in
the pattern of phenotypic variation (Table 1) and that environmental variables are also
correlated with latitude. Therefore, it is difficult to distinguish the effects of pure spatial
autocorrelation when environmental variables that change along similar gradients, which
is a limitation of studies perform at large spatial scales. However, the inclusion of latitude
and longitude as predictor variables allows us to better tease apart the contributions of
geography and ecology separately in our random forest models (Evans et al., 2011; Mascaro
et al., 2014) and control for spatial autocorrelation (Table S5). The results of these models
Nigenda-Morales et al. (2018), PeerJ, DOI 10.7717/peerj.4512 15/25support the idea that phenotypic variation in the opossum follow ecogeographic patterns
that vary with latitude and identify the most important environmental variables responsible
for those patterns.
Koch (1986) detected a similar trend as we observed, that of increasing body size with
latitude using the lower first molar area as body size surrogate, but the association to
environmental variables was not tested in that study. The association we found of larger
hindfoot and body size with environmental predictors of seasonality (Table 2; Figs. 5A, 5B),
is consistent with the resource seasonality (also known as fasting endurance) hypothesis as
an explanation for Bergmann’s rule. This hypothesis suggests natural selection favors larger
individuals in regions of greater seasonality where food availability and energy demands are
less predictable (Boyce, 1979; Lindstedt & Boyce, 1985). For the opossum, one of the most
important causes of mortality is starvation due to harsh climate conditions in the winter,
especially in the northern part of its distribution (Kanda & Fuller, 2004; Kanda, 2005). The
main factors predicting whether an opossum will survive the winter are body weight and
size (Brocke, 1970; Kanda, 2005). Larger individuals save more energy than smaller ones,
owing to a lower metabolism at low temperatures (McNab, 1978). Moreover, the seasonality
hypothesis predicts that larger individuals accumulate more fat and metabolize it at lower
rates than smaller ones, having greater fasting endurance and survival probability (Lindstedt
& Boyce, 1985; Millar & Hickling, 1990). In accordance, under fasting conditions, opossums
change from using carbohydrates as energy source to lipid storage (Weber & O’Connor,
2000). Our data suggests that the selective pressure of weather-driven food seasonality
and availability may have resulted in a phenotypic adaptation of the Virginia opossum
towards larger bodies in seasonal and temperate environments above 27◦ N. This finding is
supported by the fact that at least some Australian marsupials conform with Bergmann’s
pattern in response to temperature variability and food availability (Yom-Tov & Nix, 1986;
Quin, Smith & Norton, 1996).
The variation of body extremities, especially for tail length, follow Allen’s rule
(Figs. 4C, 4D) and is associated with temperature variables (Table 2; Figs. 5C, 5D). Allen’s
pattern suggests that natural selection favors individuals with larger body appendages
that increase surface area to dissipate heat via conduction in warmer climates, whereas in
colder climates shorter appendages would be favored to reduce heat loss (Millien et al.,
2006; Tattersall et al., 2012). This pattern is found in two kangaroo species (Yom-Tov &
Nix, 1986) while other three Australian marsupials do not show this pattern (Yom-Tov &
Nix, 1986; Lindenmayer et al., 1995; Cooper, 1998). Physiological studies have proposed the
Virginia opossum is poorly adapted to cold climates due to its high conductivity (i.e., its
skin facilitates heat transfer) and low metabolism, and because it relies on behavioral and
heat production mechanisms instead of heat conservation as a primary thermoregulatory
strategy (Lustick & Lustick, 1972; Hsu, Harder & Lustick, 1988). However, opossums at
high latitudes show heat conservation adaptations to seasonal decrease in temperature
by developing a higher pelage density during fall and winter months (Gardner, 1973). All
physiological studies in this species have used individuals from northern populations above
29◦ N (i.e., Florida (McNab, 1978), Ohio (Lustick & Lustick, 1972; Hsu, Harder & Lustick,
1988), Michigan (Brocke, 1970) and New York McManus, 1969), which our results revealed
Nigenda-Morales et al. (2018), PeerJ, DOI 10.7717/peerj.4512 16/25are phenotypically more similar among them than compared with southern populations.
Consequently, further research is needed to explore the physiological characteristics of
tropical populations. As we have shown, northern populations may have phenotypic
adaptations to colder climates favoring heat conservation compared to populations in the
south. It is possible that during the northwards expansion of the species the new selective
pressures imposed by colder environments favored individuals with reduced extremities
that conserved heat better.
Finally, the conformance to Gloger’s pattern of skin and coat pigmentation variation
and its association with temperature and precipitation variables (Table 2; Figs. 5E–5N) may
be driven by pathogens. The pathogen-resistant hypothesis suggests the higher pathogenic
incidence in humid and warm tropical environments (Guernier, Hochberg & Guégan, 2004;
Lafferty, 2009) is the selective pressure driving the increased pigmentation observed in
tropical populations, because highly pigmented skin, hair or feathers confer better resistance
to pathogenic infection (Mackintosh, 2001; Burtt & Ichida, 2004). Accumulating evidence
suggests that melanocytes, melanosomes and melanin function as integral part of the innate
immune system response against invading pathogens (Mackintosh, 2001; Elias, 2007). For
example, darker humans are less prone to bacterial and fungal infections than individuals
with light skin (Mackintosh, 2001), black feathers on birds are more resistant to bacterial
degradation than light ones (Burtt & Ichida, 2004), and darker greenfinches (Carduelis
chloris) have higher survival to protozoan infections than paler ones (Männiste & Hõrak,
2014). Similar to the other phenotypic traits we analyzed, the evolution of adaptations in
pigmentation (in the opossum’s case is depigmentation) must have occurred during the
expansion of the species into North America’s drier and temperate environments at the
end of the last Ice Age.
Taken together, our results suggest that the strong geographic variation observed in body
size, extremity size and pigmentation traits in the Virginia opossum represent phenotypic
adaptations of a species of tropical origins to more seasonal, colder and drier environments.
These adaptations may have arisen rapidly, around 15–11 ka (thousand years ago), during
the initial phase of the range expansion of the species (Graham et al., 1996; Morgan, 2008;
Graham & Lundelius, 2010), which may have facilitated the survival of individuals and the
colonization of temperate North America. This is a feasible scenario since rapid adaptation
to environmental changes can be accomplished within a few generations (Berteaux et al.,
2004; Hairston et al., 2005; Bradshaw & Holzapfel, 2006).
Coloration differences in sexes
As torso and cheek coloration were the coat coloration traits with less variation explained
by the environmental variables that we analyzed (Table 2), it is possible there are other
factors we did not consider in our analysis, for example, predation, sexual selection or
communication, that could also be important for explaining their variation. The fact that,
for these two traits alone, females were darker than males, suggest sexual selection may be
playing a role, and requires further investigation.
Nigenda-Morales et al. (2018), PeerJ, DOI 10.7717/peerj.4512 17/25Phenotypic plasticity
There is the possibility that some of the patterns we observed might be achieved via
phenotypic plasticity (Ghalambor et al., 2007; Pfennig et al., 2010). In a marsupial species
(Sminthopsis crassicaudata), the difference in body size was found to be a response to
temperature changes (Riek & Geiser, 2012). Our results for body size variation detected
low temperatures as an important predictor, making this alternative hypothesis plausible,
however, experimental studies should be done to further investigate the role of plasticity
in opossum body size variation. Experimental studies in several mammal species (Ashoub,
1958; Harrison, Morton & Weiner, 1959; Lee, Chu & Chan, 1969; Weaver & Ingram, 1969;
Serrat, 2013) have shown that body extremity size of genetically similar individuals (i.e.,
siblings) varies depending on the temperature at which they are reared, resulting in larger
and shorter extremities in warm and cold conditions, respectively. However, the only
similar experiment done in a marsupial species did not find differences in extremity size
(Riek & Geiser, 2012). Finally, Siamese cats (Iljin & Iljin, 1930) among other mammals
(Robinson, 1973) show acrosematic pigmentation, with darker pigmentation on the ears,
feet, tail and face, whereas the rest of the body is lighter. This pattern is due to temperature
differences in the skin of the appendages and face compared to the core of the body,
in which the appendages are the coolest (Stern, 1968). Nevertheless, the pigmentation
pattern in the Virginia opossum is the opposite of that predicted by acrosematic patterns.
The role of plasticity in the Virginia opossum phenotype variation should be further
explored, common garden studies rearing individuals with distinct phenotypes in different
environmental conditions and obtaining backcrossed generations may allow to assess the
heritability of the traits.
CONCLUSIONS
Due to the lower body temperature and metabolism that marsupials have, compared to
Eutherian mammals, they may be more susceptible to the effects of environmental variables
and would be under high selective pressure to adaptively respond to environmental
changes. For the Virginia opossum, this prediction appears to be true. We have shown that
temperature and precipitation variables are important in shaping the geographic variation
of body size, extremity size, and skin and coat coloration in this species. Our results
contribute to a better understanding of the evolution of phenotypic traits in marsupials
and provide evidence that selective pressures from environmental variables influence greatly
their phenotypic variation. In the Virginia opossum, variation conforms to three main
ecogeographic patterns. The phenotypic divergence observed may have occurred relatively
recently, during the last 15 kyr the species has inhabited temperate environments of
North America, which shows the ability of this species for expanding in range and rapidly
adapting to new conditions. Although we cannot rule out the possibility that adaptive
phenotypic plasticity has played some role in driving these phenotypic patterns, our results
better support an adaptive response through the recent action of natural selection. Further
research on developmental physiology, population structure, demographic history and
gene expression would be needed to further test ideas about phenotypic variation in this
marsupial species.
Nigenda-Morales et al. (2018), PeerJ, DOI 10.7717/peerj.4512 18/25ACKNOWLEDGEMENTS
The authors would like to thank Nicole Corpuz and Adriana Garmendia for their help
capturing the phenotypic data. We are thankful with Alfred Gardner and Suzzane Peurach
(USNM), Eileen Westwig (AMNH), Chris Conroy (MVZ, University of California,
Berkeley), Livia Leon-Paniagua (Museo de Zoología, Facultad de Ciencias, UNAM),
Fernando Cervantes and Yolanda Hortelano (CNM, Instituo de Biología, UNAM) for
granting us access to their respective museum collections.
ADDITIONAL INFORMATION AND DECLARATIONS
Funding
Funding for this work was provided by the University of California Institute for Mexico
and the United States (UCMEXUS Small Grant, ST 11/06-28 and UCMEXUS Dissertation
Research Grant, DG-12-77 to Sergio F. Nigenda-Morales), the United States of America
National Science Foundation (grant PD-08-1269 to Ryan J. Harrigan), Mexico’s Consejo
Nacional de Ciencia y Tecnología (UCMEXUS-CONACYT Doctoral Fellowship No.
304742 to Sergio F. Nigenda-Morales) and the University of California, Los Angeles (with
scholarship and travel support to Sergio F. Nigenda-Morales). The funders had no role
in study design, data collection and analysis, decision to publish, or preparation of the
manuscript.
Grant Disclosures
The following grant information was disclosed by the authors:
UCMEXUS Small Grant: ST 11/06-28.
UCMEXUS Dissertation Research Grant: DG-12-77.
United States of America National Science Foundation: PD-08-1269.
UCMEXUS-CONACYT Doctoral Fellowship: 304742.
University of California.
Competing Interests
The authors declare there are no competing interests.
Author Contributions
• Sergio F. Nigenda-Morales conceived and designed the experiments, performed the
experiments, analyzed the data, contributed reagents/materials/analysis tools, prepared
figures and/or tables, authored or reviewed drafts of the paper, approved the final draft.
• Ryan J. Harrigan conceived and designed the experiments, analyzed the data, contributed
reagents/materials/analysis tools, authored or reviewed drafts of the paper, approved the
final draft.
• Robert K. Wayne conceived and designed the experiments, contributed reagents/-
materials/analysis tools, authored or reviewed drafts of the paper, approved the final
draft.
Nigenda-Morales et al. (2018), PeerJ, DOI 10.7717/peerj.4512 19/25Animal Ethics
The following information was supplied relating to ethical approvals (i.e., approving body
and any reference numbers):
This research was done following UCLA’s Office of Animal Research Oversight approved
protocols #2011-121-02 and #2011-121-03.
Data Availability
The following information was supplied regarding data availability:
The raw and processed data for geographic locations, phenotypic measurements and
environmental variables used in our study is provided as a Supplemental File.
Supplemental Information
Supplemental information for this article can be found online at http://dx.doi.org/10.7717/
peerj.4512#supplemental-information.
REFERENCES
Allen JA. 1877. The influence of physical conditions in the genesis of species. Radical
Review 1:108–140.
Ashoub MA. 1958. Effect of two extreme temperatures on growth and tail-length of mice.
Nature 181:284 DOI 10.1038/181284a0.
Ashton KG, Tracy MC, De Queiroz A. 2000. Is Bergmann’s rule valid for mammals?
American Naturalist 156:390–415 DOI 10.1086/303400.
Bartlein PJ, Anderson KH, Anderson PM, Edwards ME, Mock CJ, Thompson RS,
Webb RS, Webb III T, Whitlock C. 1998. Paleoclimate simulations for North
America over the past 21,000 years: features of the simulated climate and com-
parisons with paleoenvironmental data. Quaternary Science Review 17:549–585
DOI 10.1016/S0277-3791(98)00012-2.
Bergmann C. 1847. Über die Verhältnisse der wärmeokönomie der Thiere zu ihrer
Grösse. Göttinger Studien 3:595–708.
Berteaux D, Réale D, McAdam AG, Boutin S. 2004. Keeping pace with fast climate
change: can artic life count on evolution? Integrative and Comparative Biology
44:140–151 DOI 10.1093/icb/44.2.140.
Blackburn TM, Ruggiero A. 2001. Latitude, elevation and body mass variation
in Andean passerine birds. Global Ecology and Biogeography 10:245–259
DOI 10.1046/j.1466-822X.2001.00237.x.
Boyce MS. 1979. Seasonality and patterns of natural selection for life histories. American
Naturalist 114:569–583 DOI 10.1086/283503.
Bradshaw WE, Holzapfel CM. 2006. Evolutionary response to rapid climate change.
Science 312:1477–1478 DOI 10.1126/science.1127000.
Breiman L. 2001. Statistical modeling: the two cultures (with comments and a rejoinder
by the author). Statistical Science 16:199–231 DOI 10.1214/ss/1009213726.
Brocke RH. 1970. The winter ecology and bioenergetics of the opossum, Didelphis
marsupialis, as distributional factors in Michigan. PhD Thesis, Michigan State
University.
Nigenda-Morales et al. (2018), PeerJ, DOI 10.7717/peerj.4512 20/25Buermann W, Saatchi S, Smith TB, Zutta BR, Chaves JA, Milá B, Graham CH.
2008. Predicting species distributions across the Amazonian and Andean
regions using remote sensing data. Journal of Biogeography 35:1160–1176
DOI 10.1111/j.1365-2699.2007.01858.x.
Burtt EH, Ichida JM. 2004. Gloger’s rule, feather-degrading bacteria, and color variation
among song sparrows. The Condor 106:681–686 DOI 10.1650/7383.
Caro T. 2005. The adaptive significance of coloration in mammals. Bioscience
55:125–136 DOI 10.1641/0006-3568(2005)055[0125:TASOCI]2.0.CO;2.
Chaplin G. 2004. Geographic distribution of environmental factors influencing hu-
man skin coloration. American Journal of Physical Anthropology 125:292–302
DOI 10.1002/ajpa.10263.
Clarys P, Alewaeters K, Lambrecht R, Barel AO. 2000. Skin color measurements:
comparison between three instruments: the chromameter, the dermaspectrometer
and the mexameter. Skin Research and Technology 6:230–238
DOI 10.1034/j.1600-0846.2000.006004230.x.
Cooper ML. 1998. Geographic variation in size and shape in the southern brown
bandicoot, Isoodon obesulus (Peramelidae: Marsupialia), in western Australia.
Australian Journal of Zoology 46:145–152 DOI 10.1071/ZO97057.
Cordero GA, Epps CW. 2012. From desert to rainforest: phenotypic variation
in functionally important traits of bushy-tailed woodrats (Neotoma cinerea)
across two climatic extremes. Journal of Mammalian Evolution 19:135–153
DOI 10.1007/s10914-012-9187-0.
Cutler DR, Edwards Jr TC, Beard KH, Cutler A, Hess KT, Gibson J, Lawler J.
2007. Random forests for classification in ecology. Ecology 88:2783–2792
DOI 10.1890/07-0539.1.
Elias PM. 2007. The skin barrier as an innate immune element. Seminars in Im-
munopathology 29:3–14 DOI 10.1007/s00281-007-0060-9.
Endler JA. 1977. Geographic variation, speciation, and clines. Princeton: Princeton
University Press.
Evans JS, Murphy MA, Holden ZA, Cushman S. 2011. Modeling species distribution
and change using random forest. In: Drew CA, Wiersma Y, Huettmann F, eds.
Predictive species and habitat modeling in landscape ecology. New York: Springer,
139–159.
Fullerton A, Keiding J. 1997. A comparison between a tristimulus colorimeter
(Minolta ChromaMeter CR-200) and two spectrophotometers (Minolta Spec-
trophotometer CM-508i and CM-2002). Quantification of UV-B induced
erythema in a hairless guinea pig. Skin Research and Technology 3:237–241
DOI 10.1111/j.1600-0846.1997.tb00191.x.
Gardner AL. 1973. The systematics of the genus Didelphis (Marsupialia: Didelphidae)
in North and Middle America. Special Publications Museum Texas Tech University
4:1–81.
Gardner AL, Sunquist ME. 2003. Opossum, Didelphis virginiana. In: Feldhamer GA,
Thompson BC, Chapman JA, eds. Wild mammals of north America. Baltimore: Johns
Hopkins University Press, 3–29.
Nigenda-Morales et al. (2018), PeerJ, DOI 10.7717/peerj.4512 21/25You can also read