Energy & Environmental Science - PAPER - RSC Publishing
←
→
Page content transcription
If your browser does not render page correctly, please read the page content below

Energy &
Environmental
Science
View Article Online
PAPER View Journal
Multi-length scale microstructural design of
This article is licensed under a Creative Commons Attribution 3.0 Unported Licence.
Open Access Article. Published on 17 September 2021. Downloaded on 10/15/2021 10:50:58 AM.
lithium-ion battery electrodes for improved
Cite this: DOI: 10.1039/d1ee01388b
discharge rate performance†
Xuekun Lu, *abc Xun Zhang,d Chun Tan, ac Thomas M. M. Heenan,ac
Marco Lagnoni, e Kieran O’Regan, cf Sohrab Daemi,a Antonio Bertei, e
Helen G. Jones,b Gareth Hinds,b Juyeon Park,b Emma Kendrick, cf
Dan J. L. Brett ac and Paul R. Shearing *ac
Fast discharge capability of automotive batteries not only affects the acceleration and climbing
performance of electric vehicles, but also the accessible driving range under complex driving cycles.
Understanding the intricate physical and chemical processes across multiple length-scales is critical to assist
the strategic design of electrodes for improved rate performance. Here, we correlate the discharge rate
performance of Ni-rich LiNi1 x yCoxMnyO2 (NMC) cathodes to the electrode architectures, ranging from the
crystallographic orientations, surface morphology and cracks at single particle level, to the factors that affect
the dominance of the solid and liquid-state transport (SST and LST) at electrode level. A random orientation
of the primary particles is found to incur an increase of the SST resistance by a factor of 2.35 at 5C and a
heterogeneous intra-particle lithiation. Internal cracks significantly restrict the accessibility to the active
material. Double-layered particles are proved to be a more promising candidate than single-crystal particles.
At electrode level, the SST-dominance depth is quantified for the first time to guide the microstructural
tuning and rational operating windows are proposed for electrodes of various architectures. The reaction
Received 9th May 2021, front is observed to shuttle across the electrode depth to mitigate the polarization, which can provide
Accepted 13th September 2021 valuable insights into the battery management development. Finally, by comparing the performance of
DOI: 10.1039/d1ee01388b single crystal and polycrystalline NMC811 electrodes, it is suggested that electrode thickness and porosity
are more critical in the former for enhanced discharge rate performance, in contrast to polycrystalline
rsc.li/ees electrodes, in which a gradient particle fraction and size distribution are recommended.
Broader context
Electrified transportation is regarded as a global strategy to mitigate the air pollution and promote low-carbon economy. More than 10 million electric vehicles
hit the roads all over the world in 2020 despite the Covid pandemic. Breakthroughs in the design and manufacturing of the next-generation automotive lithium-
ion batteries can further improve the market penetration of electric vehicles. Ni-rich layered transition metal oxide materials such as NMC are promising
cathodes due to their high energy density. However, they are susceptible to substantial capacity under-utilization due to the polarization arising from transport
dynamics both at the particle and electrode level, which could deteriorate due to defects and microstructural degradation over long-term cycling. This study
aims to elucidate the multi-length scale microstructural design strategies for both single crystal and polycrystalline NMC electrodes, assisted by a combined
microstructure-resolved 3D model and electrochemical tests to improve the discharge rate performance. These insights are easily transferrable to other battery
chemistries such as sodium-ion battery and solid-state batteries. The knowledge of spatial dynamics during lithiation is also conducive to the development of
advanced driving cycles and battery management systems (BMS) for the electric vehicles.
a
Electrochemical Innovation Lab, Department of Chemical Engineering, University College London, London, WC1E 7JE, UK. E-mail: xuekun.lu@ucl.ac.uk,
p.shearing@ucl.ac.uk
b
National Physical Laboratory, Hampton Road, Teddington, Middlesex, TW11 0LW, UK
c
The Faraday Institution, Quad One, Harwell Science and Innovation Campus, Didcot, OX11 0RA, UK
d
Henry Moseley X-ray Imaging Facility, School of Materials, The University of Manchester, Manchester M13 9PL, UK
e
Department of Civil and Industrial Engineering, University of Pisa, Pisa, 56122, Italy
f
School of Metallurgy and Materials, University of Birmingham, Birmingham B15 2TT, UK
† Electronic supplementary information (ESI) available. See DOI: 10.1039/d1ee01388b
This journal is © The Royal Society of Chemistry 2021 Energy Environ. Sci.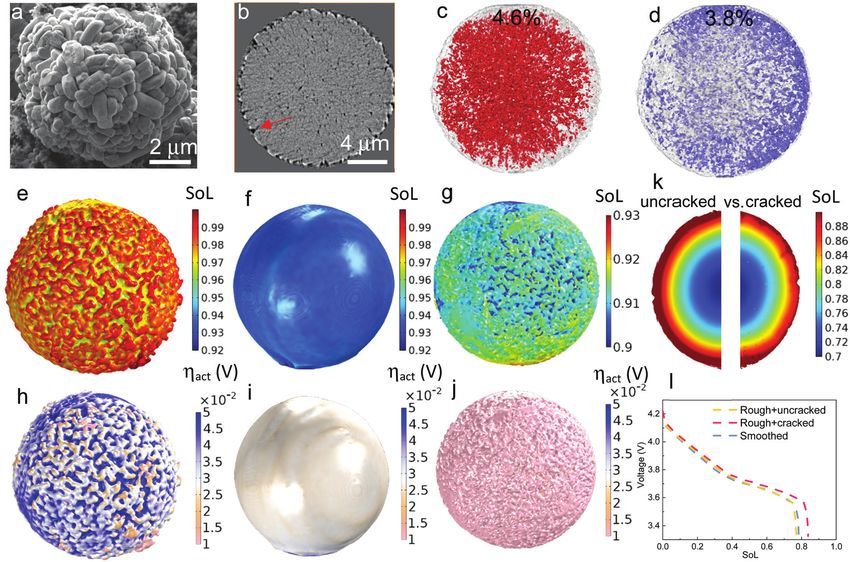
View Article Online
Paper Energy & Environmental Science
1. Introduction surface area leads to low coulombic efficiency and severe
electrolyte decomposition.21,22 Tailoring the ratio between
Lithium-ion batteries (LiBs) have undergone rapid advancements small and large particles is a simple but effective solution.
in the last three decades since their first appearance on the However, an electrode with a mixture of small and large
market, and now play a critical role in automotive electrification particles could lead to uneven distribution of state-of-lithiation,
due to their superior power and energy densities. Despite the reactivity,9 heat generation23 and aging. While large particles
recent growth, the driving range, rate capabilities and cost are are more susceptible to mechanical failure during long-term
recognized as predominant factors limiting further market cycling,15 small particles introduce faster chemical degradation
penetration of electric vehicles (EVs).1 While a concerted effort and a lower onset temperature of thermal runaway.24 Thus, a
This article is licensed under a Creative Commons Attribution 3.0 Unported Licence.
Open Access Article. Published on 17 September 2021. Downloaded on 10/15/2021 10:50:58 AM.
has been made on the breakthrough of LiB technologies to target sensible mixture ratio (i.e., particle size distribution, PSD) is
an energy density of 500 W h kg 1 with a charging time of less critical to improve the electrochemical performance while
than 10 minutes, fast discharge capability of automotive batteries, maintaining good durability and safety. However, this is often
which not only heavily affects the acceleration and climbing achieved by manipulating the PSD ratio of D30, D50 and D90
performance, but also the driving range under complex driving (‘D90’ represents the particle size that is larger than 90% of the
cycles,2 has become another challenge to be addressed. It is particles in the electrode) of the electrode based on empirical
predominantly determined by cathodes due to the low electronic optimization and ‘know-how’ in manufacturing processes. The
conductivity3 and Li+ ion transport resistance in both the liquid rational design criteria for high performance electrodes remain
and solid phase,4 particularly in Ni-rich NMC electrodes. either largely unknown, or a closely guarded industrial secret,
However, the optimal electrode design for energy and power- and consequently this information is sparse in the literature.
oriented cells differs significantly and often leads to trade-offs.5 LST and SST are two complementary transport mechanisms
For instance, thicker electrodes, low porosity and heavy that govern the performance of a cell, depending on the
calendering are common material design strategies for high operating conditions and microstructural design of the electrode.
energy density cells, which inevitably suffer from large polar- In general, LST is rate determining for energy-oriented cells that
ization due to the poor percolation and high tortuosity of the are heavily calendered or fabricated with thick electrodes, but for
pore network,6,7 consequently sacrificing the rate capability of power-oriented cells with high porosity or low mass loading
the cell.8 Accordingly, researchers have been exploring either (i.e., thin electrodes), SST often outweighs LST in determining
advanced electrode architectures, such as gradient porosity/ the rate performance. However, it should be noted that the
pore size9,10 and directional pore phase architectures,11 or polarization associated with SST in thick electrodes is more severe
innovational flexible 1D batteries with hybrid electrodes to compared to thinner electrodes due to the increased capacity and
overcome this challenge.12 Despite the remarkable performance thus the higher current density at the same C-rate. Moreover, the
improvement of these designs, the scalability, cost and structural locally high current density in the vicinity of the separator, which
integrity remain of concern for large-scale electrode manufacturing is more significant in thick electrodes, can exacerbate the local
and commercialization. Although Ni-rich NMC electrodes can polarization due to the SST resistance. Accordingly, electrodes
mitigate the microstructure limitation, they are known to suffer fabricated with a gradient particle size across the thickness
from capacity loss due to the chemical and mechanical direction have been investigated.9,25,26 Nonetheless, understanding
degradation mechanisms such as Ni2+/Li+ disordering,13 of the competition between the two rate-limiting mechanisms
surface reconstruction14 and particle cracking15 at high cutoff for different electrode designs under different conditions is
voltage or long-term cycling. scarce but would provide valuable input to rationalizing
Apart from the liquid-state transport (LST) of Li+ ions, the electrode manufacturing for next-generation automotive LiBs.
solid-state transport (SST) resistance of the intercalated lithium In addition to the electrode level, the architecture at the
is another main factor that restricts the rate capability, particle length-scale also significantly affects the discharge rate
particularly for electrodes composed of large particles that have performance in high energy density LiBs. In poly-crystalline
longer solid-state diffusion paths.16 This results in a large materials, the random arrangement of crystallographic orientations
concentration gradient, and therefore higher polarization, from of the primary particles within the secondary particles and the
the surface to the core of the active material particle and an presence of internal defects (e.g., cracks and voids) are closely
electrochemical shielding effect due to surface saturation of the linked to anisotropic deformation, heterogeneous lithiation and
intercalated lithium. As a consequence, the nominal capacity is high mass transport resistance that undermine the electrochemical
underutilized, particularly at high C-rates,17 while at the anode performance at the particle level and lead to early degradation.
safety can be compromised by lithium dendrite formation. Kim et al.27 developed LiNi1 x yCoxMnyO2 (NMC) particles with
Another disadvantage of large-particle electrodes is the slow a gradient concentration distribution of transition metals and
reaction kinetics due to the low specific reaction area. Thus, radially-aligned primary particles that showed a marked reduction
nanostructured electrodes have been proposed to tackle these in grain boundary crack propagation. Heterogeneous stress/strain
issues;18–20 however the large surface area requires more between primary particles can also be alleviated. This design is
conductive carbon and binder additives to maintain the believed to exhibit faster SST due to the mitigated intra-particle
good electronic percolation and adhesion of the electrode, anisotropy. However, few studies have managed to quantify the
undermining the volumetric energy density. Furthermore, large impact of intra-particle architecture and cracking on the rate
Energy Environ. Sci. This journal is © The Royal Society of Chemistry 2021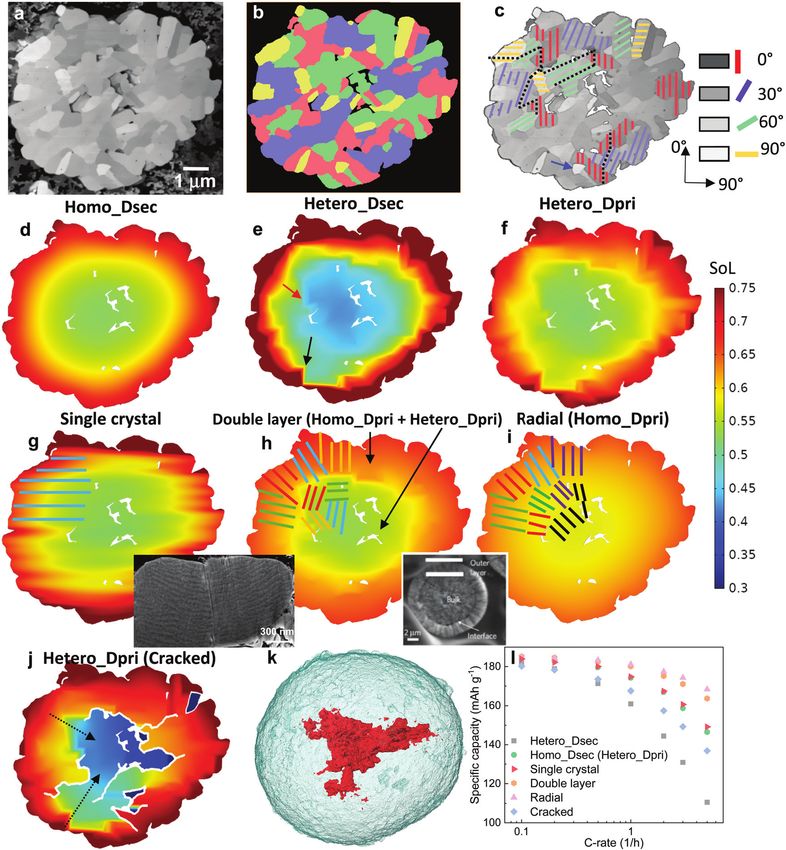
View Article Online
Energy & Environmental Science Paper
capability, which is necessary to guide the microstructural design. state of charge, SOC), followed by a relaxation step, then
Moreover, the surface roughness of the secondary particles, as discharged for 45 mins CC (C/10, 7.5% SOC), followed by a
a consequence of the random orientation of the primary particles relaxation step before starting the next measurement point
at the outer surface, has also been reported to facilitate the (i.e., step size is 10% SOC). All the relaxation periods were set
power performance28 due to more active reaction sites and to be 4 hours relaxation to ensure equilibrium condition.
therefore lower effective charge transfer current density, but is This discharge/relaxation + pulse/relaxation cycle was repeated
rarely quantified. until reaching the cut-off voltage of 2.8 V. The solid-state
This work aims to elucidate the strategies of multi-length diffusion coefficient was also measured by analysing the GITT
scale electrode microstructural design by unravelling the inter- curve according to the previously developed methodology.30
This article is licensed under a Creative Commons Attribution 3.0 Unported Licence.
Open Access Article. Published on 17 September 2021. Downloaded on 10/15/2021 10:50:58 AM.
play of electrochemical performance with the microstructure
characteristics ranging from primary particles up to the 2.3 X-ray nano-computed tomography for NMC811 electrodes
electrode level, assisted by a combined microstructure- and a single secondary particle
resolved 3D model and electrochemical tests. The impact of The SC and PC NMC811 electrodes were firstly cut by a
the crystallographic arrangement of primary particles, cracks handheld punch to extract 1 mm disks, which were subse-
and surface roughness on the discharge rate performance is quently mounted onto the tip of a pin by epoxy, followed by
evaluated. The efficacy of advanced particle structures is laser milling31 to reduce the sample diameter to approx. 70 mm
examined. At the electrode level, the competition between SST for improved transmission and contrast. The prepared
and LST is highlighted for a variety of different electrode electrode pillars were then scanned using a Zeiss Xradia Ultra
designs. Building on these insights, a practical mixture ratio 810 X-ray microscope (Carl Zeiss, CA, USA),32 which provides a
of small/large particles (i.e., PSD) is proposed. This study also quasi-monochromatic parallel beam with an energy of 5.4 keV.
identifies for the first time a spatial self-balancing mechanism 1201 projections at an exposure time of 60 seconds per frame
that highlights the utility of gradient electrode design. Finally, were taken sequentially over 1801 rotation. The scans were
the rate performance of single crystal (SC) and polycrystalline captured with camera binning 2, achieving a voxel size of
(PC) NMC811 electrodes is compared to provide new insights 126 nm and a field of view of 64 64 mm2. A standard filtered
into the microstructural design and optimization of electrodes back-projection algorithm33 was used for the 3D reconstruction,
for next-generation automotive LiBs. which was then imported into the commercial software package
Avizo V9.5 (Avizo, Thermo Fisher Scientific, Waltham,
Massachusetts, U.S.) for post-reconstruction analysis. The inter-
2. Experimental nal cracks in Fig. 1j were visualized by extracting the boundaries
2.1 Materials of neighbouring primary particles, followed by image processing
to control the length of the crack to obtain the target crack
SC and PC NMC811 electrodes manufactured by Li-FUN Technology density. In the single particle simulation, surface cracks were
Corp. Ltd (China) were used in this study. The mass loading of removed for Case Study 1 (Fig. 2e–h) and Case Study 2 (Fig. 2f–i)
the active material is 95.5% (SC) and 96.4% (PC), corres- using the morphological operation method ‘closing’;34 the
ponding to areal loadings of 16.7 mg cm 2 and 18 mg cm 2, smooth surface in Case Study 2 was achieved by applying a
respectively. Both types of electrodes were calendered to a smoothing filter on the particle domain.
density of 3.3 g cm 3. The aluminium current collector was
15 mm thick. These two types of electrodes were assembled into 2.4 Physics-based microstructure-resolved model
coin cells (half-cells) as the positive electrode (15 mm diameter), Electrochemical simulations were performed on 4 types of data
with lithium metal as the negative electrode (16 mm diameter), in this study: (1) 2D secondary particle cross section; (2) 3D
and Celgard 2325 (19 mm) as the separator. 80 mL of 1 M LiPF6 in secondary particle (nano-CT); (3) 3D electrodes of different
ethylene carbonate (EC)/ethyl methyl carbonate (EMC) (3 : 7 v/v) + particle size (generated by open-source Python code Porespy35);
1 wt% vinylene carbonate (VC, Soulbrain, USA) was used as the (4) 3D electrodes of SC and PC electrode (nano-CT). Except for
electrolyte. the first case, in which the secondary particle was divided into
four subgroups of the primary particles according to the grey-
2.2 Electrochemical performance tests scale value, all the 3D geometries were first segmented to
Prior to the rate capability test, the assembled cells underwent a binary data (solid particle and everything else) using the
formation step composed of constant current–constant voltage marker-based watershed method,36 and were then imported
(CC–CV) charge at C/10 (C/40 cut-off) and CC discharge at C/10 to the commercial software Simpleware ScanIp for adaptive
from 4.2 V to 2.8 V for two cycles on BCS battery cyclers meshing. The carbon-binder domain (CBD) was lumped into the
(Biologic, France). The capacity of these two types of cells was non-solid domain (NSD) with the pore phase, with the effective mass
measured to be 4.4 mA h (2.49 mA h cm 2, SC) and 4.9 mA h transport parameters (i.e., porosity and tortuosity) assigned based on
(2.77 mA h cm 2, PC), respectively. GITT29 was conducted to the microstructure-resolved CFD modelling (Fig. S11, ESI†). The
measure the OCV of NMC811 vs. Li/Li+ for each type of generalized Poisson–Nernst–Planck (gPNP) mathematical model,37
electrode (Fig. S7, ESI†). The first measurement point started a derivative of the Newman battery model,38 was implemented
from 4.2 V. The cell was discharged at C/10 for 15 min (2.5% in COMSOL Multiphysics V5.5 by assigning partial differential
This journal is © The Royal Society of Chemistry 2021 Energy Environ. Sci.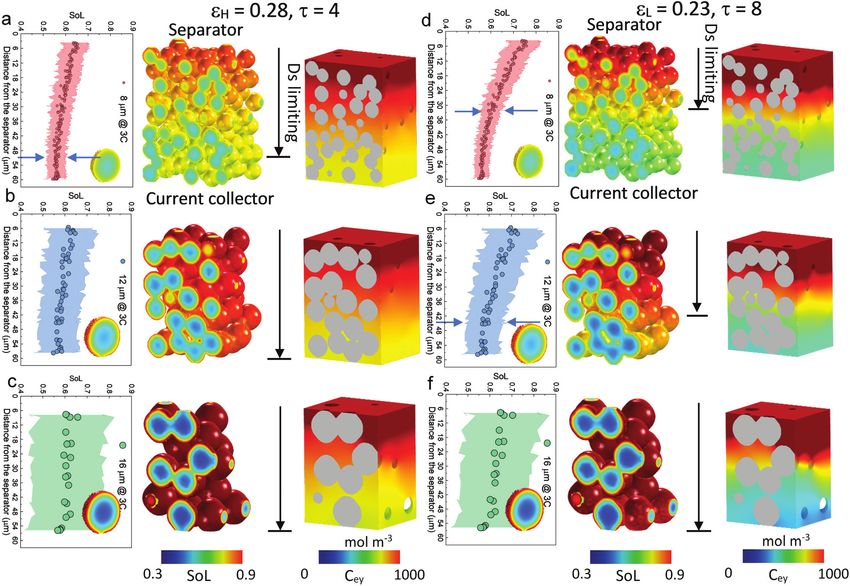
View Article Online

                                                                                                   Paper                                                                                                       Energy & Environmental Science
             This article is licensed under a Creative Commons Attribution 3.0 Unported Licence.
Open Access Article. Published on 17 September 2021. Downloaded on 10/15/2021 10:50:58 AM.

                                                                                                   Fig. 1 The dependence of discharge rate performance on the microstructural heterogeneity within a single secondary NMC particle. (a) SEM image
                                                                                                   showing the random arrangement of primary particles, which are (b) classified into four groups (denoted by different colours) according to their
                                                                                                   grayscale values; (c) a monotonic change of the crystallographic orientation associated with the greyscale is defined for primary particles of each
                                                                                                   group, with the dotted lines schematically showing the tortuous SST pathway; (d) a particle level electrochemical simulation using a solid-state
                                                                                                   diffusion coefficient Dsec measured by the GITT experiment, homogenizing the effect of intra-particle orientation; (e) a single particle simulation
                                                                                                   accounting for the intra-particle heterogeneity by assigning orientation-dependent diffusivity of each primary particle; (f) the particle shows identical
                                                                                                   performance as (d) when using a primary particle diffusion coefficient Dpri that is 3.05 times larger than Dsec; (g) SoL simulated on an SC NMC
                                                                                                   particle. The inset shows the planar structure on the cross section. More SEM images can be found in Fig. S3 (ESI†); (h) simulated performance with a
                                                                                                   double-layered structure (the inset is reproduced with permission43) and (i) radially-aligned primary particles; (j) the effect of internal cracks on
                                                                                                   capacity loss and lithiation heterogeneity; (k) 3D visualization of an internal crack in an NMC secondary particle after long-term cycling; (l)
                                                                                                   comparison of the rated capacity for different cases. The colourmap in (d)–(j) shows the lithium concentration distribution at 60% state-of-lithiation
                                                                                                   (SoL) at 5C.

                                                                                                   governing equations (PDEs) to solve for potential in the                     reaction kinetics and the exchange current density was
                                                                                                   electron-conducting (NMC and CBD) and ion-conducting (pore)                  expressed as a function of the concentration of the reactants
                                                                                                   phases, lithium concentration in NMC (Fick’s law) and electro-               in the electrolyte and active material. The detailed mathematical
                                                                                                   lyte salt concentration in the pore phase (concentrated solution             description of the model, parameters and boundary conditions
                                                                                                   theory).37,39 The Butler–Volmer equation was used for the                    are presented in the ESI.†

                                                                                                   Energy Environ. Sci.                                                                          This journal is © The Royal Society of Chemistry 2021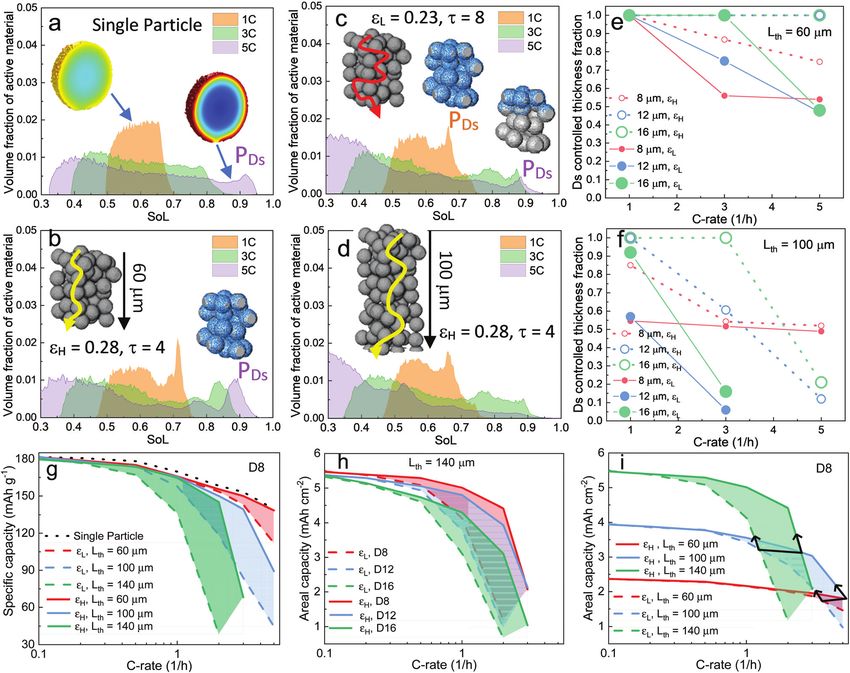
View Article Online

                                                                                                   Energy & Environmental Science                                                                                                                      Paper
             This article is licensed under a Creative Commons Attribution 3.0 Unported Licence.
Open Access Article. Published on 17 September 2021. Downloaded on 10/15/2021 10:50:58 AM.

                                                                                                   Fig. 2 The dependence of discharge rate performance on the surface morphology of a 16 mm secondary NMC particle. (a) SEM image showing the
                                                                                                   surface roughness due to the random arrangement of primary particles; (b) a cross-sectional slice showing the surface roughness and cracks of the
                                                                                                   secondary particle scanned by X-ray nano-CT; (c) internal voids (red) and (d) surface cracks (purple) shown within the particle (semi-transparent); (e)–(g)
                                                                                                   and (h)–(j) show SoL and activation overpotential distribution respectively at 80% DoD simulated at 1C accounting for the surface roughness, neglecting
                                                                                                   the surface roughness and accounting for both surface roughness and cracks; (k) cross-sectional view to compare the SoL with (right) and without (left)
                                                                                                   surface cracks; (i) comparison of the discharge curves for each case.

                                                                                                   3. Results and discussion                                                      study by neglecting the in-plane angle, which is interchange-
                                                                                                   3.1 Crystalline orientation and internal defects in secondary                  able with the other depending on the cutting plane for
                                                                                                   particles                                                                      observation. In the later part of the study, the 3D solid-state
                                                                                                                                                                                  diffusion will be compared with the simplified 2D case here.
                                                                                                   Fig. 1a shows the SEM image of a cross section of a representative             3D EBSD is the planned future work in order to reconstruct the
                                                                                                   PC secondary NMC particle (more secondary particles like this                  full orientation map for individual primary particles. The SST
                                                                                                   can be seen in Fig. S1, ESI†), in which randomly arranged                      resistance induced by the internal heterogeneity of the crystal-
                                                                                                   primary particles are observed, identifiable by distinct grayscale             lographic orientations is schematically illustrated in Fig. 1c, as
                                                                                                   contrast that is associated with the crystallographic orientation              the intercalated lithium preferentially diffuses along the
                                                                                                   of these particles relative to the inspection plane. In addition,              layered plane as indicated by the black dotted lines.
                                                                                                   internal voids left over from the powder sintering process are                    To evaluate the impact of primary particle arrangement, two
                                                                                                   evident. The primary particles may be classified into four                     types of single-particle lithiation (5C discharge) simulation are
                                                                                                   groups (Fig. 1b), with each group representing an in-plane                     performed (see model details in the ESI†). The first model
                                                                                                   crystallographic orientation (i.e., 01, 301, 601 and 901, Fig. 1c),            homogenizes the internal microstructure by adopting a
                                                                                                   according to their grayscale values. Although the assumed                      volume-averaged diffusion coefficient in the NMC622
                                                                                                   brightness vs. orientation relationship could be reversed, this                secondary particles Dsec (Homo_Dsec, Fig. 1d) measured by
                                                                                                   makes only a trivial difference due to the high randomness                      the Galvanostatic Intermittent Titration Technique (GITT) from
                                                                                                   of the primary particle arrangement, as will be proved later.                  a previous study17 (concentration-dependent). The second
                                                                                                   The coloured solid lines schematically indicate the transition                 model accounts for the intra-particle heterogeneity (Hetero_-
                                                                                                   metal planes in the layered crystal structure (the c-axis aligns in            Dsec, Fig. 1e) by assigning different orthogonal diffusion
                                                                                                   the normal direction). Note that the greyscale intensity of the                coefficients for each primary particle according to its group,
                                                                                                   primary particle is associated with the backscattered electrons                so that Dsec is oriented in the vertical direction for the red
                                                                                                   that are primarily dependent on the out-of-plane angle of c-axis,              primary particles (i.e., crystalline diffusion coefficient Dy = Dsec)
                                                                                                   thus the 3D crystallography can be simplified to 2D in this                    and zero in the horizontal direction (Dx = 0), and vice versa for

                                                                                                   This journal is © The Royal Society of Chemistry 2021                                                                               Energy Environ. Sci.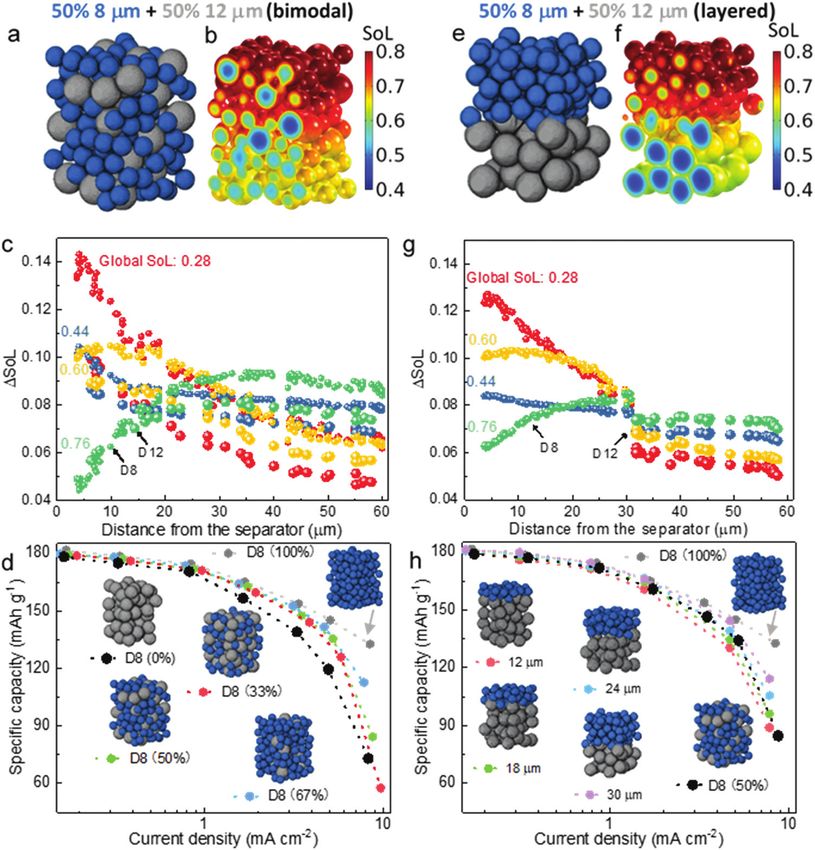
View Article Online
Paper Energy & Environmental Science
the yellow primary particles. For the purple particles, Dy = Dsec structurally, have aroused wide attention. Recently, researchers
cos(301) and Dx = Dseccos (601), and vice versa for the green managed to fabricate secondary particles with a double-layered
particles. Results at 60% state-of-lithiation (SoL) are compared. structure, in which the outer layer (approx. one-third of the
It is shown that the homogenized model (Fig. 1d) predicts a radius) is composed of side-by-side aligned primary particles
much smoother concentration gradient compared to the het- (inset in Fig. 1h)43 accompanied by a concentration gradient of
erogeneous one (Fig. 1e), in which a strongly non-uniform Ni and Mn from the outer surface to the core to suppress
lithium concentration is observed. It is noted that neighbour- chemical degradation at the electrode/electrolyte interface.
ing primary particles of large-angle crystallographic orientation The benefit of this design in facilitating SST is evidenced
(i.e., the red/yellow primary particle interface indicated by the by a smoothed concentration gradient at the outer layer
This article is licensed under a Creative Commons Attribution 3.0 Unported Licence.
Open Access Article. Published on 17 September 2021. Downloaded on 10/15/2021 10:50:58 AM.
black arrow and purple/yellow by the red arrow) render a sharp (i.e., a decreased transport resistance) in Fig. 1h, compared to
concentration gradient at the particle boundaries. Large SST the original arrangement (Fig. 1g). The alleviation of concen-
resistance associated with restricted diffusion paths resulting tration saturation at the electrode/electrolyte interface is critical
from crystalline heterogeneity leads to capacity underutilization. for fast reaction kinetics and thus low polarization. A secondary
The SoL distribution simulated using the reversed brightness vs. particle with fully radially-aligned primary particles is also
orientation relationship as defined in Fig. 1c is shown in Fig. S2 added for comparison; the SST resistance is trivial and good
(ESI†), which is macroscopically similar to Fig. 1e, and identical lithiation homogeneity is obtained (Fig. 1i).
in terms of rated capacity. This is not surprising as the primary Internal defects, either originating from the material synthesis
particle arrangement is fairly random so that the final result is process or formed due to heterogeneous stress/strain after
independent of the hypothesis of the brightness vs. orientation aggressive or long-term cycling, particularly in the PC secondary
relationship. However, a localized difference between the two particles,44 also play an important role in the particle
cases is observed; for instance, a narrow and elongated low performance. Fig. 1j shows a simulation of the same secondary
concentration zone in Fig. S2 (ESI†) (indicated by the black particle with internal cracks initiating from internal defects (i.e.,
arrow) aligned parallel to the c-axis of the primary particle at voids), with the crack density being manipulated (more details in
this position (i.e., large diffusion resistance). This low concen- Experimental section 2.3) to be quantitatively consistent with the
tration zone also initiates from the interface of the red/yellow image of the cracked NMC particle after cycling (Fig. 1k, 3D crack
primary particles. A sharp concentration gradient between rendered in red). The cracks partially reduce the percolating
neighbouring primary particles is not favourable for structural network, and as a consequence the core of the secondary particle
integrity due to stress accumulation and cracking over long-term can only be lithiated via the restricted transport pathways
cycling.15,40–42 (indicated by the black dashed arrows), rendering a much higher
Since Dsec measured by GITT is a mean-field parameter tortuosity, which is found to be 1.65 times larger than for the non-
with intra-particle heterogeneity inherently accounted for, cracked electrode in this case (Fig. 1f). Moreover, internal cracks
Homo_Dsec in Fig. 1d represents the real SoL in operation (not connected to the electrolyte bulk) create shielded ‘islands’
whereas Hetero_Dsec in Fig. 1e apparently underestimates the that are inaccessible to lithium flux, as can be seen in Fig. 1j.
SST rate; in other words, the crystalline diffusion coefficient of These factors lead to an underutilization of the cell capacity.
the primary particle Dpri, must be much larger than Dsec to Fig. 1l compares the rated capacity for the simulated particles in
produce an identical SoL pattern to that in Fig. 1d. This ratio is Fig. 1d–j. The arrangement of radially-aligned primary particles
found to be Dpri = 3.05Dsec and the associated SoL map provides the optimal rate performance, exhibiting a drastic
predicted by the corrected Dpri is shown in Fig. 1f, meaning improvement compared to the as-synthesized NMC particle
that the intra-particle heterogeneity yields a tortuosity of (green). The SC particle (red) shows similar performance
3.05 for solid-state diffusion. The third row of Fig. 1 compares compared to the same-sized PC secondary particle. The influence
three different arrangements of primary particles: Fig. 1g shows of internal heterogeneity is highlighted by comparing the case of
the SoL distribution simulated on an SC NMC particle, i.e., the Fig. 1e (dark grey) with the green plot. This adverse effect is even
lithium transport pathway is along the planar orientation more impactful than structural degradation due to cracking
(illustrated by the schematic). The inset is a FIB-SEM image (blue), as evidenced by the aforementioned increase of the
displaying the planar structure on the cross section of the SC tortuosity (3.05 vs. 1.65). Note that the double-layer arrangement
NMC particle (more SEM images shown in Fig. S3, ESI†). (orange) shows trivial disparity compared to the radially-aligned
Comparing with Fig. 1f, the SC particle does not provide particle design, indicating that the outer layer plays a dominant
significant improvement of lithium transport capability, role in determining the overall rate performance and should be
primarily arising from the restricted diffusion (along the planar the main focus for structural optimization.
direction) in comparison to the PC design where lithium
diffuses inward from the entire periphery. Note that the SC 3.2 Surface roughness and cracks in secondary particles
NMC particles are normally much smaller than the PC Apart from the intra-particle heterogeneity, surface roughness
particles, and therefore offer faster SST, whereas the and surface cracks are the other characteristic features that
comparison here solely highlights the transport affected by could affect the reaction kinetics and diffusion dynamics at the
the crystal orientations given the same particle size. Apart from particle level. The former arises from the random arrangement
SC design, gradient secondary particles, either chemically or of the primary particles at the secondary particle surface while
Energy Environ. Sci. This journal is © The Royal Society of Chemistry 2021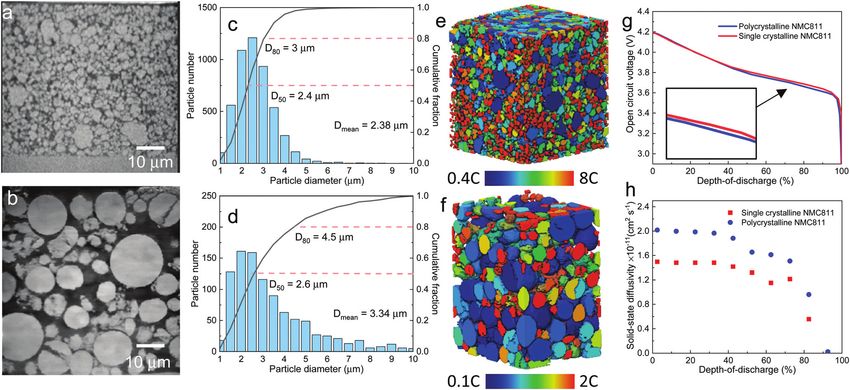
View Article Online

                                                                                                   Energy & Environmental Science                                                                                                                      Paper

                                                                                                   the latter are defects from the sintering process of NMC                       effective reaction area and thus a higher activation over-
                                                                                                   precursor. Fig. 2a and b show the morphology of surface                        potential (Fig. 2h). In comparison, the particle with a smoothed
                                                                                                   roughness under SEM and X-ray nano-computed tomography                         surface exhibits a uniform lithiation state and less surface
                                                                                                   (Nano-CT) respectively. The internal voids and surface cracks                  saturation (Fig. 2f), which suppresses the heterogeneous
                                                                                                   (indicated by a red arrow in Fig. 2b) obtained from the 3D                     surface reactivity and the activation overpotential (Fig. 2i). This
                                                                                                   reconstruction are visualized in Fig. 2c and d, with each taking               poses a question over whether high surface roughness and
                                                                                                   up 4.6% and 3.8% volume fraction of the secondary particle,                    therefore higher specific reaction area (1.12 mm 1, compared to
                                                                                                   respectively. To evaluate the impact of surface roughness and                  the smoothed particle 0.82 mm 1) is advantageous for the
                                                                                                   surface cracks on the particle performance, three different                     performance, since the active reaction area is not necessarily
             This article is licensed under a Creative Commons Attribution 3.0 Unported Licence.
Open Access Article. Published on 17 September 2021. Downloaded on 10/15/2021 10:50:58 AM.

                                                                                                   types of discharge (lithiation) simulation are conducted on a                  higher due to the early saturation of the surface ridges, in
                                                                                                   16 mm diameter particle: Fig. 2e–g compare the SoL at 80%                      addition to the potential risk of uneven aging and mechanical
                                                                                                   depth-of-discharge (DoD) at 1C when (1) accounting for surface                 degradation due to the disparity of SoL between the primary
                                                                                                   roughness (Fig. 2e); (2) neglecting surface roughness (Fig. 2f);               particles at the ridge and valley.
                                                                                                   (3) accounting for both surface roughness and surface                              The surface-cracked particle shows the lowest SST resistance,
                                                                                                   cracks (Fig. 2g, details of the model setup is introduced in                   evidenced by a significantly lower surface concentration and
                                                                                                   Experimental section 2.3), whereas Fig. 2h–j compare the                       concentration gradient than the other two cases (Fig. 2g), which
                                                                                                   activation overpotential Zact for each case. Simulations show a                are more visible from the cross-sectional view in Fig. 2k (left:
                                                                                                   higher degree of lithiation of the surface ridges compared to                  uncracked vs. right: cracked). This is because the penetration of
                                                                                                   the valleys (Fig. 2e); as a consequence, the ridges are saturated              surface cracks provides a shorter diffusion path and more
                                                                                                   with lithium where the reaction kinetics and thermodynamics                    lithiation sites from the newly generated surfaces so that lithia-
                                                                                                   (i.e., lower equilibrium potential) are slower and the charge                  tion can take place both in the radial and hoop direction. The
                                                                                                   transfer mostly takes place at the valleys, leading to a lowered               overpotential at the surface is accordingly lower (Fig. 2j) due to

                                                                                                   Fig. 3 Electrochemical simulation (3C discharge, half cell NMC vs. Li anode) in (a) D8 (b) D12 and (c) D16 at high porosity (eH) and (d) D8 (e) D12 and (f)
                                                                                                   D16 at low porosity (eL), respectively. The average SoL and its standard deviation within each particle are plotted alongside each electrode at 60% DoD.
                                                                                                   The inset in each plot presents the single-particle simulation, regarded as a reference to determine the Ds limiting region. Ds varies with SoL, as shown in
                                                                                                   Fig. S8 (ESI†).

                                                                                                   This journal is © The Royal Society of Chemistry 2021                                                                                Energy Environ. Sci.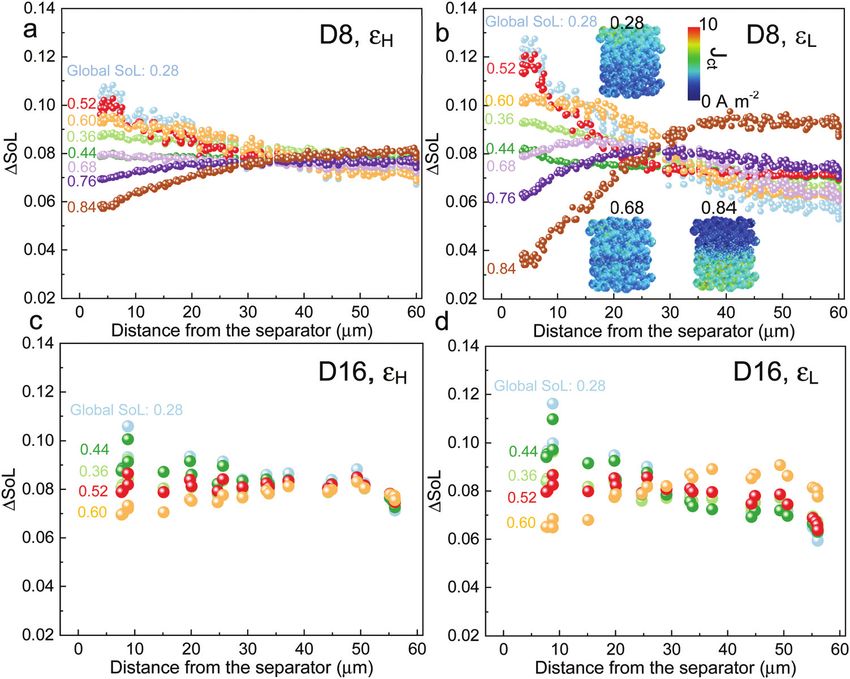
View Article Online
Paper Energy & Environmental Science
the improved reaction kinetics. The discharge curves of the three the predictions for the individual particles of the 3D model.
cases are compared in Fig. 2I, which displays an insignificant Macroscopically the SoL distribution within the particles is
difference between the smoothed particle and the rough but identical along the thickness direction, but the line profile of
uncracked particle. This is in contrast to the rough and surface- the single particle shows a higher SoL in the P2D prediction,
cracked particle, which shows a remarkable performance possibly because the NMC particles in the P2D model are
improvement as long as the surface cracks do not propagate homogenized across the whole simulation domain, free from
deeper into the secondary particle to amalgamate with internal the contact and overlap effect which could alter the internal
cracks. This highlights that SST outweighs reaction kinetics in lithiation.
determining the electrochemical performance at the particle The SoL of each secondary particle and its standard
This article is licensed under a Creative Commons Attribution 3.0 Unported Licence.
Open Access Article. Published on 17 September 2021. Downloaded on 10/15/2021 10:50:58 AM.
level, which is corroborated by the comparison of maximum deviation (STD, the shaded zone) are linked to the SST
accessible C-rate for reaction kinetics vs. SST in Fig. S4 (ESI†) resistance, which is dependent on the nominal solid-state
under a variety of conditions such as different particle size, SoL diffusion coefficient, Ds. The SoL and its STD are plotted
and electrolyte concentration. It is noted that surface cracks are alongside the SoL map for each electrode in Fig. 3. Apart from
not prevalent in fresh electrodes based on the SEM observation the aforementioned larger gradient of SoL in the through-
(Fig. S5, ESI†), but may be formed during fast or long-term thickness direction, eL electrodes exhibit a larger in-plane
cycling and heavy calendering, leading to exacerbated side STD of SoL in the proximity of the separator, particularly for
reactions and electrolyte decomposition at the cathode/electro- D8 and D12 electrodes, due to the gradient of Cey that imposes
lyte interface. a higher local current density at the separator. Moreover, the
STD becomes narrower towards the current collector for these
3.3 Competition between solid-state and liquid-state two types of electrodes, suggesting a decreasing impact of the
transport in governing rate performance SST resistance. In contrast, an insignificant difference in STD
Scaling up from a single secondary particle to the electrode between the separator and current collector is observed for D16
level, PSD and porosity e (and the associated tortuosity, t) are as a consequence of the dominance of SST over LST so that the
the primary material design parameters that significantly electrode thickness and porosity are less important. This
influence the discharge rate performance of the cell by tailoring phenomenon is quantified by conducting single-particle
the SST and LST capability for different energy applications. simulations that rule out the influence of the LST (shown as
Understanding the competition between these two mechanisms insets in each plot). These simulations are regarded as bench-
for different microstructures is critical to optimize the energy marks to assess the depth of the electrode that is dynamically
and power performance of the battery. Here we examine the SST limited by SST (Ds limiting), by identifying the same STD as
in three electrodes (generated by Porespy35) composed of mono- that of the single particle across the depth of the electrode
disperse secondary particles, 8 mm (D8), 12 mm (D12) and 16 mm (indicated by arrows on the plots). Thus, within the Ds limiting
(D16), and different porosities (eH = 0.28 and eL = 0.23 for high depth, the SST is the limiting resistance, while LST resistance
and low porosity respectively) in Fig. 3, where D8 and D16 dominates the remainder of the electrode. It is found that the
correspond to the average (7.5 mm) and upper limit of the Ds limiting depth increases as the particle size becomes larger
particle diameter (16 mm) in commercial NMC622 electrodes for both types of electrodes but decreases with the reduction of
(Fig. S6, ESI†). Note that the volume fractions of NMC particles porosity. For instance, in the D8, eH electrode, 83% of the
are consistent (0.43, corresponding to 90 wt% NMC and an areal electrode depth is primarily governed by SST and this becomes
capacity of 1.5 mA h cm 2) between each electrode, and the 100% with larger particle size, in contrast to 55% (D8) and 75%
porosity is defined as the ratio of the pore volume in the non- (D12) for eL. This finding is consistent with the general design
solid phase (lumped pore + carbon binder domain) to the rules that smaller particles and higher porosity favour SST and
electrode volume. The results of the performance simulation at LST respectively, but provides much needed quantification of
two porosities are presented in Fig. 3a–c and d–f, respectively the trade-offs inherent to microstructure optimization.
(discharged at 3C, shown at 60% DoD). Compared to eH, eL The histogram distribution of SoL for the active material
demonstrates a more preferential lithiation in the vicinity of the particles can provide additional insights into the relative
separator (at the top in Fig. 3), particularly when the particle size importance of SST and LST. Fig. 4a shows the result of a
is small (D8), which indicates a dominant role of LST. As the single-particle (D16) simulation, with the x-axis displaying the
particle size increases, LST becomes outweighed by SST in range of SoL in the particle and y-axis the corresponding
determining the rate capability, evidenced by a less significant volume fraction of the active material particle at each SoL.
gradient of SoL across the thickness as well as a high intra- The SoL distribution is observed to be more uniform at 1C
particle concentration gradient. This competition between the discharge, denoted by a narrow peak, in sharp contrast to the 3C
SST and LST limitation is not obvious in eH due to the high and 5C cases, where the SoL distribution expands significantly.
porosity and thus a mild electrolyte concentration (Cey) gradient. A peak (PDs) appears at the high end of SoL under 5C discharge,
3D simulation results shown here are compared with those attributed to the saturation of lithium at the particle surfaces.
generated using a pseudo2D (P2D) method,45 which is less Fig. 4b presents the result of the D16 electrode simulation with
computationally expensive (Fig. S7, ESI†). It is found that the eH, in which a higher PDs is observed even at 1C, suggesting a
average SoL predicted by the P2D model is within the scatter of more dominant role of SST. This is attributed to a higher current
Energy Environ. Sci. This journal is © The Royal Society of Chemistry 2021View Article Online
Energy & Environmental Science Paper
This article is licensed under a Creative Commons Attribution 3.0 Unported Licence.
Open Access Article. Published on 17 September 2021. Downloaded on 10/15/2021 10:50:58 AM.
Fig. 4 Analysis of the competition between LST and SST in determining the discharge rate performance of the cell. Histogram distribution of (a) single
particle (b) eH (c) eL and (d) thicker electrode (Lth = 100 mm). Results at 60% DoD are shown. The insets in (a) represent the SoL distribution at the
corresponding C-rates; insets in (b)–(d) with diffusion trajectory, schematically highlight the electrode thickness as control parameters; the insets with
blue surface display the voxels under the area of peak PDs, which represents the surface saturation of the particles; (e) and (f) quantify the SST limiting
region for electrodes of different particle sizes and porosities, at Lth = 60 mm and Lth = 100 mm, respectively; (g)–(i) capacity comparison of different
electrode designs as a function of C-rate.
density in the electrode in contrast to the single particle. The Fig. 4e and f summarize the SST limiting zone in electrodes
inset displays the region (blue) corresponding to the voxels fabricated with different particle sizes, porosities and thick-
under PDs at 5C. The full coverage along the thickness direction nesses (Lth). The dominance of SST generally increases with
is consistent with the previous measurement of the SST limiting larger particle size and higher porosity, but decays with increasing
zone (i.e., Ds limiting) in Fig. 3. In comparison, Fig. 4c for the eL electrode thickness. A sharper decrease of the SST limiting zone is
electrode demonstrates a less significant influence of SST observed in thicker electrodes at the same porosity. Note that the
compared to LST, evidenced by the closer peaks and the height plot for D8 at e = 0.23 (eL) in the thin electrode (Lth = 60 mm) is
of PDs, relative to the eH electrode. Notably, PDs originally covers almost identical to that at e = 0.28 (eH) in the thick electrode (Lth =
the whole thickness of the electrode at 1C, but fades towards the 100 mm), suggesting an equivalent LST impact on the two
separator region (shown by the insets), indicating a shift of the electrodes. Moreover, the SST limiting zone reaches a plateau
limiting mechanism from SST to LST. The effect of electrode (approx. 0.52) only for the D8 electrode as the Cey builds up as a
thickness is also investigated on a 100 mm thick electrode function of the C-rate, which is speculated to be a consequence of
(Fig. 4d). It shows a similar SoL distribution to those in Fig. 4c reaction front propagation and will be investigated in the later
at 1C and 3C, but no PDs is visible at 5C, due to a more dominant section. Fig. 4g compares the effect of porosity and thickness on
role of LST in the thicker electrode. The complete histogram the gravimetric capacity of the D8 electrode. At the thickness
distribution of different electrodes with varied particle sizes is of 60 mm, the performance of high porosity D8 shows a
shown in Fig. S9 (ESI†). negligible difference compared with that of the single-particle
This journal is © The Royal Society of Chemistry 2021 Energy Environ. Sci.View Article Online
Paper Energy & Environmental Science
(dotted black line), indicating a negligible LST resistance. The spatial dynamics of the electrochemical reaction are
The increase of the shaded area in thicker electrodes indicates heavily dependent on the competing dominance between LST
an increasingly dominant role of porosity, which is substantiated and SST, which is further investigated in Fig. 5. The figure
by the superior gravimetric capacity of the high porosity (0.28) reports the differential SoL (DSoL, i.e., the difference between
140 mm electrode compared to the low porosity (0.23) 100 mm maximum and minimum SoL) of each NMC particle at
electrode. This also implies that porosity is more important than incremental lithiation time steps at 3C, for D8 and D16 at low
electrode thickness in determining LST limitations. Fig. 4h and high porosities, respectively. At the initial stage of discharge
compares the areal capacity of electrodes composed of different in D8, the particles close to the separator are lithiated faster than
particle sizes and porosities in the 140 mm thick electrode. It is the particles near the current collector for both cases due to the
This article is licensed under a Creative Commons Attribution 3.0 Unported Licence.
Open Access Article. Published on 17 September 2021. Downloaded on 10/15/2021 10:50:58 AM.
worth recalling that all the electrodes have nominally the same Cey gradient as discussed above. As the discharge continues until
volumetric fraction of active material, and thus approach the SoL = 0.44, the non-uniform lithiation rate is mitigated (i.e.,
same theoretical areal capacity as the C-rate approaches zero. It is DSoL decreases) for both eH and eL electrodes, as a consequence
observed that none of the eL electrodes retain 80% of the total of the propagation of the reaction front, which is a self-balancing
capacity beyond 1C. Electrodes with large particles exhibit a faster mechanism; particles lithiated faster in the vicinity of the
capacity drop. Note that the shaded area for D8 is larger than that separator suffer from larger polarization attributed to the slow
for D16, indicating that porosity is more influential in electrodes SST and thus the reaction front propagates deeper into the
that are LST-limited, in good agreement with the analysis in Fig. 3. electrode where the reaction energy barrier is lower, which helps
Fig. 4i compares the areal capacity of D8 electrodes with different to reduce the SoL gradient across the electrode thickness. This is
porosities and thicknesses while keeping the volume fraction of followed by a repeated rise of DSoL at SoL = 0.52, indicating that
the NMC particles constant. As thicker electrodes demonstrate a the Cey regains dominance in determining reaction kinetics.
faster capacity drop and LST resistance increase at low porosity, However, DSoL quickly drops again for the same reason and
the 100 mm electrode provides less capacity than the 60 mm does not rise until the end of discharge due to the surface
electrode beyond 3.5C for eL and 5C for eH; and these become saturation as well as the faster drop of Ds as a function of SoL
1.3C and 2.8C when the 140 mm electrode is compared to the for the particles close to the separator.
100 mm one. These findings suggest a practical operating window The insets in Fig. 5b show the distribution of the charge
of maximum current for each microstructural design to fully transfer current density ( Jct) at global SoL = 0.28, 0.68 and 0.84.
exploit the active materials (outlined by the black arrows). They clearly demonstrate the spatial transition of the reaction
Fig. 5 Spatial dynamics of the charge transfer process analyzed in terms of the differential SoL (DSoL) of each particle across the thickness of the
electrode at different discharge time steps at 3C. Insets in (b) represent the distribution of charge transfer current density Jct at global SoL of 0.28, 0.68
and 0.84.
Energy Environ. Sci. This journal is © The Royal Society of Chemistry 2021View Article Online
Energy & Environmental Science Paper
kinetics, which shifts from the separator side to the current and thickness, together with the interpreted spatial dynamics,
collector side from SoL = 0.28 to SoL = 0.84. This explains the are anticipated to guide the optimization of electrode design
plateau of the SST limited region observed in D8 (Fig. 4e and f). and engineering in the battery manufacturing industry.
Note that this self-balancing phenomenon is more significant in Although electrodes with small particles provide much better
eL, as the LST is more severe and thus the Cey is larger. D16 rate capability, in most commercial battery electrodes a mixture
electrodes exhibit a similar trend of self-balancing, however, the of different sized active material particles (i.e. optimized PSD) is
second rise of the curve appears earlier (SoL = 0.44) than for D8 the normal practice, not only to increase the packing density
(SoL = 0.52), suggesting a faster SoL homogenization process but, more importantly, to suppress side reactions,46
across the electrode, since LST is less limiting, as expected for degradation47,48 and self-discharge, while mitigating safety
This article is licensed under a Creative Commons Attribution 3.0 Unported Licence.
Open Access Article. Published on 17 September 2021. Downloaded on 10/15/2021 10:50:58 AM.
the electrodes with larger PSD. This knowledge can provide concerns49,50 (e.g. increasing the onset temperature of thermal
valuable insights into the development of BMS for rational fast runaway) arising from the large specific reaction area
discharging protocols for electrodes of different geometries in associated with the small particles. Fig. 6a shows a 60 mm thick
order to mitigate polarization and early degradation. eL electrode consisting of bimodal particles with 50% volume
fraction (generated by Porespy35). The SoL distribution corres-
3.4 Electrode design building on the insights of governing ponding to 3C (i.e., 4.5 mA h cm 2) discharge at 60% DoD is
mechanism and spatial dynamics presented alongside (Fig. 6b). A distinct difference in SoL is
The obtained knowledge of the dominant limiting mechanism observed between the small particles (D8) and the larger ones
of the discharge rate performance as a function of particle size (D12). Moreover, small particles play an important role in
Fig. 6 Comparison of the 60 mm thick eL electrodes with distinct spatial distribution of active material particles. (a) An electrode consisting of randomly
distributed bimodal particles; (b) the corresponding SoL distribution at 60% DoD discharged at 3C; (c) Differential SoL of individual particles across the
electrode thickness at incremental lithiation timesteps; (d) comparing rated capacity of various electrodes with increasing volume fraction of small
particles; (e)–(h) the corresponding results for the electrode with layered particle size.
This journal is © The Royal Society of Chemistry 2021 Energy Environ. Sci.View Article Online
Paper Energy & Environmental Science
shielding the larger ones from lithium saturation at the surface, D12 and D8 leads to imbalanced SoL and lithiation rate between
thereby reducing the overpotential, as can be evaluated by the small and large particles due to the different SST resistance,
comparing Fig. 6b and 3e. Fig. 6c plots the differential SoL at particularly at the initial discharge stage, as can be seen in
different states of discharge. A similar self-balancing Fig. 6c (SoL = 0.28 and 0.44), which causes an early saturation of
phenomenon is found in the bimodal electrode. Note that there the D8 particles in the vicinity of the separator, making them less
is a large difference of DSoL between D8 and D12 particles, reactive and driving the charge transfer to take place primarily
which is most prominent at the initial stage of discharge, deep in the electrode, where the electric potential and Cey are
meaning that the smaller particles lithiate much faster than much lower. The bimodal 50% D8 electrode still provides better
the larger ones. This discrepancy gradually fades as the rate capability than the layered electrode when the fine-particle
This article is licensed under a Creative Commons Attribution 3.0 Unported Licence.
Open Access Article. Published on 17 September 2021. Downloaded on 10/15/2021 10:50:58 AM.
discharge continues, until reaching a global SoL = 0.76, where layer thickness is less than 18 mm.
the plots for D8 and D12 are identical in the vicinity of the
separator, as a result of surface saturation of the D8 particles. 3.5 Single crystal vs. polycrystalline NMC electrodes
Fig. 6d compares the effect of mixing ratio on the rated The insights of SST and LST competition and spatial dynamics
capacity. It displays a trivial difference between the electrodes of lithiation are conducive to an improved understanding of the
with the D8 content from 33% to 100% when the current discharge rate performance of commercial batteries. In this
density is below 3 mA cm 2, beyond which a drastic section, we examine and compare the rate performance of
performance drop is observed. These electrodes provide much commercially available SC and PC NMC811 electrodes due to
superior rated capacity than the pure D12 electrode, which only their distinct difference in PSD, morphology and transport
manages to match the others when the current density is below dynamics. The former has received broad attention in recent
1 mA cm 2. years due to its advantage in eliminating inter-granular crack/
Building on the insights of preferential lithiation in the fracture, which is the major degradation mechanism in Li-rich
vicinity of the separator in the electrodes with sluggish LST, as PC NMC electrodes undergoing fast/over-charge or long-term
well as the Ds limiting region, a layered electrode with varying cycling.15,27,43 Fig. 7a and b are cross-sectional views displaying
particle size could be a promising candidate for next-generation the microstructure of the SC and PC NMC811 electrodes,
automotive batteries. Smaller particles at the separator are respectively, obtained by X-ray nano-CT. Both electrodes had
conducive to the mitigation of the polarization arising from been pre-calendered to a target density of 3.3 g cm 3, and the
SST, whereas larger particles at the deeper region of the resultant NMC volume fraction is measured to be 60.5% and
electrode ensure the cycle lifetime and slow degradation of 62.1% for SC and PC electrodes, respectively. The SC particles
the cell. Fig. 6e shows the layered eL electrode with the same are evenly distributed across the electrode thickness, whereas
composition as the randomly mixed electrode (Fig. 6a). It is the PC electrode is more heterogeneous with larger and more
observed that lithiation primarily takes place in the D8 layer spherical secondary particles. Cracked secondary particles due
where the polarisation is low (Fig. 6f). The D12 particles are less to heavy calendering are observed in Fig. 7b but not in Fig. 7a,
active compared to those in the randomly arranged electrode which is a combined effect of the particle size and primary
and thereby exhibit less SST limitation. Fig. 6g shows a lower particle boundaries. This is the reason why SC electrodes are
DSoL at SoL = 0.28 compared to Fig. 6c, suggesting a more advantageous to improve the packing density.
uniform lithiation than the corresponding region in the The PSD of each electrode is compared in Fig. 7c (SC) and
randomly distributed bimodal electrode, which also explains Fig. 7d (PC). The SC particles have a much smaller mean
a less saturated state at SoL = 0.6 so that the D8 particles are diameter (Dmean = 2.38 mm) and narrower PSD than the PC
more active. Fig. 6h compares the rate capability of electrodes electrode. Calendering a high mass loading PC electrode
with incrementally layered microstructure, extending from the (96.4 wt%) introduces a large number of fragmented particles
separator to 30 mm deep into the electrode. The performance that reduce the average diameter of the particles. Thus, the PSD
generally increases as a function of the layer thickness of in Fig. 7d arises from a mixture of primary and secondary
the fine particles, attributed to the mitigation of the SST particles. Fig. 7e and f visualize the PSD, with the colour code
polarization. In particular, when the layered thickness reaches representing the solid diffusion-controlled maximum C-rate
30 mm, the rated capacity shows negligible difference compared (Ct), which is related to the SST time constant (td = r 2/Ds, r is
to the electrode with pure D8 (100%), until reaching 5 mA cm 2. the particle radius) and is calculated as Ct = 3600/td. The open
This is consistent with the quantitatively estimated SST limiting circuit voltage (OCV) measured by the GITT method (Fig. S10,
region (approx. 0.5 of the total thickness) in Fig. 4f. Further ESI†) for the two types of electrodes is observed to be globally
increase of the thickness of the fine-particle layer would not identical except for a subtle mismatch towards the end of the
benefit the rate performance significantly, and would come at curve (Fig. 7g). The upper cut-off voltage was set to 4.2 V to
the expense of additional side reactions and faster degradation. avoid phase transition from H2 to H3 that is accompanied by a
Despite having the same composition (i.e., 50% D8), the 30 mm drastic contraction of c-axis and would initiate structural and
layered electrode exhibits noticeably improved rate performance chemical degradations.14 Ds as a function of SoL for the SC and
compared to the bimodal design when the current density is PC electrodes is shown in Fig. 7h, where the PC electrode has a
larger than 3 mA cm 2, which becomes even more significant at Ds approximately 1.3 times higher than that of the SC. This is
5 mA cm 2. This can be explained by the fact that the mixture of surprising because SC particles are expected to have faster SST
Energy Environ. Sci. This journal is © The Royal Society of Chemistry 2021You can also read