Photooxidants from brown carbon and other chromophores in illuminated particle extracts - Atmos. Chem. Phys
←
→
Page content transcription
If your browser does not render page correctly, please read the page content below
Atmos. Chem. Phys., 19, 6579–6594, 2019
https://doi.org/10.5194/acp-19-6579-2019
© Author(s) 2019. This work is distributed under
the Creative Commons Attribution 4.0 License.

Photooxidants from brown carbon and other chromophores in
illuminated particle extracts
Richie Kaur1 , Jacqueline R. Labins1 , Scarlett S. Helbock1 , Wenqing Jiang2 , Keith J. Bein3 , Qi Zhang2 , and
Cort Anastasio1
1 Department  of Land, Air and Water Resources, University of California, Davis, One Shields Avenue, Davis,
CA 95616-8627, USA
2 Department of Environmental Toxicology, University of California, Davis, One Shields Avenue, Davis,

CA 95616-8627, USA
3 Center for Health and the Environment, University of California, Davis, One Shields Avenue, Davis, CA 95616-8627, USA

Correspondence: Cort Anastasio (canastasio@ucdavis.edu)

Received: 2 December 2018 – Discussion started: 10 December 2018
Revised: 23 April 2019 – Accepted: 25 April 2019 – Published: 17 May 2019

Abstract. While photooxidants are important in atmospheric          value. Additionally, the rates of 1 O2 ∗ and 3 C∗ photoproduc-
condensed phases, there are very few measurements in par-           tion are both well correlated with the rate of sunlight absorp-
ticulate matter (PM). Here we measure light absorption and          tion.
the concentrations of three photooxidants – hydroxyl radi-             Since we cannot experimentally measure photooxidants
       q
cal ( OH), singlet molecular oxygen (1 O2 ∗ ), and oxidizing        under ambient particle water conditions, we measured the
triplet excited states of organic matter (3 C∗ ) – in illuminated   effect of PM dilution on oxidant concentrations and then
aqueous extracts of wintertime particles from Davis, Cali-          extrapolated to ambient particle conditions. As the particle
fornia. 1 O2 ∗ and 3 C∗ , which are formed from photoexcita-        mass concentration in the extracts increases, measured con-
                                                                                     q
tion of brown carbon (BrC), have not been previously mea-           centrations of OH remain relatively unchanged, 1 O2 ∗ in-
sured in PM. In the extracts, mass absorption coefficients for      creases linearly, and 3 C∗ concentrations increase less than
dissolved organic compounds (MACDOC ) at 300 nm range               linearly, likely due to quenching by dissolved organics.
between 13 000 and 30 000 cm2 (g C)−1 are approximately             Based on our measurements, and accounting for additional
twice as high as previous values in Davis fogs. The av-             sources and sinks that should be important under PM con-
                q                                                                                 q
erage (±1σ ) OH steady-state concentration in particle ex-          ditions, we estimate that [ OH] in particles is somewhat
tracts is 4.4(±2.3) × 10−16 M, which is very similar to pre-        lower than in dilute cloud/fog drops, while [3 C∗ ] is 30 to
vious values in fog, cloud, and rain: although our particle         2000 times higher in PM than in drops, and [1 O2 ∗ ] is en-
extracts are more concentrated, the resulting enhancement in        hanced by a factor of roughly 2400 in PM compared to drops.
             q
the rate of OH photoproduction is essentially canceled out          Because of these enhancements in 1 O2 ∗ and 3 C∗ concen-
by a corresponding enhancement in concentrations of natu-           trations, the lifetimes of some highly soluble organics ap-
               q
ral sinks for OH. In contrast, concentrations of the two ox-        pear to be much shorter in particle liquid water than under
idants formed primarily from brown carbon (i.e., 1 O2 ∗ and         foggy/cloudy conditions. Based on extrapolating our mea-
3 C∗ ) are both enhanced in the particle extracts compared to       sured rates of formation in PM extracts, BrC-derived singlet
Davis fogs, a result of higher concentrations of dissolved or-      molecular oxygen and triplet excited states are overall the
ganic carbon and faster rates of light absorption in the ex-        dominant sinks for organic compounds in particle liquid wa-
tracts. The average 1 O2 ∗ concentration in the PM extracts is      ter, with an aggregate rate of reaction for each oxidant that is
1.6(±0.5) × 10−12 M, 7 times higher than past fog measure-          approximately 200–300 times higher than the aggregate rate
                                                                                                      q
ments, while the average concentration of oxidizing triplets        of reactions for organics with OH. For individual, highly
is 1.0(±0.4) × 10−13 M, nearly double the average Davis fog         soluble reactive organic compounds it appears that 1 O2 ∗ is

Published by Copernicus Publications on behalf of the European Geosciences Union.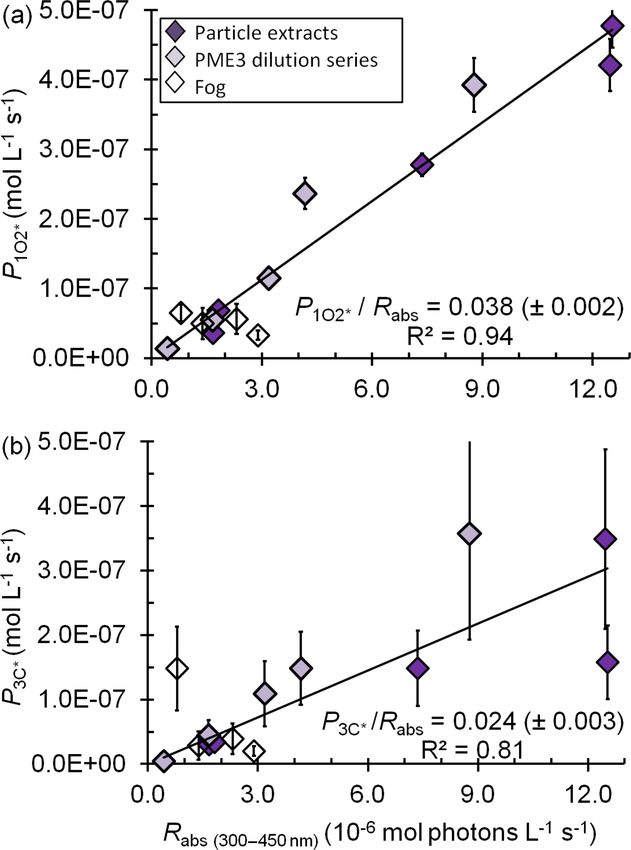
6580         R. Kaur et al.: Photooxidants from brown carbon and other chromophores in illuminated particle extracts

often the major sink in particle water, which is a new finding.    ing triplets, which we refer to as 3 C∗ or simply “triplets”
Triplet excited states are likely also important in the fate of    for simplicity. Such species are important in surface waters,
individual particulate organics, but assessing this requires ad-   where they rapidly oxidize several classes of compounds in-
ditional measurements of triplet interactions with dissolved       cluding phenols, anilines, phenylurea herbicides, and sulfon-
organic carbon in natural samples.                                 amide antibiotics (Canonica et al., 1995, 2006; Canonica and
                                                                   Hoigné, 1995; Boreen et al., 2005; Bahnmüller et al., 2014).
                                                                      There has been growing interest in the role and reactivity
                                                                   of triplets formed from particulate brown carbon, especially
1   Introduction                                                   their role in forming aqueous secondary organic aerosol
                                                                   (SOA(aq))(Smith et al., 2014, 2015; Yu et al., 2014, 2016;
Photochemically generated oxidants largely drive atmo-             Laskin et al., 2015). There is evidence that triplet-forming,
spheric chemistry, both in the gas phase (Thompson, 1992;          light-absorbing species, e.g., imidazoles and pyrazines, are
Finlayson-Pitts and Pitts Jr., 1999; Seinfeld and Pandis,          formed in drops and particles (De Haan et al., 2009, 2010;
2012) and in aqueous drops, where they largely govern              Hawkins et al., 2018), and a few laboratory studies have ex-
the reactions and lifetimes of organic compounds (Lim et           amined how illuminated imidazole particles can oxidize iso-
al., 2005, 2010; Ervens et al., 2011; He et al., 2013; Her-        prene or other alkenes to increase PM mass (Aregahegn et al.,
rmann et al., 2015; Blando and Turpin, 2000). Similarly,           2013; Rossignol et al., 2014). But the formation of SOA(aq)
photooxidants can be important for transformations in water-       from such reactions appears not to be significant under en-
containing particulate matter (PM): they make new PM mass          vironmentally relevant conditions where concentrations of
by functionalizing gaseous volatile organics to oxygenated         triplet precursors are much lower (Tsui et al., 2017). While
lower-volatility products and decrease PM mass by frag-            we recently made the first measurements of triplet concentra-
menting large organics into smaller, more volatile species         tions in fog waters (Kaur and Anastasio, 2018b), there are no
(Jimenez et al., 2009). Oxidants in condensed phases can           measurements of 3 C∗ in particles, making it difficult to assess
come from the gas phase (e.g., the mass transport of hydroxyl      their significance. This is doubly difficult because triplets are
         q
radical, OH) or can be formed photochemically within the           not a single oxidant but rather a suite of species with a wide
particle or drop (Herrmann et al., 2010b). Our focus in this       range of reactivities (McNeill and Canonica, 2016).
paper is on the latter pathway.                                       Another important photooxidant in atmospheric and sur-
   Of the photooxidants formed in airborne particles, hy-          face waters is singlet molecular oxygen (1 O2 ∗ ), which is
                 q
droxyl radical ( OH) is the most widely studied. While its         formed by energy transfer from a triplet excited state to dis-
concentrations have been measured in cloud/fog drops, rain,        solved oxygen and lost via deactivation by water (Zepp et al.,
and dew (Arakaki and Faust, 1998; Arakaki et al., 1999;            1977; Haag and Hoigné, 1986; Haag and Gassman, 1984;
Anastasio and McGregor, 2001; Kaur and Anastasio, 2017),           Faust and Allen, 1992). Similar to triplets, singlet oxygen
                                                 q
there are only four known measurements of OH photopro-             has been studied widely in surface waters (Zepp et al., 1977;
duction rates, lifetimes, and steady-state concentrations in       Haag and Gassman, 1984; Haag and Hoigné, 1986; Tratnyek
ambient particles, all from coastal or marine locations (Anas-     and Hoigné, 1994) and reacts rapidly with electron-rich or-
tasio and Jordan, 2004; Arakaki et al., 2006, 2013; Anasta-        ganics such as phenols, polycyclic aromatic hydrocarbons,
sio and Newberg, 2007). Based on these and other measure-          amino acids, and reduced sulfur species (Wilkinson et al.,
ments (e.g., Tong et al., 2017) and complementary modeling         1995). However, there are only four measurements of 1 O2 ∗
work (Herrmann et al., 2010b, 2015), the major sources of          concentrations in atmospheric waters (Anastasio and McGre-
 q
  OH include photolysis of nitrate, nitrite, and hydrogen per-     gor, 2001; Kaur and Anastasio, 2017; Albinet et al., 2010;
oxide (HOOH) as well as reactions of Fe(II) with HOOH              Faust and Allen, 1992) and none in aqueous particles.
                                               q                                                            q
or organic peroxides. The major sinks of OH are organic               To address this gap, we measured OH, 1 O2 ∗ , and 3 C∗ in
molecules since these reactions typically have nearly dif-         illuminated aqueous extracts of fine particles collected from
fusion controlled rate constants (Arakaki et al., 2013; Her-       the Central Valley of California during winter, a period of
rmann et al., 2010a, 2015).                                        heavy residential wood burning. The goals of this study are
                                                                                    q
   Photoexcitation of organic chromophores, i.e., light-           to (1) quantify OH, 1 O2 ∗ , and 3 C∗ kinetics and concentra-
absorbing brown carbon (BrC), can also form oxidants in            tions in particle extracts; (2) compare light absorption and
particles and drops. For example, sunlight absorption by or-       photooxidant kinetics with previous measurements made in
ganic chromophores can promote the molecules from their            fog; (3) measure the dependence of oxidant concentrations
ground states to reactive triplet excited states (McNeill and      on particle dilution to predict photooxidant concentrations in
Canonica, 2016; Kaur and Anastasio, 2018b). Triplets can           ambient particle liquid water; and (4) assess the importance
both directly oxidize organics via electron-transfer reactions     of particle photooxidants in processing organic compounds
and form other photooxidants, including singlet molecular          in the atmosphere.
oxygen (1 O2 ∗ ) (Zepp et al., 1985) and hydrogen peroxide
(Anastasio et al., 1997). In this work we examine oxidiz-

Atmos. Chem. Phys., 19, 6579–6594, 2019                                             www.atmos-chem-phys.net/19/6579/2019/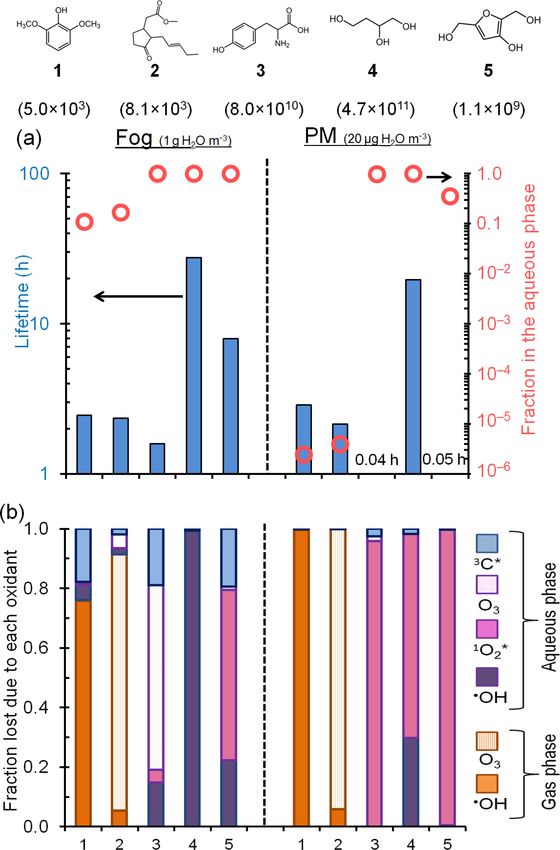
R. Kaur et al.: Photooxidants from brown carbon and other chromophores in illuminated particle extracts                      6581

2     Experimental                                                  ter squares extracted in 1.3 mL of Milli-Q). Upon extrac-
                                                                    tion, each PME was stored in the refrigerator (5 ◦ C) until the
2.1    Chemicals                                                    day of the illumination experiments. All illumination experi-
                                                                    ments and analyses on a PME sample were completed within
All chemicals were used as received. Furfuryl alcohol               a week of its extraction.
(98 %), syringol (99 %), methyl jasmonate (95 %), benzene
(≥ 99.9 %), 2-methyl-3-buten-2-ol (98 %), deuterium oxide           2.3    Sample illumination and chemical analysis
(99.9 % atom D), and 2-nitrobenzaldehyde (98 %) were from
                                                                                                                q
Sigma-Aldrich, and sulfuric acid (trace metal grade) was            For all illumination experiments except OH measurements
from Fisher. All chemical solutions and particulate matter          using benzene (discussed in Sect. 2.5.1), on the day of the
extracts were prepared using purified water (Milli-Q wa-            experiment a 1.0 mL aliquot of an air-saturated particle ex-
ter) from a Milli-Q Advantage A10 system (Millipore; ≥              tract was first acidified to pH 4.2 ± 0.2 using 10 mM sulfuric
18.2 M cm) with an upstream Barnstead activated carbon             acid (with sample dilution ≤ 10 %) to mimic the particle wa-
cartridge; total organic carbon concentrations were below           ter acidity in wintertime PM in California’s Central Valley
10 ppb C.                                                           (Parworth et al., 2017). The pH of the sample was measured
                                                                    using a pH microelectrode (MI-414 series, protected tip, 16
2.2    Particle collection and extraction                           gauge needle, 6 cm length; Microelectrodes, Inc.). The acidi-
                                                                    fied extract was then spiked with a single photooxidant probe
Wintertime particles were collected in a residential neigh-         and put into a silicone-plugged, fully filled GE021 quartz
borhood in Davis, California, (38.5539◦ N, 121.7381◦ W;             tube (4 mm inner diameter, 6 cm length, 1.0 mL volume) and
16 m a.s.l.) during December 2015 and January 2016, a pe-           illuminated with a 1000 W xenon arc lamp filtered with a
riod with significant wood burning. PM2.5 was collected on          water filter (to reduce sample heating), an AM 1.0 air mass
20.3 cm × 25.4 cm (8 in. × 10 in.) Teflon-coated quartz filters     filter (AM1D-3L, Sciencetech), and a 295 nm long-pass fil-
(Pall Corporation, EmFab™ filters, type TX40HI20-WW)                ter (20CGA-295, Thorlabs) to mimic tropospheric solar light
using a high-volume sampler with a PM10 inlet (Graseby              (Kaur and Anastasio, 2017). Because of the small tube size,
Andersen) followed by two offset, slotted impactor plates           samples were not stirred, but the entire sample was illumi-
(Tisch Environmental, Inc., 230 series) to remove particles         nated in a chamber held at 20 ◦ C. 100 µL aliquots of illu-
greater than 2.5 µm. Due to technical difficulties, the air flow    minated (and parallel dark) samples were periodically re-
rate was variable and typically ranged between 1130 and             moved and analyzed for the concentration of photooxidant
1560 L min−1 , corresponding to particle cut points of 2.5 to       probe (see below) using HPLC (high-performance liquid
1.6 µm. Particles were generally collected over two to three        chromatography; Shimadzu LC-10AT pump, ThermoScien-
consecutive nights between 17:30 and 07:30 local time, but          tific BetaBasic-18 C18 column (250 × 33 mm, 5 µM bead),
one sample (number 3) was collected continuously (day and           and Shimadzu-10AT UV–Vis detector). The photon flux in
night) for 72 h (Table S1 in the Supplement).                       the sample was measured on each experiment day using a
   Immediately upon collection, samples were wrapped in             10 µM solution of 2-nitrobenzaldehyde (2NB) in the same
aluminum foil (previously baked at 500 ◦ C for 8 h), sealed in      type of quartz tube as the sample (Galbavy et al., 2010).
Ziplock™ bags, and stored at −20 ◦ C. On the day of extrac-             Major anions and cations in the extracts (Table S2) were
tion, several 2 cm × 2 cm pieces were cut (using stainless-         quantified using two Metrohm ion chromatographs (881
steel tools) from the same filter, each was put into a sepa-        Compact IC Pro) equipped with conductivity detectors (Ge
rate pre-cleaned 10 mL amber glass vial, Milli-Q water was          et al., 2014; Kaur and Anastasio, 2017). Dissolved organic
added (see below), and the vial was sealed and shaken for           carbon (DOC) in the filtered extracts was measured using a
3 h in the dark. The extracts were filtered (0.22 µm PTFE;          Shimadzu TOC-VCPH analyzer (Yu et al., 2014).
Pall Corporation), combined, and labeled as particulate mat-
ter extract (PME). The standard condition was to use 1.0 mL         2.4    Light absorbance
of Milli-Q to extract each filter square, but in our initial work
we used 2.5 mL of Milli-Q per filter square; these latter “di-      Light absorbance was measured immediately after extraction
lute extracts” are indicated by an asterisk and footnotes in        using a Shimadzu UV-2501PC spectrophotometer with 1 cm
the figures and tables. We switched from dilute to standard         quartz cuvettes and a baseline of Milli-Q water. Absorbance
conditions after PME1–3, but we include both results in this        (Aλ ) was converted to light absorption coefficients using
work to compare the two types of extracts.
   In addition, to study the effect of PM mass concentra-                  Aλ
                                                                    αλ =      ,                                                (1)
tion, separate portions of filter number 3 were extracted us-               l
ing five different extraction volumes between 0.5 and 10 mL
(discussed later). Those extracts are labeled as PME3Dx,            where l is the path length in centimeters. The rate of sunlight
where “x” is the extraction volume (e.g., PME3D1.3 for fil-         absorption (Rabs , mol photons L−1 s−1 ) in each extract was

www.atmos-chem-phys.net/19/6579/2019/                                                Atmos. Chem. Phys., 19, 6579–6594, 2019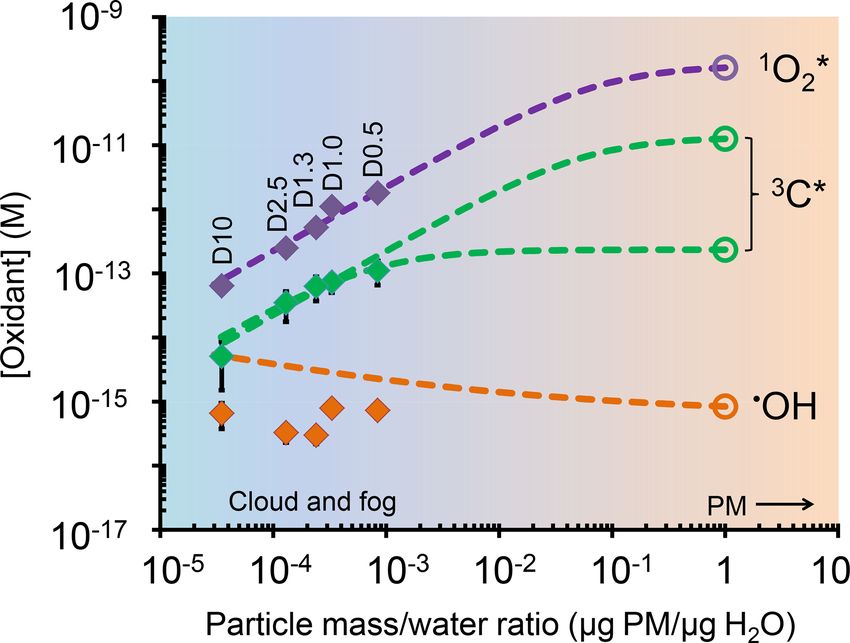
6582          R. Kaur et al.: Photooxidants from brown carbon and other chromophores in illuminated particle extracts

calculated as                                                    35 ◦ C). As described in Kaur and Anastasio (2017), we use
                                                                 these results to determine three experimental quantities for
                 103 450 nm                                       q
                                                                   OH: the rate of photoproduction (POH,EXP ), the rate con-
                      X
Rabs = 2.303 ×      ×       (αλ × Iλ × 1λ),                (2)             q                               0 ), and the steady-
                 NA 300 nm                                       stant for OH loss due to natural sinks (kOH
                                                                                        q                             q
                                                                 state concentration ([ OH]EXP ). Measured rates of OH for-
where 2.303 is for base conversion, 103 is for units conver-     mation and steady-state concentrations were normalized to
sion (cm3 L−1 ), NA is Avogadro’s number, Iλ is the Davis        values expected under midday, Davis winter-solstice sunlight
winter-solstice actinic flux (photons cm−2 s−1 nm−1 ) from       and were corrected for the small amount of internal light
the Tropospheric Ultraviolet and Visible (TUV) Radiation         screening due to light absorption by dissolved organic matter
Model version 4.1 (Madronich et al., 2002), and 1λ is the        (DOM):
interval between adjacent wavelengths in the TUV output                          q
                                                                    q

(nm).                                                                          [ OH]EXP
                                                                 [ OH] =                      × j2NB,WIN .                  (4)
   Wavelength-dependent mass absorption coefficients for                     Sλ × j2NB,EXP
DOC (MACDOC ; cm2 (g C)−1 ) were estimated by subtract-             In this equation, Sλ is the internal light screening fac-
ing the contributions of nitrite and nitrate from the measured   tor (Table S1), j2NB,WIN is the rate constant for loss of
absorbance at each wavelength (which were small, ≤ 7 % of        2-nitrobenzaldehyde at midday near the winter solstice
the total absorbance) and then dividing the remainder by the     in Davis (solar zenith angle = 62◦ , j2NB,WIN = 0.0070 s−1 ;
DOC concentration:                                               Anastasio and McGregor, 2001), and j2NB,EXP is the mea-
                αDOC,λ × ln (10) × 103 × 103                     sured rate constant for loss of 2NB on the day of the experi-
MACDOC,λ =                                   ,             (3)          q
                                                                 ment. OH results are in Tables S3–S6.
                          [DOC]                                                           q
                                                                    We also measured OH steady-state concentrations in
where αDOC,λ (cm−1 ) is the sample absorbance coefficient at     squares of particle filter number 3 using five different di-
wavelength λ due to DOC (Kaur and Anastasio, 2017), ln(10)       lutions with water (discussed later). Because these sample
is a base conversion factor, the two 103 factors are for unit    volumes were too small to use the benzene technique, we
                                                                                                                 q
conversion (cm3 L−1 and mg g−1 ), and the DOC concentra-         determined the steady-state concentration of OH by mea-
tion is in milligrams of carbon per liter (mg C L−1 ). Since     suring the loss of 2-methyl-3-buten-2-ol (MBO) (Sect. S1).
the average organic-matter-to-organic carbon (OM/OC) ratio       We then measured POH in a 1 cm cuvette using a high ben-
in California Central Valley particles is approximately 1.7      zene concentration (1.5 mM) and determined the rate con-
                                                                           q
(Young et al., 2016), the absorption coefficients normalized     stant for OH loss due to natural sinks by dividing the rate
                                                                                                                         0 =
                                                                 of photoproduction by the steady-state concentration, kOH
by OM mass will be approximately 60 % of the MACDOC                      q
values.                                                          POH /[ OH] (Sect. S1.3). In contrast to the benzene tech-
                                                                                                       q
                                                                 nique, there was some quenching of OH by the probe MBO
2.5     Measurement of photooxidants                             in our PME3 samples; this quenching was most significant in
                                                                 the most dilute extract, PME3D10. We corrected measured
2.5.1    Hydroxyl radical (• OH)                                  q
                                                                   OH concentrations for quenching by MBO in the PME3
                 q                                               samples (Sect. S1), and the final, corrected values are given
We quantified OH kinetics using a benzene probe (Zhou            in the Tables mentioned above.
and Mopper, 1990; Anastasio and McGregor, 2001; Kaur and
Anastasio, 2017). Briefly, four aliquots of each extract were
                                                          q      2.5.2   Singlet molecular oxygen (1 O2 ∗ )
spiked with varying concentrations of benzene to trap OH
and form phenol (yield: 73 %), which is quantified (Fig. S1 in   Singlet oxygen was quantified by measuring the loss of a fur-
the Supplement). Each benzene stock was made a day before        furyl alcohol (FFA) probe and using heavy water (D2 O) as
the illumination experiment. Similar to the other photoox-       a diagnostic tool (Kaur and Anastasio, 2017; Anastasio and
idant experiments, all aliquots were air-saturated, acidified    McGregor, 2001). Briefly, each extract was divided into two
to an initial pH of 4.2(±0.2), capped, and then constantly       aliquots, acidified to pH 4.2 (±0.2), and diluted 50 : 50 using
stirred during illumination in airtight 5.0 mL, 1 cm path        H2 O or D2 O. Both aliquots were spiked to 10 µM FFA and
length, rectangular quartz cuvettes with no initial headspace.   illuminated in 1 mL quartz tubes. (At this concentration, FFA
        q
For all OH measurements where benzene is used as a probe,        should decrease the steady-state concentration of 1 O2 ∗ in air-
we used this larger sample volume (5 mL instead of 1 mL) to      saturated solutions by less than 1 %.) FFA loss was detected
minimize the headspace in the cuvette and prevent benzene        using HPLC-UV (eluent of 10 % acetonitrile: 90 % Milli-
loss due to volatilization. Throughout the illumination pe-      Q water, flow rate of 0.6 mL min−1 , detection wavelength
riod, 100 µL aliquots were collected through the cap septum      of 210 nm, and column temperature of 35 ◦ C). The loss of
and analyzed for phenol using HPLC-UV (eluent of 30 %            FFA followed pseudo-first-order kinetics and the slope of the
acetonitrile: 70 % Milli-Q, flow rate of 0.6 mL min−1 , de-      plot of ln([FFA]t /[FFA]0 ) versus time is the negative of the
tection wavelength of 210 nm, and column temperature of          pseudo-first-order rate constant for loss of FFA (illustrated in

Atmos. Chem. Phys., 19, 6579–6594, 2019                                           www.atmos-chem-phys.net/19/6579/2019/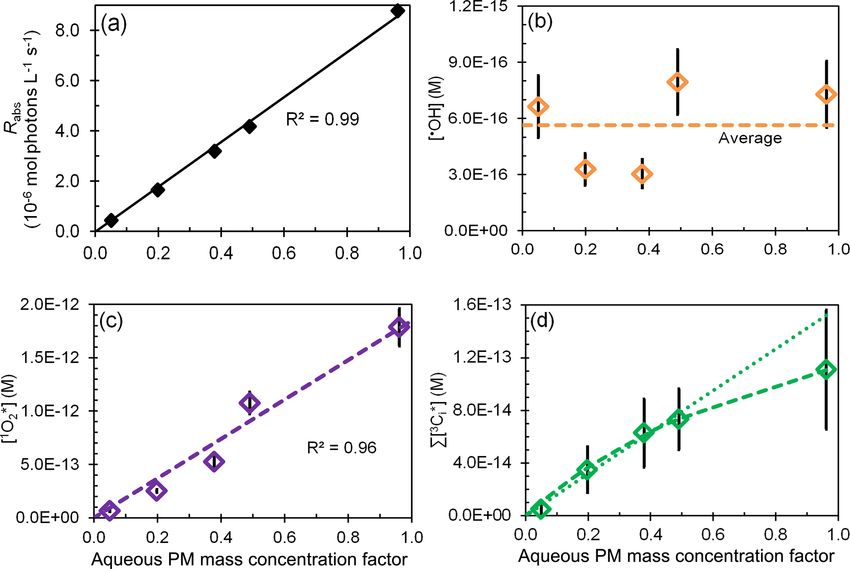
R. Kaur et al.: Photooxidants from brown carbon and other chromophores in illuminated particle extracts                               6583

Fig. S2). Loss of FFA in the D2 O-diluted aliquot is faster than
in H2 O because H2 O is the dominant sink for 1 O2 ∗ , which                                          h    i
                                                                          0                             3 ∗       0
reacts less quickly with D2 O (Bilski et al., 1997). The differ-         kProbe, 3 C∗ = 6  k       3 ∗
                                                                                             Probe+ Ci   Ci    = kProbe
ences in the pseudo-first-order rate constants for loss of FFA                                      q                  h     i
between the two aliquots of sample were used to calculate                             − kProbe+OH [ OH] + kProbe+1 O2 ∗ 1 O2 ∗ .       (6)
the steady-state concentration of 1 O2 ∗ and the rate of singlet
                                                                         In other probe techniques,
                                                                                                  P 3 ∗ the equivalent of Eq. (6) is
oxygen photoproduction (Anastasio and McGregor, 2001).
                                                                         rearranged so that          [ Ci ] can be determined based on
These were normalized to values expected in Davis winter-                                               0
                                                                         the measured value of kProbe,       3 C∗ and the literature value
solstice sunlight (i.e., [1 O2 ∗ ] and P1 O2 ∗ ) and corrected for in-
                                                                         of the second-order rate constant kProbe+3 C∗ . However,
ternal light screening using an equation analogous to Eq. (4).                                                                i
1 O ∗ measurements are in Table S7.                                      because triplets represent a suite of unidentified com-
   2
                                                                         pounds, there is no one value of kProbe+3 C∗ . To estimate
                                                                                                                           i
2.5.3    Oxidizing triplet excited states of organic matter              this second-order rate constant in each sample, we used
         (3 C∗ )                                                         a combination of rate constants from four model triplets
                                                                         – 2-acetonaphthone (3 2AN∗ ), 3’-methoxyacetophenone
Triplets were measured using the dual-probe technique we                 (3 3MAP*), 3,4-dimethoxybenzaldehyde (3 DMB*), and ben-
developed recently for fog waters (Kaur and Anastasio,                   zophenone (3 BP∗ ) – that roughly span the range of triplet
2018b): two 1.0 mL, pH 4.2 aliquots of each extract were                 reactivities in natural samples. We first identified the “best
spiked to 10 µM of either syringol (SYR) or methyl jas-                  match triplets”, i.e., the one or two model triplets that
monate (MeJA), and the loss of each probe was measured                   match the average oxidizing triplet reactivity in a given ex-
during illumination in plugged quartz tubes (Sect. 2.3).                 tract. To do this, we determined the model triplets whose
The measured pseudo-first-order rate constant for probe                  mole-fraction-weighted ratio of second-order rate constants
         0
loss (kProbe,EXP  ) was determined as the negative of the                (i.e., kSYR+3 C∗ /kMeJA+3 C∗ ) matches the ratio of the mea-
slope of the plot of ln([Probe]/[Probe]0 ) versus illumination           sured first-order probe loss rate constants due to triplets
                   0                                                        0
                                                                         (kSYR,         0
time. Values of kProbe,EXP   were normalized to Davis winter-                    3 C∗ /kMeJA,3 C∗ ) in each extract (for more details, see
solstice sunlight and corrected for internal light screening             Kaur and Anastasio, 2018b). Ratios of the second-order rate
using an analog of Eq. (4); the resulting rate constants are             constants (kSYR,3 C∗ /kMeJA+3 C∗ ) of the model triplets range
           0
termed kProbe  (s−1 ) (Tables S8 and S9 of the SI). This pseudo-         from 1.7 for the most reactive species (3 BP∗ ) to 100 for the
first-order rate constant for loss of probe represents the sum           least reactive, 3 2AN∗ (Table S10). For each extract, we cal-
of all loss pathways:                                                    culated two mole-fraction-weighted second-order rate con-
                                                                         stants for triplets (one for each probe) and used them to esti-
                       q                  h      i
                                                                         mate the triplet steady-state concentration:
  0
kProbe  = kProbe+OH [ OH] + kProbe+1 O2 ∗ 1 O2 ∗
                        h    i                                            h     i
       + 6 kProbe+3 C∗ 3 C∗i + jProbe                                    6 3 C∗i          =
                        i                                                        Probe
                                                                                                0
                                                                                               kProbe,
        + 6 (kProbe+Other [Other]) ,                              (5)                                 3 C∗
                                                                                                                                 ,     (7)
                                                         q                 χ 3 C1 ∗ × kProbe+3 C1 ∗ + χ 3 C2 ∗ × kProbe+3 C2 ∗
where the first two terms are the contributions of OH and
1 O ∗ to probe loss; 6(k              3 ∗
    2                     Probe+3 C∗ [ C ]) represents the sum of        where χ 3 C1 ∗ and χ 3 C2 ∗ are the mole fractions of the two
all triplet contributions to probe loss; jProbe is the first-order       best match triplets (3 C1 ∗ and 3 C2 ∗ ), and kProbe+3 C1 ∗ and
rate constant for direct photodegradation of the probe, which            kProbe+3 C2 ∗ are the second-order reaction rate constants of
is negligible for our illumination times (< 4.3 × 10⁻⁶ s −1              the best model triplet matches. Equation (7) gives us two esti-
and 4.8 × 10⁻⁷ s−1 for SYR and MeJA, respectively, under                 mates of theP triplet steady-state
Davis winter conditions); and 6(kProbe+Other [Other]) is the                                             Pconcentration, one from each
                                                                         probe, i.e., [3 Ci ∗ ]SYR and [3 Ci ∗ ]MeJA . We averaged the
sum of contributions from all other oxidants. As described               two to obtain the best value
in Sect. S3, we estimate that these other oxidants (hydroper-                                         P for the triplet steady-state con-
                                                                         centration in each extract, [3 Ci ∗ ].
oxyl radical/superoxide radical anion, ozone, carbonate rad-                We next estimated the rate of triplet photoformation
ical, hydrogen ion/aquated electron) contribute 12 % or less             (P3 C∗ ):
of the average measured syringol loss (Sect. S3) and so are
ignored. We can then simplify and rearrange Eq. (5) to deter-            P3 C∗ = 6[3 C∗i ] × (k3 C∗ +O2 [O2 ] + (krxn + kQ )[DOC]),    (8)
mine the triplet contribution to probe loss:
                                                                         where k3 C∗ +O2 is the average bimolecular rate constant for
                                                                         quenching of the model triplets by O2 (= 2.8×10⁹ M−1 s−1 :
                                                                         Table S11 and Canonica et al., 2000), [O2 ] is the dissolved
                                                                         oxygen concentration of 284 µM at 20 ◦ C (USGS, 2018),
                                                                         krxn + kQ is the overall reaction and quenching rate constant

www.atmos-chem-phys.net/19/6579/2019/                                                      Atmos. Chem. Phys., 19, 6579–6594, 2019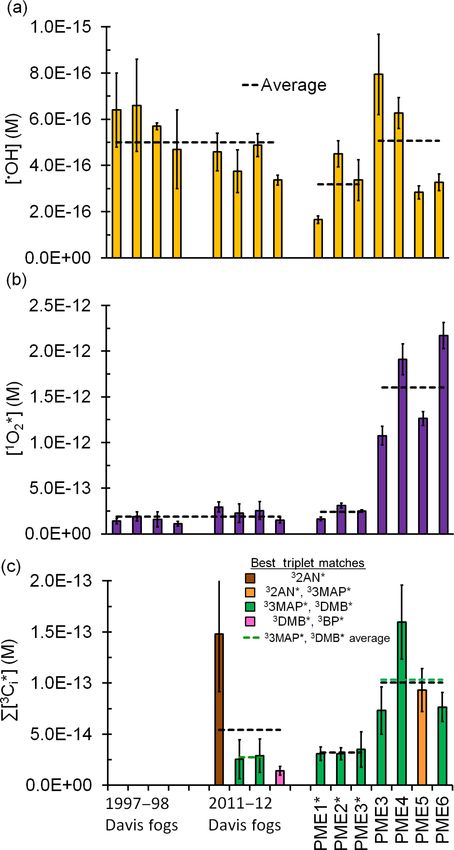
6584           R. Kaur et al.: Photooxidants from brown carbon and other chromophores in illuminated particle extracts

for triplets by DOC (9.3 × 10⁷ L (mol C)−1 s−1 ; see below),         NH+ 4 are not statistically different (p > 0.5) between the cur-
and [DOC] values are in Table S2. At the concentrations              rent particle extracts (PME) and previous fogs, although the
we used (10 µM), SYR and MeJA are negligible sinks for               ranges are much wider in the particle extracts (Table S2).
triplets. Measurements for triplets are in Tables S12 and S13.       Similar to nitrate, nitrite is another important source of hy-
   For all three photooxidants, the quantum yield of forma-          droxyl radical in the aqueous phase (Anastasio and McGre-
tion was calculated as                                               gor, 2001), with an average concentration of 6.9(±2.9) µM
                                                                     in the particle extracts, again statistically similar to the 2011
          POx
8Ox =          ,                                              (9)    fog average. On the other hand, the average concentration of
          Rabs                                                       potassium – commonly used as a tracer for biomass burning
                                                                     (Silva et al., 1999; Parworth et al., 2017) – is nearly 40 times
where POx is the Davis winter-solstice-normalized rate of ox-
                                                                     higher in the particles than in the 2011 Davis fog samples
idant photoproduction and Rabs is the rate of sunlight absorp-
                                                                     (p = 0.019), suggesting PME enrichment by residential win-
tion by the extract.
                                                                     tertime wood-burning. This is reflected in the dilute PM ex-
2.5.4    PM mass concentration factor (CF)                           tracts as well: even though most characteristics in the dilute
                                                                     extracts are similar to fog, the average K+ (38 ± 7 µM) in
Due to the volume required for our probe techniques, we ex-          the dilute PMEs is 10 times higher than the fog value. Dis-
tract particles into Milli-Q water, resulting in extracts that are   solved organic carbon (DOC) in the standard extracts (mean:
approximately 1000 times more dilute than ambient parti-             3400(±760) µM C) is, on average, 3 times higher than both
cles. To examine the impact of dilution on photooxidant con-         the dilute extracts and fog.
centrations, we extracted sample number 3 in five different             We employed two field blanks in this study, one each for
                                                             q       dilute and standard extraction conditions. Ions and DOC in
volumes of Milli-Q water (0.5 to 10 mL) and measured OH,
1 O ∗ , and 3 C∗ steady-state concentrations in the five extracts.
   2
                                                                     both field blanks are lower than 10 % of the corresponding
We define the PM mass concentration factor (CF) as the ratio         PME sample averages, with a few exceptions (Table S2).
of (PM mass) / (water mass) in a given extract relative to the
most concentrated extract that we can make:                          3.2   Light absorption in particle extracts

          VMIN                                                       As shown in Fig. 1a and Table S1, the path-length-
CF =              ,                                          (10)
        VEXT + VP                                                    normalized absorbance (α, cm−1 ) declines exponentially
                                                                     with wavelength, with values at 300 nm (α300 ) between 0.27
where VMIN is the minimum experimentally feasible volume             and 0.58 cm−1 for the standard extracts PME3–6. The av-
of Milli-Q needed for extraction of one filter square (0.5 mL),      erage α300 value is nearly 5 times higher in standard ex-
VEXT is the volume of Milli-Q used to extract a given fil-           tracts than values in Davis fog samples (Table S1, Fig. S3,
ter square (0.5 to 10 mL), and VP is the volume of probe             data available in Kaur and Anastasio, 2018a), while the di-
stock solution added (typically 20 µL). Values of CF for the         lute extracts (PME1*, PME2*, and PME3D2.5*) have ab-
PME3D extracts ranged from 0.05 (least concentrated) to              sorbances very similar to fog samples. Values of the absorp-
0.96 (most concentrated) and are listed in Table S14.                tion Ångström exponent (AAE) for all PM extracts range
                                                                     between 6.2 and 7.9 (Table S1), similar to those reported
2.5.5    Uncertainties
                                                                     previously for water-soluble particulate BrC from biomass
In figures, error bars represent ±1 standard error (SE) calcu-       burning (Hecobian et al., 2010; Kirchstetter and Thatcher,
lated by propagating the uncertainties in each term used to          2012). For both the fog and PM extracts the calculated rate
calculate the plotted value.                                         of sunlight absorption between 300 and 450 nm (Rabs ) is
                                                                     well correlated with dissolved organic carbon (DOC) (R 2 =
                                                                     0.89 and 0.67, respectively; Fig. S4), suggesting that BrC
3     Results and discussion                                         is mainly responsible for light absorption. The Rabs values
                                                                     for the standard extracts are high, with an average value of
3.1     General extract characteristics                              9.1(±4.1) × 10−6 mol photons L−1 s−1 , 5 times higher than
                                                                     the dilute extracts and past Davis fogs (Table S1). Similar to
Similar to Davis fogs collected in 1997–1998 (Anastasio and          fog (Kaur and Anastasio, 2018b), the average rate of sunlight
McGregor, 2001) and 2011 (Kaur and Anastasio, 2017), the             absorbance in the standard particle extracts is 17 times higher
most abundant ions in the particle extracts are ammonium             than the total formation rates of the three photooxidants (dis-
(NH+                                   −
     4 , 280–2600 µM) and nitrate (NO3 , 380–3300 µM) (Ta-           cussed later), indicating that most of the (photo) energy ab-
ble S2). This is expected since ammonium nitrate is the              sorbed is either dissipated via non-reactive pathways or leads
most significant inorganic component of wintertime parti-            to formation of other products.
cles in the Central Valley (Herner et al., 2006; Heald et al.,          We next calculated mass absorption coefficients for the
2012; Young et al., 2016). The average values of NO−   3 and         organics (MACDOC ) by subtracting the absorbance contri-

Atmos. Chem. Phys., 19, 6579–6594, 2019                                               www.atmos-chem-phys.net/19/6579/2019/
R. Kaur et al.: Photooxidants from brown carbon and other chromophores in illuminated particle extracts 6585
3.3 Hydroxyl radical
The average Davis winter-solstice-normalized rate of
q
OH photoproduction (POH ) in the standard extracts is
1.2(±0.5) × 10−9 M s−1 (i.e., 4.2 ± 1.7 µM h−1 ), 3.3 times
faster than the average of previous Davis fogs (Table S3).
q
In Davis fog, the main sources of OH were nitrite and ni-
trate photolysis, accounting for 70 %–90 % of measured POH
(Anastasio and McGregor, 2001; Kaur and Anastasio, 2017).
However, in the standard PM extracts, nitrite and nitrate to-
gether account for an average of only (34 ± 14) % of POH
(Table S4), while other unidentified species account for the
remaining (66±14) %. While NO− 2 and NO
−
concentrations
q 3
in PME and fog are similar, measured OH photoproduc-
tion rates are much higher in the particle extracts. The addi-
q
tional sources of OH likely include photo-Fenton processes
(Arakaki and Faust, 1998) and organic peroxides (Tong et al.,
2016, 2017; Lim and Turpin, 2015), although there is only a
modest correlation between DOC and POH due to unidenti-
fied sources (Fig. S6).
While organic compounds are potentially important
q
sources of OH in the particle extracts, they are almost
q
certainly the main OH sink, as found previously for at-
mospheric and surface waters (Brezonik and Fulkerson-
Brekken, 1998; Dong et al., 2010; Arakaki et al., 2013). The
Figure 1. (a) Light absorption coefficients, αλ , in particulate matter q 0 , in the
average (±1σ ) rate constant for OH destruction, kOH
extracts (PME) (Eq. 1) and field blanks (FB). The legend shows the 6 −1
standard extracts is 2.5(±1.1) × 10 s , 3 times higher than
sample identities, arranged from the highest absorbing (top) to low-
in dilute extracts and fog (Table S3); DOC concentrations
est absorbing (bottom) at 300 nm. Solid and dotted lines represent
standard and dilute extracts, respectively (with the latter indicated
in the standard PM extracts are similarly enhanced, rang-
with an asterisk; Sect. 2.2). (b) Mass absorption coefficients of DOC ing between 2350 and 4090 µM C (Table S2). Based on our
in the particle extracts (Eq. 3). calculations, inorganic species together account for no more
than 10 % of kOH 0 in the PM extracts except for PME3D10,
which is the most dilute sample and has the largest uncer-
q
butions by nitrite and nitrate from α and dividing by the tainty (Tables S5 and S6). The rate constant for OH de-
0
struction due to organics, i.e., kOH,org , obtained by subtract-
DOC concentration (Eq. 3). Across both standard and di-
lute extracts, the average (±σ ) MACDOC value at 300 nm is ing contributions of the inorganic sinks from kOH 0 , is well
2.2(±0.7) × 104 cm2 (g C)−1 , 1.7 times higher than the fog 2
correlated with DOC concentrations (R = 0.73) (Fig. S6).
sample average (Figs. 1b and S3; data available at Kaur and Arakaki et al. (2013) showed that the ratio kOH,org 0 /[DOC]
Anastasio, 2018a). Both α and MACDOC in the PME are gen- is relatively constant in atmospheric waters, with an average
erally higher than in fog, especially at shorter sunlight wave- (±1σ ) value of 3.8(±1.9) × 108 L (mol C)−1 s−1 . Our aver-
lengths (Fig. S5), although AAE values are similar in the ex- age (±1σ ) measured ratio in all particle extracts is nearly
tracts and fog (Table S1). Since MACDOC accounts for di- twice as high, 7.1(±2.7) × 108 L (mol C)−1 s−1 but not sta-
lution (Eq. 3), the higher values in PM extracts indicate that tistically different (Table S3).
q
water-soluble organics in particles are either more strongly Davis winter-solstice-normalized OH steady-state con-
light-absorbing (on a per-carbon basis) and/or less diluted centrations in all extracts are in the range of (1.7 − 7.9) ×
with non-absorbing DOC, compared to those in fog. Our 10−16 M, with an average (±1σ ) value of 5.1(±2.4) ×
PME mass absorption coefficients at 300 nm are very simi- 10−16 M in the standard extracts (Fig. 2a, Table S3). While
q q
lar to values reported for the humic-like fraction of biomass- both the OH photoproduction rate and rate constant for OH
burning aerosols in the Amazon basin (Hoffer et al., 2006) loss are approximately 3 times higher in the standard PM ex-
and for the water-soluble organic fractions of rural aerosols tracts compared to the dilute extracts and fog, the two en-
q
(Varga et al., 2001; Sun et al., 2007). hancements cancel out to give OH steady-state concentra-
Compared to the samples, light absorption in the field tions that are similar across all three sample types. This rela-
q
blanks is negligible, representing 0.7 % and 3 % of the av- tive consistency of OH concentrations has been reported for
erage α300 in the standard and dilute extracts, respectively a wide variety of atmospheric waters (Arakaki et al., 2013);
(Table S1). our average concentration is similar to most of these past re-
www.atmos-chem-phys.net/19/6579/2019/ Atmos. Chem. Phys., 19, 6579–6594, 20196586 R. Kaur et al.: Photooxidants from brown carbon and other chromophores in illuminated particle extracts
all particle extracts is (0.014±0.010) %, which is statistically
similar to the average fog result (Table S3): while photofor-
q
mation rates of OH increase from fog to standard particle
extracts (Table S3), light absorption shows a similar trend
(Table S1).
q
The rate of OH photoproduction in the field blanks is neg-
ligible, representing 1 % and 6 % of the average rate in stan-
dard and dilute extracts, respectively. The rate constants for
q 0 ) in the standard (FB2) and dilute (FB1)
OH destruction (kOH
field blanks represent 10 % and 43 % of the corresponding
PME averages. The latter result is puzzling, since the con-
q
centrations of OH sinks measured in FB1 (i.e., DOC and
NO− 2 ; Table S2) are much lower relative to the extract. We
discuss measurements of kOH 0 in the blanks in more detail in
Sect. S2. We do not subtract the field blank results for kOH 0
from the corresponding PM extract values and thus our sam-
ple results are upper bounds.
3.4 Singlet molecular oxygen
The average (±1σ ) Davis winter-solstice-normalized 1 O2 ∗
concentration in the dilute extracts (2.4(±0.7) × 10−13 M) is
very similar to the previous fog average (Fig. 2b). This is
likely because brown carbon is the source of 1 O2 ∗ (Faust and
Allen, 1992; Zepp et al., 1977) and the DOC concentrations
in the fog and dilute extracts are very similar (Table S2). On
the other hand, the average [1 O2 ∗ ] in the more concentrated,
standard PM extracts (PME3–6) is 1.6(±0.5) × 10−12 M,
nearly 7 times higher than the averages in Davis fog and di-
lute extracts (Fig. 2b, Table S7). This is because the standard
extracts have higher DOC concentrations but the same major
1 O ∗ sink, i.e., water. Across all fog and particle extracts, the
2
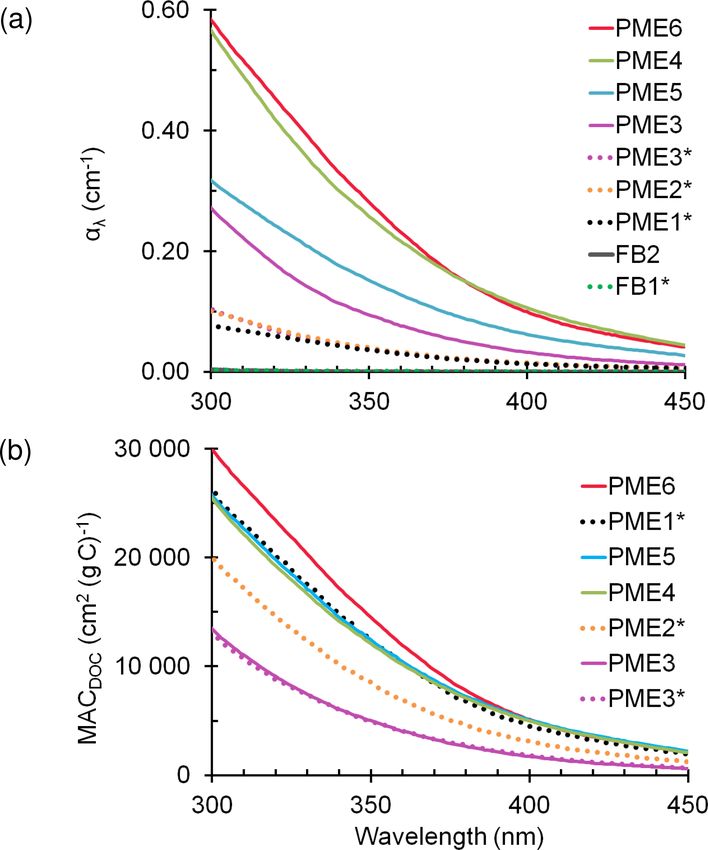
rate of singlet oxygen formation (P1 O2 ∗ ) is strongly corre-
lated with the rate of sunlight absorption (Rabs ) (R 2 = 0.94;
Fig. 3a), although this correlation is not evident in only the
q
fog samples (Kaur and Anastasio, 2017). As seen for OH,
quantum yields of 1 O2 ∗ are similar in the extracts (standard
and dilute) and fog (Table S7); the slope of the P1 O2 ∗ versus
Figure 2. Measured steady-state concentrations of (a) hydroxyl rad- Rabs correlation line (Fig. 3a) gives an overall quantum yield
ical, (b) singlet molecular oxygen, and (c) oxidizing triplet excited of 1 O2 ∗ of (3.8 ± 0.2) %; i.e., across all samples roughly 4 %
states of organic matter in particle extracts, along with previous
of the photons absorbed lead to the formation of singlet oxy-
measurements made in Davis fogs collected between 1997–1998
gen. This is nearly 260 times higher than the average quan-
and 2011–2012 (Anastasio and McGregor, 2001; Kaur and Anasta- q
sio, 2017, 2018b). All concentrations are normalized to Davis mid- tum yield of OH. Our quantum yields for singlet oxygen
day, winter-solstice sunlight. Dilute particle extracts are indicated formation in PM extracts are similar to values previously re-
with an asterisk. Dashed lines represent sample averages. ported for surface water organics (e.g., 2 %–5 % in Zhou et
al. (2019).
3.5 Triplet excited states of organic matter (3 C∗ )
q
sults (Fig. S7). As we discuss in Sect. 3.6, transport of OH
from the gas phase is also an important source to drops and We also determined the kinetics and concentrations of oxi-
particles, but its importance decreases with decreasing parti- dizing triplets by measuring the loss of two probes, syringol
cle size. (SYR) and methyl jasmonate (MeJA) (Fig. S8). In the stan-
We also calculated the quantum yield of hydroxyl radical dard extracts, the average (±σ ) Davis winter-normalized rate
formation, i.e., the fraction of absorbed photons that result in 0
constants for loss of SYR and MeJA (kProbe ) are (4.3±1.7)×
q −4 −1 −5 −1
OH formation (Eq. 9). The average (±1σ ) value of 8OH in 10 s and (2.6 ± 0.7) × 10 s , which are equivalent to
Atmos. Chem. Phys., 19, 6579–6594, 2019 www.atmos-chem-phys.net/19/6579/2019/R. Kaur et al.: Photooxidants from brown carbon and other chromophores in illuminated particle extracts 6587
7.9 and 37 (Table S12), which is a narrower range than in
Davis fog samples (7.5 to 110) (Kaur and Anastasio, 2018b).
0
Based on the kProbe, 3 C∗ ratios, triplets in the PM extracts
generally have an average reactivity similar to model aro-
matic triplets 3’-methoxyacetophenone (3 3MAP∗ ) and 3,4-
dimethoxybenzaldehyde (3 DMB∗ ) (Fig. 2c, Table S12). The
average (±σ ) triplet steady-state concentration in the stan-
dard extracts is 1.0(±0.4) × 10−13 M (Fig. 2c, Table S13),
which is nearly twice the fog average but not statistically
significantly different. If we consider only the PM and fog
samples that have triplet reactivities similar to 3 3MAP∗ and
3 DMB∗ (i.e., the green average lines in Fig. 2c), the aver-
age triplet concentration in the standard PM extracts is nearly
4 times greater than in fog (Table S2), similar to the ratio of
DOC concentrations.
In the standard extracts the average concentration of ox-
idizing triplets is 16 times lower than [1 O2 ∗ ] but nearly
q
200 times higher than [ OH] from in situ sources. Our
measurements of oxidizing triplet concentrations lie at the
higher end of measured and estimated concentrations of total
(i.e., oxidizing and energy transfer) triplets in surface wa-
ters, 10−15 –10−13 M (Zepp et al., 1985; Grebel et al., 2011).
The average (±1σ ) rate of triplet photoformation, P3 C∗ ,
is 2.0(±1.0) × 10−7 M s−1 (i.e., 720(±360) µM h−1 ) in the
standard extracts (Table S13). Thus the ratios of the average
q
production rates for 1 O2 ∗ , 3 C∗ , and OH are 290 : 170 : 1.
There is a fair correlation between P3 C∗ and Rabs (Fig. 3b),
similar to the case for P1 O2 ∗ (Fig. 3a), which is consistent
Figure 3. Correlations between (a) the rate of singlet oxygen pho-
toproduction normalized to Davis winter-solstice sunlight (P1 O2 ∗ ),
with BrC as the source of triplets. Sample-to-sample vari-
(b) the rate of triplet photoproduction normalized to Davis winter- ability in the fraction of the total triplet pool that can oxi-
solstice sunlight (P3 C∗ ), and the rate of light absorption (Rabs ) be- dize organics likely causes the P3 C∗ correlation (R 2 = 0.81)
tween 300 and 450 nm. Triplet rates for the fog samples were ad- to be weaker than that of P1 O2 ∗ (R 2 = 0.94). The average
justed to account for the small DOC sink for triplets (Eq. 8). The (±1σ ) oxidizing triplet quantum yield in standard extracts is
P /Rabs ratios (±1 SE) listed are unitless and represent the quan- (2.4 ± 1.0) % (Table S13), approximately 2 times lower than
tum yields. the value for 1 O2 ∗ (Table S7) but 150 times higher than for
q
OH (Table S3). Our triplet quantum yields are within the
wide range of values that has been reported for surface wa-
average lifetimes of 0.70(±0.20) and 11(±3) h, respectively ters, approximately 0.4 %–7 % (Zepp et al., 1985; Grebel et
(Tables S8 and S9). Triplet probe lifetimes in the dilute ex- al., 2011; Zhou et al., 2019).
tracts are approximately 3 times longer and are very similar Triplet excited states have two main reaction pathways:
to fog values, indicating that the main source of triplet pre- energy transfer (e.g., to make 1 O2 ∗ ) and electron transfer
cursors to fog drops is the BrC present in the fog condensa- (e.g., to oxidize a phenol) (Zepp et al., 1985; McNeill and
tion nuclei rather than mass transport from the gas phase. Canonica, 2016; Kaur and Anastasio, 2018b). Essentially all
We correct the loss of triplet probes for oxidation by hy- triplets possess enough energy to form 1 O2 ∗ (McNeill and
droxyl radical and singlet molecular oxygen (Eq. 6). In the Canonica, 2016), but only a subset of the triplet pool can oxi-
q
standard extracts, 1 O2 ∗ and OH account for an average of dize organics via electron transfer. Thus the quantum yield of
13 % and 3 % of SYR loss, respectively (Table S8, Fig. S9); 1 O ∗ can be used to estimate the total triplet quantum yield,
2
for methyl jasmonate, the corresponding contributions are while our measurements of 83 C∗ constrain the smaller subset
37 % and 13 %. of oxidizing triplets (assuming energy transfer from triplets
Next we use the ratio of the pseudo-first-order rate con- is the only source of 1 O2 ∗ ). The quantum yield for all triplets
stants for probe losses by triplets, i.e., kSYR, 0 0
3 C∗ /kMeJA,3 C∗ , can be estimated as 81 O2 ∗ /f1 , where f1 , the fraction of 3 C∗
to characterize the average reactivity of the triplet species in interactions with dissolved O2 that yield 1 O2 ∗ , is approxi-
each sample: a ratio close to 1 indicates higher reactivity, mately 0.5 (McNeill and Canonica, 2016; Kaur and Anasta-
while a higher ratio indicates lower reactivity. The kProbe, 0
3 C∗ sio, 2018b). For our standard extracts, the average value of
0 0
ratio (i.e., kSYR,3 C∗ /kMeJA,3 C∗ ) in all extracts ranges between
www.atmos-chem-phys.net/19/6579/2019/ Atmos. Chem. Phys., 19, 6579–6594, 20196588 R. Kaur et al.: Photooxidants from brown carbon and other chromophores in illuminated particle extracts
Figure 4. Effect of change in aqueous particle mass concentration (i.e., sample dilution) for sample PME3 on (a) rate of light absorption and
the steady-state concentrations of (b) hydroxyl radical, (c) singlet molecular oxygen, and (d) oxidizing triplet excited states of organic matter.
The last panel shows both linear (dotted) and hyperbolic (dashed) fits to the data. In each plot the x axis is a measure of sample dilution, with
higher concentration factors corresponding to more concentrated particle extracts (Eq. 10).
81 O2 ∗ /f1 is 0.078 ± 0.019; i.e., approximately 8 % of the mophores are efficiently extracted for all Milli-Q volumes
photons absorbed by brown carbon chromophores make a employed.
triplet excited state. Next we use the ratio 83 C∗ /(81 O2 ∗ /f1 ) The change in photooxidant concentration with CF de-
to estimate the fraction of all triplets that can participate in pends on how the ratio of sources and sinks varies with di-
electron-transfer (oxidation) reactions. The average value of lution. In the case of hydroxyl radical, POH and kOH 0 both
this fraction is 0.35 ± 0.12 for all the PM extracts; i.e., on increase as extracts get more concentrated (i.e., as CF in-
q
average, approximately a third of all triplets are oxidizing creases), resulting in an OH concentration that is noisy but
(range = 18 %–50 %; Table S13). essentially unchanged over the 20-fold increase in concen-
tration factor (Fig. 4b). This result is consistent with the rel-
q
3.6 Predicting photooxidant concentrations in ambient atively constant [ OH] in our particle extracts relative to fog
particle water (Fig. 3a, dashed black lines) and with prior results showing
very similar concentrations for rain, cloud, fog, and marine
PM extracts (Fig. S7 and Arakaki et al., 2013).
Since our particle extracts are approximately 1000 times q
To estimate [ OH] in particle liquid water, we use the mea-
more dilute than ambient Davis particles during winter, we q
want to be able to estimate oxidant concentrations under sured linear dependences of the rate of OH photoproduction
0
(POH ) and loss rate constant (kOH ) on concentration factor,
ambient conditions. To do this we first measured photoox-
idant concentrations as a function of dilution for the same which corresponds to a measured PM mass/water mass ra-
sample and then extrapolated our results to ambient parti- tio (Fig. S10). Under a typical wintertime, Central Valley
cle conditions. For the first step, we extracted squares of ambient particle water condition (1 µg PM/µg H2 O), the in
filter number 3 using five different volumes of Milli-Q wa- situ POH and kOH0 are estimated to be 4.2 × 10⁻⁶ M s−1 and
9 −1
5.5 × 10 s , respectively (Fig. S10). This extrapolation of
ter, from 10 to 0.50 mL (Sect. 2.5.4), corresponding to aque- q
ous PM mass concentration factors (CF) of 0.05 (most di- only aqueous processes gives an OH concentration in parti-
−16
lute) to 0.96 (most concentrated) (Eq. 10). For this sample, cle water of 7.6 × 10 M, which is similar to the average
these are equivalent to PM solute mass/water mass ratios typ- of the measurements in Fig. 4b. However, this estimate does
not include the contribution of mass transport of gas-phase
ical for dilute to very concentrated cloud or fog drops, i.e., q
(0.35 − 8.4) × 10−4 µg PM/µg H2 O; in comparison, ambient OH to the particles. As detailed in Sect. S4, we estimate
q
particles have ratios of approximately 1 µg PM/µg H2 O and that the rate of OH gas-to-particle transport under particle
conditions is 4.2 × 10⁻⁷ M s−1 , which is approximately 10 %
higher (Table S14). The rate of light absorption increases lin- q
early with CF (Fig. 4a), indicating that BrC and other chro- of the OH photoformation rate from aqueous sources. Fig-
Atmos. Chem. Phys., 19, 6579–6594, 2019 www.atmos-chem-phys.net/19/6579/2019/R. Kaur et al.: Photooxidants from brown carbon and other chromophores in illuminated particle extracts 6589
q
ure 5 shows estimated OH steady-state concentrations con-
sidering both aqueous reactions and gas-phase mass transport
q
across a wide range of drop-to-particle conditions: [ OH] de-
creases from 5.4×10⁻¹⁵ M under dilute drop conditions (3×
10−5 µg PM/µg H2 O) to 8.4 × 10⁻¹⁶ M under the much more
concentrated particle conditions (1 µg PM/µg H2 O). The cal-
q
culated [ OH] values (orange line in Fig. 5) are higher than
our measured values (orange points in Fig. 5) because of the
gas-phase mass transport source. Changes in this source are
q
also responsible for the slow decrease in calculated [ OH] as
conditions become more concentrated (i.e., as µg PM/µg H2 O
increases). In the case of singlet oxygen, steady-state concen-
trations increase proportionally with PM mass concentration
factor (Fig. 4c). Our interpretation of this result is that the
concentrations of 1 O2 ∗ sources (i.e., BrC) increase propor-
Figure 5. Dependence of photooxidant concentrations on particle
tionally with concentration factor, while the concentration of mass/water mass ratio (i.e., aqueous particle concentration) in ex-
the main sink for 1 O2 ∗ (i.e., water) is essentially unchanged. tracts of sample PME3. Solid diamonds are measured values under
At higher PM mass/water mass ratios, we calculate that or- experimental dilution conditions (typical for clouds or fogs), while
ganic compounds become a significant sink for singlet oxy- the open circles are values expected in more concentrated particle
gen (Sect. S4), leading to a plateau in [1 O2 ∗ ] under the more liquid water based on the dashed line extrapolations. For the solid
concentrated conditions of particles (Fig. 5). This extrapo- symbols, error bars (±1σ ) are often smaller than the symbols. Data
lation for ambient PM conditions (1 µg PM/µg H2 O) predicts labels on the diamonds (e.g., D10) represent the water volume used
an 1 O2 ∗ concentration in particle water of 1.6×10⁻¹⁰ M (Ta- to extract the PME3 filter square (Sect. 2.5.4). The dashed line ex-
ble S15, Fig. 5), which is 2400 times higher than our pre- trapolations include the contributions from both aqueous processes
and interactions with the gas phase (Sect. S4). For oxidizing triplets,
diction for dilute fog/cloud drops. While there are no other
two extrapolation scenarios are shown: a best estimate (lower line)
measurements of 1 O2 ∗ in particles, similar enhancements in
1 O ∗ concentrations (up to a factor of roughly 104 ) have been and a high estimate (upper line), as described in Sect. S4 and Ta-
2 ble S15.
found in cases where 1 O2 ∗ precursors become highly con-
centrated, e.g., in liquid-like regions of ice (Bower and Anas-
tasio, 2013) and in regions of hydrophobic chromophoric dis-
in Sect. S5, by fitting a kinetic model to our triplet dilu-
solved organic matte (CDOM) in solution (Latch and Mc-
tion data we estimate that the total (reaction and quenching)
Neill, 2006).
rate constant for triplets with DOC in the PME3 extracts is
An increase in extract concentration (i.e., CF) also in-
9.3(±1.3) × 107 L (mol C)−1 s−1 .
creases the triplet steady-state concentration (Fig. 4d), but
These two extrapolations result in oxidizing triplet con-
there is greater uncertainty in this trend, in part because
centrations under PM conditions (1 µg PM/µg H2 O) of 2.3 ×
there is more uncertainty in measurements of 6[3 Ci ∗ ]. As
10−13 M (best fit) and 1.3 × 10⁻¹¹ M (high estimate). Taken
described in Sect. S4, we fit the data in Fig. 4d with a hy-
together with the other oxidant measurements, we estimate
perbolic regression under two cases: (1) a best fit, where pa- q
that the ratio of 1 O2 ∗ : 3 C∗ : OH concentrations in ambient
rameters were adjusted to minimize the regression error; and
particle water is approximately 105 : 104 − 102 : 1.
(2) a high-estimate fit, where parameters were adjusted so
that the regression line passed near the upper portion of the
error bar for the CF 0.96 data point. These are the dashed
and dotted lines in Fig. 4d, respectively. In both cases the 4 Implications
triplet concentration initially rises more quickly with CF but
q
then approaches a plateau at higher CF values. Our interpre- Our dilution experiments suggest that OH, 1 O2 ∗ , and 3 C∗
tation of this behavior is that as CF increases, [DOM] and behave very differently as the PM/water ratio increases from
P3 C∗ increase linearly but the dominant triplet sink switches cloud and fog drop conditions to water-containing parti-
from dissolved O2 at low CF to DOM at high CF. Wenk cles (Fig. 5). To understand what this implies for the fate
et al. (2011, 2013) have shown that surface water DOM of organic compounds, we estimated the gas–aqueous par-
can quench triplets when DOM concentrations are greater titioning and lifetimes of five model organic compounds
than 20 mg C L−1 ; in the PME3D extracts of Fig. 4, DOM for both fog and aqueous aerosol (Fig. 6). We consider re-
q
ranges from 4.3 to 86 mg C L−1 (Table S2). Based on our actions with two gas-phase oxidants ( OH, O3 ) and four
q 1 ∗ 3 ∗
previous work, we believe that phenols from wood combus- aqueous-phase oxidants ( OH, O3 , O2 , C ) (Table S16).
tion are reacting with (and physically quenching) triplets in Our model organics represent two groups in terms of gas–
our PM extracts (Smith et al., 2014, 2015). As described aqueous partitioning: one group with modest Henry’s law
www.atmos-chem-phys.net/19/6579/2019/ Atmos. Chem. Phys., 19, 6579–6594, 2019You can also read