MEASUREMENTS OF AND P SPECTRA IN 7BE+9BE COLLISIONS AT BEAM MOMENTA FROM 19 A TO 150 A GEV/C WITH THE NA61/SHINE SPECTROMETER AT THE ...
←
→
Page content transcription
If your browser does not render page correctly, please read the page content below
Eur. Phys. J. C       (2021) 81:73
https://doi.org/10.1140/epjc/s10052-020-08733-x

 Regular Article - Experimental Physics

Measurements of π ± , K ± , p and p̄ spectra in 7 Be+9 Be collisions at
beam momenta from 19 A to 150 A GeV/c with the NA61/SHINE
spectrometer at the CERN SPS
NA61/SHINE Collaboration

A. Acharya9 , H. Adhikary9 , A. Aduszkiewicz15 , K. K. Allison25 , E. V. Andronov21 , T. Antićić3 , V. Babkin19 ,
M. Baszczyk13 , S. Bhosale10 , A. Blondel4 , M. Bogomilov2 , A. Brandin20 , A. Bravar23 , W. Bryliński17 , J. Brzychczyk12 ,
M. Buryakov19 , O. Busygina18 , A. Bzdak13 , H. Cherif6 , M. Ćirković22 , M. Csanad 7 , J. Cybowska17 , T. Czopowicz9,17 ,
A. Damyanova23 , N. Davis10 , M. Deliyergiyev9 , M. Deveaux6 , A. Dmitriev 19 , W. Dominik15 , P. Dorosz13 , J. Dumarchez4 ,
R. Engel5 , G. A. Feofilov21 , L. Fields24 , Z. Fodor7,16 , A. Garibov1, M. Gaździcki6,9 , O. Golosov20 , V. Golovatyuk 19 ,
M. Golubeva18 , K. Grebieszkow17 , F. Guber18 , A. Haesler23 , S. N. Igolkin21 , S. Ilieva2 , A. Ivashkin18 , S. R. Johnson25 ,
K. Kadija3 , N. Kargin20 , E. Kashirin20 , M. Kiełbowicz10 , V. A. Kireyeu19 , V. Klochkov6 , V. I. Kolesnikov19 , D. Kolev2 ,
A. Korzenev23 , V. N. Kovalenko21 , S. Kowalski14 , M. Koziel6 , B. Kozłowski17 , A. Krasnoperov19 , W. Kucewicz13 ,
M. Kuich15,a , A. Kurepin18 , D. Larsen12 , A. László7 , T. V. Lazareva21 , M. Lewicki16 , K. Łojek12 , V. V. Lyubushkin19 ,
M. Maćkowiak-Pawłowska17 , Z. Majka12 , B. Maksiak11 , A. I. Malakhov19 , A. Marcinek10 , A. D. Marino25 , K. Marton7 ,
H. -J. Mathes5 , T. Matulewicz15 , V. Matveev19 , G. L. Melkumov19 , A. O. Merzlaya12 , B. Messerly26 , Ł. Mik13 ,
S. Morozov18,20 , S. Mrówczyński9 , Y. Nagai25 , M. Naskre˛t16 , V. Ozvenchuk10 , V. Paolone26 , O. Petukhov18 , R. Płaneta12 ,
P. Podlaski15 , B. A. Popov4,19 , B. Porfy7 , M. Posiadała-Zezula15 , D. S. Prokhorova21 , D. Pszczel11 , S. Puławski14 ,
J. Puzović22 , M. Ravonel23 , R. Renfordt6 , D. Röhrich8 , E. Rondio11 , M. Roth5 , B. T. Rumberger25 , M. Rumyantsev19 ,
A. Rustamov1,6 , M. Rybczynski9 , A. Rybicki10 , S. Sadhu9 , A. Sadovsky18 , K. Schmidt14 , I. Selyuzhenkov20 ,
A. Yu. Seryakov21 , P. Seyboth9 , M. Słodkowski17 , P. Staszel12 , G. Stefanek9 , J. Stepaniak11 , M. Strikhanov20 , H. Ströbele6 ,
T. Šuša3 , A. Taranenko20 , A. Tefelska17 , D. Tefelski17 , V. Tereshchenko19 , A. Toia6 , R. Tsenov2 , L. Turko16 , R. Ulrich5 ,
M. Unger5 , D. Uzhva21 , F. F. Valiev21 , D. Veberič5 , V. V. Vechernin21 , A. Wickremasinghe24,26 , Z. Włodarczyk9 ,
K. Wójcik14 , O. Wyszyński9 , E. D. Zimmerman25 , R. Zwaska24
1  National Nuclear Research Center, Baku, Azerbaijan
2  Faculty of Physics, University of Sofia, Sofia, Bulgaria
 3 Ruder Bošković Institute, Zagreb, Croatia
       ¯
 4 LPNHE, University of Paris VI and VII, Paris, France
 5 Karlsruhe Institute of Technology, Karlsruhe, Germany
 6 University of Frankfurt, Frankfurt, Germany
 7 Wigner Research Centre for Physics of the Hungarian Academy of Sciences, Budapest, Hungary
 8 University of Bergen, Bergen, Norway
 9 Jan Kochanowski University in Kielce, Kielce, Poland
10 Institute of Nuclear Physics, Polish Academy of Sciences, Kraków, Poland
11 National Centre for Nuclear Research, Warsaw, Poland
12 Jagiellonian University, Kraków, Poland
13 AGH-University of Science and Technology, Kraków, Poland
14 University of Silesia, Katowice, Poland
15 University of Warsaw, Warsaw, Poland
16 University of Wrocław, Wrocław, Poland
17 Warsaw University of Technology, Warsaw, Poland
18 Institute for Nuclear Research, Moscow, Russia
19 Joint Institute for Nuclear Research, Dubna, Russia
20 National Research Nuclear University (Moscow Engineering Physics Institute), Moscow, Russia
21 St. Petersburg State University, St. Petersburg, Russia
22 University of Belgrade, Belgrade, Serbia
23 University of Geneva, Geneva, Switzerland
24 Fermilab, Batavia, USA
25 University of Colorado, Boulder, USA
26 University of Pittsburgh, Pittsburgh, USA

Received: 5 October 2020 / Accepted: 4 December 2020
© The Author(s) 2021

                                       0123456789().: V,-vol                                                            123
73   Page 2 of 38                                                                  Eur. Phys. J. C     (2021) 81:73

Abstract The NA61/SHINE experiment at the CERN                    importance when data on proton-proton, neutron-proton and
Super Proton Synchrotron (SPS) studies the onset of decon-        neutron-neutron are not available to construct the nucleon-
finement in hadron matter by a scan of particle production        nucleon reference [7].
in collisions of nuclei with various sizes at a set of energies       The paper is organized as follows: after this introduction
covering the SPS energy range. This paper presents results        the experiment is briefly presented in Sect. 2. The analysis
on inclusive double-differential spectra, transverse momen-       procedure, as well as statistical and systematic uncertain-
tum and rapidity distributions and mean multiplicities of π ± ,   ties are discussed in Sect. 3. Section 4 presents experimen-
K ± , p and p̄ produced in the 20% most central 7 Be+9 Be         tal results and compares them with measurements of NA61/
collisions at beam momenta of 19A, 30A, 40A, 75A and              SHINE in inelastic p+p interactions [8–10] and NA49 in
150A GeV/c. The energy dependence of the K ± /π ± ratios          Pb+Pb collisions [11,12]. Section 5 discusses model predic-
as well as of inverse slope parameters of the K ± transverse      tions. A summary in Sect. 6 closes the paper.
mass distributions are close to those found in inelastic p+p          The following variables and definitions are used in this
reactions. The new results are compared to the world data         paper. The particle rapidity y is calculated in the collision
on p+p and Pb+Pb collisions as well as to predictions of the      center of mass system (cms), y = 0.5·ln[(E + p L )/(E − p L )],
Epos, Urqmd, Ampt, Phsd and Smash models.                         where E and p L are the particle energy and longitudinal
                                                                  momentum, respectively. The transverse component of the
                                                                  momentum is denoted    as pT and the transverse mass m T is
1 Introduction                                                    defined as m T = m 2 + (cpT )2 where m is the particle mass
                                                                  in GeV. The momentum in the laboratory frame is denoted
This paper presents experimental results on inclusive spectra     plab and the collision energy per nucleon pair in the center
                                                                               √
and mean multiplicities of π ± , K ± , p and p̄ produced in the   of mass by s N N .
20% most central 7 Be+9 Be collisions at beam momenta of              Results of the measurements correspond to collisions with
                                          √
19A, 30A, 40A, 75A and 150A GeV/c ( s N N = 6.1, 7.6, 8.8,        low energy emitted into the forward beam spectator region.
11.9 and 16.8 GeV). These studies form part of the strong         For 7 Be+9 Be collisions this energy is not tightly correlated
interactions programme of NA61/SHINE [1] investigating            with geometric parameters of the interaction such as the col-
the properties of the onset of deconfinement and searching        lision impact parameter of the collision (see Sect. 3.1). This
for the possible existence of a critical point. This requires a   is caused by the small number of nucleons and the clus-
two dimensional scan in collision energy and nuclear mass         ter structure of the Be nucleus. Nevertheless, following the
number of the colliding nuclei. Such a scan allows to explore     convention widely used in the analysis of nucleus-nucleus
systematically the phase diagram of strongly interacting mat-     collisions, the term central is used for events selected by
ter [1]. An increase of collision energy causes an increase of    imposing an upper limit on this energy.
temperature and a decrease of baryon chemical potential of
strongly interacting matter at freeze-out , whereas increasing
the nuclear mass number of the colliding nuclei decreases         2 Experimental setup of NA61/SHINE
the temperature [2].
   Pursuing this programme NA61/SHINE recorded data               2.1 Detector
on p+p, Be+Be, Ar+Sc, Xe+La and Pb+Pb collisions.
Moreover, further measurements of Pb+Pb interactions are          The NA61/SHINE experiment is a multi-purpose facility
planned with an upgraded detector [3] starting in 2021.           designed to measure particle production in nucleus+nucleus,
   The 7 Be+9 Be collisions (see Ref. [4] for results on π −      hadron+nucleus and p+p interactions [13]. The detector is
production) play a special role in the NA61/SHINE scan            situated at the CERN Super Proton Synchrotron (SPS) in the
programme. First, it was predicted within the statistical         H2 beamline of the North experimental area. A schematic
models [5,6] that the yield ratio of strange hadrons to           diagram of the setup is shown in Fig. 1.
pions in these collisions should be close to those in cen-           The main components of the produced particle detec-
tral Pb+Pb collisions and significantly higher than in p+p        tion system are four large volume Time Projection Cham-
interactions. Second, the collision system composed of a          bers (TPC). Two of them, called Vertex TPCs (VTPC), are
7 Be and a 9 Be nucleus has eight protons and eight neutrons,
                                                                  located downstream of the target inside superconducting
and thus is isospin symmetric. Within the NA61/SHINE              magnets with maximum combined bending power of 9 Tm.
scan programme the 7 Be+9 Be collisions serve as the low-         The magnetic field was scaled down in proportion to the beam
est mass isospin symmetric reference needed to study colli-       momentum in order to obtain similar phase space acceptance
sions of medium and large mass nuclei. This is of particular      at all energies. The main TPCs (MTPC) and two walls of
                                                                  pixel Time-of-Flight (ToF-L/R) detectors are placed sym-
a e-mail:   mkuich@cern.ch (corresponding author)                 metrically to the beamline downstream of the magnets. The

123
Eur. Phys. J. C (2021) 81:73 Page 3 of 38 73
Fig. 1 The schematic layout of the NA61/SHINE experiment at the tem as shown in the figure: its origin lies in the middle of VTPC-2,
CERN SPS [13] showing the components used for the Be+Be energy on the beam axis. The nominal beam direction is along the z-axis. The
scan (horizontal cut, not to scale). The beam instrumentation is sketched magnetic field bends charged particle trajectories in the x–z (horizontal)
in the inset (see also Fig. 2). Alignment of the chosen coordinate sys- plane. The drift direction in the TPCs is along the y (vertical) axis
fifth small TPC (GAP-TPC) is placed between VTPC1 and mated increase of the produced pion multiplicity by less than
VTPC2 directly on the beam line. The TPCs are filled with 0.5% due to the small admixture of heavier elements [15].
Ar:CO2 gas mixtures in proportions 90:10 for the VTPCs No correction was applied for this negligible contamination.
and the GAP-TPC, and 95:5 for the MTPCs. Data were taken with target inserted (denoted I, 90%) and
The Projectile Spectator Detector (PSD), which measures target removed (denoted R, 10%).
mainly the energy in the forward region of projectile specta-
tors, is positioned 20.5 m (16.7 m) downstream of the target 2.2 Trigger
during measurements at 75A and 150A GeV/c (19A, 30A,
40A GeV/c) centered in the transverse plane on the position The schematic of the placement of the beam and trigger detec-
of the deflected beam. The PSD is used as a part of the trig- tors can be seen in Fig. 2. The trigger detectors consist of a set
ger system (see Sect. 2.2) to accept collisions by imposing an of scintillation counters recording the presence of the beam
upper limit on the energy measured in the 16 central modules particle (S1, S2), a set of veto scintillation counters with a
and also to select central events in analysis procedure (see hole used to reject beam particles passing far from the centre
Sect. 3.1). of the beamline (V0, V1), and a Cherenkov charge detector
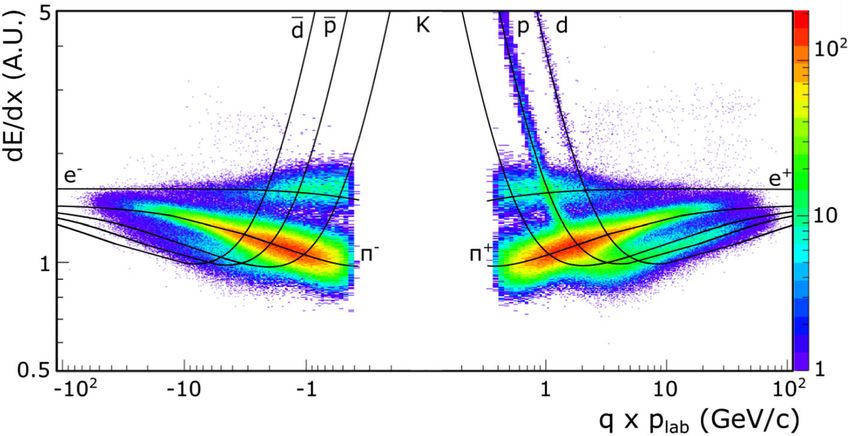
The beamline instrumentation is schematically depicted in (Z). Beam particles were defined by the coincidence T1 =
Fig. 2. It is designed for obtaining high beam purity with sec- S1 · S2 · V1 · Z(Be) and T1 = S1 · V0 · V1 · V1’ · Z(Be) for low
ondary ion beams [14] produced by fragmenting the primary and high momentum data taking respectively. An interaction
Pb82+ ions extracted from the SPS. A detailed discussion of trigger detector (S4) was used to check whether the beam
the properties of selected 7 Be ions can be found in Ref. [4]. particle changed charge after passing through the target. In
A set of scintillation counters as well as beam position addition, collisions were selected by requiring an energy sig-
detectors (BPDs) upstream of the spectrometer provide tim- nal below a set threshold from the 16 central modules of the
ing reference, selection, identification and precise measure- PSD. The event trigger condition thus was T2 = T1·S4 · PSD
ment of the position and direction of individual beam parti- or T2 = T1·PSD for low and high beam momenta, respec-
cles. tively. The PSD threshold was set to retain from ≈ 70% to
The target was a plate of 9 Be of 12 mm thickness placed ≈ 40% of inelastic collisions at low and high beam momenta,
≈ 80 cm upstream of VTPC1. Mass concentrations of impu- respectively. The statistics of recorded events is summarised
rities in the target were measured at 0.3%, resulting in an esti- in Table 1.
12373 Page 4 of 38 Eur. Phys. J. C (2021) 81:73
Fig. 2 The schematic of the placement of the beam and trigger detec- position and charge detectors BPD, as well as a Cerenkov detector Z.
tors in high-momentum (top) and low-momentum (bottom) data taking Note, that the PSD calorimeter was almost 4 m closer for low momen-
configurations showing beam counters S, veto counters V and beam tum data taking
Table 1 Basic beam properties and number of events recorded and used in the analysis for Be+Be interactions of the 20% most central collisions
√
pbeam (AGeV/c) s N N (GeV) Number of event triggers Number of events after selection cuts
19 6.1 3.46 × 10⁶ 1.32 × 10⁵
30 7.6 5.41 × 10⁶ 1.48 × 10⁵
40 8.8 3.42 × 10⁶ 3.97 × 10⁵
75 11.9 5.24 × 10⁶ 3.99 × 10⁵
150 16.8 2.93 × 10⁶ 3.25 × 10⁵
3 Analysis procedure (a) contribution from off-target interactions,
(b) losses of in-target interactions due to the event selection
This section starts with a brief overview of the data analysis criteria,
procedure and the applied corrections. It also defines to which (c) geometrical acceptance,
class of particles the final results correspond. A description (d) reconstruction and detector inefficiency,
of the calibration and the track and vertex reconstruction (e) losses of tracks due to track selection criteria,
procedures can be found in Ref. [8]. (f) contribution of particles other than primary (see below)
The analysis procedure consists of the following steps: charged particles produced in Be+Be interactions,
(g) losses of primary charged particles due to their decays
and secondary interactions.
(i) application of event and track selection criteria,
(ii) determination of raw spectra of identified charged
hadrons using the selected events and tracks, Correction (a) was not applied due to insufficient statistics
(iii) evaluation of corrections to the raw spectra based on of the target removed data. The contamination of the target
experimental data and simulations, inserted data was estimated from the z distribution of fitted
(iv) calculation of the corrected spectra and mean multi- vertices to amount to ≈ 0.35%.
plicities, Corrections (b)–(g) were estimated by data and simula-
(v) calculation of statistical and systematic uncertainties. tions. MC events were generated with the Epos1.99 model
(version CRMC 1.5.3) [16], passed through detector sim-
ulation employing the Geant 3.21 package [17] and then
Corrections for the following biases were evaluated: reconstructed by the standard program chain.
123Eur. Phys. J. C (2021) 81:73 Page 5 of 38 73
The final results refer to particles produced in central obtained with the two selection procedures for 20% of all
Be+Be collisions by strong interaction processes and in elec- inelastic collisions. A possible dependence of the scaling fac-
tromagnetic decays of produced hadrons. Such hadrons are tor on rapidity and transverse momentum was neglected. The
referred to as primary hadrons. Central collisions refer to resulting factors ccent range from 1.00 and 1.04 which is only
events selected by a cut on the total energy emitted into the a small correction compared to the systematic uncertainties
forward direction as defined by the acceptance maps for the of the measured particle multiplicities. The correction was
PSD given in Ref. [18]. therefore not applied, but instead included in the systematic
The analysis was performed in (y, pT ) bins. The bin size uncertainty.
was chosen taking into account the statistical uncertainties Finally, the average number of wounded nucleons W and
and the resolution of the momentum reconstruction [8]. Cor- the average collision impact parameter b were calculated
rections as well as statistical and systematic uncertainties within the Wounded Nucleon Model [20] implemented in
were calculated for each bin. Epos for events with the 20% smallest values of E F . Results
are listed in Table 2. Example distributions for the top beam
3.1 Central collisions momentum are shown in Fig. 4. As the Be nucleus consists of
few nucleons these distributions are quite broad. For compar-
A short description of the procedure for defining central col- ison W and b were also calculated from the GLISSANDO
lisions is given below. For more details see Refs. [4,19]. model [21] which uses a different Glauber model calculation.
Final results presented in this paper refer to Be+Be colli- The results, also listed in Table 2, differ by about 10% for
sions with the 20% lowest values of the forward energy E F W . This discrepancy was included in the systematic error
(central collisions). The quantity E F is defined as the total estimate (see Sect. 3.5.2) .
energy in the laboratory system of all particles produced in
a Be+Be collision via strong and electromagnetic processes 3.2 Event and track selection
in the forward momentum region defined by the acceptance
map in Ref. [18]. Final results on central collisions, derived 3.2.1 Event selection
using this procedure, allow a precise comparison with pre-
dictions of models without any additional information about For further analysis Be+Be events were selected using the
the NA61/SHINE setup and used magnetic field. following criteria:
For analysis of the data the event selection was based on
the ≈ 20% of collisions with the lowest value of the energy
(i) four units of charge measured in S1, S2, and Z counters
E P S D measured by a subset of PSD modules (see Fig. 3)
as well as BPD3 (this requirement also rejects most
in order to optimize the sensitivity to projectile spectators.
interactions upstream of the Be target),
The forward momentum acceptance in the definition of E F
(ii) no off-time beam particle detected within a time win-
corresponds closely to the acceptance of this subset of PSD
dow of ±4.5 µs around the trigger particle,
modules.
(iii) no other event trigger detected within a time window
Online event selection by the hardware trigger (T2) used a
of ±25 µs around the trigger particle,
threshold on the electronic sum of energies over the 16 central
(iv) beam particle detected in at least two planes out of four
modules of the PSD set to accept ≈ 40% of the inelastic
of BPD-1 and BPD-2 and in both planes of BPD-3,
interactions. The minimum-bias distribution was obtained
(v) a well reconstructed interaction vertex with z position
using the data from the beam trigger T1 with offline selection
(fitted using the beam trajectory and TPC tracks) not
of events by requiring an event vertex in the target region
farther away than 15 cm from the center of the Be target
and a cut on the ionisation energy detected in the GTPC to
(the cut removes less than 0.4% of T2 trigger (E P S D )
exclude Be beams. The spectrum of E P S D was calculated for
selected interactions),
the subset of modules and a properly normalized spectrum
(vi) an upper cut on the measured energy E P S D which
for target removed events was subtracted. Events for further
selects 20% of all inelastic collisions.
analysis were selected by applying a cut in this distribution
for the 20% of events with the smallest values of E P S D . More
details on the PSD modules selection optimisation and E P S D The event statistics after applying the selection criteria is
determination can be found in [19]. summarized in Table 1.
The forward energy E F cannot be measured directly.
However, both E F and E P S D can be obtained from simula- 3.2.2 Track selection
tions using the Epos1.99 (version CRMC 1.5.3) [16] model.
A global factor ccent (listed in Table 2) was then calculated In order to select tracks of primary charged hadrons and to
as the ratio of mean negatively charged pion multiplicities reduce the contamination by particles from secondary inter-
12373 Page 6 of 38 Eur. Phys. J. C (2021) 81:73
Fig. 3 PSD modules included in the calculation of the projectile spectator energy E P S D used for event selection for beam momenta of 19A, and
30A GeV/c (left) and for 40A, 75A and 150A GeV/c (right)
Table 2 Average number of wounded nucleons W and average col- using the smallest number of spectators in the Glauber model. Epos E F
lision impact parameter b in the 20% most central Be+Be collisions results correspond to selecting events by the forward energy E F within
estimated from simulations using the Epos [16] and GLISSANDO [21] the acceptance map in Ref. [18]. Also shown are correction factors ccent
models. The values of σ denote the widths of the distributions of W needed to account for the different event selection procedures used for
and b. Results Epos WNM and Glissando are for centrality selection the data (measured E P S D ) and the simulation (simulated values of E F )
Momentum (A GeV/c) 19 30 40 75 150
Epos E F (central) W 8.04 7.99 8.13 8.12 8.15
σ 2.6 2.6 2.6 2.6 2.6
b 1.89 1.93 1.49 1.49 1.51
σ 0.9 0.9 0.7 0.7 0.7
Epos Glauber W 8.87 8.88 8.89 8.90 8.93
σ 1.8 1.8 1.8 1.8 1.8
GLISSANDO W 8.74 8.77 8.76 8.83 8.91
σ 1.78 1.79 1.80 1.80 1.81
ccent 1.003 1.043 1.008 1.016 1.027
actions, weak decays and off-time interactions, the following smaller than 4 cm in the horizontal (bending) plane and
track selection criteria were applied: 2 cm in the vertical (drift) plane.
3.3 Identification techniques
(i) track momentum fit including the interaction vertex
should have converged, Charged particle identification in the NA61/SHINE experi-
(ii) fitted x component of particle rigidity q · plab is positive. ment is based on the ionization energy loss, dE/dx , in the
This selection minimizes the angle between the track gas of the TPCs and the time of flight, to f , obtained from
trajectory and the TPC pad direction for the chosen the ToF-L and ToF-R walls. In the region of the relativistic
magnetic field direction, reducing uncertainties of the rise of the ionization at large momenta the measurement of
reconstructed cluster position, energy deposition and dE/dx alone allows identification. At lower momenta the
track parameters, dE/dx bands for different particle species overlap and addi-
(iii) total number of reconstructed points on the track should tional measurement of to f is required to remove the ambi-
be greater than 30, guity. These two methods allow to cover most of the phase
(iv) sum of the number of reconstructed points in VTPC-1 space in rapidity and transverse momentum which is of inter-
and VTPC-2 should be greater than 15 or greater than est for the strong interaction programme of NA61/SHINE.
4 in the GTPC, The acceptance of the two methods is shown in Figs. 5 and 6
(v) the distance between the track extrapolated to the inter- for the 20% most central Be+Be interactions at 30A and
action plane and the (track impact parameter) should be 150A GeV/c, respectively. At low beam energies the to f -
123Eur. Phys. J. C (2021) 81:73 Page 7 of 38 73
Fig. 4 Examples of the distribution of the number of wounded nucleons W (left) and collision impact parameter b (right) for events with the 20%
smallest forward energies E F (central) at beam momentum of 150A GeV/c simulated with the Epos model using the acceptance map provided
in Ref. [18]
dE/dx method extends the identification acceptance, while track trajectory. As an example, dE/dx measured in the 20%
at top SPS energy it overlaps with the dE/dx method (for most central Be+Be interactions at 75A GeV/c is presented
more details see Ref. [22]). in Fig. 7, for positively and negatively charged particles, as
a function of q · plab .
The contributions of e+ , e− , π + , π − , K + , K − , p and p̄
3.3.1 Identification based on energy loss
are obtained by fitting the dE/dx distributions separately for
measurement (dE/dx )
positively and negatively charged particles in bins of plab and
pT with a sum of four functions [23,24] each corresponding
Time projection chambers provide measurements of energy
to the expected dE/dx distribution for the corresponding
loss dE/dx of charged particles in the chamber gas along
particle type. The small contribution of light (anti-)nuclei
their trajectories. Simultaneous measurements of dE/dx and
was neglected.
plab allow to extract information on particle mass. The mass
In order to ensure similar particle multiplicities in each
assignment follows the procedure which was developed for
bin, 20 logarithmic bins are chosen in plab in the range
the analysis of p+p reactions as described in Ref. [9]. Val-
1 − 100 GeV/c to cover the full detector acceptance. Fur-
ues of dE/dx are calculated as the truncated mean (small-
est 50%) of ionisation energy loss measurements along the
12373 Page 8 of 38 Eur. Phys. J. C (2021) 81:73
Fig. 5 Acceptance of the to f -dE/dx and dE/dx methods for identification of pions, kaons and protons in the 20% most central Be+Be interactions
at 30A GeV/c
0.625
thermore, the data are binned in 20 equal pT intervals in the xi √
σl = σ0 / nl , (2)
range 0-2 GeV/c. xπ
The distribution of dE/dx for tracks of a given particle
type i is parameterised as the sum of Gaussians with widths where the width parameter σ0 is √ assumed to be common for
σi,l depending on the particle type i and the number of points all particle types and bins. A 1/ l dependence on number
l measured in the TPCs. Simplifying the notation in the fit of points is assumed. The Gaussian peaks could in principle
formulae, the peak position of the dE/dx distribution for be asymmetric if the tail of the Landau distribution persists
particle type i is denoted as xi . The contribution of a recon- to some extent even after truncation (for detail see [25]).
structed particle track to the fit function reads: However, no significant effect was found.
The fit function has nine parameters (4 amplitudes, 4 peak
positions and width) which are difficult to fit in each bin inde-
ρ(x) = ρi (x) pendently. Therefore the following constraints on the fitting
i
parameters were adopted:
1 nl 1 x − xi 2
= Ai √ ex p − ,
nl 2π σl 2 σl
i=π, p,K ,e l (i) positions of electrons, kaons and protons relative to
l
(1) pions were assumed to be pT -independent,
(ii) the fitted amplitudes were required to be greater than
or equal to 0,
where x is the dE/dx of the particle, nl is the number of tracks (iii) the electron amplitude was set to zero for total momen-
with number of points l in the sample and Ai is the amplitude tum plab above 23.4 GeV/c (i.e. starting from the 13th
of the contribution of particles of type i. The second sum is bin), as the electron contribution vanishes at high plab ,
the weighted average of the line-shapes from the different (iv) if possible, the relative position of the positively
numbers of measured points (proportional to track-length) charged kaon peak was taken to be the same as that
in the sample. The quantity σl is written as: of negatively charged kaons determined from the nega-
123Eur. Phys. J. C (2021) 81:73 Page 9 of 38 73
Fig. 6 Acceptance of the to f -dE/dx and dE/dx methods for identification of pions, kaons and protons in the 20% most central Be+Be interactions
at 150A GeV/c
Fig. 7 Distribution of charged particles in the dE/dx – q· plab plane. (the target inserted configuration). Expectations for the dependence of
The energy loss in the TPCs for different charged particles for events the mean dE/dx on plab for the considered particle types are shown
and tracks selected for the analysis of Be+Be collisions at 75A GeV/c by the curves calculated based on the Bethe–Bloch function
tively charged particles in the bin of the same plab and the four particle types, the pion peak position and the width
pT . This procedure helps to overcome the problem of parameter σ0 .
the large overlap between K + and protons in the dE/dx Examples of fits are shown in Fig. 8 and the values of the
distributions. fitted peak positions xi are plotted in Fig. 9 versus momentum
The constraints reduce the number of independently fitted for different particle types i in selected Be+Be interactions
parameters in each bin from 9 to 6, i.e. the amplitudes of
12373 Page 10 of 38 Eur. Phys. J. C (2021) 81:73
Fig. 8 The dE/dx distributions for negatively (top, left) and positively types is shown by solid lines. The corresponding residuals (the differ-
(top, right) charged particles in the bin 12.6 ≤ plab ≤ 15.8 GeV/c and ence between the data and fit divided by the statistical uncertainty of
0.2 ≤ pT ≤ 0.3 GeV/c produced in PSD selected Be+Be collisions at the data) is shown in the bottom plots
75A GeV/c. The fit by a sum of contributions from different particle
at 150 A GeV/c. As expected, the values of xi increase with measurement and the value calculated from the extrapolated
plab but do not depend on pT . track trajectory length with the assumed mass hypothesis can
In order to ensure good fit quality, only bins with total be well described by a Gaussian with standard deviation of
number of tracks grater than 1000 (500 in the 19A GeV/c sam- 80 ps for ToF-R and 100 ps for ToF-L. These values represent
ple) are used for further analysis. The Bethe–Bloch curves the to f resolution including all detector effects.
for different particle types cross each other at low values Momentum phase space is subdivided into bins of 1 GeV/c
of the total momentum. Thus, the technique is not suffi- in plab and 0.1 GeV/c in pT . Only bins with more than 200
cient for particle identification at low plab and bins with (500 in the 150A GeV/c sample) entries were used for extract-
plab < 3.98 GeV/c (bins 1–5) are excluded from the anal- ing yields with the to f -dE/dx method.
ysis based solely on dE/dx measurements. The square of the particle mass m 2 is obtained from to f ,
the momentum p and the fitted trajectory length l:
3.3.2 Identification based on time of flight and energy loss
measurements (to f -dE/dx ) c2 to f 2
m = (cp)
2 2
−1 . (3)
l2
Identification of π + , π − , K + , K − , p and p̄ at low momenta
(from 2-8 GeV/c) is possible when measurement of dE/dx is For illustration distributions of m 2 versus plab are plotted
combined with time of flight information to f . Timing signals in Fig. 10 for positively (left) and negatively (right) charged
from the constant-fraction discriminators and signal ampli- hadrons produced in Be+Be interactions at 75A GeV/c. Bands
tude information are recorded for each tile of the ToF-L/R which correspond to different particle types are visible. Sep-
walls. Only hits which satisfy quality criteria (see Ref. [26] aration between pions and kaons is possible up to momenta
for detail) are selected for the analysis. The coordinates of of about 5 GeV/c, between pions and protons up to about
the track intersection with the front face are used to match the 8 GeV/c.
track to tiles with valid to f hits. The position of the extrapo- Example distributions of particles in the m 2 –dE/dx plane
lation point on the scintillator tile is used to correct the mea- for the selected Be+Be interactions at 40A GeV/c are pre-
sured value of to f for the propagation time of the light signal. sented in Fig. 11. Simultaneous dE/dx and to f measure-
The distribution of the difference between the corrected to f ments lead to improved separation between different hadron
123Eur. Phys. J. C (2021) 81:73 Page 11 of 38 73
Fig. 9 Fitted peak positions in selected Be+Be interactions at 150 A GeV/c for different particles as a function of plab . The xi for different pT at
each plab show little variation and mostly overlap
Fig. 10 Mass squared derived using time-of-flight measured by ToF-R (right) and ToF-L (left) versus laboratory momentum for particles produced
in PSD selected Be+Be collisions at 75A GeV/c (target inserted configuration). The lines show the expected mass squared values for different
hadrons species
types. In this case a simple Gaussian parametrization of the track to the fit function reads:
dE/dx distribution for a given hadron type can be used.
The to f -dE/dx identification method proceeds by fitting ρ(x, y) = ρ j (x, y)
the 2-dimensional distribution of particles in the dE/dx - j= p,π,K ,e
m 2 plane. Fits were performed in the momentum range from Nj (x − x j )2
1–8 GeV/c and transverse momentum range 0–1 GeV/c. For = ex p −
2π σx 2σx2
positively charged particles the fit function included contri- j
butions of p, K + , π + and e+ , and for negatively charged f (y − y j )2
particles the corresponding anti-particles were considered. × ex p
σ y1 2σ y21
The fit function for a given particle type was assumed to be a
product of a Gauss function in dE/dx and a sum of two Gauss (1 − f ) (y − y j )2
functions in m 2 (in order to describe the broadening of the + ex p , (4)
σ y2 2σ y22
m 2 distributions with momentum). In order to simplify the
notation in the fit formulae, the peak positions of the dE/dx
where N j and f are amplitude parameters, x j , σx are means
and m 2 Gaussians for particle type j are denoted as x j and
and width of the dE/dx Gaussians and y j , σ y1 , σ y2 are mean
y j , respectively. The contribution of a reconstructed particle
and width of the m 2 Gaussians, respectively. The total num-
12373 Page 12 of 38 Eur. Phys. J. C (2021) 81:73
Fig. 11 Particle number distribution in the m 2 -dE/dx plane for negatively (left) and positively (right) charged particles with momenta
3 < plab < 4 GeV/c and 0.3 < pT < 0.4 GeV/c) for PSD selected Be+Be collisions at 40 A GeV/c
d E/d x
ber of parameters in Eq. (4) is 16. Imposing the constraint of d E/d x ρi ( plab , pT )
normalisation to the total number of tracks N in the kinematic Pi ( plab , pT ) = d E/d x
, (6)
ρi ( plab , pT )
bin i=π,K , p,e
N= Ni (5) where ρi is the value of the fitted function in a given ( plab ,
i pT ) bin calculated for dE/dx of the particle.
Similarly the to f -dE/dx fits (see Eq. 4) give the particle
the number of parameters is reduced to 15. Two additional type probability as
assumptions were adopted:
d E/d x,m 2
d E/d x,m 2 ρi ( plab , pT )
(i) the fitted amplitudes were required to be greater than Pi ( plab , pT ) = . (7)
d E/d x,m 2
or equal to 0, ρi ( plab , pT )
i=π,K , p,e
(ii) σ y1 < σ y2 and f > 0.7, the ”core” distribution domi-
nates the m 2 fit.
For illustration, particle type probability distributions for
positively and negatively charged particles produced in PSD
An example of the to f -dE/dx fit obtained in a sin- selected Be+Be collisions at 19 A and 150A GeV/c are pre-
gle phase-space bin for positively charged particles in PSD sented in Fig. 13 for the dE/dx fits and in Fig. 14 for the
selected Be+Be collisions at 40A GeV/c is shown in Fig. 12. to f -dE/dx fits. In the case of perfect particle type identi-
The to f -dE/dx method allows to fit the kaon yield close fication the probability distributions in Figs. 13 and 14 will
to mid-rapidity. This is not possible using the dE/dx method. show entries at 0 and 1 only. In the case of incomplete particle
Moreover, the kinematic domain in which pion and proton identification (overlapping dE/dx or to f -dE/dx distribu-
yields can be fitted is enlarged. The results from both methods tions) values between these extremes will also be populated.
partly overlap at the highest beam momenta. In these regions The probability method allows to transform fit results per-
the results from the dE/dx method were selected since they formed in ( plab , pT ) bins to results in (y, pT ) bins. Hence,
have smaller uncertainties. for the probability method the mean number of identified
particles in a given kinematical bin (e.g. ( plab , pT )) is given
3.3.3 Probability method by [27]:
The fit results allow to calculate the probability Pi that a
1
Ntr k
measured particle is of a given type i = π, K , p, e. For the
d Ed x (y, pT ) =
n[i]raw Pid Ed x ( plab , pT ), (8)
dE/dx fits (see Eq. 1) one gets: Nev
j=1
123Eur. Phys. J. C (2021) 81:73 Page 13 of 38 73
Fig. 12 Example of the to f -dE/dx fit (Eq. 4) obtained in a single 40A GeV/c. Lines show projections of the fits for pions (red), kaons
phase-space bin (3 < plab < 4 GeV/c and 0.3 < pT < 0.4 GeV/c) (green), protons (blue) and electrons (magenta). Bottom right panel
for positively charged particles in PSD selected Be+Be collisions at shows the fit residuals
for the dE/dx identification method and: 3.4 Corrections and uncertainties
In order to estimate the true number of each type of iden-
tified particle produced in Be+Be interactions a set of cor-
1
Ntr k
2
n[i]raw
d Ed x,m 2
(y, pT ) = Pid Ed x,m ( plab , pT ), (9) rections was applied to the extracted raw results. These were
Nev obtained from a simulation of the NA61/SHINE detector fol-
j=1
lowed by event reconstruction using the standard reconstruc-
tion chain. Only inelastic Be+Be interactions were simulated
for the to f -dE/dx procedure, where Pi is the probability of in the target material. The Epos1.99 model (version CRMC
particle type i given by Eqs. (6) and (7), j the summation 1.5.3) [16] was selected to generate primary inelastic interac-
index running over all entries Ntr k in the bin, Nev is the tions as it best describes the NA61/SHINE measurements. A
number of selected events. Geant3 based program chain was used to track particles
Statistical uncertainties of multiplicities calculated with through the spectrometer, generate decays and secondary
probability method were derived from the variance of the interactions and simulate the detector response (for details
distribution of Pi in the ( plab , pT ) bin: see Ref. [8]). Simulated events were then processed using
the standard NA61/SHINE reconstruction chain and recon-
structed tracks were matched to the simulated particles based
1 on the cluster positions. The event selection was based on a
N
tr k
j
σn[i]
2
raw (y, p T ) = ( Pi ( plab , pT )2 dedicated simulation of the energy recorded by the PSD (see
Nev
j=1 Sect. 3.1). Corrections depend on the particle identification
Ntr k technique (i.e. dE/dx or to f -dE/dx ). Hadrons which were
−( Pik ( plab , pT ))/Ntr k ) (10) not produced in the primary interaction can amount to a sig-
k=1 nificant fraction of the selected tracks. Thus a special effort
12373 Page 14 of 38 Eur. Phys. J. C (2021) 81:73
Fig. 13 Probability of a track being a pion, kaon, proton for positively (left) and negatively (right) charged particles from dE/dx measurements
in PSD selected Be+Be collisions at 19A and 150A GeV/c
was undertaken to evaluate and subtract this contribution. MC is the number primary particles in the (y, p )
where n[i]gen T
The correction factors were calculated in the same bins of y bin for simulated events and n[i]sel MC the number of recon-
and pT as the particle spectra. Bins with a correction factor structed tracks passing all event and track selection cuts. The
lower than 1.5 and higher than 4 are caused by low accep- uncertainty of cid Ed x (y, pT ) was calculated assuming that
tance or high contamination of non primary particles and the denominator n[i]sel MC (y, p ) is a subset of the numera-
T
were rejected. tor n[i]gen (y, pT ) and thus has a binomial distribution. The
MC
uncertainty of cid Ed x (y, pT ) is thus given by:
3.4.1 Corrections for the dE/dx method
The correction factor cid Ed x (y, pT ) for biasing effects listed
σcd Ed x (y, pT )
in Sect. 3.2.1 items (b)–(g) was calculated as: i
n[i]gen
MC (y, p ) − n[i] MC (y, p )
p T )
T sel T
= cid Ed x (y, ,
MC (y, p )
n[i]gen T
n[i]gen · n[i]sel
MC MC
cid Ed x (y, pT ) = MC (y, p )
, (11)
n[i]sel T (12)
123Eur. Phys. J. C (2021) 81:73 Page 15 of 38 73
Fig. 14 Probability of a track being a pion, kaon, proton for positively (left) and negatively (right) charged particles from to f -dE/dx measurements
in PSD selected Be+Be collisions at 30A (top) and 150A GeV/c (bottom)
The mean multiplicity for particle type i in the PSD selected This ToF pixel efficiency factor was used in the MC simu-
events in a (y, pT ) is calculated as: lation by weighting each reconstructed MC track passing all
event and track selection cuts by the efficiency factor of the
n[i]d Ed x (y, pT ) = cid Ed x (y, pT ) · n[i]raw
d Ed x (y, pT ). (13) corresponding tile. Then, the number of selected MC tracks
MC becomes a sum of weights:
n[i]sel
3.4.2 Corrections for the to f -dE/dx method
The corrections for the to f -dE/dx method were calcu-
Ntr k
j
MC
n[i]sel = pi xel ( p, pT ). (15)
lated based on simulation and data. The ToF tile efficiency
j=1
pi xel ( p, pT ) was calculated from the data in the following
way. Each reconstructed track was extrapolated to the ToF
walls and if it crossed one of the ToF tiles it was classified Only hits in working tiles with efficiency higher than 50%
as a hit and summed in n[i]to f . Moreover, it was accepted were taken into account in the identification and correction
as a valid ToF hit, summed in n[i]hit , if the signal satisfied procedures. This results in the following correction factor
quality criteria given in Ref. [26]. Finally, the ToF tile effi- for biasing effects listed in Sect. 3.2.1 items (b)–(g) as well
ciency pi xel ( p, pT ) was calculated as the ratio of the number as ToF efficiency, to f -dE/dx method acceptance, secondary
of tracks n[i]to f crossing a particular tile to the number of interactions and contribution of particles other than primary:
tracks n[i]hit with valid ToF hits. The corresponding effi-
ciency factor pi xel ( p, pT ) is given by:
MC
n[i]gen
n[i]hit 2
pi xel ( p, pT ) = . (14) cid Ed x,m (y, pT ) = MC
, (16)
n[i]to f n[i]sel
12373 Page 16 of 38 Eur. Phys. J. C (2021) 81:73
MC is the number primary particles in the (y, p )
where n[i]gen T where σn[i]raw (Eq. 10) is the uncertainty of the uncorrected
MC
bin for simulated events and n[i]sel the number of recon- particle multiplicity n[i]raw (Eqs. 8 and 9), σci (y, pT ) (Eqs. 12
structed tracks passing all event and track selection cuts and 17) denotes the uncertainty of the correction factors
2
weighted by the tile efficiency factor pi xel ( p, pT ) given by cid Ed x (y, pT ) (Eq. 11) or cid Ed x,m (y, pT ) (Eq. 16) for the
Eg. 15. dE/dx or to f -dE/dx identification method, i is the particle
2
The uncertainty of cid Ed x,m (y, pT ) was calculated assum- type and Nev the total number of accepted events.
ing that the denominator n[i]sel MC (y, pT ) is a subset of the
nominator n[i]gen (y, pT ) and thus has a binomial distribu-
MC
2
tion. The uncertainty of cid Ed x,m (y, pT ) was calculated as 3.5.2 Systematic uncertainties
follows:
The contributions to the systematic uncertainty for the dE/dx
2
σ 2 (y, pT ) = cid Ed x,m (y, pT ) and to f -dE/dx methods in selected pT intervals at beam
cid Ed x,m
momenta of 19A (30A) and 150 A GeV/c are presented in
n[i]gen
MC (y, p ) − n[i] MC (y, p ) Figs. 16, 17, 18, 19. Assuming they are uncorrelated, the
×
T sel T
, total systematic uncertainty, also shown in the plots, was
n[i]gen · n[i]sel
MC MC
calculated as the square root of the sum of squares of the
(17) described components.
The considered contributions to systematic uncertainties
The mean multiplicity for particle type i in the PSD
are listed below:
selected events in a (y, pT ) bin for the to f -dE/dx method
is defined by:
2
(i) Event selection:
d Ed x,m 2
n[i] (y, pT ) = cid Ed x,m (y, pT ) · n[i]raw
d Ed x,m 2
, (18) Systematic uncertainty of final particle yields due to the
slightly different procedures of event selection used for
3.5 Corrected spectra data (E P S D ) and simulated events (E F ) (see Sect. 3.1).
Systematic uncertainty related to the rejection of events
Final spectra of different types of hadrons produced in Be+Be with additional tracks from off-time particles was esti-
interactions are calculated as: mated by changing the width of the time window in
which no second beam particle is allowed by ± 1 µs
d 2n 1 with respect to the nominal value of ±4.5 µs. The max-
= ·ci (y, pT )·n[i]raw (y, pT ), (19)
dydpT y · pT · Nev imal difference of the results was assigned as the sys-
tematic uncertainty of the selection. This contribution
where y and pT are the bin sizes, Nev is the total number does not affect the results of the to f −dE/dx identifi-
of accepted events, n[i]raw represents the mean multiplic- cation method.
ity for particle type i in the y, pT bin obtained as n[i]d Ed x Systematic uncertainty due to the choice of selection
2
and n[i]d Ed x,m for the dE/dx and to f -dE/dx identifica- window for the z-position of the fitted vertex was esti-
tion method, respectively and finally the correction factor ci mated by varying the selection criteria for the data and
2
stands for cid Ed x (y, pT ) (Eq. 11) or cid Ed x,m (y, pT ) (Eq. 16) the Epos1.99 model in the range of ±25 cm around the
for the dE/dx and to f -dE/dx identification method, respec- nominal position of the target.
tively. (ii) Track selection:
d2n Systematic uncertainty from the value of the cut on the
Resulting two-dimensional distributions dydp of
− + − +
T track impact parameter at the primary vertex was esti-
π , π , K , K , p and p̄ produced in the 20% most cen-
mated by varying the cut for the data and the Epos1.99
tral Be+Be collisions at different SPS energies are presented
model by ±50% around the nominal value.
in Fig. 15.
Systematic uncertainty originating from the require-
ment on the number of measured points in the mag-
3.5.1 Statistical uncertainties netic field (minimum number of points in VTPCs and
GTPC) was estimated by changing the nominal require-
Statistical uncertainties of yields (Eq. 20) were calculated as: ment on the number of measured points by ± 5 (33% of
1 2 the standard selection) and ± 10 (66% of the standard
σstat
2
= ci (y, pT )σn[i]raw (y, pT ) selection) for the dE/dx and to f −dE/dx identifica-
y · pT · Nev
2 2 2
2 tion methods, respectively.
+ σci (y, pT ) n[i]raw , (20) (iii) Particle identification:
123Eur. Phys. J. C (2021) 81:73 Page 17 of 38 73
Fig. 15 Two-dimensional distributions (y vs. pT ) of yields of π − , π + , K − , K + , p and p̄ produced in the 20% most central Be+Be interactions
at 19A, 30A, 40A, 75A and 150A GeV/c
12373 Page 18 of 38 Eur. Phys. J. C (2021) 81:73
Fig. 16 Contributions to the systematic uncertainty of particle spectra and σ(iv) (orange lines) to the contamination by feeddown from weak
obtained from the dE/dx method at 19A GeV/c as a function of rapid- decays of strange particles. Black lines, σ(sys) , show the total systematic
ity for the transverse momentum interval between 0.2–0.3 GeV/c. σ(i) uncertainty calculated as the square root of the sum of squares of the
(red lines) refers to event selection σ(ii) (magenta lines) to the track components
selection procedure, σ(iii) (blue lines) to the identification technique
Uncertainties of the dE/dx identification method were ¯ in case of pions, and in addition of +
− , K s0 and
studied and estimated by a 10% variation of the param- in case of protons, and ¯ in case of p̄.
eter constraints for Eq. (1) fitted to the dE/dx spectra.
In case of to f -dE/dx identification, systematic uncer-
tainties were estimated by shifting the mean (x j and 4 Results
y j ) of the two-dimensional Gaussians (Eq. 4) fitted to
2
the m 2 − d E/d x distributions by ±1%. Two dimensional distributions dydp d n
T
of π − , π + , K − , K + ,
An additional systematic uncertainty arises for the p and p̄ produced in the 20% most central Be+Be inter-
to f −dE/dx method from the quality requirements on actions at different SPS energies are presented in Fig. 15.
the signals registered in the ToF pixels. This system- Where available, results from the dE/dx method were used
atic uncertainty was estimated by changing the nominal because of their smaller statistical uncertainties. Results from
thresholds by ±10%. the to f -dE/dx method were taken to extend the momentum
(iv) Feeddown correction: space coverage. Reflection symmetry around y = 0 was used
The determination of the feeddown correction is based d2n
for dydp T
near mid-rapidity (see discussion in Sect. 4.2).
on the Epos1.99 model which reasonably describes the Empty bins in momentum space (mostly for lower energies)
available cross section data for strange particles in p+p are caused by insufficient acceptance for the identification
collisions (see e.g. for K + , K − Ref. [9] and for at methods used in the analysis.
158 GeV/c Ref. [28]). Systematic uncertainty comes
from the lack of precise knowledge of the production
cross section in Be+Be collisions of K + , K − , , + ,
123Eur. Phys. J. C (2021) 81:73 Page 19 of 38 73
Fig. 17 Contributions to the systematic uncertainty of particle spec- and σ(iv) (orange lines) to the contamination by feeddown from weak
tra obtained from the dE/dx method at 150A GeV/c as a function of decays of strange particles. Black lines, σ(sys) , show the total systematic
rapidity for the transverse momentum interval between 0.2–0.3 GeV/c. uncertainty calculated as the square root of the sum of squares of the
σ(i) (red lines) refers to event selection σ(ii) (magenta lines) to the track components
selection procedure, σ(iii) (blue lines) to the identification technique
Fig. 18 Contributions to the systematic uncertainty of particle spectra identification technique and σ(iv) (orange lines) to the contamination
obtained from the to f -dE/dx method at 30A GeV/c as a function of pT by feeddown from weak decays of strange particles. Black lines, σ(sys) ,
for the rapidity interval − 0.2 to 0.0 GeV/c (K + and K − ) and − 0.4 show the total systematic uncertainty calculated as the square root of
to − 0.2 GeV/c (protons). σ(i) (red lines) refers to event selection σ(ii) the sum of squares of the components
(green lines) to the track selection procedure, σ(iii) (blue lines) to the
12373 Page 20 of 38 Eur. Phys. J. C (2021) 81:73
Fig. 19 Contributions to the systematic uncertainty of particle spectra identification technique and σ(iv) (orange lines) to the contamination
obtained from the to f -dE/dx method at 150A GeV/c as a function of by feeddown from weak decays of strange particles. Black lines, σ(sys) ,
pT for the rapidity interval 0.0 to 0.2 GeV/c (K + and K − ) and − 0.4 show the total systematic uncertainty calculated as the square root of
to − 0.2 GeV/c (protons). σ(i) (red lines) refers to event selection σ(ii) the sum of squares of the components
(green lines) to the track selection procedure, σ(iii) (blue lines) to the
4.1 Transverse momentum and transverse mass spectra Rapidity spectra dn/dy of K + and K − were obtained by
integration of the transverse momentum distributions shown
Resulting double differential spectra as a function of in Fig. 26. Both dn/dy and the corresponding inverse slope
transverse momentum pT in intervals of rapidity y of K + , parameter T at mid-rapidity are tabulated in Table 3.
K − , π + , π − , p and p̄ produced at 19A, 30A, 40A, 75A, A step-like structure in the energy dependence of the
150A GeV/c beam momentum are shown in Figs. 20, 21, inverse slope parameter T of kaons at mid-rapidity was pre-
22, 23, 24, 25. Entries in Fig. 15 below mid-rapidity were dicted [32] at the onset of deconfinement (step). In this sce-
reflected in order to fill the gaps in acceptance as far as pos- nario it is caused by the softness of the equation of state of
sible. Spectra in successive rapidity intervals were scaled by the mixed phase of hadrons and partons stalling the expan-
appropriate factors for better visibility. Vertical bars on data sion of the initial state with rising energy density. Kaon pT
points correspond to statistical, shaded bands to systematic spectra are well described by a simple exponential because in
uncertainties. Systematic uncertainties plotted in the loga- contrast to pion pT spectra they are not affected strongly by
rithmic scale look small. resonance decay products. As seen in Fig. 29 from a compi-
Transverse momentum spectra of shown in Figs. 20, 21, lation of published results such a step is observed in central
22, 23, 24, 25 were parametrized by an exponential func- collisions of heavy nuclei (Au and Pb) in the SPS energy
tion [29,30]: range which is consistent with the onset of the phase tran-
sition [11,12]. The new NA61/SHINE measurements from
central Be+Be collisions are similar to published results
d 2n S c2 pT from inelastic p+p interactions. This indicates that not much
= 2 exp(−(m T − m)/T ), (21)
dydpT T +m T expansion flow is created in the small Be+Be collision system
at SPS energies. Although there appears to be a similar step
where m is the particle mass and S and T are the yield integral feature, the values of T are much smaller than the ones from
and the inverse slope parameter, respectively. The functions collisions of heavy nuclei. The intriguing similarity between
(Eq. 21) fitted at mid-rapidity are shown together with the the energy dependence of T between p+p and Pb+Pb colli-
data points for K + and K − in Fig. 26 and for protons and sions is discussed in detail in Ref. [10].
antiprotons in Fig. 27.
The fitted inverse slope parameter is plotted in Fig. 28 4.2 Rapidity spectra and mean multiplicities
as a function of the rapidity. The value of T results from
an interplay of the kinetic freeze-out temperature when final Figure 30 presents rapidity spectra for all studied parti-
state rescattering stops as well as of the radial expansion flow. cle species at all available collision energies. Measure-
Thus the pT spectra need not show a strictly exponential ments of the π − rapidity distributions employing the h −
decrease. Note that results are only plotted for those rapidity method indicated slight forward-backward asymmetry [4].
intervals for which there were more than 6 data points in the The acceptance for particle identification does not extend
pT -distribution. into the backward hemisphere making such a test impossi-
123Eur. Phys. J. C (2021) 81:73 Page 21 of 38 73
Fig. 20 Transverse momentum spectra in rapidity slices of K + pro- Black dots (blue squares) show results of the dE/dx (to f -dE/dx )
duced in the 20% most central Be+Be collisions. Rapidity values given analysis, respectively. Shaded bands show systematic uncertainties
in the legends correspond to the middle of the corresponding interval.
ble. The forward-backward asymmetry of π − rapidity spec- Fig. 30. Assuming forward-backward symmetry total mean
tra reported in Ref. [4] was at the level of 5%. Since this multiplicities were calculated and are summarized in Table 5.
is smaller than the systematic uncertainty no correction was The simplest model of nucleus-nucleus collisions, the
applied. In fact, Gaussian functions provide a good descrip- Wounded Nucleon Model [20], suggests that total produced
tion for all particle types except for protons. The latter exhibit particle multiplicities scale approximately with the respec-
a strong leading particle effect. Mean forward multiplicities tive ratios of wounded nucleons. This ratio was derived using
(protons excepted), were obtained by summing the measured the Epos model and the NA61/SHINE centrality selection
points and adding an extrapolation estimated from the fit- procedure for Be+Be collisions with the 20% smallest num-
ted Gaussian functions which are shown by the curves in ber of wounded nucleons (see Sect. 3.1) and inelastic p+p
collisions Ref. [10]. The resulting ratio of about 4 is close
12373 Page 22 of 38 Eur. Phys. J. C (2021) 81:73 Fig. 21 Transverse momentum spectra in rapidity slices of K − pro- Black dots (blue squares) show results of the dE/dx (to f -dE/dx ) duced in the 20% most central Be+Be collisions. Rapidity values given analysis, respectively. Shaded bands show systematic uncertainties in the legends correspond to the middle of the corresponding interval. to the experimental ratios calculated from the total multi- in Fig. 31. Note that protons with pT ≈ 0 and beam rapidity plicities listed in Table 5 for Be+Be and Ref. [10] for p+p are assumed to be spectator protons and rejected in the model interactions. calculations. To determine the mean proton multiplicity one The determination of the mean multiplicity is more com- may calculate extrapolation factors from the models as the plicated for protons due to the rapid rise of the yield towards ratio of mean multiplicity to that in the region covered by beam rapidity and the lack of measurements in this region. A the measurements. The multiplicity of protons in the region comparison of the rapidity distributions obtained in this anal- of measurements and the extrapolation factor obtained from ysis with predictions of the Urqmd [33,34], Epos [16,31], the Epos model are given in Table 4. Mean proton multiplic- Ampt [35–37], Phsd 4.0 [38,39] and Smash 1.6 [40,41] ities are not provided since the values will be strongly model models at 40A and 150A GeV/c beam momentum is shown dependent. 123
You can also read