In situ measurements of cloud microphysical and aerosol properties during the break-up of stratocumulus cloud layers in cold air outbreaks over ...
←
→
Page content transcription
If your browser does not render page correctly, please read the page content below
Atmos. Chem. Phys., 18, 17191–17206, 2018
https://doi.org/10.5194/acp-18-17191-2018
© Author(s) 2018. This work is distributed under
the Creative Commons Attribution 4.0 License.

In situ measurements of cloud microphysical and aerosol properties
during the break-up of stratocumulus cloud layers
in cold air outbreaks over the North Atlantic
Gary Lloyd1,2 , Thomas W. Choularton2 , Keith N. Bower2 , Martin W. Gallagher2 , Jonathan Crosier1,2 ,
Sebastian O’Shea1 , Steven J. Abel3 , Stuart Fox3 , Richard Cotton3 , and Ian A. Boutle3
1 NERC  National Centre for Atmospheric Science (NCAS), Leeds, UK
2 Centrefor Atmospheric Science, University of Manchester, Manchester, UK
3 Met Office, Exeter, UK

Correspondence: Gary Lloyd (gary.lloyd@manchester.ac.uk)

Received: 1 June 2018 – Discussion started: 4 July 2018
Revised: 28 September 2018 – Accepted: 21 October 2018 – Published: 5 December 2018

Abstract. A key challenge for numerical weather predic-            of the capping inversion and boundary layer decoupling also
tion models is representing boundary layer clouds in cold          observed.
air outbreaks (CAOs). One important aspect is the evolu-
tion of microphysical properties as stratocumulus transitions
to open cellular convection. Abel et al. (2017) have shown,        1   Introduction
for the first time from in situ field observations, that the
break-up in CAOs over the eastern Atlantic may be con-             Cold air outbreaks (CAOs) frequently impact the North At-
trolled by the development of precipitation in the cloud sys-      lantic region during winter months. While the synoptic evo-
tem while the boundary layer becomes decoupled. This pa-           lution of these events is often well forecast by numerical
per describes that case and examines in situ measurements          weather prediction (NWP) models, the extent of resulting
from three more CAOs. Flights were conducted using the UK          stratocumulus clouds (SCs) and the transition from closed to
Facility for Airborne Atmospheric Measurements (FAAM)              open cellular convective regions is often poorly represented.
British Aerospace-146 (BAe-146) aircraft in the North At-          Some of the reasons for this include the depth of the bound-
lantic region around the UK, making detailed microphysi-           ary layer and the size of the convective elements in these
cal measurements in the stratiform boundary layer. As the          events approaching model resolution, and the difficulty of
cloudy boundary layer evolves prior to break-up, increasing        parameterizing ice formation processes in these slightly su-
liquid water paths (LWPs) and drop sizes and the formation         percooled clouds (cloud bases between ∼ −4 and −10 ◦ C)
of liquid precipitation are observed. Small numbers of ice         (Field et al., 2014).
particles, typically a few per litre, are also observed. Eventu-      Abel et al. (2017) used in situ measurements to evaluate
ally LWPs reduce significantly due to loss of water from the       cloud resolving simulations of one of the CAOs described
stratocumulus cloud (SC) layer. In three of the cases, aerosols    in this paper (Case 1). Cloud measurements showed a strati-
are removed from the boundary layer across the transition.         form region composed primarily of liquid drops and low con-
This process appears to be similar to those observed in warm       centrations of ice particles, typically a few per litre at most.
clouds and pockets of open cells (POCs) in the subtropics.         Down-wind cloud morphology changed rapidly, with shal-
After break-up, deeper convective clouds form with bases           low cumulus clouds developing, leading to enhanced pre-
warm enough for secondary ice production (SIP), leading            cipitation rates and secondary ice production (SIP). Simu-
to rapid glaciation. It is concluded that the precipitation is     lations using the Met Office Unified Model were able to cap-
strongly associated with the break-up, with both weakening         ture some of the cloud properties but unable to reproduce
                                                                   the liquid water path (LWP) that was observed. Sensitivity

Published by Copernicus Publications on behalf of the European Geosciences Union.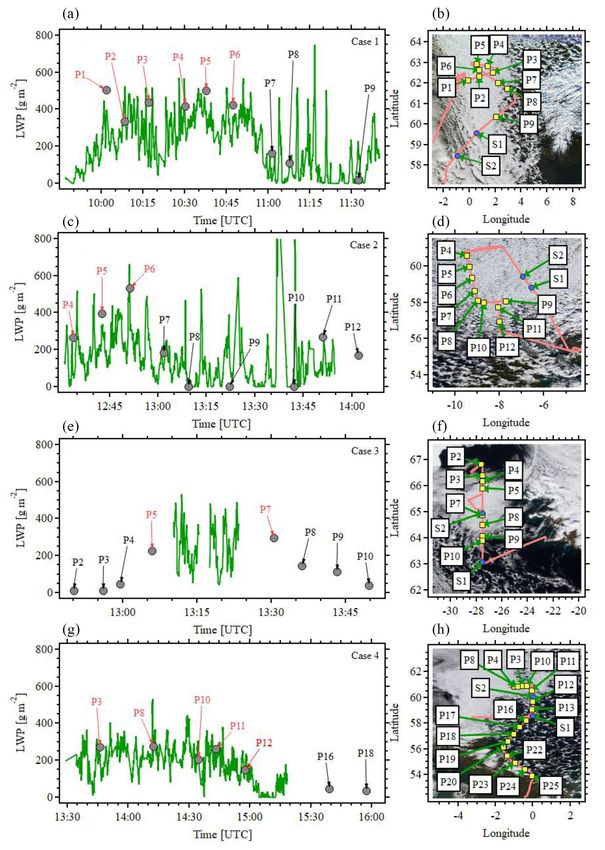
17192                                  G. Lloyd et al.: In situ measurements of cloud microphysical and aerosol properties

tests showed that ice processes were too active in the model,      CAO during January 2010 and the resulting cloud fields over
leading to the removal of too much liquid water. It was also       the North Atlantic. The control model under-predicted LWPs
found that decoupling of the boundary layer, triggered by the      and failed to reproduce the stratiform cloud region. Sensitiv-
evaporation of precipitation below the cloud base, was a key       ity tests found improved simulation when shear-driven ver-
process involved in the transition to open cellular convection.    tical turbulent mixing was allowed to extend to the cloud
In this paper we extend the in situ measurements detailed          top. Further improvements were found when the threshold
in Abel et al. (2017) to a further three cases to examine the      for heterogeneous ice nucleation was changed from −10 to
similarities between the cloud, aerosol and thermodynamic          −18 ◦ C and the efficiency of auto-conversion of cloud water
properties in Case 1 and the new cases. The focus in this          to precipitation was reduced. Abel et al. (2017) showed, that
paper is on the in situ measurements made during the CAO           even with many of these improvements included in their con-
investigations, and does not extend to model sensitivity tests     trol simulation, the stratiform LWP was still too low. Field et
performed by Abel et al. (2017).                                   al. (2017) also showed that nine leading regional models all
   Accurate prediction of CAOs is important as they are com-       struggled to simulate the same SC layer.
mon (Kolstad et al., 2009; Fletcher et al., 2016) and bring the       In situ observations have often focussed on areas of super-
potential for severe weather, including heavy rain, snowfall       cooled SCs in Arctic regions (Verlinde et al., 2007; Lance
events, damaging winds and lightning. The ability to capture       et al., 2011; Jackson et al., 2012) and report persistent, hori-
the horizontal extent of low-level SCs in these events, to-        zontally extensive regions of cloud consisting of liquid tops
gether with an accurate representation of the microphysical        that continually precipitate ice. During the Aerosol Cloud-
properties, is also critical to understanding the impact they      Coupling And Climate Interactions in the Arctic (ACCA-
have on long- and short-wave radiation budgets (Curry et al.,      CIA) campaign, Lloyd et al. (2015) observed similar cloud
1996). While this paper focuses on synoptic-scale weather          properties in the Arctic spring; however, in the summer sea-
events, the problem of reproducing mid-latitude SCs is an is-      son, the microphysical properties exhibited greater variabil-
sue in climate modelling, particularly in relation to the South-   ity, with stable layer clouds sensitive to the development of
ern Hemisphere (SH) radiation bias, a result of Southern           drizzle and ice formation processes that were observed to re-
Ocean (SO) clouds not reflecting enough short-wave radia-          duce LWPs and to break up the cloud.
tion. Excessive absorbed short-wave radiation biases, partic-         During the VOCALS campaign (Wood et al., 2011b), ob-
ularly over the SO, due to the direct impact of modelled post-     servations of warm SCs were made over the subtropical
cold-front SCs not containing enough supercooled liquid wa-        south-east Pacific, with a focus on persistent SC layers con-
ter, have been described in previous studies (Bodas-Salcedo        sisting of closed cells and pockets of open cells (POCs)
et al., 2012; Kay et al., 2016).                                   (Stevens et al., 2005) that were embedded within overcast
   Fletcher et al. (2016) provided a useful climatology of ma-     and open cellular regions. Wood et al. (2008) found POCs
rine cold air outbreaks (MCAOs), showing the similarities          were most likely to form overnight and at times when aerosol
between these events in both the Northern Hemisphere (NH)          number concentrations were low, suggesting that drizzle
and the SH, which suggests the measurements presented in           played an important role in the transition between closed and
this paper from CAOs in the NH could be applied to improve         open cell structures. Terai et al. (2014) studied POCs in the
our understanding in other regions.                                same region, finding that the ratio of drizzle to cloud wa-
   Attempts to model low-level boundary layer clouds in Arc-       ter was an order of magnitude larger than in the overcast
tic regions frequently find low biases in liquid water content     regions. Wood et al. (2011a) also found that aerosol con-
(LWC) values. Klein et al. (2009) compared model simu-             centrations in the overcast SC regions were 3 times higher
lations of low-level single layer clouds with in situ and re-      than in a POC they studied. They concluded that, although
mote sensing measurements from the Mixed-Phase Arctic              they did not observe the formation of the POC, SCs with
Cloud Experiment (M-PACE) (Verlinde et al., 2007), find-           high LWPs are inherently unstable due to coalescence scav-
ing that complex microphysical parameterizations could re-         enging of cloud condensation nuclei (CCN) that exceeds re-
produce observed LWPs, while simpler schemes led to an             plenishment rates. Connolly et al. (2013) used a large eddy
underestimation. Morrison and Pinto (2006) found that ac-          simulation (LES) to examine the impact of gravity waves on
curate simulation of observed cloud layers was dependent on        the marine boundary layer (MBL), finding that although the
the microphysics scheme selected. Liu et al. (2011) tested the     waves do cause additional drizzle formation, the entrainment
sensitivity of model simulations to microphysical processes,       of warm dry air into the cloud can cause a change from a
finding that the underestimation of LWCs was most sensi-           closed cell structure to a patchy cloud regime. The simula-
tive to the auto-conversion of small ice to snow and the sub-      tions they performed suggested that CCN scavenging was
sequent depletion of the liquid phase through the Wegener–         unimportant in causing cloud break-up. Boers et al. (1996)
Bergeron–Findeisen (WBF) process. Switching this process           found evidence that in warm marine SCs over the Southern
off over the temperature range of the observed cloud lay-          Ocean, clouds were depleted by the formation of drizzle that
ers led to good agreement with in situ observations. Field         scavenged cloud water through collision coalescence, a pro-
et al. (2014) used the Met Office Unified Model to simulate a      cess that could be enhanced through the depletion of aerosol

Atmos. Chem. Phys., 18, 17191–17206, 2018                                          www.atmos-chem-phys.net/18/17191/2018/
G. Lloyd et al.: In situ measurements of cloud microphysical and aerosol properties                                           17193

particles in the boundary layer (Rosenfeld et al., 2008). Oth-       (Baumgardner et al., 2001), which provided 100 µm resolu-
ers have also highlighted the importance of drizzle formation        tion shadow images of cloud hydrometeors over the range
in model simulations (Boutle and Abel, 2012; Yamaguchi et            100 < dp < 6200 µm.
al., 2017). Bretherton and Wyant (1997) found that, although            Total water content (TWC) (liquid + vapour) was mea-
drizzle did play a role in decoupling, a deepening warming           sured at 64 Hz using a Lyman-Alpha absorption hygrome-
process driven by increasing latent heat fluxes was the main         ter (Nicholls et al., 1990). The Cloud Droplet Probe (CDP-
driver for decoupling of the mixed layer in their model sim-         100 Version-2, DMT, Boulder, USA) (Lance et al., 2010) was
ulations of subtropical SCs over a warming sea surface.              used for measurement of the cloud droplet size distribution
   Overall, research suggests that a combination of physi-           over the range 3 < dp < 50 µm. Calibration was carried out us-
cal properties and processes may play a role in the forma-           ing glass beads and the data compared to measurements from
tion, development and eventual break-up of SC layers dur-            the Nevzorov liquid water content and total water content
ing CAOs. These include (i) the dynamical structure of the           probe (LWC + IWC) (Korolev et al., 1999), which was base-
boundary layer; (ii) surface fluxes of heat and moisture; (iii)      lined following the method in Abel et al. (2014). We found
entrainment of dry air at the cloud top; (iv) the availability of    the TWC probe’s LWC and the CDP LWC to be in good
CCN and ice nucleating particles (INPs); (v) the microphys-          agreement for all cases. The r 2 values for these comparisons
ical structure, which, in part is controlled by (iv); (vi) the de-   were 0.86, 0.86, 0.93 and 0.66 respectively. The lower r 2
velopment of both liquid and frozen precipitation particles;         value for the final case was due to an instrument issue that
(vii) the possible influence of gravity waves on (iii) and (vi).     was identified using this inter-comparison approach. The Mi-
   Adequate description of these in models is key to accu-           crowave Airborne Radiometer Scanning System (MARSS)
rately simulating cloud cover during these events and predict-       (McGrath and Hewison, 2001) was also used for column liq-
ing the impact of the severe weather associated with them. A         uid water retrievals. Additional details on the MARSS LWP
better understanding of the microphysics that sustain these          retrieval can be found in Abel et al. (2017).
cloud regions and the factors that lead to their break-up will          Measurements of the aerosol size distribution were
lead to improved numerical weather prediction and subse-             made using the Passive Cavity Aerosol Spectrometer Probe
quently model estimations of reflected short-wave radiation          (PCASP-100X, DMT) for particle sizes 0.1 < dp , < 3 µm
by these boundary layer clouds.                                      (Rosenberg et al., 2012). Core instruments on the aircraft
   This paper presents in situ observations during four CAOs         included temperature, measured using Rosemount/Goodrich
of clouds deep within areas of SCs, and in the transition re-        type 102 temperature sensors, and information about aircraft
gions that are associated with the eventual evolution to open        altitude, speed and position was provided by the GPS-aided
cellular convection. The main focus is on the microphysics of        inertial navigation system.
these cloud layers and the aerosol properties in the boundary           The shadow imaging probe 2-D-S was used for geometric
layer.                                                               analysis of particle size and shape. From this information,
                                                                     discrimination between irregular and spherical particles was
                                                                     possible for hydrometeors > ∼ 60 µm using a circularity cri-
2   Measurements and data analysis                                   terion (Crosier et al., 2011). The categories generated using
                                                                     information about a particles shape were low irregular (LI,
The Facility for Airborne Atmospheric Measurements                   shape factor between 1 and 1.2), indicating liquid droplets;
(FAAM) British Aerospace-146 (BAe-146) aircraft was used             medium irregular (MI, shape factor between 1.2 and 1.4), for
to perform a combination of straight and level runs (SLRs)           increasingly irregular particles possibly indicative of ice; and
and profiles through cloud layers. Dropsondes were deployed          high irregular (HI, shape factor of 1.4 and greater), images
to measure the thermodynamic structure of the atmosphere.            that have a high shape factor, indicating ice particles.
In situ measurements of cloud microphysical and aerosol                 Data from these instruments were analysed using the Op-
properties in each case were provided by a suite of in-              tical Array Shadow Imaging Software (OASIS), which was
struments. The configuration varied between flights and in-          developed by the National Centre for Atmospheric Science
cluded the Three-View Cloud Particle Imager (3V-CPI, Strat-          (NCAS) and DMT; further description of this can be found in
ton Park Engineering Company (Spec) Inc. Boulder, USA),              Crosier et al. (2011). The 2-D-S and CIP-100 were equipped
consisting of two instruments, the two-dimensional stereo-           with Korolev anti-shatter tips (Korolev et al., 2011) to reduce
scopic (2-D-S) probe, providing 10 µm resolution shadow              shattering artefacts. Examination of inter-arrival time (IAT)
images of hydrometeors over the range 10 < dp < 1280 µm,             histograms was also used to identify and remove shattered
and a Cloud Particle Imager (CPI) CCD camera that was                particles. The 2-D-S contained within the 3V-CPI instrument
used to record very high resolution (2.3 µm) particle im-            used a knife-edge inlet to limit artefacts. Datasets in 1 Hz
agery (Cases 3 and 4). A stand-alone 2-D-S (Lawson et al.,           format were used to calculate statistics such as mean liquid
2006) was used in Cases 1 and 2. Measurements of larger              water content profiles as a function of altitude, and for per-
cloud particles were made using the Cloud Imaging Probe-             centiles in Figs. 6, 10 and 13.
100 (CIP-100, Droplet Measurement Technologies, DMT)

www.atmos-chem-phys.net/18/17191/2018/                                             Atmos. Chem. Phys., 18, 17191–17206, 2018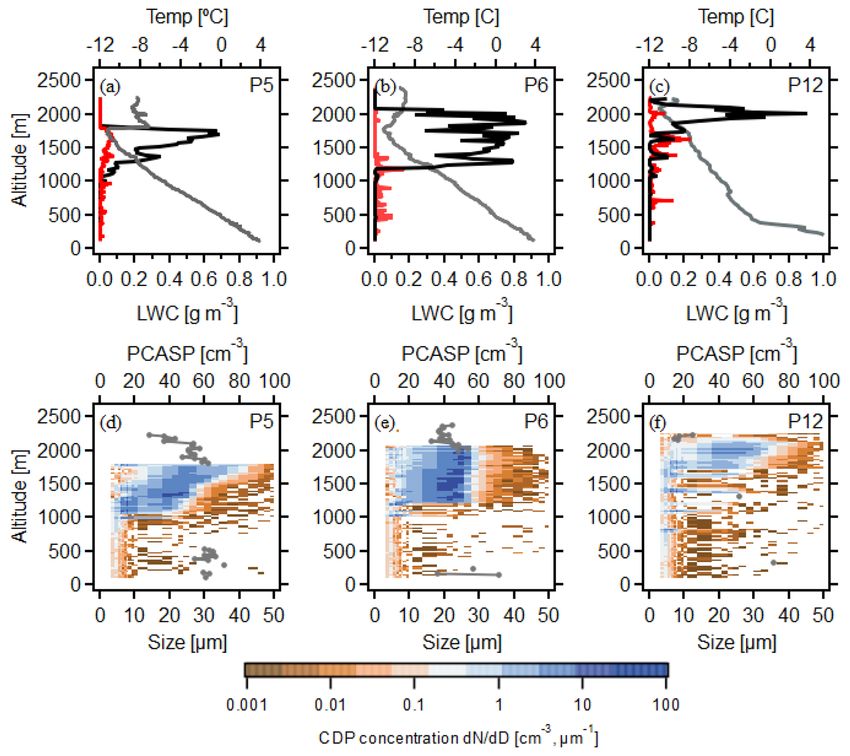
17194                                      G. Lloyd et al.: In situ measurements of cloud microphysical and aerosol properties

                                                                         3     Observations

                                                                         Figure 2 shows ECMWF ERA-5 reanalysis products for sur-
                                                                         face pressure, 2 m temperatures, sea surface temperatures
                                                                         and 10 m wind speeds for four CAOs over the North Atlantic
                                                                         region between 2013 and 2016. Figure 3 shows flight tracks
                                                                         and examples of profile locations numbered on MODIS satel-
                                                                         lite imagery for each case alongside calculated liquid water
                                                                         paths from the CDP and MARSS. The following sections de-
                                                                         scribe the aerosol and microphysical properties of each case.

                                                                         3.1    Case study 1 – 24 November 2013

                                                                         This is the case that was analysed by Abel et al. (2017). A
                                                                         blocking anticyclone centred to the west of the UK led to a
                                                                         CAO between the north-east coast of the UK and the Nor-
                                                                         wegian coast (ERA5 Fig. 2a–d). The 10 m wind speeds were
                                                                         north-north-west at about 12 m s−1 .
                                                                            MODIS satellite imagery (Fig. 3a) shows SCs develop-
                                                                         ing off the eastern coast of Greenland, eventually break-
                                                                         ing up into open cellular convection towards the Norwegian
Figure 1. MODIS visible satellite RGB composite images for each          coastline. The BAe-146 departed from Prestwick (55.51◦ N,
case with flight track of the aircraft overlaid (pink lines). Overpass   4.59◦ W) before measuring the SC layers, and eventually
times are 12:00, 12:20, 13:10 and 11:10 UTC respectively. Simu-          open cellular convection. A total of 10 profiles were made in
lated forward trajectories from the Met Office Unified Model are         the measurement area, with most of these taking place deep
represented by solid circle symbols; each circle represents a 15 min     within the SC layers before a limited number of profiles were
time step along the trajectory. White boxes indicate determined          made towards the region of open cellular convection.
cloud break-up location.
                                                                            In situ measurements revealed a region of SCs below
                                                                         a temperature inversion between 1750 and 2000 m. Drop-
                                                                         sonde locations (S1 and S2) are marked on satellite imagery
2.1   Microphysical evolution with proximity to the
                                                                         (Fig. 3a), and for this case measured dropsonde profiles were
      break-up region
                                                                         in the stratiform region. LWP values measured by the CDP
In Cases 1–3 the microphysical properties of the stratiform              and MARSS (Fig. 3a) were generally 200–500 g m−2 be-
capped boundary layer were related to the proximity to                   tween 10:00 and 10:55 UTC (Fig. 3a). Profile (P) numbers
the transition region to investigate changes in properties of            within the stratiform regions of each case are labelled and
the cloud layers. Forward trajectories using boundary layer              coloured red in the LWP time series in Fig. 3, and those de-
winds from the midpoint of each aircraft profile were sim-               termined to be close to the transition are shown in black. In
ulated by the Met Office Unified Model using the same                    the stratiform region cloud tops were 1750–2000 m and cloud
convection permitting model configuration used in Abel et                bases were variable between ∼ 1000 and 1500 m. One pro-
al. (2017). From this, with the use of MODIS satellite data,             file took place in the cumulus (CU) region where cloud base
the distance each profile was situated from the break-up re-             was about 750 m. The location and temperature of cloud top
gion was estimated, and some of these trajectories are shown             and cloud bases for each profile are shown in Fig. 4a.
as examples overlaid on satellite imagery in Fig. 1, with the               Microphysical properties as a function of altitude for cloud
estimated location of the break-up highlighted by the white              profiles are shown in Fig. 5. These profiles are examples
boxes. This information was then used to calculate the me-               from the overcast region (P5 and P6) compared with mea-
dian and interquartile ranges for a range of microphysical               surements made closer to the break-up region. (P8 and P9).
properties as a function of the distance to the break-up of the          The location of these profiles is also marked on the satellite
SCs. These are presented in Figs. 6, 10 and 13 for Cases 1, 2            imagery in Fig. 3a.
and 3 respectively.                                                         In the overcast region cloud LWC values measured by the
   In Case 4, profiles through SCs were all made at a similar            CDP peaked between 0.8 and 1 g m−3 (Fig. 5a). Cloud pro-
distance to the break-up as determined by the forward tra-               files closer to the cloud break-up (indicated by visible satel-
jectories. For this reason the analysis of changes occurring             lite data) were found to contain lower LWCs (Fig. 5c), and
towards the break-up zone was not carried out for this case.             eventually the aircraft measured a glaciated convective cell
                                                                         with very little liquid water (Fig. 5d). Figure 3a shows the
                                                                         higher LWPs associated with the stratiform region (P6 and

Atmos. Chem. Phys., 18, 17191–17206, 2018                                                www.atmos-chem-phys.net/18/17191/2018/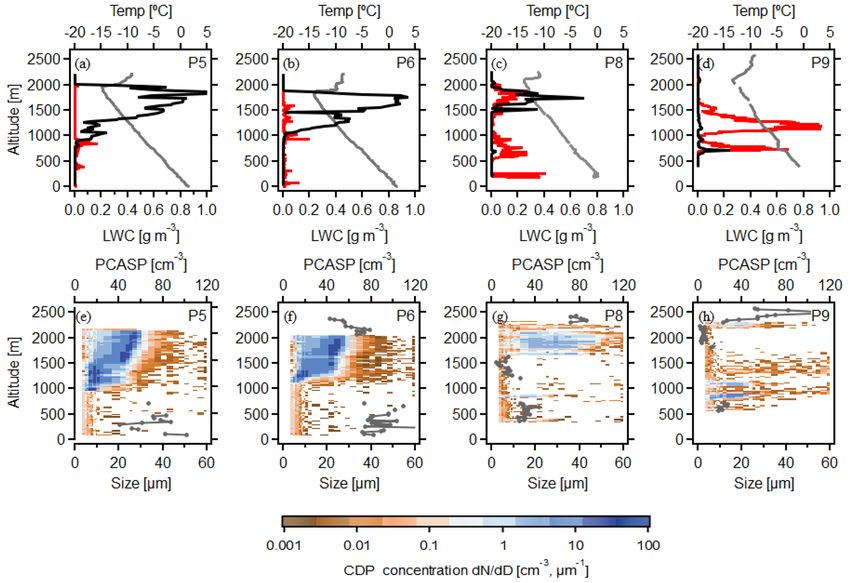
G. Lloyd et al.: In situ measurements of cloud microphysical and aerosol properties                                          17195

Figure 2. ECMWF ERA5 reanalysis data from each case for mean sea level pressure, sea surface temperatures, 2 m temperatures and 10 m
wind speed for Case 1 (a–d), Case 2 (e–h), Case 3 (i–l) and Case 4 (m–p).

P7 CDP LWP values 499 and 427 g m−2 respectively) and               perature did vary between −10 and −4 ◦ C, with the higher
the lower values in the transition and open cellular region (P9     temperatures closer to the break-up as shallow CU was rising
and P10 CDP LWP values 108 and 17 g m−2 respectively).              into the SC layer above. Size distributions of cloud droplets
   Figure 6 shows microphysical analysis as described in            were calculated over whole cloud profiles, and a selection
Sect. 2.1. Quoted microphysical properties are median val-          from the stratiform region and the transition region are shown
ues. Typical droplet number concentrations were around              in Fig. 7a (P6, green lines and P8, purple lines respectively).
100 cm−3 (25th and 75th percentiles 80 and 125 cm−3 re-             The dashed lines represent the very low numbers (peaks of
spectively) 220 km away from the break-up deep in the strati-       4 L−1 ) of highly irregular particles identified by the 2-D-S.
form region. These fell to just 20 cm−3 40 km from the break-       The size distributions showed a broadening spectrum with in-
up. Cloud droplet sizes were seen to steadily increase from         creasing proximity to the break-up region. The stratiform re-
median values of 18 µm 100 km away to 25 µm just 40 km              gion appeared to be dominated by liquid water, with evidence
from the break-up.                                                  of some ice formation, particularly towards the break-up re-
   These concentrations were in broad agreement with                gion. In P8, within the SC region, there was an increase in
boundary layer aerosol measured by the PCASP that were              concentrations of highly irregular particles and a correspond-
84 cm−3 falling to 27 cm−3 ∼ 40 km from the break-up                ing decrease in LWP (Fig. 5c), indicating ice, with peaks
(Fig. 6d). Vertical profiles showed these particles were well       around 4 L−1 measured by the 2-D-S. The ice crystal im-
mixed to cloud base (Fig. 5e–h).                                    ages from the 2-D-S and CIP-100 showed the presence of
   Cloud top temperatures were ∼ −15 ◦ C (Fig. 4a), with lit-       dendritic ice (Fig. 7a).
tle change closer to the break-up region. The cloud base tem-

www.atmos-chem-phys.net/18/17191/2018/                                             Atmos. Chem. Phys., 18, 17191–17206, 2018
17196 G. Lloyd et al.: In situ measurements of cloud microphysical and aerosol properties
Figure 4. Cloud top altitude and temperature (green symbols),
cloud base altitude and temperature (yellow symbols) and drop-
sonde data for Cases 1–4, showing temperature as a function of al-
titude. Grey traces represent sonde profiles closer to or in the open
cellular regime; black traces represent the stratiform region.
(SLRs) and saw tooth profiles were performed by the BAe-
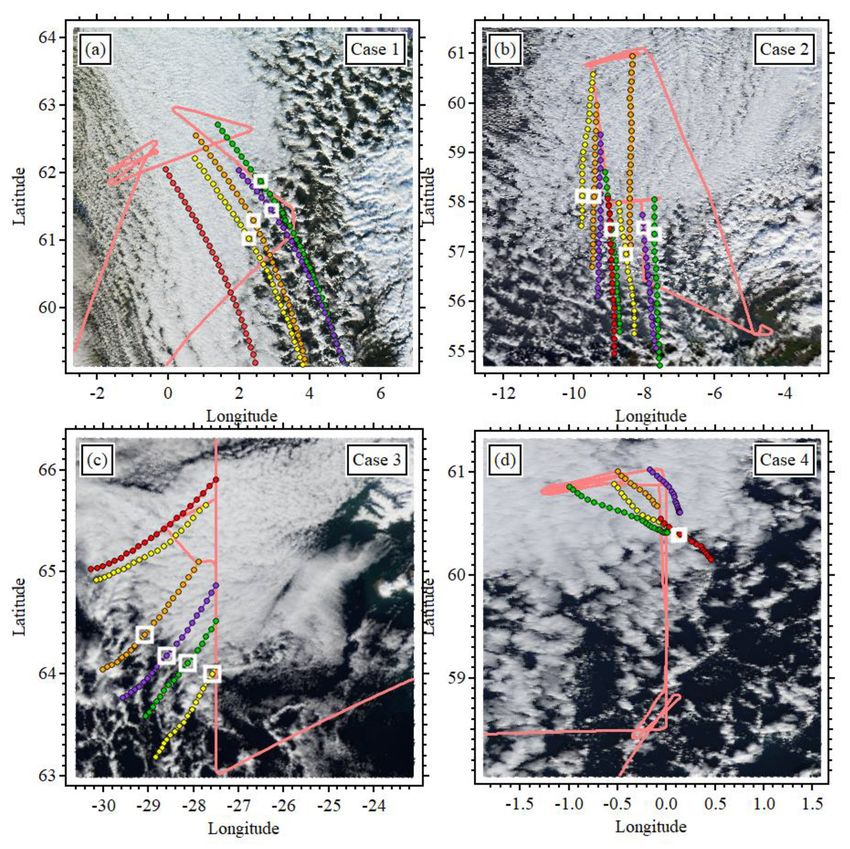
Figure 3. LWP time series values for Cases 1–4 (a, c, e, g) de- 146 aircraft after departing from Prestwick.
rived from MARSS (green trace) and CDP (grey markers). Red In situ measurements revealed a region of SCs below the
profile numbers indicate stratiform regions and black markers indi- temperature inversion at around 1750 m. Earlier dropsondes
cate transitioning or open cellular regions. MODIS RGB composite deployed by the aircraft (Fig. 4b) had found the inversion to
satellite imagery (b, d, f, h) with flight track superimposed (light be between about 1500 and 2000 m. Dropsonde locations are
red trace) and profiles marked (yellow boxes with profile numbers). marked on satellite imagery (Fig. 3b). Although both drop-
sondes were within the stratiform region, there is a notable
increase in height and weakening of the inversion from the
sonde closest to the break-up. LWP values measured by the
The final profile (P9) took place in open cellular convec-
CDP and MARSS (Fig. 3b) were generally 200–600 g m−2
tion, just to the south-east of the SC. The aircraft traversed
in the stratiform region between ∼ 12:35 and 12:55 UTC.
the lower regions of an isolated convective cell. During this
Cloud tops were 1750–2000 m and cloud bases varied be-
profile high concentrations of columnar ice crystals were ob-
tween ∼ 10:00 and 15:00 m. Cloud top temperatures were
served that reached peaks of 120 L−1 , with a reduction in
between −10 and −13 ◦ C. Cloud base temperatures were be-
liquid water as can be seen in Fig. 5d.
tween −5 and −7 ◦ C. The altitude and temperature of cloud
top and cloud bases for each profile is shown on Fig. 4b.
3.2 Case study 2 – 20 November 2013 Microphysical properties as a function of altitude for se-
lected profiles are shown in Fig. 9. These profiles are ex-
A CAO affected the North Atlantic region to the north-west amples from the overcast region (P5 and P6) compared with
of the UK (Fig. 2e–h), with an area of SCs to the north of the measurements made during a profile closer to the break-up
UK that transitioned into open cellular convection to the west region (P12). The location of these profiles is marked on
of Scotland (Fig. 3). A deep area of low pressure produced satellite imagery in Fig. 3b. In the stratiform region LWC
strong 10 m winds compared to the other cases in this paper values peaked ∼ 0.8 g m−3 (Fig. 9a–b). Closer to the transi-
(20 m s−1 ). With the advection of a cold air mass of polar tion, cloud profiles contained similar peak values but thinner
origin, significant cloud formed, overlying the warmer sea cloud layers. This change is represented in the LWP values
surface temperatures. Combinations of straight and level runs of 533 and 393 g m−2 in the stratiform region (P5 and P6
Atmos. Chem. Phys., 18, 17191–17206, 2018 www.atmos-chem-phys.net/18/17191/2018/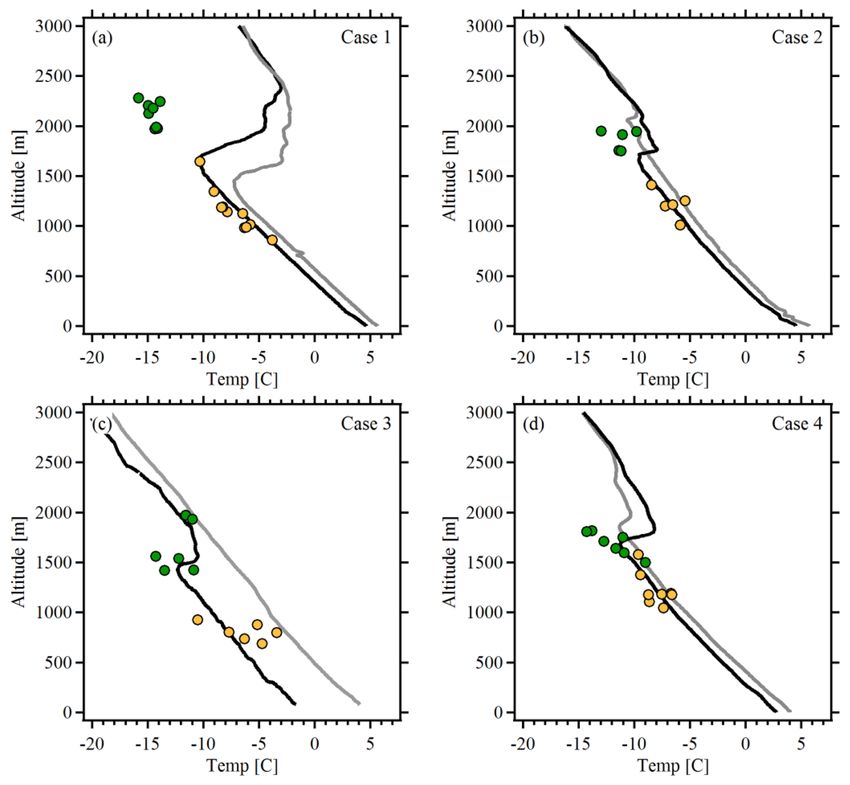
G. Lloyd et al.: In situ measurements of cloud microphysical and aerosol properties                                                  17197

Figure 5. Measurements from Case 1 showing mean LWC as a function of altitude from the CDP (black trace), IWC from the Nevzorov (red
trace) and temperature (grey trace) as a function of altitude (a–d). Panels (e–h) show CDP droplet size distributions (colour plot) and mean
PCASP concentrations out of cloud as a function of altitude (grey trace).

                                                                        respectively marked on Fig. 3b) compared with 269 g m−2
                                                                        closer to the transition in P12.
                                                                           Figure 10 shows microphysical analysis as described in
                                                                        Sect. 2.1. Quoted microphysical properties are median val-
                                                                        ues. Droplet number concentrations did not show the same
                                                                        trends as in Case 1. There was a general increase in concen-
                                                                        trations (∼ 60 at 400 km from the break-up to 100 cm−3 at
                                                                        100 km away) and sizes (10 at 400 km to 20 µm at 100 km
                                                                        from the break-up, respectively) of cloud droplets with in-
                                                                        creasing proximity to the transition. There was also an in-
                                                                        crease in aerosol concentrations (∼ 30 to 60 cm−3 in the
                                                                        boundary layer). The reasons for this are not clear; however,
                                                                        compared to the other three cases, wind speed measurements
                                                                        were relatively high, ∼ 25 m s−1 (compared to 10 m s−1 in
                                                                        Cases 1, 3 4) in the boundary layer close to the sea surface.
                                                                        These strong boundary layer winds can be seen in Fig. 2h.
                                                                        The strength of the winds in this case may have had an im-
                                                                        pact on the production of sea salt aerosol from the surface.
                                                                           A selection of PSDs from the stratiform region and the
                                                                        transition region are shown in Fig. 7b. They show a small
                                                                        increase in the number of precipitation particles measured
                                                                        by the 2-D-S just before the break-up. The number of larger
Figure 6. Median and 25th and 75th percentile values as a function      particles, indicating drizzle, increased from 10 to 88 L−1 be-
of distance from the break-up for (a) CDP size, (b) CDP concentra-      tween P6 and P12 respectively, with the number of HI par-
tion, (c) PCASP size below cloud (BC) and above cloud (AC) and
                                                                        ticles, indicating ice crystals, only increasing from 0.1 to
(d) PCASP concentration BC and AC.
                                                                        0.2 L−1 . Imagery showed this to be a mix of supercooled
                                                                        drizzle, graupel-type particles and columnar ice crystals.

www.atmos-chem-phys.net/18/17191/2018/                                                  Atmos. Chem. Phys., 18, 17191–17206, 2018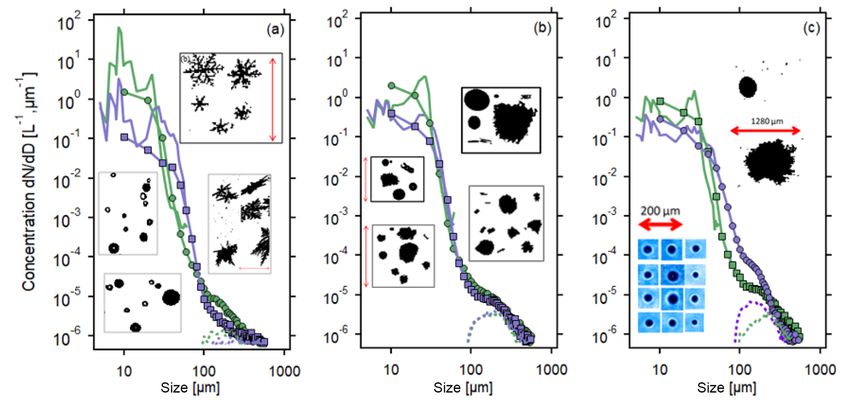
17198 G. Lloyd et al.: In situ measurements of cloud microphysical and aerosol properties
Figure 7. Size distributions for Cases 1–3 comparing the CDP and 2DS size distributions for cloud profiles within the cloudy region (green
lines) and closer to the transition (purple lines). Images are examples of ice particles and liquid droplets/drizzle from profiles represented by
PSDs.
sonde in the open cellular region showed that the inversion
had been eroded, with associated convection confirmed by
satellite imagery.
Cloud top heights in the stratiform region were ∼ 1500 m,
while two profiles closer to the break-up showed increased
cloud top height close to 2000 m (Fig. 4c). Cloud top temper-
atures were between −10 and −14 ◦ C. Cloud base altitudes
were quite closely grouped around 750 m, but the tempera-
tures varied between −3 and −11 ◦ C. Winds in the boundary
layer were north-easterly at ∼ 10 m s−1 .
Figure 8. Images from the 2-D-S instrument for Cases 1, 2 and 3.
Initially, as measurements were made with increasing dis-
Case 1 shows drizzle, rimed ice particles and columnar ice crys-
tance south, a change from a shallow layer of SCs consist-
tals from a period of secondary ice production during P9 (location
marked in Fig. 3). Cases 2 and 3 show images from the same periods ing of small liquid cloud droplets to a deeper layer con-
represented by the particle size distributions in Fig. 7b and c. taining larger hydrometeors was observed. LWP values mea-
sured by the CDP and MARSS (Fig. 3c) were generally 200–
300 g m−2 in the stratiform region ∼ 13:15 UTC, with values
decreasing significantly closer to the transition from closed
3.3 Case study 3 – 23 March 2015 to open cell conditions.
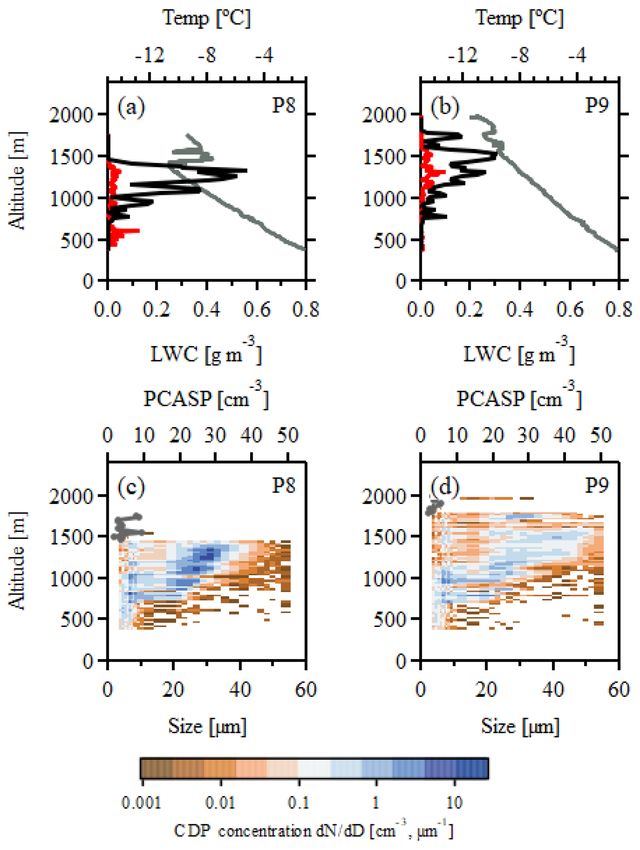
Microphysical properties as a function of altitude for se-
A CAO affected the North Atlantic region east of Greenland lected profiles are shown in Fig. 11. These profiles show
(Fig. 2i–l) with an area of SCs investigated to the west of some examples from the overcast region (P2, P4, P5 and P7)
Iceland using a combination of SLRs and saw tooth profiles compared with measurements made closer to the break-up
that were performed by the BAe-146 aircraft (Fig. 3c). The region (Fig. 12; P9 and P10). In P5 and P7, LWC values mea-
stratiform region associated with this CAO was significantly sured by the CDP peaked at 0.7 g m−3 (Fig. 11c–d). P9 and
smaller in area than the other cases presented in this paper, 10 close to the transition showed reductions in LWC values
but had similar microphysical properties. Satellite imagery to 0.3 g m−3 by P10 (Fig. 12b). LWPs were also seen to de-
(Fig. 3c) showed the SC region to the west of Iceland even- crease to 37 g m−2 in P10. P2 and P4 (Fig. 3c) are north of
tually breaking up to the SW of the island. Wind speeds at where the most extensive cloud layers were observed. In this
10 m were around 10 m s−1 . region the boundary layer appeared to have become decou-
After the aircraft departed from Keflavic (63.99◦ N, pled with a double temperature inversion present.
22.62◦ W) a high-altitude run was carried out with dropson- Figure 13 shows microphysical analysis as described in
des (marked on Fig. 3c) used to measure the vertical structure Sect. 2.1. Quoted microphysical properties are median val-
of the atmosphere (Fig. 4c). These measurements revealed ues. Droplet number concentrations were around 50 cm−3
an inversion ∼ 1500 m in the stratiform region, while a drop-
Atmos. Chem. Phys., 18, 17191–17206, 2018 www.atmos-chem-phys.net/18/17191/2018/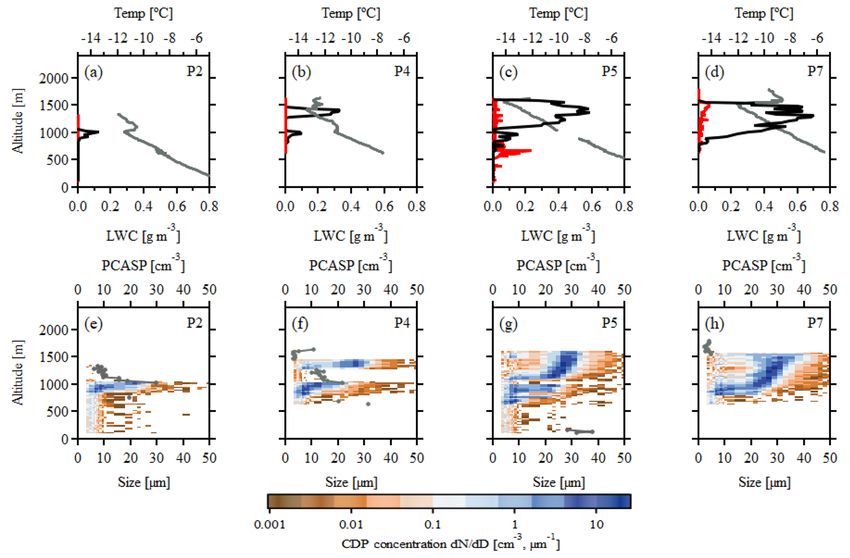
G. Lloyd et al.: In situ measurements of cloud microphysical and aerosol properties                                      17199

Figure 9. As Fig. 5 but for Case 2.

                                                                duction from ∼ 30 cm−3 at 110 km to less than 10 cm−3 at
                                                                around 80 km from the break-up.
                                                                   A selection of PSDs from the stratiform region and the
                                                                transition region are shown in Fig. 7c. Shadow probe and CPI
                                                                imagery are superimposed on these PSDs as examples of ob-
                                                                served particles. The PSDs initially showed a reasonably nar-
                                                                row liquid droplet distribution. As the cloud layer developed,
                                                                this broadened, and with increasing proximity to the break-
                                                                up region (Fig. 7c), significant increases in precipitation-
                                                                sized particles consisting of drizzle and irregular ice parti-
                                                                cles were observed. Despite imagery (superimposed on the
                                                                size distributions) revealing some irregular particles, the con-
                                                                centrations of ice were generally very low, with the num-
                                                                ber of counts leading to a high degree of uncertainty due
                                                                to sampling error; therefore no concentrations are stated for
                                                                this case. During the final profile, drizzle concentrations in-
                                                                creased to 50 L−1 and images from the CPI and 2-D-S re-
                                                                vealed spherical liquid drops that were 100–200 µm in diam-
                                                                eter.
Figure 10. As Fig. 6 but for Case 2.
                                                                3.4   Case study 4 – 15 February 2016

                                                                A blocking anticyclone ridged across the UK (Fig. 2m–p),
                                                                producing a weak northerly (10 m winds of 5 m s−1 ) orien-
∼ 100 km away from the break-up, but fell significantly to      tated returning polar maritime flow to the north-east of the
just 15 cm−3 about 50 km from the transition. PCASP mea-        UK, which produced a CAO and an SC region between the
surements in the boundary layer were complicated by the         north-east coast of the UK and the Norwegian coast. The
presence of precipitation; however they also show a large re-   BAe-146 departed from Cranfield before measuring SC lay-

www.atmos-chem-phys.net/18/17191/2018/                                        Atmos. Chem. Phys., 18, 17191–17206, 2018
17200                                    G. Lloyd et al.: In situ measurements of cloud microphysical and aerosol properties

Figure 11. As Fig. 5 but for P2, P4, P5 and P7 for Case 3.

                                                                   ers (Fig. 3d), initially close to the Shetland Isles, but then
                                                                   with increasing distance south along the east coast of Eng-
                                                                   land. Profiles through SCs covered a large area from approx-
                                                                   imately 60 to 61◦ N.
                                                                      In situ measurements at the north end of the measurement
                                                                   region (Fig. 3d) revealed a region of SCs below a tempera-
                                                                   ture inversion around 1750 m. Earlier dropsondes deployed
                                                                   by the aircraft (marked on Fig. 3d) had found the inversion
                                                                   to be between about 1500 and 2000 m. The dropsonde profile
                                                                   deeper in the stratiform region had a stronger inversion and
                                                                   lower cloud top height compared to the dropsonde in the tran-
                                                                   sition region. Cloud tops were quite variable in this case and
                                                                   generally between 1500 and 1750 m (Fig. 4d). Cloud bases
                                                                   were anywhere from ∼ 1000 to 1500 m. Cloud top tempera-
                                                                   tures were between −8 and −14 ◦ C. Cloud base temperatures
                                                                   were between −6 and −9 ◦ C.
                                                                      LWP values measured by the CDP and MARSS (Fig. 3d)
                                                                   were generally around 200 g m−2 in the stratiform region be-
                                                                   tween 13:30 and 14:45 UTC. Microphysical properties as a
                                                                   function of altitude for selected profiles are shown in Fig. 14.
                                                                   These profiles from the overcast region (P3 and P8) com-
                                                                   pared with measurements made during profiles in an open
                                                                   cellular region identified on satellite imagery (P16 and P18).
                                                                   In the open cellular region a temperature inversion was still
                                                                   present; some profiles exhibited a thin liquid cloud layer be-
                                                                   low this inversion and others were clear. In the stratiform re-
Figure 12. As Fig. 5 but for P8 and P9 for Case 3.                 gion, LWC values peaked at ∼ 0.8 (Fig. 14a–b). During the
                                                                   transition, values were much lower around 0.2 g m−3 . This
                                                                   change can also be seen in the LWP values (Fig. 3d) that de-

Atmos. Chem. Phys., 18, 17191–17206, 2018                                          www.atmos-chem-phys.net/18/17191/2018/
G. Lloyd et al.: In situ measurements of cloud microphysical and aerosol properties 17201
observed, with these precipitating from the cloud layer. Im-
agery of these particles for the cases can be found in Fig. 8.
It is thought the changes in aerosol below cloud were due
to the removal of aerosol particles by precipitation scaveng-
ing processes. The removal rate, in the absence of any signif-
icant source of replenishment, leads to larger cloud droplets
and increased efficiency of the warm rain process, further en-
hancing precipitation and loss of water from the cloud, which
Abel et al. (2017) found to be a key factor in the transition
and break-up of the clouds during these events.
Case 2 involved a CAO to the north-west of the UK. This
case was in contrast to the other three cases, as aerosol prop-
erties in the boundary layer did not show an overall trend of
declining number concentrations and actually demonstrated
increasing concentrations of aerosol and cloud droplet num-
bers closer to the break-up (Fig. 10). In Case 2 the main
difference in the meteorological conditions was the presence
of high winds in the boundary layer, in excess of those ob-
served in the other cases. It is proposed that in this situation
Figure 13. Median and 25th and 75th percentile values as a func- replenishment of the aerosol population occurred from the
tion of distance from the break-up for CDP size, CDP concentra- sea surface, something that did not happen as much in the
tion, PCASP size below cloud, PCASP size above cloud, PCASP other cases. The production of sea salt over the oceans has
concentration below cloud and PCASP concentration above cloud been found to be strongly dependent on the wind speed close
(Case 3). to the surface (Grythe et al., 2014). This has direct implica-
tions for cloud microphysical properties as the droplet size
distribution and potentially the availability of ice nucleating
crease first to 150 g m−2 at the transition and then to around
particles is modulated
50 g m−2 in the open region. This appeared to be due to the
Case 3 provided observations of a CAO off the west coast
cloud layer either breaking up completely or the persistence
of Iceland. SC layers, consisting predominantly of liquid and
of a thin stratus cloud.
low concentrations of ice, were observed to deepen with in-
creasing LWPs. This is consistent with the production of
4 Discussion larger cloud hydrometeors promoting the formation of pre-
cipitation and the removal of increasing amounts of wa-
ECMWF ERA 5 reanalysis (Fig. 2) shows a range of ter from the cloud. This can be seen in Fig. 13a, where
northerly outbreaks that produce supercooled SC layers that droplet sizes measured by the CDP increase with proximity
were investigated over the North Atlantic during four CAOs. to the break-up region. The aerosol measurements show that
These extensive layers of SC were similar in overall struc- boundary layer concentrations are decreasing with distance
ture, with the cloudy region situated below a tempera- south, closer to the break-up, and that cloud droplet sizes are
ture inversion around 2 km in a well-mixed boundary layer increasing, which would in turn increase the efficiency of the
(Fig. 15). Visible satellite imagery (Figs. 1 and 3) shows that warm rain process.
all cases eventually transitioned into an open cellular regime, Case 4 revealed SC layers with varying amounts of driz-
with the SCs breaking up. In situ measurements by the air- zle and irregular ice particles deep within the SC layer, but
craft were designed to capture the microphysical evolution much less ice further south, and with drizzle almost com-
of the cloudy boundary layer as the SCs transitioned into the pletely dominating the precipitation. As with Cases 1 and
open cellular regime. 3, aerosol concentrations were observed to decrease in the
LWPs in the cloudy region derived in each case through in boundary layer with distance travelled south.
situ and remote sensing measurements on the aircraft were In all cases the SCs were situated over a temperature range
generally between 200 and 500 g m−2 (Fig. 3). These values that was not ideal for secondary ice production to take place
showed a trend to much lower values in the regions of transi- through the Hallett–Mossop (H–M) process. Generally cloud
tion (often < 200 g m−2 ). bases, particularly further north, were at the lower end of the
Case 1 provided observations of decreasing aerosol con- H–M temperature zone, leading to inefficient production of
centrations in the boundary layer (Fig. 6) with proximity to ice splinters through riming. In some cases, secondary ice
the transition region. This change was independent of the production was observed; for example, in Case 1, instability
above cloud aerosol, which showed no obvious trend. For- in the boundary layer allowed cumulus to grow through the
mation of drizzle, dendritic and irregular ice particles was H–M temperature zone, penetrating the SC layers above. In
www.atmos-chem-phys.net/18/17191/2018/ Atmos. Chem. Phys., 18, 17191–17206, 201817202 G. Lloyd et al.: In situ measurements of cloud microphysical and aerosol properties
Figure 14. LWC (black trace) and temperature (grey trace) as a function of altitude for selected profiles from Case 4.
several 100 g m−2 before reducing significantly as the cloud
evolved into an open cellular regime.
We also confirm the observation of low numbers of ice
crystal concentrations, the understanding of which is key to
accurately simulating these clouds in NWP models. In two of
the additional cases, we also observed the removal of aerosol
particles from the boundary layer with increasing proxim-
ity to the break-up region. In the other new case, this trend
was not observed and we can only speculate that higher wind
speeds in the boundary layer helped to replenish aerosol from
the sea surface. Figure 16 shows an inter-case comparison on
the same distance to break-up scale for the properties pre-
sented in Figs. 6, 10 and 13. This confirms that in Case 1 and
3 we see trends that are consistent with each other, for exam-
ple decreasing aerosol concentrations and decreasing droplet
number concentrations. Together with the similar trends, the
values of microphysical properties also show some consis-
tency between Cases 1 and 3. Concentrations of droplets, for
example, are around 50 cm−3 ∼ 110 km from the break-up in
both Cases 1 and 3.
Figure 15. Gradients in 1θil vs. 1qt for Cases 1–4. Red profile Abel et al. (2017) provided evidence for boundary layer
numbers represent gradients within the stratiform boundary layer decoupling in Case 1 by calculating the gradients in ice liq-
and black profile numbers represent gradients in transition or open uid potential temperature (1θil ◦ C) and total water content
regions. (1qt g kg−1 ) between the surface and top of the boundary
layer. They found evidence that total water mixing ratios and
liquid potential temperature were both well mixed to the top
this case, high concentrations of ice were observed, with the of the boundary layer. Closer to the transition region, increas-
rapid depletion of liquid water. ing values of 1θil and 1qt were observed, indicating drizzle-
Together with the cloud not being in an ideal environment induced decoupling of the boundary layer. Abel et al. (2017)
for H–M secondary ice production, the clouds were also gen- also investigated the potential for cloud top entrainment in-
erally warmer than −15 ◦ C, the temperature at which most stability (CTEI) following the calculation of parameter k de-
dust becomes significant as active INPs (Hoose and Möhler, tailed in Lock (2009). Values of k > 0.2 are indicative of en-
2012). This is consistent with limited amounts of primary ice trainment at the cloud top, which is conducive to generating
nucleation, and when it did occur, the riming particles that negatively buoyant mixtures that sink, promoting a break-up
were generated descended through a temperature range not of the cloud. We also calculated this parameter, finding the
conducive to secondary ice production. values to be similar to values found by Abel et al. (2017),
Case 1 discussed in this paper describes the CAO inves- suggesting CTEI was not a driver for the break-up in these
tigated by Abel et al. (2017) through both in situ measure- cases.
ments and modelling sensitivity tests. We have found in a fur- We also carried out the boundary layer decoupling cal-
ther three cases in the North Atlantic region that in situ mea- culations, and these have been applied for the cases pre-
surements of their microphysical properties are broadly sim- sented here (Fig. 15). We also find evidence for the process
ilar. Predominantly liquid cloud layers contained LWPs of
Atmos. Chem. Phys., 18, 17191–17206, 2018 www.atmos-chem-phys.net/18/17191/2018/G. Lloyd et al.: In situ measurements of cloud microphysical and aerosol properties 17203
– The further three cases studied over the Abel et
al. (2017) case are broadly similar in relation to their
structure and evolution. This suggests that the results
and model improvements detailed in Abel et al. (2017)
can be applied more widely to help improve NWP of
these types of events.
– The cloud layers in all cases were about 1 km in depth,
with cloud top temperatures often warmer than −15 ◦ C,
and with cloud bases colder than or at the colder end
of the H–M SIP temperature range (between −3 and
−8 ◦ C). Cloud temperatures increased with distance
south. This sometimes led to increases in concentrations
of columnar ice crystals as often associated with sec-
ondary ice production through the H–M process.
– In three cases, aerosol properties in the boundary layer
showed evidence of a decline in concentration (indepen-
Figure 16. Median and 25th and 75th percentile values as a function dent of the above cloud aerosol numbers) with increas-
of distance from the break-up for CDP size, CDP concentration, ing proximity to the transition zone. This has similar-
PCASP concentration below cloud and PCASP concentration above ities to findings from VOCALS in the eastern South-
cloud for Cases 1, 2 and 3. ern Hemisphere Pacific, where precipitation formation
through collision coalescence led to the removal of
aerosol particles at a rate that exceeded any replenish-
of drizzle-driven decoupling in some of the other cases. Red ment. This creates a positive feedback, whereby cloud
profile markers represent gradients in the stratiform region droplet size increases, together with the efficiency of the
for each case, and black markers gradients in the transition warm rain process and eventually the formation of pre-
or open cellular regions. Case 2 was quite different from the cipitation. This feedback depletes the cloud of water,
other cases in its microphysical evolution, and no real rela- leading to cloud break-up.
tionship is seen. The reasons for this are uncertain, but the
strong wind speeds in this case would increase shear-induced – One case exhibited no apparent trend in aerosol concen-
turbulence, which could keep the boundary layer fairly well trations in the boundary layer. This case was interesting
mixed, potentially slowing the transition. This well-mixed as winds close to the surface were much higher than
profile would help prevent the decoupling mechanism dis- in other cases. One hypothesis is that replenishment of
cussed in Case 1 and would also replenish aerosol, reducing aerosol from the sea surface due to high wind speeds in
the efficiency of any washout–precipitation feedback. the boundary layer offset any losses due to precipitation.
In Case 3 there was a lack of suitable measurements in
general, but the profile closest to the transition did have in- – Precipitation development appeared to be a key pro-
creased gradients. In Case 4 we found strong evidence for cess in the evolution of the SC layers and their even-
this boundary layer decoupling metric being associated with tual break-up. All cases developed significant amounts
the transition and open cellular regions. of drizzle that precipitated from the cloud layers.
– Key to the formation of drizzle precipitation in some
5 Conclusions cases was the increasing size of liquid droplets mea-
sured by the CDP as shown in Fig. 6 and Fig. 13.
In situ measurements of four CAOs over the North Atlantic
were conducted to investigate the microphysical structure of – The ice phase did vary between cases, with generally
SC layers and aerosol concentrations in the boundary layer. low concentrations of ice (a few L−1 ) present that ap-
In all cases, measurements were continued through to the peared to be dependent on cloud top temperature and on
transition region where cloud layers became disrupted, lead- whether clouds occupied a significant proportion of the
ing to open cellular convection. The main findings from this H–M temperature range. Cases 3 and 4 contained rela-
study are outlined below. tively little ice; however Cases 1 and 2 contained higher
concentrations of ice, particularly Case 1, in which den-
– Extensive regions of SCs below a temperature inversion dritic ice crystals were observed deep within the SC re-
were observed in all cases, with these layers eventually gion, and eventually high concentrations (120 L−1 ) of
breaking up into open cellular convection. columnar ice crystals developed as the boundary layer
www.atmos-chem-phys.net/18/17191/2018/ Atmos. Chem. Phys., 18, 17191–17206, 201817204 G. Lloyd et al.: In situ measurements of cloud microphysical and aerosol properties
became more unstable and cloud spanned the H–M tem- 59–60, 251–264, https://doi.org/10.1016/S0169-8095(01)00119-
perature zone. 3, 2001.
Bodas-Salcedo, A., Williams, K. D., Field, P. R., and Lock,
– Evidence was found to support the findings of Abel et A. P.: The surface downwelling solar radiation surplus over
al. (2017) that small gradients in 1θil and 1qt are asso- the southern ocean in the met office model: The role
ciated with the stratiform, well-mixed boundary layer. of midlatitude cyclone clouds, J. Climate, 25, 7467–7486,
https://doi.org/10.1175/JCLI-D-11-00702.1, 2012.
Larger values of these parameters were more likely to
Boers, R., Jensen, J. B., Krummel, P. B., and Gerber, H.: Micro-
be found in transition regions, indicating a decoupled
physical and short-wave radiative structure of wintertime stra-
boundary layer. It is suggested that this decoupling of tocumulus clouds over the Southern Ocean, Q. J. Roy. Meteor.
the boundary layer close to the break-up zone inhibited Soc., 122, 1307–1339, 1996.
the transport of water vapour from the sea surface to the Boutle, I. A. and Abel, S. J.: Microphysical controls on
cloud to offset losses. the stratocumulus topped boundary-layer structure dur-
ing VOCALS-REx, Atmos. Chem. Phys., 12, 2849–2863,
https://doi.org/10.5194/acp-12-2849-2012, 2012.
Data availability. The data presented in this paper are Bretherton, C. S. and Wyant, M. C.: Moisture Trans-
available through the Centre for Environmental Data port, Lower-Tropospheric Stability, and Decou-
Analysis (CEDA) at http://catalogue.ceda.ac.uk/uuid/ pling of Cloud-Topped Boundary Layers, J. At-
01b606c523154f7693956e5e0f0a92f1 (Facility for Airborne mos. Sci., 54, 148–167, https://doi.org/10.1175/1520-
Atmospheric Measurements; Natural Environment Research 0469(1997)0542.0.CO;2, 1997.
Council; Met Office, 2014). Connolly, P. J., Vaughan, G., Cook, P., Allen, G., Coe, H.,
Choularton, T. W., Dearden, C., and Hill, A.: Modelling the
effects of gravity waves on stratocumulus clouds observed
Author contributions. All authors contributed to the research and during VOCALS-UK, Atmos. Chem. Phys., 13, 7133–7152,
preparation of the paper. https://doi.org/10.5194/acp-13-7133-2013, 2013.
Crosier, J., Bower, K. N., Choularton, T. W., Westbrook, C. D., Con-
nolly, P. J., Cui, Z. Q., Crawford, I. P., Capes, G. L., Coe, H.,
Dorsey, J. R., Williams, P. I., Illingworth, A. J., Gallagher, M. W.,
Competing interests. The authors declare that they have no conflict
and Blyth, A. M.: Observations of ice multiplication in a weakly
of interest.
convective cell embedded in supercooled mid-level stratus, At-
mos. Chem. Phys., 11, 257–273, https://doi.org/10.5194/acp-11-
257-2011, 2011.
Acknowledgements. Airborne data were obtained using the FAAM Curry, J. A., Rossow, W. B., Randall, D., and Schramm, J. L.:
BAe-146 Atmospheric Research Aircraft, which was operated Overview of Arctic Cloud and Radiation Characteristics, J. Cli-
by Airtask and jointly funded by the UK Natural Environment mate, 9, 1731–1764, 1996.
Research Council (NERC) and the Met Office. We acknowledge Facility for Airborne Atmospheric Measurements; Natural Envi-
support from NERC under grant NE/I028696/1 as part of the ronment Research Council; Met Office: PIKNMIX: in-situ air-
Aerosol-Cloud Coupling and Climate Interactions in the Arctic borne observations by the FAAM BAE-146 aircraft, NCAS
(ACCACIA) project. British Atmospheric Data Centre, available at: http://catalogue.
ceda.ac.uk/uuid/01b606c523154f7693956e5e0f0a92f1 (last ac-
Edited by: Radovan Krejci cess: 13 November 2018), 2014.
Reviewed by: two anonymous referees Field, P. R., Cotton, R. J., Mcbeath, K., Lock, A. P., Webster, S.,
and Allan, R. P.: Improving a convection-permitting model sim-
ulation of a cold air outbreak, Q. J. Roy. Meteor. Soc., 140, 124–
138, https://doi.org/10.1002/qj.2116, 2014.
References Field, P. R., Brožková, R., Chen, M., Dudhia, J., Lac, C.,
Hara, T., Honnert, R., Olson, J., Siebesma, P., de Roode, S.,
Abel, S. J., Cotton, R. J., Barrett, P. A., and Vance, A. K.: A com- Tomassini, L., Hill, A., and McTaggart-Cowan, R.: Explor-
parison of ice water content measurement techniques on the ing the convective grey zone with regional simulations of a
FAAM BAe-146 aircraft, Atmos. Meas. Tech., 7, 3007–3022, cold air outbreak, Q. J. Roy. Meteor. Soc., 143, 2537–2555,
https://doi.org/10.5194/amt-7-3007-2014, 2014. https://doi.org/10.1002/qj.3105, 2017.
Abel, S. J., Boutle, I. A., Waite, K., Fox, S., Brown, P. R. A., Cotton, Fletcher, J., Mason, S., and Jakob, C.: The climatology, me-
R., Lloyd, G., Choularton, T. W., and Bower, K. N.: The Role of teorology, and boundary layer structure of marine cold air
Precipitation in Controlling the Transition from Stratocumulus to outbreaks in both hemispheres, J. Climate, 29, 1999–2014,
Cumulus Clouds in a Northern Hemisphere Cold-Air Outbreak, https://doi.org/10.1175/JCLI-D-15-0268.1, 2016.
J. Atmos. Sci., 74, 2293–2314, https://doi.org/10.1175/JAS-D- Grythe, H., Ström, J., Krejci, R., Quinn, P., and Stohl, A.: A re-
16-0362.1, 2017. view of sea-spray aerosol source functions using a large global
Baumgardner, D., Jonsson, H., Dawson, W., O’Connor, D., and set of sea salt aerosol concentration measurements, Atmos.
Newton, R.: The cloud, aerosol and precipitation spectrome-
ter: a new instrument for cloud investigations, Atmos. Res.,
Atmos. Chem. Phys., 18, 17191–17206, 2018 www.atmos-chem-phys.net/18/17191/2018/G. Lloyd et al.: In situ measurements of cloud microphysical and aerosol properties 17205 Chem. Phys., 14, 1277–1297, https://doi.org/10.5194/acp-14- C. R., and Lachlan-Cope, T.: Observations and comparisons of 1277-2014, 2014. cloud microphysical properties in spring and summertime Arc- Hoose, C. and Möhler, O.: Heterogeneous ice nucleation tic stratocumulus clouds during the ACCACIA campaign, At- on atmospheric aerosols: a review of results from labo- mos. Chem. Phys., 15, 3719–3737, https://doi.org/10.5194/acp- ratory experiments, Atmos. Chem. Phys., 12, 9817–9854, 15-3719-2015, 2015. https://doi.org/10.5194/acp-12-9817-2012, 2012. Lock, A. P.: Factors influencing cloud area at the capping inversion Jackson, R. C., McFarquhar, G. M., Korolev, A. V., Earle, M. E., for shallow cumulus clouds, Q. J. Roy. Meteor. Soc., 135, 941– Liu, P. S. K., Lawson, R. P., Brooks, S., Wolde, M., Laskin, 952, https://doi.org/10.1002/qj.424, 2009. A., and Freer, M.: The dependence of ice microphysics on McGrath, A. and Hewison, T.: Measuring the accuracy of aerosol concentration in arctic mixed-phase stratus clouds dur- MARSS - An airborne microwave radiometer, J. Atmos. ing ISDAC and M-PACE, J. Geophys. Res.-Atmos., 117, 1–20, Ocean. Tech., 18, 2003–2012, https://doi.org/10.1175/1520- https://doi.org/10.1029/2012JD017668, 2012. 0426(2001)0182.0.CO;2, 2001. Kay, J. E., Wall, C., Yettella, V., Medeiros, B., Hannay, C., Cald- Morrison, H. and Pinto, J. O.: Intercomparison of Bulk Cloud Mi- well, P., and Bitz, C.: No access global climate impacts of fix- crophysics Schemes in Mesoscale Simulations of Springtime ing the Southern Ocean shortwave radiation bias in the Commu- Arctic Mixed-Phase Stratiform Clouds, Mon. Weather Rev., 134, nity Earth System Model (CESM), J. Climate, 29, 4617–4636, 1880–1900, https://doi.org/10.1175/MWR3154.1, 2006. https://doi.org/10.1175/JCLI-D-15-0358.1, 2016. Nicholls, S., Leighton, J., and Barker, R.: A new fast response in- Klein, S. A., McCoy, R. B., Morrison, H., Ackerman, A. S., strument for measuring total water content from aircraft, J. At- Avramov, A., Boer, G. de, Chen, M., Cole, J. N. S., Del Genio, A. mos. Ocean. Tech., 7, 706–718, 1990. D., Falk, M., and others: Intercomparison of model simulations Rosenfeld, D., Lohmann, U., Raga, G. B., O’Dowd, C. D., Kul- of mixed-phase clouds observed during the ARM Mixed-Phase mala, M., Fuzzi, S., Reissell, A., and Andreae, M. O.: Flood or Arctic Cloud Experiment. I: Single-layer cloud, Q. J. Roy. Me- Drought: How Do Aerosols Affect Precipitation?, Science, 321, teor. Soc., 135, 979–1002, 2009. 1309–1313, https://doi.org/10.1126/science.1160606, 2008. Kolstad, E. W., Bracegirdle, T. J., and Seierstad, I. A.: Marine cold- Rosenberg, P. D., Dean, A. R., Williams, P. I., Dorsey, J. R., air outbreaks in the North Atlantic: temporal distribution and Minikin, A., Pickering, M. A., and Petzold, A.: Particle sizing associations with large-scale atmospheric circulation, Clim. Dy- calibration with refractive index correction for light scattering nam., 33, 187–197, 2009. optical particle counters and impacts upon PCASP and CDP data Korolev, A. V., Strapp, J. W., Isaac, G. A., and Nevzorov, A. collected during the Fennec campaign, Atmos. Meas. Tech., 5, N.: The Nevzorov airborne hot-wire LWC-TWC probe: prin- 1147–1163, https://doi.org/10.5194/amt-5-1147-2012, 2012. ciple of operation and performance characteristics, J. Atmos. Stevens, B., Vali, G., Comstock, K., Wood, R., van Zanten, M. C., Ocean.-Tech., 15, 1495–1510, https://doi.org/10.1175/1520- Austin, P. H., Bretherton, C. S., and Lenschow, D. H.: Pockets of 0426(1998)0152.0.Co;2, 1999. open cells and drizzle in marine stratocumulus, B. Am. Meteorol. Korolev, A. V., Emery, E. F., Strapp, J. W., Cober, S. G., Isaac, G. A., Soc., 86, 51–57, https://doi.org/10.1175/BAMS-86-1-51, 2005. Wasey, M., and Marcotte, D.: Small ice particles in tropospheric Terai, C. R., Bretherton, C. S., Wood, R., and Painter, G.: Aircraft clouds: fact or artifact?, B. Am. Meteorol. Soc., 92, 967–973, observations of aerosol, cloud, precipitation, and boundary layer https://doi.org/10.1175/2010BAMS3141.1, 2011. properties in pockets of open cells over the southeast Pacific, At- Lance, S., Brock, C. A., Rogers, D., and Gordon, J. A.: Wa- mos. Chem. Phys., 14, 8071–8088, https://doi.org/10.5194/acp- ter droplet calibration of the Cloud Droplet Probe (CDP) 14-8071-2014, 2014. and in-flight performance in liquid, ice and mixed-phase Verlinde, J., Harrington, J. Y., Yannuzzi, V. T., Avramov, A., Green- clouds during ARCPAC, Atmos. Meas. Tech., 3, 1683–1706, berg, S., Richardson, S. J., Bahrmann, C. P., McFarquhar, G. M., https://doi.org/10.5194/amt-3-1683-2010, 2010. Zhang, G., Johnson, N. Zhang, G., Poellot, M. R., Mather, J. H., Lance, S., Shupe, M. D., Feingold, G., Brock, C. A., Cozic, J., Hol- Turner, D. D., Eloranta, E. W., Zak, B. D., Prenni, A. J., Daniel, loway, J. S., Moore, R. H., Nenes, A., Schwarz, J. P., Spackman, J. S., Kok, G. L., Tobin, D. C., Holz, R., Sassen, K., Spangen- J. R., Froyd, K. D., Murphy, D. M., Brioude, J., Cooper, O. R., berg, D., Minnis, P., Tooman, T. P., Ivey, M. D., Richardson, S. Stohl, A., and Burkhart, J. F.: Cloud condensation nuclei as a J., Bahrmann, C. P., Shupe, M., DeMott, P. J., Heymsfield, A. J., modulator of ice processes in Arctic mixed-phase clouds, At- and Schofield, R.: The mixed-phase Arctic cloud experiment, B. mos. Chem. Phys., 11, 8003–8015, https://doi.org/10.5194/acp- Am. Meteorol. Soc., 88, 205–221, 2007. 11-8003-2011, 2011. Wood, R., Comstock, K. K., Bretherton, C. S., Cornish, C., Tom- Lawson, P. R., O’Connor, D., Zmarzly, P., Weaver, K., Baker, B., linson, J., Collins, D. R., and Fairall, C.: Open cellular structure and Mo, Q.: The 2D-S (stereo) probe: design and preliminary in marine stratocumulus sheets, J. Geophys. Res.-Atmos., 113, tests of a new airborne high-speed, high resolution particle imag- 1–16, https://doi.org/10.1029/2007JD009371, 2008. ine probe, J. Atmos. Ocean. Tech., 23, 1462–1477, 2006. Wood, R., Bretherton, C. S., Leon, D., Clarke, A. D., Zuidema, Liu, X., Xie, S., Boyle, J., Klein, S. A., Shi, X., Wang, Z., Lin, W., P., Allen, G., and Coe, H.: An aircraft case study of the spa- Ghan, S. J., Earle, M., Liu, P. S. K., and Zelenyuk, A.: Testing tial transition from closed to open mesoscale cellular convection cloud microphysics parameterizations in NCAR CAM5 with IS- over the Southeast Pacific, Atmos. Chem. Phys., 11, 2341–2370, DAC and M-PACE observations, J. Geophys. Res.-Atmos., 116, https://doi.org/10.5194/acp-11-2341-2011, 2011a. 1–18, https://doi.org/10.1029/2011JD015889, 2011. Wood, R., Mechoso, C. R., Bretherton, C. S., Weller, R. A., Huebert, Lloyd, G., Choularton, T. W., Bower, K. N., Crosier, J., Jones, H., B., Straneo, F., Albrecht, B. A., Coe, H., Allen, G., Vaughan, G., Dorsey, J. R., Gallagher, M. W., Connolly, P., Kirchgaessner, A. Daum, P., Fairall, C., Chand, D., Gallardo Klenner, L., Garreaud, www.atmos-chem-phys.net/18/17191/2018/ Atmos. Chem. Phys., 18, 17191–17206, 2018
You can also read