Dust radiative forcing and its impact on surface energy budget over West Africa - Nature
←
→
Page content transcription
If your browser does not render page correctly, please read the page content below
www.nature.com/scientificreports
OPEN Dust radiative forcing and its
impact on surface energy budget
over West Africa
Abdoul Aziz Saidou Chaibou, Xiaoyan Ma* & Tong Sha
Dust is the dominant aerosol type over West Africa (WA), and therefore accurate simulation of dust
impact is critical for better prediction of weather and climate change. The dust radiative forcing (DRF)
is estimated using two sets of experiments in this study: one without and the other with dust aerosol
and its feedbacks with the Weather Research and Forecasting with Chemistry model (WRF-Chem).
Results show that DRF presents a net warming effect at the top-of-atmosphere (TOA) and in the
atmosphere (ATM), and cooling at the surface (SFC). The net DRF over WA is estimated to be 9 W/m2
at the TOA, 23 W/m2 in the ATM, and − 13 W/m2 at the SFC. Furthermore, dust-induced a reduction of
sensible heat up to 24 W/m2 and SFC temperature up to 2 °C cooling over WA, an increase of latent
heat up to 12 W/m2 over Sahara, a decrease up to 24 W/m2 over the vegetated surfaces and an increase
in the surface energy balance up to 12 W/m2 over WA. The presence of dust significantly influences the
surface energy budget over WA, suggesting that dust effects should be considered in more climate
studies to improve the accuracy of climate predictions.
Aerosols play a vital role in the climate system and have been among the major uncertainties in predictions of
future climate change1. West Africa (WA) is one of the most vulnerable regions to climate change, with the Sahara
desert as the major source of dust aerosols in the w orld2–5. The vulnerability is higher in the Sahel region, which
has experienced a long period of drought in the late 1960s and 1980s. Numerous studies have pointed out that
dust loading over the Sahel has increased significantly between the 1960s and 1980s, and is the consequence of
drying of the region6–13. Since the 1990s, better rainfall conditions appear to occur in the Sahel region14–16. On
this basis, a comprehensive investigation of dust impact on climate variability and drought in WA is essential,
where the economy depends mostly on rainfed agriculture and transhumant l ivestock11,15,17–19. To improve our
understanding, the scientific community has launched several field campaigns, such as SaHAran Dust Experi-
ments (SHADE)20, SAharan Mineral dUst experiMent (SAMUM)21, African Monsoon Multidisciplinary Analysis
(AMMA)22, etc.
Dust aerosols emitted from the Sahara and Sahel are considerably higher than any other desert in the world.
The surface wind speed is the primary controlling factor of the emission and transport of dust particles into the
atmosphere to great distances by convective events that develop actively in the d esert2,3,5,23,24. More than half of
dust deposited in the oceans comes from elsewhere in North Africa. Saharan dust contains nutrients that fertilize
soils and water, block or reflect sunlight, affect the formation of clouds and c yclones25–27. Interactions of dust
particles with radiation in the troposphere (absorption, scattering, etc.) are the basis in changing atmospheric
state parameters, which may induce significant changes in climate. Dust aerosols influence many processes
that modulate regional climate. Firstly, they exert a direct effect either through scattering or absorption of solar
radiation that leads to a warming or cooling of the atmospheric layers in the case of absorption or reflection,
respectively28. Secondly, the absorbing particles via a semi-direct effect inhibit cloud formation by diminish-
ing the adiabatic cooling of the atmosphere because absorbing particles heat the cloud layer and cause cloud
evaporation29,30. Finally, dust particles may cause indirect effects by altering cloud microphysics and precipitation
acting as cloud condensation nuclei31,32. Therefore, to adequately predict dust impact on weather and climate
Key Laboratory of Meteorological Disaster, Ministry of Education (KLME), International Joint Laboratory on
Climate and Environment Change (ILCEC), Key Laboratory for Aerosol‑Cloud‑Precipitation of China Meteorological
Administration, School of Atmospheric Physics, Collaborative Innovation Centre on Forecast and Evaluation of
Meteorological Disasters, Nanjing University of Information Science and Technology, Nanjing 210044, Jiangsu,
China. *email: xma@nuist.edu.cn
Scientific Reports | (2020) 10:12236 | https://doi.org/10.1038/s41598-020-69223-4 1
Vol.:(0123456789)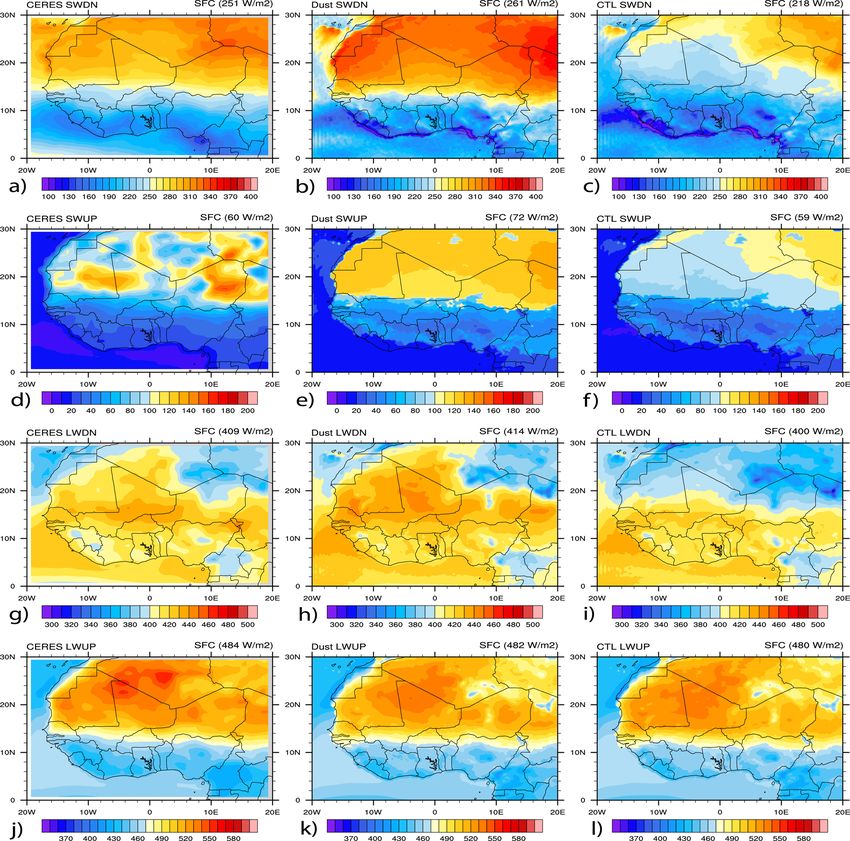
www.nature.com/scientificreports/
Figure 1. Model domain with the location of countries included in the study area superimposed on the surface
elevation topography (m). The Atmospheric Radiation Measurements (ARM) mobile facility observation site in
Niamey (2° E, 13° N) is indicated in red color.
radiative heating and cooling effects, these particles must be considered since dust aerosols alter the dynamics
and thermodynamics of the a tmosphere33.
Saharan dust storms have often been observed from space by remote sensing. Still, the total impact on the
Earth’s radiative budget has been challenging to assess due to the limited number of observations made from the
surface, mainly in W A34–36. Improved assessment of dust impact on climate requires continuous observations
from both satellites, and ground-based instrument n etworks37,38. However, satellite observations and ground-
based measurements alone would not be sufficient to fully describe the spatiotemporal variability, heterogeneity,
and different spectral behavior of dust aerosols. Therefore, the use of climate models becomes crucial to improve
our understanding of dust distribution and its physical, chemical, and optical properties. Also, climate models
have been used to study the effect of dust on radiation b udgets39–51. Because of their sensitivity to different forc-
ing, climate models still struggle in replicating observations52–54.
Given that, it is essential to continue improving the reliability of climate models to allow for a better assess-
ment of dust impact on climate. Due to the very high dust burden frequently occurring during the year, WA
is an ideal region to investigate the radiative forcing of aerosols55,56. This study uses the WRF-Chem model to
examine the impact of dust aerosol on the radiation and surface energy budget over WA.
Materials and methods
Model description and experiments. We used version 4.0.2 of the Weather Research and Forecasting
Model coupled with chemistry (WRF-Chem) to simulate dust impact on the radiation fluxes over the model
domain presented in Fig. 1. WRF-Chem has been used in several studies to simulate processes such as the emis-
sion, transportation, deposition, vertical mixing, and chemical transformation of trace gases, aerosol interac-
tions, photolysis, and radiation with meteorology51,55–63. In this study, WRF-Chem implements the Goddard
Global Ozone Chemistry Aerosol Radiation and Transport (GOCART) dust scheme, which includes the emis-
sion, advection, and d eposition64,65. The GOCART dust emission scheme is run in its default configuration in the
version of the WRF-Chem model used in the present study. The simulation domain (0°–30° N and 20° W–20°
E) covers WA at a resolution of 30 km and 51 vertical levels. The meteorological data used for initial and lateral
boundary conditions was re-analysis data from the National Environmental Prediction Center (NCEP) available
every 6 h at a spatial resolution of 1° × 1°.
The main physical and chemical parameterizations are summarized in Table 1. The microphysical scheme66
that includes ice, snow and graupel processes, was used for cloud physics. The Rapid Radiative Transfer Model for
General Circulation Models (RRTMG) scheme67 used for both Longwave (LW) and Shortwave (SW) radiations
includes the Monte Carlo Independent Column Approximation (MCICA) method of random cloud o verlap68.
The planetary boundary layer is chosen by the non-local K scheme of Yonsei University with an explicit training
layer and a parabolic K profile in an unstable mixing layer. This scheme includes a topographic correction for
surface winds to represent additional drag due to sub-grid topography and increased flow at the top of a hill69 and
an option for descending mixture driven by radiative cooling. The cumulus parameter setting o ption70,71 chosen
is Grell 3D, an improved version of the GD scheme. Noah’s land surface model with four-layer temperature and
soil moisture, split snow cover, and frozen soil physics was selected72. Finally, the Monin–Obukhov-based MM5
similarity scheme with the Carslon-Boland viscous underlayer and the standard similarity functions from the
look-up tables was used73–77.
In most desert areas, dust comes from sediments and alluvial deposits found in depressions, sedimentary
basins, and ancient valleys. In the WRF-Chem model, dust source function is represented by the availability of
loose erodible soil m aterial78,79, and dust emission is computed as a function of wind energy, soil moisture, and
particle size. A similar empirical formula developed80 is used to calculate the dust emission flux F in the model
following expression:
Scientific Reports | (2020) 10:12236 | https://doi.org/10.1038/s41598-020-69223-4 2
Vol:.(1234567890)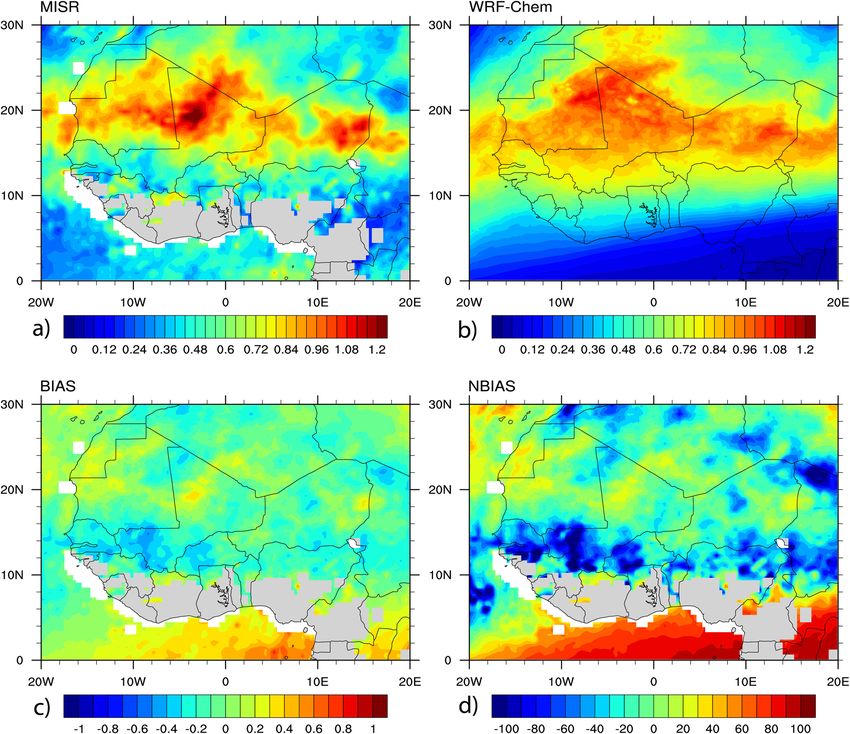
www.nature.com/scientificreports/
Microphysics Lin et al. (1983) scheme
Longwave radiation Rapid radiative transfer model (RRTMG)
Shortwave radiation Rapid radiative transfer model (RRTMG)
Surface layer MM5 similarity scheme
Land surface Unified Noah land surface model
Planetary boundary layer Yonsei University scheme
Cumulus parameterization Grell 3D Ensemble scheme
Meteorology initial and boundary conditions National Environmental Prediction Center (NCEP)
Horizontal resolution 30 (km)
Vertical levels 51
Time step Adaptive time stepping always below 180 s
Goddard Global Ozone Chemistry Aerosol Radiation and Transport (GOCART) simple
Chemistry
aerosol scheme
Dust Emission Include GOCART
Table 1. Physical and chemical modeling options used.
CSsp u210m (u10m − ut ), if u10m > ut
F=
0, otherwise (1)
where C is a dimensional factor equal to 1 µgs2 m−5, S is the source f unction64. u10m is the horizontal wind speed
at 10 m, u t is the threshold 10 m wind velocity for initiating erosion, and s p is the mass fraction of each particle
size group which are between 0.1 and 6 μm. The threshold velocity for dust production is the most important
parameter of the formula due to its dependence on the effects of vegetation residue, soil roughness, soil texture,
and the effect of atmospheric precipitation80.
Dust particles in the model are distributed into five discrete size bins with an effective radius of 0.5, 1.4, 2.4,
4.5, and 8.0 μm. The emission within each bin is injected to the lowest model level, the chemical module com-
putes the dispersion, and separate schemes estimate dust mass concentrations for transport and removal from
the atmosphere78. The optical properties are computed as wavelength-dependent at four wavelengths (300, 400,
600, 999 nm) for shortwave radiation and 16 wavelengths for longwave radiation using Mie theory81 (i.e., the
aerosol optical depth (AOD), the single scattering albedo (SSA), the asymmetry parameter (g)). The Mie theory
assumes dust particles as perfect spheres and internally mixed in each size bins. This spherical approximation may
result in model b ias82–84 and inaccurate estimation of the scattering phase function for dust particles, important
for remote sensing applications, however, the impact is insignificant on the radiative flux divergence that rep-
resents the climate f orcing39,85. The dust refractive index is considered to be wavelength-dependent for SW and
LW spectral bands. The refractive indices are calculated by volume averaging for each aerosol size bin. Angstrom
exponent relationship could be used to convert wavelengths needed between the wavelengths mentioned above.
Though the model outputs the extinction coefficient at 550 nm, and here AOD is calculated by integrating the
extinction coefficient over the whole atmospheric column using Eq. 2:
nlev
nlev
AOD = EXT i ∗ Dzi = AODi (2)
i=0 i=0
where EXTi is the extinction of the layer, and Dzi is the path of the level layer.
We ran simulations between May 22, 2006, and August 31, 2006, with the first ten days as a spin-up time
that is not included in the analysis, and an adaptive time-stepping always below 180 s was used for numerical
stability. The study period was chosen for the reason that Saharan aerosols predominate during summer months
when dust events are associated with intense convective events such as squall lines that develop over W A3,86,87. We
performed two sets of experiments, one without and the other with dust aerosol and its feedbacks. The first set of
the experiment does not include dust aerosol and is considered as the control run (CTL) in which the chemistry
was set to zero. The second set of the experiment (dust simulation) simulates the dust aerosol, and dust radiation
feedback is turned on to consider the semi-direct effect (e.g., changes in clouds induced by radiative forcing).
The difference between dust and CTL experiment allows us to examine the dust impact on radiation. Other
parameterizations consist of convective transport of aerosols based on the Grell convection scheme70,71, vertical
turbulent mixing based on non-local boundary layer vertical diffusion of Yonsei U niversity69, and dry deposition
88
from gravitational settling and surface d eposition . The sea surface temperature was updated in the simulations
using data downloaded from NOAA/NCEP server (ftp://polar. ncep.noaa.gov/pub/histor y/sst/). Biomass burning
emissions and indirect effects of dust were not taken into account in the simulation. However, indirect effects
can be considered to be as significant as the direct effect and will be addressed in our future investigations. In
all simulations, the same physical parameterizations were used. The effects of unresolved clouds are included in
SW and photolysis schemes.
Determination of radiation fluxes. The direct radiative forcing of aerosols is defined as the change
in radiative flux due to its scattering and absorption by aerosols (including any feedbacks and natural pro-
Scientific Reports | (2020) 10:12236 | https://doi.org/10.1038/s41598-020-69223-4 3
Vol.:(0123456789)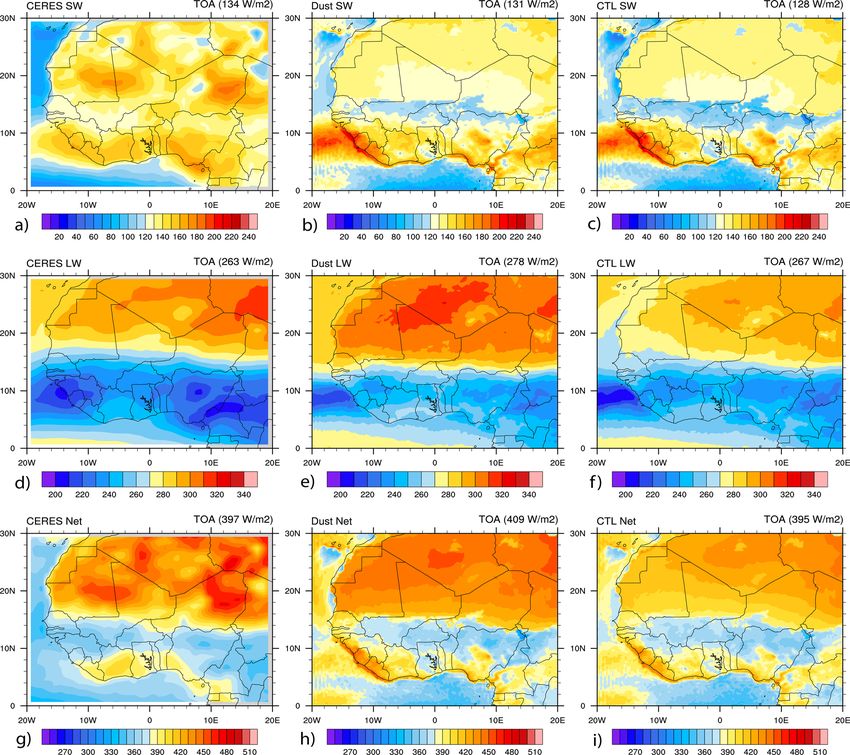
www.nature.com/scientificreports/
cesses)33,50,89. In general, the radiative forcing is estimated at the surface (SFC), at the top-of-atmosphere (TOA)
and in the atmosphere (ATM). In the present work, the radiative forcing of dust (DRF) is calculated by the dif-
ference between the net (downward minus upward) radiative fluxes (irradiance) with and without dust in the
model over the study area, according to the following formula33,90,91:
↓ ↓ ↑ ↑
F = FDUST − FCTL − FDUST − FCTL (3)
where ΔF (W/m2) is the net radiation, F DUST and FCTL are irradiances with and without dust in the model, ↓ ↑
indicates the direction of the irradiances downwards and upwards, respectively.Different surface energy flows
provided by the model are used to calculate total surface fluxes over the study area. The energy balance at the
surface is more complicated than that at the TOA because the energy flows by conduction and convection of
heat and moisture through turbulent fluid motion must be considered in addition to the r adiation92. The surface
energy balance is composed of four main terms: net radiation, sensible heat flux, latent heat flux, and ground
heat flux, given here by the surface energy budget (Q) e quation93,94:
Q = LW ↓ − LW ↑ + (1 − A) ∗ SW ↓ − (SH + LH + GH) (4)
Q is positive as a gain of energy and negative when loss. LW and SW are longwave and shortwave radiation
fluxes. A (surface albedo) is a fraction of the incoming solar radiation reflected upward from the Earth’s surface.
GH (Ground Heat flux) is the energy loss through the lower boundary by heat conduction92,93. SH (Sensible Heat
flux) and LH (Latent Heat flux) are positive upward, and represent the energy loss from the Earth’s surface to the
atmosphere associated with heat transfer and evaporation, respectively94. All these radiation fluxes are in W/m2
and positive quantities93. The estimation of dust impact is obtained in terms of anomalies, defined for surface
energy fluxes and temperature, by the difference between the dust and CTL simulation.
Observational data. Before investigating dust impact on radiation, the model’s ability to reproduce the
spatial and temporal patterns were assessed with several sources of datasets over the study region. Toward this
purpose, we combined data from the Multi-angle Imaging SpectroRadiometer (MISR), Atmospheric Radiation
Measurements (ARM) mobile facility field campaign in Niamey Niger, and the Clouds and the Earth’s Radiant
Energy System (CERES) to assess the model outputs.
The first data used is AOD from the MISR instrument onboard the NASA Terra platform. MISR was launched
in 2000 and observes continuously at nine distinct zenith angles, ranging from 70° afterward to 70° forward, and
in four spectral bands 446, 558, 672 and 866 nm (blue, green, red, and near-infrared) and nine cameras at dif-
ferent angles. The Angstrom relationship is used to calculate AOD and SSA at 550 nm between 446 and 558 nm,
for conformity with model results. The unique blend of directional and spectral data of MISR allows aerosol
retrieval algorithms that do not depend on explicit radiometric surface properties to be u sed95. As such, MISR
eserts95,96.
can retrieve aerosol properties over a variety of terrain, including bright surfaces like d
The second data used are AOD, SSA, surface radiation fluxes and temperature from the ARM mobile facility
field campaign in Niamey Niger in 2006, funded by the U.S. Department of Energy’s Office of Science, to provide
key information for the AMMA project. The ARM mobile facility stationed at the Niamey airport (2°E, 13°N)
and is equipped with fully active and passive instruments provides a wide range of atmospheric m easurements97.
The AOD is available at seven wavelengths 340, 380, 440, 500, 675, 870, 1,020 nm, and SSA at three wavelengths
467, 550, 660 nm. Here, AOD level 1 at 550 nm is also calculated using the Angstrom exponent between 500
and 675 nm, for consistency with the modeled one. The surface radiative flux measurements are SW and LW
downwelling and upwelling components from broadband radiometers. Other parameters are temperature, SH,
and LH measurements of the turbulent fluxes made using an eddy correlation measurement technique.
The last of the data used are measurements from the CERES instruments. CERES is a National Aeronaut-
ics and Space Administration (NASA) satellite project dedicated to observing the Earth’s TOA global energy
budget and estimate SFC and within ATM radiation b udgets98. CERES instruments fly on the Terra, Aqua,
Suomi National Polar-Orbiting Partnership (SNPP), and NOAA-20 satellites. Terra is in a descending sun-
synchronous orbit with an equator-crossing time of 10:30 local time, while Aqua, SNPP, and NOAA-20 are in
ascending sun-synchronous orbits with a 13:30 local time equator-crossing t ime99,100. Each CERES instrument
measures filtered radiances in the SW (between 0.3 and 5 µm), total (between 0.3 and 200 µm), and window
(between 8 and 12 µm) regions (CERES on NOAA-20 replaces the window channel with a LW channel)99,100.
The CERES_EBAF_Ed4.1 product monthly and climatological averages of observed TOA and computed SFC
all-sky fluxes are used in this study.
Results and discussion
Aerosol optical properties. AOD is a commonly used parameter to assess model outputs with obser-
vations. It is also available as a satellite standard product, and a frequently measured variable in the field
experiments101. Figure 2 shows the spatial distribution of AOD at 550 nm derived from MISR (Fig. 2a) and
WRF-Chem (Fig. 2b), and their bias (Fig. 2c) and normalized bias (Fig. 2d) averaged over June–July–August
2006. The model results are sampled at the same overpass time as Terra for comparison purposes. The MISR and
model present a similar spatial distribution of AOD. Maximum values from MISR are observed over the Saharan
Heat Low (SHL) region (Mauritania, Mali and Algeria, 12° W to 2° E, 15° to 27° N), which plays a vital role in
the WA monsoon s ystem102–105. A higher peak is also observed in the lee of Aïr and Adrar Mountains in Niger
(2° to 10° E, 16° to 24° N) and the Bodélé Depression (border of Niger-Chad, 14° to 24° E, 14° to 20° N), which is
the main source of dust in northern Lake Chad106. The model shows the same areas of maximum AOD observed
Scientific Reports | (2020) 10:12236 | https://doi.org/10.1038/s41598-020-69223-4 4
Vol:.(1234567890)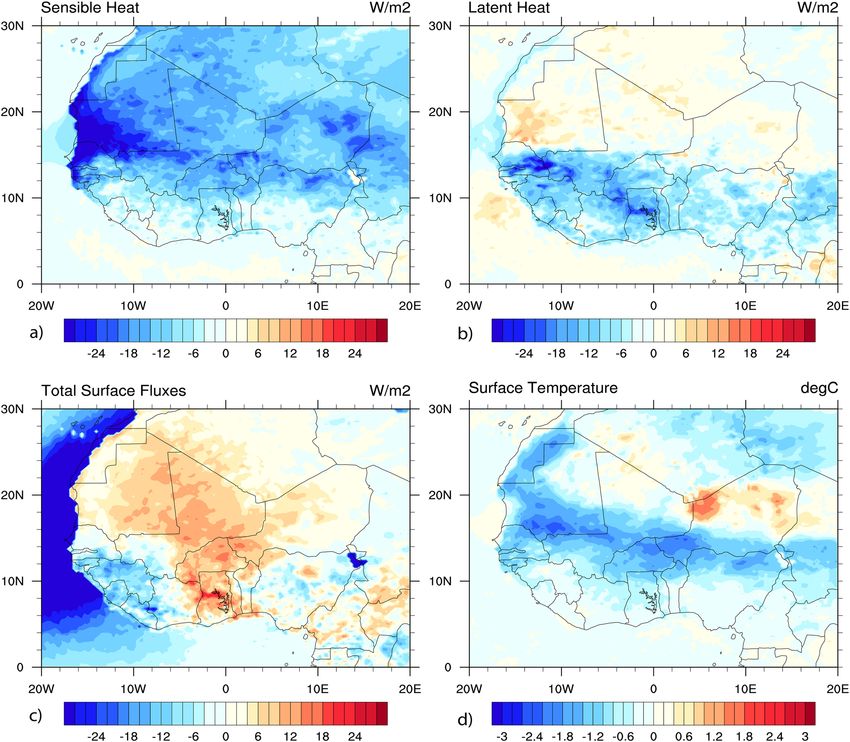
www.nature.com/scientificreports/

                            Figure 2.  Spatial distribution of AOD averaged over June–July–August 2006 at 550 nm. Results are shown for:
                            (a) MISR, (b) WRF-Chem, (c) bias between MISR and WRF-Chem, (d) normalized bias between MISR and
                            WRF-Chem in %. The model AOD is sampled at the same overpass time as Terra (10:30). The gray-blank area in
                            the plots is due to missing values.

                            from MISR. However, it over predicts these values mainly in the southern part of WA below 10° N, indicated by
                            the calculated bias and normalized bias. This could be attributed to the model settings, such as the calculation
                            of the threshold wind speed in the scheme, dust emission scheme, model configuration, lateral meteorological
                            conditions, and surface properties. Our experiment missed the indirect effects of dust, which could also affect
                            the simulated results in replicating the observation and radiative properties. The model is in good agreement
                            with MISR in reproducing the spatial distribution of AOD.
                                Figure 3 presents the linear least squares regression analysis results of AOD and SSA at 550 nm between
                            MISR and WRF-Chem simulation over the study area using a 95% prediction interval pixel to pixel comparison
                            of the two datasets. Generally, the two datasets agree reasonably for both AOD (Fig. 3a) and SSA (Fig. 3b). Cor-
                            relation coefficients of 0.7 and 0.6 were reported between the two datasets for both AOD and SSA, respectively,
                            indicating a positive linear relationship. The normalized bias and root mean square error noted a satisfactory
                            agreement between MISR and WRF-Chem. A normalized bias and normalized root mean square error of − 4%
                            and 35% were calculated between the two datasets for AOD. For the SSA, the two datasets recorded the value
                            of 7% for the normalized bias, and 8% for the normalized root mean square error. Figure 4 shows the temporal
                            distribution of AOD and SSA at 550 nm from ARM and WRF-Chem simulation at the Niamey station. The ARM
                            station in Niamey is shown in Fig. 1 in red color. The MISR AOD and SSA are not shown due to its inadequate
                            temporal coverage at the Niamey station. The ARM AOD and SSA were not available for June and July 2006, the
                            month of August 2006 is plotted here. The ARM and WRF-Chem show similar temporal patterns of AOD with
                            period averages of 0.6 and 0.7, respectively (Fig. 4a). However, WRF-Chem underestimated the observed peaks
                            mainly on 4th and 18th August 2006. The model underestimation could be associated with the calculation of

Scientific Reports |   (2020) 10:12236 |              https://doi.org/10.1038/s41598-020-69223-4                                          5

                                                                                                                                     Vol.:(0123456789)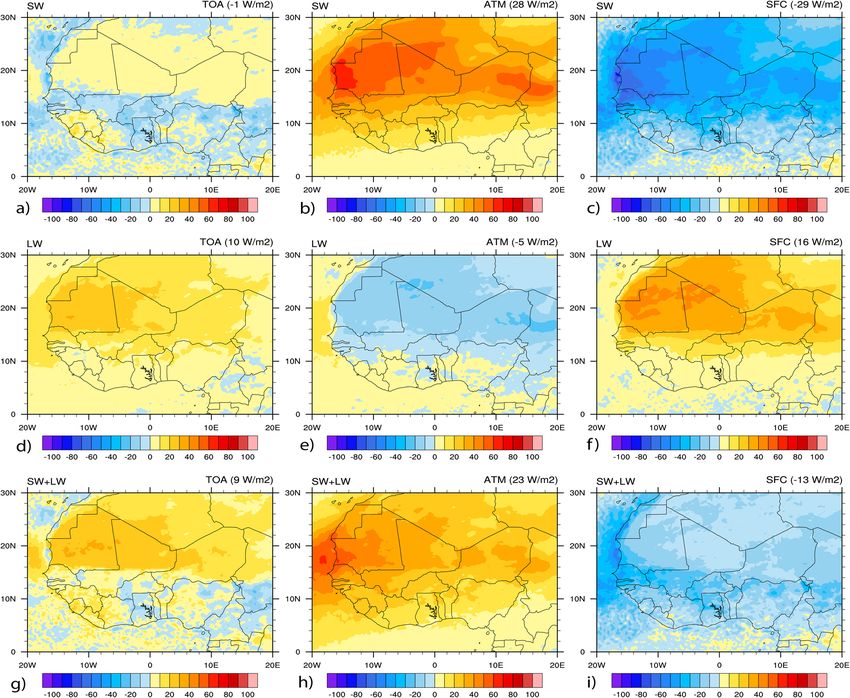
www.nature.com/scientificreports/
Figure 3. Agreement between MISR observation and WRF-Chem simulation. The plot shows the number of
matched data points (circles), the regression line (solid magenta lines), and the error bounds (dashed red lines)
of the regression, correlation coefficients, normalized bias, and root mean square error. Results are shown for:
(a) AOD and (b) SSA, pixel to pixel comparison over WA.
the threshold wind speed because the magnitude of dust emissions to the atmosphere depends on the surface
wind speed and soil features. The simulated SSA values show an agreement with the observed ones from ARM
with period averages of 0.86 and 0.84, respectively (Fig. 4b). A similar study during 6–10 January 2006 showed
that the simulated SSA ranges between 0.86 and 0.94 since the mineral dust complex index is very u ncertain45.
Diurnal cycles of radiation fluxes. A frequently faced challenge in assessing the simulated diurnal cycles
of surface energy fluxes is the lack of observations made from the surface to which models can be c ompared107.
Figure 5 presents the evaluation of diurnal cycles of radiation fluxes and temperature between WRF-Chem and
ARM observations at the Niamey site (13° N, 2° E). Table 2 summarizes the estimated metrics between ARM
and WRF-Chem. The mean diurnal cycle in the SFC SH and LH heating is presented in Fig. 5a. The GH flux
is not available from ARM observations at the Niamey site. The results show that simulated SH and LH agree
well with observations from ARM, indicating similar variation with a peak at noon. However, results from dust
simulation perform better with observations. For SH fluxes, normalized biases of 13% and − 8% and normalized
root mean square errors of 20% and 33% were calculated for both dust and CTL simulations, respectively. For
LH fluxes, normalized biases of − 3% and − 19% and normalized root mean square errors of 24% and 39% were
reported for both dust and CTL simulations, respectively. Similar results were reported in Fig. 5b for the SFC SW
spectrum radiations. The simulated SW downwelling and upwelling show better agreement with observations
when dust aerosol in the model is considered. The reported metrics values between model and observations were
normalized biases of 10% and 25%, and normalized root mean square errors of 25% and 42% for both dust and
CTL simulations of SW downwelling spectrum radiation, respectively. In the SW upwelling spectrum radiation,
normalized biases of 4% and − 14% and normalized root mean square errors of 24% and 35% were calculated for
both dust and CTL simulations, respectively.
In the same way, as for SW spectrum radiations, LW spectrum radiations also were better simulated in
the dust simulation compared to observations, as indicated in Fig. 5c. A satisfactory agreement between observa-
tions and model were reported for both dust and CTL simulations of LW downwelling and upwelling spectrum
radiations. The estimated normalized bias and normalized root mean square error were of − 1% and 1% in the
LW downwelling spectrum radiation for both dust and CTL simulations, respectively. Meanwhile, a normalized
bias and root mean square error of − 3% and 3% were also estimated in the LW upwelling spectrum radiation for
both dust and CTL simulations, respectively. Similarly, the SFC and 2-m temperatures were also well simulated
compared to the observation made by ARM shown in Fig. 5d. However, the 2-m temperature better performs
Scientific Reports | (2020) 10:12236 | https://doi.org/10.1038/s41598-020-69223-4 6
Vol:.(1234567890)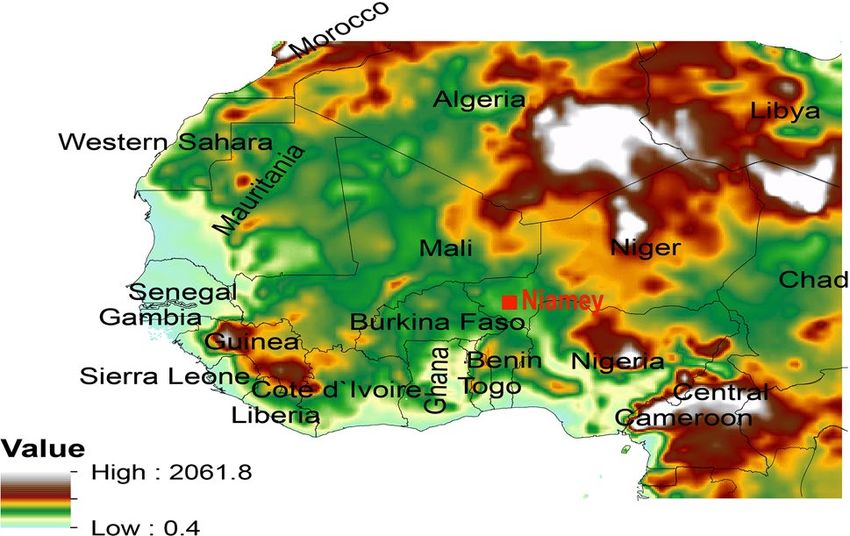
www.nature.com/scientificreports/

                            Figure 4.  Daily AOD and SSA during August 2006 at 550 nm from ARM Facility Mobile observation at the
                            Niamey, and WRF-Chem simulation. Results are shown for: (a) AOD from ARM in black polygon square and
                            WRF-Chem in red line, (b) SSA from ARM in black polygon square, and WRF-Chem in red line. The ARM
                            station in Niamey is indicated in Fig. 1 in red color.

                            Figure 5.  Mean diurnal cycle of SFC fluxes (in W/m2) and temperature (K) from ARM Facility Mobile
                            observation at the Niamey site (13 N, 2E) and WRF-Chem simulations with and without dust over June–July–
                            August 2006. Results are shown for: (a) SH, LH. (b) SWDN, SWUP. (c) LWDN, LWUP. (d) SFC Temperature,
                            2m-Temperature. The ARM station in Niamey is indicated in Fig. 1 in red color.

Scientific Reports |   (2020) 10:12236 |             https://doi.org/10.1038/s41598-020-69223-4                                        7

                                                                                                                                Vol.:(0123456789)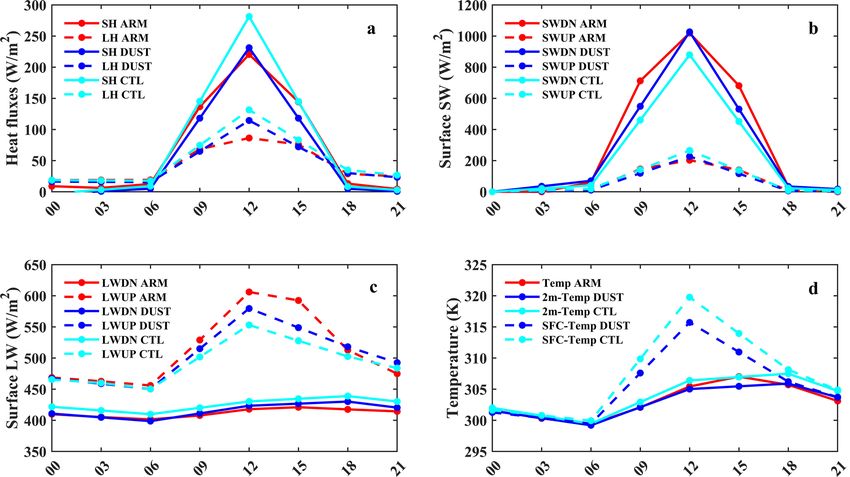
www.nature.com/scientificreports/

                                                           Normalized bias (%)   Normalized root mean square error (%)
                                       ARM sensible heat
                                       DUST                13                    20
                                       CTL                 −8                    33
                                       ARM latent heat
                                       DUST                −3                    24
                                       CTL                 − 19                  39
                                       ARM SW down
                                       DUST                10                    25
                                       CTL                 25                    42
                                       ARM SW up
                                       DUST                 4                    24
                                       CTL                 − 14                  35
                                       ARM LW down
                                       DUST                −1                    1
                                       CTL                 −3                    3
                                       ARM LW up
                                       DUST                 2                    4
                                       CTL                  4                    6
                                       ARM temperature
                                       2-m DUST             0.05                 0.2
                                       2-m CTL             − 0.25                0.3
                                       SFC DUST            − 0.8                 1.4
                                       SFC CTL             − 1.4                 2.1

                                      Table 2.  Estimation of the model’s ability to reproduce ARM observations using the normalized bias and
                                      normalized root mean square error.

                                      with ARM observation because ARM temperature is measured at 3 m. For the 2-m temperature, a better agree-
                                      ment was found from dust simulation given a normalized bias of 0.05%, and normalized root mean square
                                      error of 0.2%. In the CTL simulation, a normalized bias of − 0.25% and normalized root mean square error
                                      of 0.3% were recorded. Meanwhile, for the SFC temperature, normalized biases of − 0.8% and − 1.4% and root
                                      mean square errors of 1.4% and 2.1% were recorded in the dust and CTL simulations, respectively. The model
                                      performs well in simulating diurnal cycles of radiative fluxes and temperature, and very close to ARM observa-
                                      tions in Niamey-Niger.

                                      Spatial distribution of radiation fluxes. Figure 6 shows the comparison results of spatial distributions
                                      of SW, LW, and net (SW + LW) spectrum radiation at the TOA between CERES observations and WRF-Chem
                                      simulations averaged over the study period. Table 3 presents the mean values calculated over the study domain.
                                      Results reveal that all the simulated spectrum radiations (SW, LW, and net) show a similar pattern when com-
                                      pared to observations with maximum values over the desert regions (between 15° N and 30° N). The mean values
                                      of SW spectrum radiation over the study domain were estimated to be 134 W/m2 for CERES (Fig. 6a), 131 W/m2
                                      in the dust simulation (Fig. 6b), and 128 W/m2 in the CTL simulation (Fig. 6c). In the LW spectrum radiation,
                                      the mean values reported were estimated to be 263 W/m2 for CERES (Fig. 6d), 278 W/m2 in the dust simulation
                                      (Fig. 6e), and 267 W/m2 in the CTL simulation (Fig. 6f). The mean values in the net spectrum radiations were
                                      calculated to be 397 W/m2 for CERES (Fig. 6g), 409 W/m2 in the dust simulation (Fig. 6h), and 395 W/m2 in
                                      the CTL simulation (Fig. 6i). The SW spectrum radiation was better simulated in the dust simulation in terms
                                      of both area mean and spatial configuration. But LW and net spectrum radiations were better reproduced in
                                      dust simulations in terms of spatial pattern while in CTL simulations in terms of the area mean nearer to ARM
                                      observations.
                                          Figure 7, the same as Fig. 6 but for downwelling, upwelling, and net radiation fluxes at the surface. Table 4
                                      contains the means calculated for all spectrum radiations. Similarly, the results show that the model better
                                      performs in dust simulations for all spectrum radiations in terms of spatial patterns and mean values, except in
                                      SW upwelling spectrum radiation, where the CTL simulation shows better in terms of the mean value. In the
                                      SW downwelling spectrum radiation, mean values were estimated to be 251 W/m2 for CERES (Fig. 7a), 261 W/
                                      m2 in the dust simulation (Fig. 7b), and 218 W/m2 in the CTL simulation (Fig. 7c). The reported mean values
                                      in the SW upwelling spectrum radiations were 60 W/m2 for CERES (Fig. 7d), 72 W/m2 in the dust simulation
                                      (Fig. 7e), and 59 W/m2 in the CTL simulation (Fig. 7f). In contrast, for the LW downwelling spectrum radia-
                                      tions, the mean values were estimated to be 409 W/m2 for CERES (Fig. 7g), 414 W/m2 in the dust simulation
                                      (Fig. 7h), and 400 W/m2 in the CTL simulation (Fig. 7i). In the LW upwelling spectrum radiations, the mean

          Scientific Reports |   (2020) 10:12236 |                  https://doi.org/10.1038/s41598-020-69223-4                                       8

Vol:.(1234567890)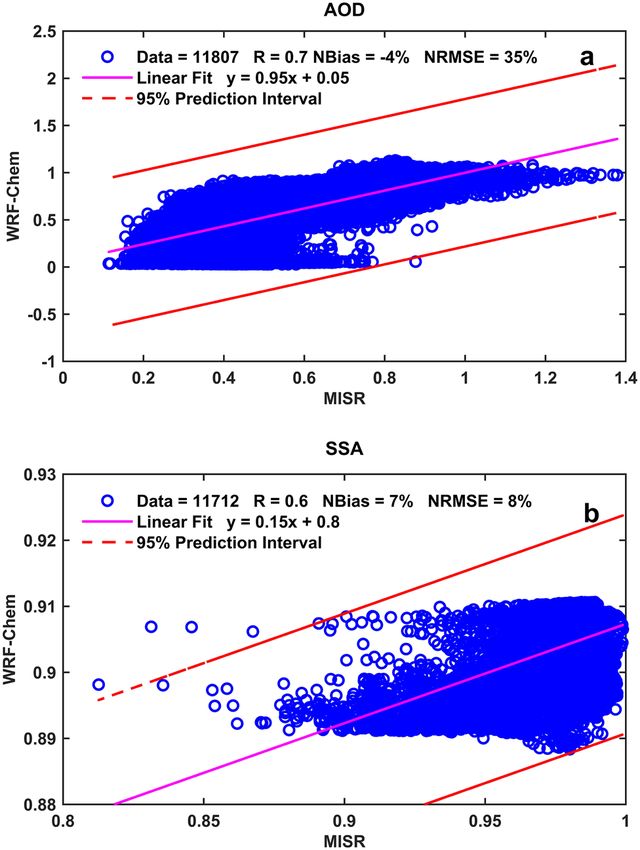
www.nature.com/scientificreports/

                            Figure 6.  Spatial distributions of radiation fluxes at the TOA (in W/m2) from CERES and WRF-Chem with
                            and without dust averaged over June–July–August 2006. Results are shown for: (a) SW from CERES, (b) SW
                            from WRF-Chem dust, (c) SW from WRF-Chem CTL, (d) LW from CERES, (e) LW from WRF-Chem dust, (f)
                            SW + LW from WRF-Chem CTL, (g) SW + LW from CERES, (h) SW + LW from WRF-Chem dust, (i) SW + LW
                            from WRF-Chem CTL.

                                      TOA
                                      SW    LW     SW + LW
                             CERES    134   263    397
                             DUST     131   278    409
                             CTL      128   267    395

                            Table 3.  Radiation fluxes at the TOA (W/m2) from CERES and CTL and dust simulations averaged over June–
                            July–August 2006.

                            values were reported to be 484 W/m2 for CERES (Fig. 7j), 482 W/m2 in the dust simulation (Fig. 7k), and 480 W/
                            m2 in the CTL simulation (Fig. 7l).
                               Figure 8 the same as Fig. 6 but for the net spectrum radiations (net SW, net LW, and net (SW + LW)) at the
                            SFC. The results highlight that the model performs well in simulating the net spectrum radiations compared
                            to CERES observations. Therefore, the dust simulation presents better agreement with observations than the

Scientific Reports |   (2020) 10:12236 |             https://doi.org/10.1038/s41598-020-69223-4                                         9

                                                                                                                                   Vol.:(0123456789)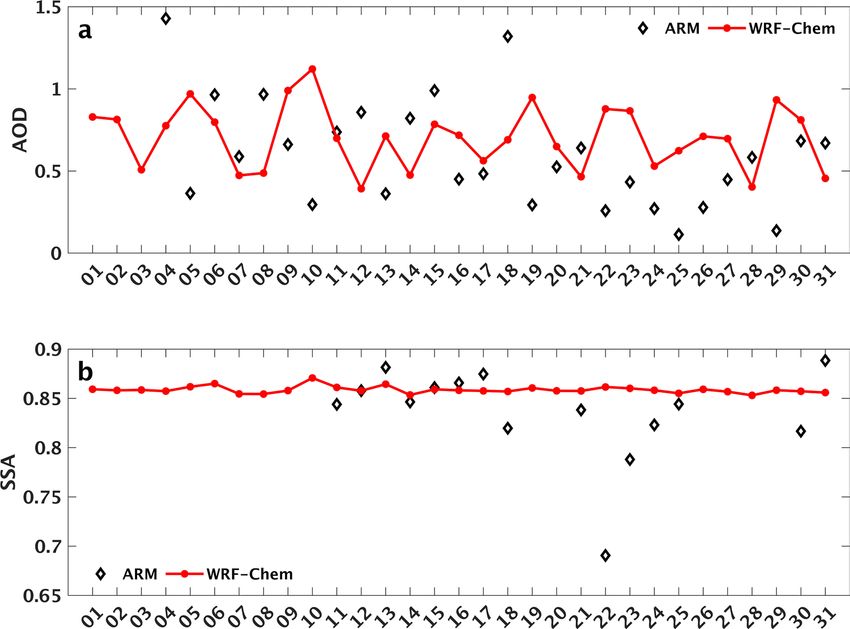
www.nature.com/scientificreports/
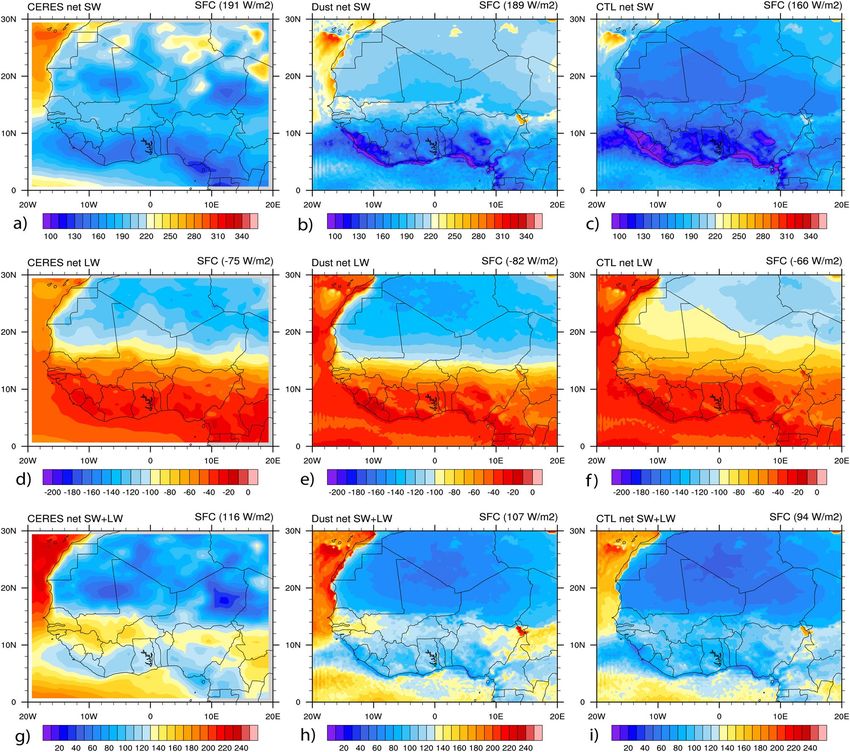
Figure 7. Spatial distributions of radiation fluxes at the SFC (in W/m2) from CERES and WRF-Chem with and
without dust averaged over June–July–August 2006. Results are shown for: (a) SW downwelling from CERES,
(b) SW downwelling from WRF-Chem dust, (c) SW downwelling from WRF-Chem CTL, (d) SW upwelling
from CERES, (e) SW upwelling from WRF-Chem dust, (f) SW upwelling from WRF-Chem CTL, (g) LW
downwelling from CERES, (h) LW downwelling from WRF-Chem dust, (i) LW downwelling from WRF-Chem
CTL, (j) LW upwelling from CERES, (k) LW upwelling from WRF-Chem dust, (l) LW upwelling from WRF-
Chem CTL.
CTL simulation in terms of spatial patterns and area means. The mean values over the study domain in the net
SW spectrum radiation were recorded to be 191 W/m2 for CERES (Fig. 8a), 189 W/m2 in the dust simulation
(Fig. 8b), and 160 W/m2 in CTL the simulation (Fig. 8c). In the net LW spectrum radiation the mean values were
reported to be − 75 W/m2 for CERES (Fig. 8d), − 82 W/m2 in the dust simulation (Fig. 8e) and − 66 W/m2 in the
CTL simulation (Fig. 8f). Similarly, in the net (SW + LW) spectrum radiation the agreement between model and
CERES for the mean values were estimated to be 116 W/m2 for CERES (Fig. 8g), 107 W/m2 in the dust simula-
tion (Fig. 8h) and 94 W/m2 in the CTL simulation (Fig. 8i). The WRF-Chem model performs very well with
CERES observations over WA.
Dust radiative forcing. DRF remains poorly quantified due to both the low station’s density over WA and
poor knowledge of the spatiotemporal variability and properties of dust aerosols89. Studies have shown that dust
Scientific Reports | (2020) 10:12236 | https://doi.org/10.1038/s41598-020-69223-4 10
Vol:.(1234567890)www.nature.com/scientificreports/
SFC
CERES DUST CTL
SWDN 251 261 218
SWUP 60 72 59
LWDN 409 414 400
LWUP 484 482 480
NETSW 191 189 160
NETLW − 75 − 82 − 66
NET(SW + LW) 116 107 94
Table 4. Radiation fluxes at the SFC (W/m2) from CERES and CTL and dust simulations averaged over June–
July–August 2006.
Figure 8. Spatial distribution of Net radiation fluxes at the SFC (in W/m2) from CERES and WRF-Chem with
and without dust averaged over June–July–August 2006. Results are shown for: (a) net SW from CERES, (b) net
SW from WRF-Chem dust, (c) net SW from WRF-Chem CTL, (d) net LW from CERES, (e) net LW from WRF-
Chem dust, (f) net (SW + LW) from WRF-Chem CTL, (g) net (SW + LW ) from CERES, (h) net (SW + LW) from
WRF-Chem dust, (i) net (SW + LW) from WRF-Chem CTL.
Scientific Reports | (2020) 10:12236 | https://doi.org/10.1038/s41598-020-69223-4 11
Vol.:(0123456789)www.nature.com/scientificreports/
Figure 9. Spatial distribution of DRF (in W/m2) from WRF-Chem averaged over June–July–August 2006.
Results are shown for: (a) SW at the TOA, (b) SW in the ATM, (c) SW at the SFC, (d) LW at the TOA, (e) LW in
the ATM, (f) LW at the SFC, (g) net (SW + LW) at the TOA, (h) net (SW + LW) in the ATM, (i) net (SW + LW) at
the SFC.
Figure 10. Mean DRF (in W/m2) from WRF-Chem over June–July–August 2006. Results are shown at the
TOA in red color, in the ATM in cyan color, and at the SFC in blue color.
Scientific Reports | (2020) 10:12236 | https://doi.org/10.1038/s41598-020-69223-4 12
Vol:.(1234567890)www.nature.com/scientificreports/
TOA ATM SFC
SW −1 28 − 29
LW 10 −5 16
SW + LW 9 23 − 13
Table 5. Mean values of DRF (W/m2) at the SFC, in the ATM and at the TOA over June–July–August 2006.
aerosols have a highly distinct radiative forcing, and the effect sign depends on the surface properties, particle
size distribution and aerosol composition that determine the single scattering albedo of the p articles108,109. A
positive radiative forcing tends to warm up the atmosphere, whereas negative forcing tends to cool it. Figure 9
presents the spatial distribution of DRF at the TOA, in the ATM and at the SFC averaged over the study period.
Figure 10, same as Fig. 9, but for the estimated mean values bar plot over the study domain. Table 5 summarizes
the mean values of DRF calculated at the SFC, in the ATM, and the TOA over WA during the study period. These
highlights that the impact of dust on SW radiation reduces downward flux at the TOA (− 1 W/m2) (Fig. 9a), at
the SFC (− 29 W/m2) (Fig. 9c), and increases absorption within the ATM (28 W/m2) (Fig. 9b). The reduction in
downward flux is due to the upward reflection of SW radiation by dust particles in the ATM, particularly over
the bright surfaces such as deserts. The absorption in the ATM is effective because the SW radiation reflected by
the glossy surfaces is very likely to be absorbed by the dust particles41.
On the other hand, the LW radiation shows an opposite effect by increasing the absorption of the incident
flux downwards at the TOA (10 W/m2) (Fig. 9d) and SFC (16 W/m2) (Fig. 9f), which in turn reduces it in the
ATM (− 5 W/m2) (Fig. 9e). This highlights the ability of dust particles to absorb LW radiation, which depends on
the particle size109. The hot desert emits infrared radiation, and this infrared radiation interacts much more with
larger particles that have shorter lifetimes and can travel shorter distances. In contrast, SW radiation interacts
much more with small particles, whose lifetimes are more than five days (~ 1 week)41. Previous studies on direct
and semi-direct effects of aerosols over North Africa have reported similar results of SW DRF. The first study
found that dust aerosol reduces the downwelling SW radiation at the SFC by up to 58 W/m2 with an average
of 22 W/m2 over North Africa. The second one reported a mean DRF of − 19.7 W/m2 at the SFC over northern
Africa due to the absorption and scattering of the incident radiation.
Results show that the net DRF at the TOA is either negative or positive (see Fig. 9g). Accordingly, the TOA
DRF is positive over highly reflective surfaces such as the Sahara desert (about 15° N–30° N, Fig. 9g). Similar
results were reported by previous studies41–43,45,110 and can be explained by surface albedo values on desert regions
reducing DRF due to SW radiation. Besides, a large amount of AOD in the source regions contributes to the
maximum absorption/emission of the LW radiation and induces warming at the TOA. On the other hand, the
net DRF at the TOA is negative below 15°N over the dark zones, i.e., the Gulf of Guinea and the vegetated lands
(Fig. 9g). The sign change around 15° N of the TOA radiative forcing is due to the change in albedo values in
the northern desert and the southern Sudanian savannah zone. It is also due to the reduction in the amount of
dust away from source regions. The mean net value of DRF at the TOA was estimated to be 9 W/m2 indicated
in Fig. 10.
In the ATM (Fig. 9h), the net DRF has positive values over the study domain, which shows the absorption of
radiative energy by the atmosphere. Because of their absorbent properties, it is clear that dust aerosols produce
a warming effect within the ATM. The mean net DRF within the ATM was estimated to be 23 W/m2 over the
study domain (Fig. 10). At the SFC (Fig. 9i), the net DRF is negative and was estimated to be − 13 W/m2 shown
in bar plot values in Fig. 10, which indicates a strong cooling at the SFC by dust aerosols. The SFC cooling is
attributed to a reduction of SW radiation absorbed and scattered by dust particles. These are consistent with
similar previous s tudies32,4944,45,, which found that DRF leads to a strong cooling effect at the SFC over Africa
north of the equator. The net DRF at TOA is smaller than in the ATM or at the SFC over WA, illustrated in Fig. 10.
Anomalies in surface heat fluxes, and temperature. To maintain radiative equilibrium, the Earth
must balance as the incoming solar radiation, and outward infrared radiation have to be equal39,56. Figure 11
investigates the impact of dust aerosols on the surface energy fluxes over the study period. The effect of dust
induces negative anomalies of SH flux (positive upward) (up to − 24 W/m2) over the land surface, mainly over
the WA monsoon region (Fig. 11a). Studies using model and field data have also emphasized a substantial reduc-
tion of SH flux due to dust aerosols36,44,56. The decrease in SH flux can be associated with a reduction of SFC
temperature and precipitation, although radiative warming within the aerosol layer may induce a local increase
in rainfall43,56.
Conversely, dust was found to cause positive anomalies of LH flux (positive upward) (Fig. 11b) above 15°
N over the Sahara desert (up to 12 W/m2). These positive anomalies of LH flux lead to a loss of surface energy
by evaporation. Over the dark green part, negative anomalies of LH flux (energy gain) were found below 15° N
due to dust aerosols (up to − 24 W/m2). For the surface energy balance (Q, positive downward) (Fig. 11c), dust
also causes positive anomalies (energy excess) over the land (up to 12 W/m2). Similar results were reported by
studies using field data, regional and global climate models. They found that Q over WA is significantly altered
and responds to variation of aerosols in atmospheric composition, clouds and water vapor36,44,56.
Similarly, Fig. 11d examined the impact of dust on the SFC temperature over the study period. Dust aerosols
induce negative anomalies of SFC temperature over countries bordering the Atlantic Ocean, the Gulf of Guinea,
over the Sahel, Western Sahara, Libya, and northeastern Algeria. Many studies have reported these negative
Scientific Reports | (2020) 10:12236 | https://doi.org/10.1038/s41598-020-69223-4 13
Vol.:(0123456789)www.nature.com/scientificreports/
Figure 11. Changes in simulated SFC fluxes and temperature, induced by dust from WRF-Chem averaged
over June–July–August 2006. Results are shown for: (a) SH, (b) LH, (c) Q, (d) SFC temperature. All fluxes use
upward-positive convention, except Q, which is positive downward.
anomalies and could be related to a reduction of solar radiation reaching the SFC over WA region42–44,48. However,
there are regions with positive anomalies causing a warming effect over the SHL region and above the desert of
Niger associated with a strengthening of the greenhouse effect by dust particles. Previous reports found these
positive anomalies between 20° N and 30° N while they appear above 30° N for the o ther44,111. These results
highlight an agreement between WRF-Chem and other previous studies that used field data and climate models
to investigate the impact of dust aerosols over WA.
Conclusions
Dust Radiative Forcing (DRF) and its impact on the surface energy budget during summer 2006 are examined
using the WRF-Chem model in this study. The performance of the model to reproduce AOD, SSA, radiation
fluxes and the temperature was firstly assessed with MISR, CERES and in-situ data from ARM mobile facility
at Niamey over West Africa (WA). The impact of dust on the surface energy fluxes and temperature was then
investigated. Results show that WRF-Chem performs well with observations in reproducing the distribution of
AOD, SSA, radiation fluxes, and temperatures. However, significant biases exist in the spatial distribution of AOD
over the southern part of WA, which is possibly attributed to model configurations, particularly the calculation
of threshold wind speed in the scheme, dust emission scheme, boundary conditions, and surface properties.
It is found that the presence of dust particles induces a net warming effect at the TOA and in the ATM, and
cooling at the SFC. The mean net DRF at the TOA is estimated to be 9 W/m2. Positive values of DRF are found
over the reflective surfaces such as the Sahara desert. While over dark areas, such as the Gulf of Guinea and
vegetated land, the effect is found to be negative. In the ATM, the mean net DRF is estimated to be 23 W/m2
Scientific Reports | (2020) 10:12236 | https://doi.org/10.1038/s41598-020-69223-4 14
Vol:.(1234567890)www.nature.com/scientificreports/
indicating strong absorption of radiative energy by dust aerosols. At the SFC, the mean net DRF is estimated to
be − 13 W/m2, which indicates a strong cooling at the SFC caused by dust aerosols.
Results also indicated that the SFC effect due to the presence of dust aerosols induces a significant reduction in
both SH flux up to 24 W/m2 and SFC temperature up to 2 °C cooling effect over WA. Additionally, dust aerosols
cause an increase of LH flux up to 12 W/m2 over the land above 15° N and a reduction up to 24 W/m2 over the
dark green part below 15° N. This study highlights that dust aerosols significantly influence the surface energy
budget over WA. Dust effects should be taken into account in further climate studies, to improve the accuracy
in predicting weather and climate change. However, dust parameterizations still need to be improved. The study
results provide supportive evidence of the potential value of this model for dust studies. The model can be used
in a range of regional applications and will help to address key challenges, such as lack of ground observations.
Data availability
Data will be provided and made available upon the request of the readers.
Received: 10 January 2020; Accepted: 1 July 2020
References
1. Pachauri, R. K. et al. Climate change 2014: Synthesis report. Contribution of Working Groups I, II and III to the fifth assessment
report of the Intergovernmental Panel on Climate Change (IPCC, Geneva, 2014).
2. Barkan, J., Kutiel, H. & Alpert, P. Climatology of dust sources in North Africa and the Arabian Peninsula, based on TOMS data.
Indoor Built Environ. 13, 407–419 (2004).
3. Engelstaedter, S., Tegen, I. & Washington, R. North African dust emissions and transport. Earth Sci. Rev. 79, 73–100 (2006).
4. Goudie, A. S. & Middleton, N. J. Saharan dust storms: Nature and consequences. Earth Sci. Rev. 56, 179–204 (2001).
5. Prospero, J. M. Environmental characterization of global sources of atmospheric soil dust identified with the NIMBUS 7 total
ozone mapping spectrometer (TOMS) absorbing aerosol product. Rev. Geophys. https://doi.org/10.1029/2000RG000095 (2002).
6. Middleton, N. J. Effect of drought on dust production in the Sahel. Nature 316, 431 (1985).
7. Mbourou, G. N., Bertrand, J. J. & Nicholson, S. E. The diurnal and seasonal cycles of wind-borne dust over Africa north of the
equator. J. Appl. Meteorol. 36, 868–882 (1997).
8. Held, I. M., Delworth, T. L., Lu, J., Findell, K. L. & Knutson, T. R. Simulation of Sahel drought in the 20th and 21st centuries.
PNAS 102, 17891–17896 (2005).
9. Biasutti, M. & Giannini, A. Robust Sahel drying in response to late 20th century forcings. Geophys. Res. Lett. https://doi.
org/10.1029/2006GL026067 (2006).
O2 forcing. J. Clim. 24, 4999–5014 (2011).
10. Ackerley, D. et al. Sensitivity of twentieth-century Sahel rainfall to sulfate aerosol and C
11. Nicholson, S. E. The West African Sahel: A review of recent studies on the rainfall regime and its interannual variability. ISRN
Meteorol. 2013, 1–32 (2013).
12. Epule, E. T., Peng, C., Lepage, L. & Chen, Z. The causes, effects and challenges of Sahelian droughts: A critical review. Reg.
Environ. Change 14, 145–156 (2014).
13. Giannini, A. & Kaplan, A. The role of aerosols and greenhouse gases in Sahel drought and recovery. Clim. Change 152, 449–466
(2019).
14. Solomon, S. et al. Climate change 2007: The physical science basis. Contribution of Working Group I to the fourth assessment
report of the intergovernmental panel on climate change, 2007 (2007).
15. Moufouma-Okia, W. & Rowell, D. Impact of soil moisture initialization and lateral boundary conditions on regional climate
model simulations of West African Monsoon. Clim. Dyn. 35, 213–229 (2009).
16. Saley, I. A. et al. The possible role of the Sahel Greenbelt on the occurrence of climate extremes over the West African Sahel.
Atmos. Sci. Lett. 20, e927 (2019).
17. Wang, G. & Eltahir, E. A. B. Ecosystem dynamics and the Sahel drought. Geophys. Res. Lett. 27, 795–798 (2000).
18. Nicholson, S. Land surface processes and Sahel climate. Rev. Geophys. 38, 117–139 (2000).
19. Diallo, I. et al. Simulation of the West African monsoon onset using the HadGEM3-RA regional climate model. Clim. Dyn. 43,
575–594 (2014).
20. Tanré, D. Measurement and modeling of the Saharan dust radiative impact: Overview of the Saharan dust experiment (SHADE).
J. Geophys. Res. 108, 8574 (2003).
21. Ansmann, A. et al. Saharan mineral dust experiments SAMUM–1 and SAMUM–2: What have we learned?. Tellus B Chem. Phys.
Meteorol. 63, 403–429 (2011).
22. Redelsperger, J.-L. et al. African monsoon multidisciplinary analysis: An international research project and field campaign. Bull.
Am. Meteorol. Soc. 87, 1739–1746 (2006).
23. Prospero, J. M. & Lamb, P. J. African droughts and dust transport to the Caribbean: Climate change implications. Science 302,
1024–1027 (2003).
24. Prospero, J. M. & Mayol-Bracero, O. L. Understanding the transport and impact of African dust on the Caribbean basin. Bull.
Am. Meteorol. Soc. 94, 1329–1337 (2013).
25. Fiedler, S., Schepanski, K., Knippertz, P., Heinold, B. & Tegen, I. How important are atmospheric depressions and mobile cyclones
for emitting mineral dust aerosol in North Africa?. Atmos. Chem. Phys. 14, 8983–9000 (2014).
26. Knippertz, P. Meteorological aspects of dust storms. In Mineral Dust (eds Knippertz, P. & Stuut, J.-B.) 121–147 (Springer, New
York, 2014).
27. Evan, A. T., Flamant, C., Gaetani, M. & Guichard, F. The past, present and future of African dust. Nature 531, 493–495 (2016).
28. Miller, R. L., Tegen, I. & Perlwitz, J. Surface radiative forcing by soil dust aerosols and the hydrologic cycle. J. Geophys. Res.
Atmos. https://doi.org/10.1029/2003JD004085 (2004).
29. Hansen, J., Sato, M. & Ruedy, R. Radiative forcing and climate response. J. Geophys. Res. Atmos. 102, 6831–6864 (1997).
30. Koch, D. & Del Genio, A. D. Black carbon semi-direct effects on cloud cover: Review and synthesis. Atmos. Chem. Phys. 10,
7685–7696 (2010).
31. Twomey, S. The influence of pollution on the shortwave albedo of clouds. J. Atmos. Sci. 34, 1149–1152 (1977).
32. Gu, Y., Liou, K. N., Jiang, J. H., Su, H. & Liu, X. Dust aerosol impact on North Africa climate: A GCM investigation of aerosol-
cloud-radiation interactions using A-Train satellite data. Atmos. Chem. Phys. 12, 1667–1679 (2012).
33. Quijano, A. L., Sokolik, I. N. & Toon, O. B. Radiative heating rates and direct radiative forcing by mineral dust in cloudy atmos-
pheric conditions. J. Geophys. Res. Atmos. 105, 12207–12219 (2000).
34. Slingo, A. et al. Observations of the impact of a major Saharan dust storm on the atmospheric radiation balance. Geophys. Res.
Lett. https://doi.org/10.1029/2006GL027869 (2006).
Scientific Reports | (2020) 10:12236 | https://doi.org/10.1038/s41598-020-69223-4 15
Vol.:(0123456789)www.nature.com/scientificreports/
35. Washington, R., Todd, M. C., Engelstaedter, S., Mbainayel, S. & Mitchell, F. Dust and the low-level circulation over the Bodélé
Depression, Chad: Observations from BoDEx 2005. J. Geophys. Res. https://doi.org/10.1029/2005JD006502 (2006).
36. Mallet, M. et al. Impact of dust aerosols on the radiative budget, surface heat fluxes, heating rate profiles and convective activity
over West Africa during March 2006. Atmos. Chem. Phys. 9, 7143–7160 (2009).
37. Mohamed, A. B., Frangi, J.-P., Fontan, J. & Druilhet, A. Spatial and temporal variations of atmospheric turbidity and related
parameters in Niger. J. Appl. Meteorol. 31, 1286–1294 (1992).
38. Kaufman, Y. J., Tanré, D. & Boucher, O. A satellite view of aerosols in the climate system. Nature 419, 215 (2002).
39. Miller, R. L. & Tegen, I. Climate response to soil dust aerosols. J. Clim. 11, 3247–3267 (1998).
40. Grini, A., Myhre, G., Zender, C. S. & Isaksen, I. S. Model simulations of dust sources and transport in the global atmosphere:
Effects of soil erodibility and wind speed variability. J. Geophys. Res. Atmos. https://doi.org/10.1029/2004JD005037 (2005).
41. Yoshioka, M. et al. Impact of desert dust radiative forcing on Sahel precipitation: Relative importance of dust compared to sea
surface temperature variations, vegetation changes, and greenhouse gas warming. J. Clim. 20, 1445–1467 (2007).
42. Konare, A. et al. A regional climate modeling study of the effect of desert dust on the West African monsoon. J. Geophys. Res.
Atmos. https://doi.org/10.1029/2007JD009322 (2008).
43. Solmon, F. et al. Dust aerosol impact on regional precipitation over western Africa, mechanisms and sensitivity to absorption
properties. Geophys. Res. Lett. https://doi.org/10.1029/2008GL035900 (2008).
44. Lau, K. M., Kim, K. M., Sud, Y. C. & Walker, G. K. A GCM study of the response of the atmospheric water cycle of West Africa
and the Atlantic to Saharan dust radiative forcing. Ann. Geophys. 27, 4023–4037 (2009).
45. Zhao, C. et al. The spatial distribution of mineral dust and its shortwave radiative forcing over North Africa: Modeling sensitivi-
ties to dust emissions and aerosol size treatments. Atmos. Chem. Phys. 10, 8821–8838 (2010).
46. Stanelle, T., Vogel, B., Vogel, H., Bäumer, D. & Kottmeier, C. Feedback between dust particles and atmospheric processes over
West Africa during dust episodes in March 2006 and June 2007. Atmos. Chem. Phys. 10, 10771–10788 (2010).
47. Zhao, C., Liu, X., Ruby Leung, L. & Hagos, S. Radiative impact of mineral dust on monsoon precipitation variability over West
Africa. Atmos. Chem. Phys. 11, 1879–1893 (2011).
48. Solmon, F., Elguindi, N. & Mallet, M. Radiative and climatic effects of dust over West Africa, as simulated by a regional climate
model. Clim. Res. 52, 97–113 (2012).
49. Ma, X., Yu, F. & Luo, G. Aerosol direct radiative forcing based on GEOS-Chem-APM and uncertainties. Atmos. Chem. Phys. 12,
5563–5581 (2012).
50. Heald, C. L. et al. Contrasting the direct radiative effect and direct radiative forcing of aerosols. Atmos. Chem. Phys. 14, 5513–5527
(2014).
51. Alizadeh-Choobari, O., Sturman, A. & Zawar-Reza, P. Global distribution of mineral dust and its impact on radiative fluxes as
simulated by WRF-Chem. Meteorol. Atmos. Phys. 127, 635–648 (2015).
52. Mahowald, N. M. et al. Understanding the 30-year Barbados desert dust record. J. Geophys. Res. Atmos. 107, 7 (2002).
53. Mohamed, A. B. Climate change risks in Sahelian Africa. Reg. Environ. Change 11, 109–117 (2011).
54. Gaetani, M. et al. West African monsoon dynamics and precipitation: the competition between global SST warming and CO2
increase in CMIP5 idealized simulations. Clim. Dyn. 48, 1353–1373 (2017).
55. Durand, P., Frangi, J.-P. & Druilhet, A. Energy budget for the Sahel surface layer during the ECLATS experiment. Bound.-Layer
Meteorol. 42, 27–42 (1988).
56. Miller, R. L., Slingo, A., Barnard, J. C. & Kassianov, E. Seasonal contrast in the surface energy balance of the Sahel. J. Geophys.
Res. 114, D00E05 (2009).
57. Grell, G. A. et al. Fully coupled “online” chemistry within the WRF model. Atmos. Environ. 39, 6957–6975 (2005).
58. Lohmann, U. & Feichter, J. Global indirect aerosol effects: A review. Atmos. Chem. Phys. 5, 715–737 (2005).
59. McFiggans, G. et al. The effect of physical and chemical aerosol properties on warm cloud droplet activation. Atmos. Chem.
Phys. 6, 2593–2649 (2006).
60. Shindell, D. T. et al. A multi-model assessment of pollution transport to the Arctic. Atmos. Chem. Phys. 8, 5353–5372 (2008).
61. Zhang, Y., Wen, X.-Y. & Jang, C. J. Simulating chemistry–aerosol–cloud–radiation–climate feedbacks over the continental U.S.
using the online-coupled weather research forecasting model with chemistry (WRF/Chem). Atmos. Environ. 44, 3568–3582
(2010).
62. Forkel, R. et al. Effect of aerosol-radiation feedback on regional air quality—A case study with WRF/Chem. Atmos. Environ. 53,
202–211 (2012).
63. Sha, T. et al. Aerosol chemical component: Simulations with WRF-Chem and comparison with observations in Nanjing. Atmos.
Environ. 218, 116982 (2019).
64. Ginoux, P. et al. Sources and distributions of dust aerosols simulated with the GOCART model. J. Geophys. Res. Atmos. 106,
20255–20273 (2001).
65. Ginoux, P., Prospero, J. M., Torres, O. & Chin, M. Long-term simulation of global dust distribution with the GOCART model:
Correlation with North Atlantic Oscillation. Environ. Model. Softw. 19, 113–128 (2004).
66. Lin, Y.-L., Farley, R. D. & Orville, H. D. Bulk parameterization of the snow field in a cloud model. J. Clim. Appl. Meteorol. 22,
1065–1092 (1983).
67. Iacono, M. J. et al. Radiative forcing by long-lived greenhouse gases: Calculations with the AER radiative transfer models. J.
Geophys. Res. Atmos. https://doi.org/10.1029/2008JD009944 (2008).
68. Räisänen, P., Barker, H. W., Khairoutdinov, M. F., Li, J. & Randall, D. A. Stochastic generation of subgrid-scale cloudy columns
for large-scale models. Q. J. R. Meteorol. Soc. 130, 2047–2067 (2004).
69. Hong, S.-Y., Noh, Y. & Dudhia, J. A new vertical diffusion package with an explicit treatment of entrainment processes. Mon.
Weather Rev. 134, 2318–2341 (2006).
70. Grell, G. A. Prognostic evaluation of assumptions used by cumulus parameterizations. Mon. Weather Rev. 121, 764–787 (1993).
71. Grell, G. A. & Dévényi, D. A generalized approach to parameterizing convection combining ensemble and data assimilation
techniques. Geophys. Res. Lett. 29, 1–4 (2002).
72. Mukul Tewari, N. et al. Implementation and verification of the unified NOAH land surface model in the WRF model (Formerly
Paper Number 17.5). in 20th Conference on Weather Analysis and Forecasting/16th Conference on Numerical Weather Prediction,
11–15 (2004).
73. Paulson, C. A. The mathematical representation of wind speed and temperature profiles in the unstable atmospheric surface
layer. J. Appl. Meteorol. 9, 857–861 (1970).
74. Dyer, A. J. & Hicks, B. B. Flux-gradient relationships in the constant flux layer. Q. J. R. Meteorol. Soc. 96, 715–721 (1970).
75. Webb, E. K. Profile relationships: The log-linear range, and extension to strong stability. Q. J. R. Meteorol. Soc. 96, 67–90 (1970).
76. Zhang, D. & Anthes, R. A. A high-resolution model of the planetary boundary layer—Sensitivity tests and comparisons with
SESAME-79 data. J. Appl. Meteorol. 21, 1594–1609 (1982).
77. Beljaars, A. C. The parametrization of surface fluxes in large-scale models under free convection. Q. J. R. Meteorol. Soc. 121,
255–270 (1995).
78. LeGrand, S. L. et al. The AFWA dust emission scheme for the GOCART aerosol model in WRF-Chem v3.8.1.. Geosci. Model
Dev. 12, 131–166 (2019).
Scientific Reports | (2020) 10:12236 | https://doi.org/10.1038/s41598-020-69223-4 16
Vol:.(1234567890)You can also read