The role of tropical volcanic eruptions in exacerbating Indian droughts - Nature
←
→
Page content transcription
If your browser does not render page correctly, please read the page content below
www.nature.com/scientificreports
OPEN The role of tropical volcanic
eruptions in exacerbating Indian
droughts
Suvarna Fadnavis1*, Rolf Müller2, Tanusri Chakraborty1, T. P. Sabin1, Anton Laakso3,
Alexandru Rap4, Sabine Griessbach5, Jean‑Paul Vernier6,7 & Simone Tilmes8
The Indian summer monsoon rainfall (ISMR) is vital for the livelihood of millions of people in the Indian
region; droughts caused by monsoon failures often resulted in famines. Large volcanic eruptions have
been linked with reductions in ISMR, but the responsible mechanisms remain unclear. Here, using
145-year (1871–2016) records of volcanic eruptions and ISMR, we show that ISMR deficits prevail
for two years after moderate and large (VEI > 3) tropical volcanic eruptions; this is not the case for
extra-tropical eruptions. Moreover, tropical volcanic eruptions strengthen El Niño and weaken La Niña
conditions, further enhancing Indian droughts. Using climate-model simulations of the 2011 Nabro
volcanic eruption, we show that eruption induced an El Niño like warming in the central Pacific for two
consecutive years due to Kelvin wave dissipation triggered by the eruption. This El Niño like warming
in the central Pacific led to a precipitation reduction in the Indian region. In addition, solar dimming
caused by the volcanic plume in 2011 reduced Indian rainfall.
Droughts associated with weak South Asian summer monsoons have a very strong impact on regional water secu-
rity with substantial socio-economic consequences affecting millions of people in the region1,2. Famines caused by
droughts in the Indian region have historically caused the death of millions of people3. Several factors contribute
to a weakening of the monsoon and the droughts associated with it; in particular El Niño4, regional land-use
changes5, and anthropogenic aerosol forcing6,7.
The global monsoon precipitation responds to large volcanic e ruptions8,9. For example, northern hemisphere
(NH) monsoon precipitation is weakened by NH and equatorial volcanic eruptions, but is enhanced by Southern
hemisphere (SH) e ruptions10. Droughts in West Africa also show linkages with asymmetric hemispheric volcanic
forcing, i.e. volcanic eruptions in the NH produce droughts, whereas those in the SH induce a greening of the
Sahel11. Furthermore, precipitation reductions during the years after tropical volcanic eruptions, mostly in the
monsoon regions, have been found for five explosive eruptions in Coupled Model Intercomparison Project
(CMIP5) models (Krakatau, Santa María, Agung, El Chichón, and Pinatubo) and in an observational analysis12.
A decrease in precipitation following large volcanic eruptions is also consistent with an observed reduction in
river streamflow in wet tropical regions13,14. Similar mechanisms were also found in simulations of volcanic
forcing during the past two centuries, namely precipitation decreases in the tropics and subtropics, a weaker
monsoon in the year after large e ruptions15 and a shift of the intertropical convergence zone and the associated
precipitation away from the hemisphere with greater volcanic forcing16. Consistently, climate proxy data over
the past millennium derived from tree rings, ice cores, and speleothems show that volcanic forcing may drive a
weak Asian summer monsoon in the second year after an eruption17,18.
Solar geoengineering studies investigating continuous injections of sulphur into the stratosphere assume
an enhancement of the stratospheric aerosol burden resembling that caused by volcanic eruptions. Geoengi-
neering studies consistently find a weakening of the Asian summer monsoon and a reduction of the associated
precipitation19,20. Recent studies21,22, using four injection locations to minimise global, pole-to-equator and
interhemispheric surface temperature gradient changes, found that while global annual precipitation over land
is not affected, the heating of the lower tropical stratosphere results in important regional changes (e.g. a weak-
ening of the Asian summer monsoon). While the impact of geoengineering is likely different to that of volcanic
eruptions because of the assumed continuous application of geoengineering and the possibility to modulate
1
Indian Institute of Tropical Meteorology, MoES, Pune, India. 2Forschungszentrum Jülich GmbH, IEK7, Jülich,
Germany. 3Finnish Meteorological Institute, Kuopio, Finland. 4School of Earth and Environment, University of
Leeds, Leeds, UK. 5Forschungszentrum Jülich GmbH, Jülich Supercomputing Center, Jülich, Germany. 6National
Institute of Aerospace, Hampton, VA, USA. 7NASA Langley Research Center, Hampton, VA, USA. 8National Center
for Atmospheric Research, Boulder, USA. *email: suvarna@tropmet.res.in
Scientific Reports | (2021) 11:2714 | https://doi.org/10.1038/s41598-021-81566-0 1
Vol.:(0123456789)
www.nature.com/scientificreports/
injection locations to prevent precipitation s hifts23, common processes impacting the Asian summer monsoon
may be applicable to both.
The impact of moderate volcanic eruptions on tropical climate and the mechanisms of precipitation changes
in response to such eruptions (e.g. changes in the South Asian summer monsoon) have hitherto received little
attention. Here we employ 145-year long observational records (1871–2016) of volcanic eruptions and monsoon
precipitation to investigate Indian rainfall deficits after moderate and large (VEI > 3) volcanic eruptions.
The global mean stratospheric aerosol loading has been modulated by a number of moderate volcanoes
erupting after Mt. Pinatubo (June 1991)24. These volcanic eruptions also produced long-lasting perturbations in
the global aerosol optical depth (AOD) and reflectivity25. The global aerosol radiative forcing and induced cool-
ing from moderate volcanic eruptions since 2000 were estimated at −0.19 ± 0.009 W m−2 and −0.05 to −0.12 °C,
respectively26. Past studies also show that surface cooling is known to cause a reduction in the Indian monsoon
circulation6.
During the monsoon season, the localised aerosol layer over Asia known as the Asian tropopause aerosol
layer (ATAL)27–29 has been shown to amplify the severity of Indian droughts7 by solar dimming. CALIPSO
and SAGE-II satellite observations indicate that moderate-to-large volcanic eruptions, e.g. Kasatochi (August
2008), Sarychev (June 2009), Nabro (June 2011), have also been instrumental in enriching the A TAL25,30. These
volcanic eruptions have enhanced the AOD in the lowermost stratosphere by ~ 30% of the global stratospheric
aerosol optical depth31.
A further significant influence on the Asian summer monsoon and its association with volcanic eruptions
and the ATAL is the El Niño Southern Oscillation (ENSO)7,15,18. Large volcanic eruptions can trigger atmos-
pheric Kelvin waves and therefore shorten La Niña and lengthen El Niño periods within two years after the
eruption32. El Niño periods are known to produce strong anomalous subsidence and a weakening of the Indian
monsoon4,33. There are complex unexplored linkages of the Indian monsoon weakening and associated droughts
with (1) aerosol layers in the UTLS, (2) volcanic eruptions thickening UTLS aerosol layers, and (3) the El Niño
induced circulation which can be amplified by volcanic eruptions. Here we use a number of satellite observations
(CALIPSO, MIPAS, MISR, TRMM) and climate model simulations (Max‐Planck‐Institute Earth System Model
(MPI‐ESM) and ECHAM6-HAMMOZ) to investigate the role of moderate and large (VEI > 3) tropical volcanic
eruptions in inducing drought conditions over India. The simulated rainfall is evaluated with the India mete-
orology department (IMD) and Global Precipitation Climatology Project (GPCP) rainfall data (see “Methods”
section for details of data sets and methodology).
Moderate and large volcanic eruptions and Indian droughts
Figure 1a,b shows the probability distribution of observed ISMR anomalies during 1871–2016. The data indicate
substantial rainfall deficits for monsoon seasons within two years after a moderate or large tropical volcanic erup-
tion, compared to monsoon seasons without such an eruption in the preceding two years (Kolmogorov–Smirnov
(K-S) test measure = 0.5, P values = 0.05 given in Fig. 1a indicates that the distributions with and without vol-
canoes are distinct. The K-S test measure and P-values shown in Fig. 1b and Fig. S1a,b also indicates that the
corresponding distributions are distinct) (also see Table S1). Notably, this is in contrast to the observed ISMR
anomalies during summer monsoon seasons following extratropical volcanic eruptions, which tend to show
positive (wet) rainfall anomalies (Fig. S1a). This is likely due to the spatial distribution of the moderate and
large (VEI > 3) volcanic eruptions. As shown in Fig. 1c, while tropical eruptions are mostly located near the
maritime continent and the Niño-3 region, the extratropical eruptions are located near the north western Pacific
and western Canada. However, if eruptions in the NH extratropics occur in June the Asian summer monsoon
circulation transports volcanic aerosol into the t ropics34. All five NH extra-tropical eruptions in June, Novarupta
1912, Komakatake 1929, Spurr 1992, Sheveluch 2001, and Sarychev 2009 (Table S2) are followed by a drought
over the Indian region.
ENSO is also known to be an important factor contributing to Indian summer monsoon negative (El Niño)
and positive (La Niña) rainfall a nomalies35 (Fig. S1b). Several previous studies reported an El Niño signature
in the Pacific after a volcanic eruption32,36. Figure 1b shows the probability distribution of ISMR anomalies cor-
responding to monsoon seasons following volcanic eruptions during the two phases of ENSO. Tropical volcanic
eruptions associated with El Niño periods tend to produce Indian droughts while, volcanic eruptions associated
with La Niña periods show positive rainfall anomalies (wet conditions). We find that 46 out of the 53 volcanic
eruptions considered in our analysis (i.e. 87%) are followed by rainfall deficits during the 2-year period after the
eruption. Of these 46 rainfall deficit periods, 36 occur during El Nino periods with 26 (26/53 = 49%) of them
leading to droughts, i.e. rainfall deficit exceeding 10% of the seasonal climatological m ean37 (Fig. 1d).
Volcanic aerosols forming a blanket over the ATAL during the monsoon season
To further investigate the processes causing the impact of tropical volcanic eruptions on Indian monsoon rainfall,
we focus on the Nabro, Eritrea (13.37° N, 41.7° E) volcanic eruption of 12–13 June 2011, a tropical moderate erup-
tion, which injected 1.3–2.0 Tg of S O2 into the a tmosphere30,38. Using the ECHAM6-HAMMOZ model volcano
(Vol) simulation where 1.5 Tg of S O2 were injected at 42° E, 13° N on 12 June 2011 (details in “Methods” section)
we show the vertical dispersion of the volcanic plume in Fig. 2a. Our simulations indicate that the Nabro volcanic
plume formed a thick aerosol layer in the UTLS over the Indian region lasting up to October 2012 (Fig. 2a). The
volcanic aerosol partially enters the monsoon anticyclone causing a thickening of the ATAL during monsoon
2011 (July–August-September). The aerosol backscatter ratio measured by CALIPSO and aerosol cloud index
(ACI) derived from MIPAS also shows a similar dispersion of the volcanic aerosol plume (Fig. 2b,c). The aerosol
is transported to higher altitudes and forms an additional layer above the ATAL during the subsequent monsoon
in 2012 (the ATAL is indicated as contours in Fig. 2a,b). The aerosol backscatter ratio measured by CALIPSO
Scientific Reports | (2021) 11:2714 | https://doi.org/10.1038/s41598-021-81566-0 2
Vol:.(1234567890)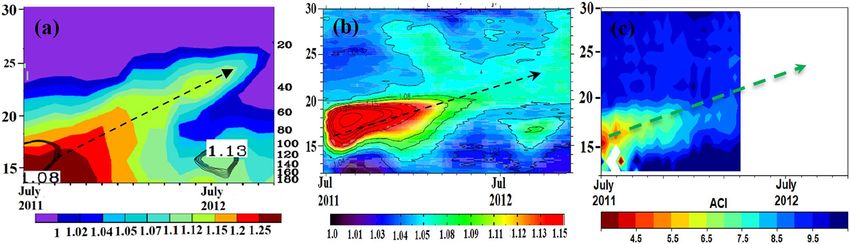
www.nature.com/scientificreports/
Figure 1. Volcanic eruptions and Indian summer monsoon rainfall: (a) probability distribution of rainfall
anomalies within two years of eruption, when stratified with and without tropical volcanic eruptions; (b)
probability distribution of rainfall anomalies within two years of a tropical volcanic eruption during El Niño,
La Niña, and normal years; the statistical measures of K-S test shown in (a,b) indicates that distributions are
distinct; (c) spatial distribution of moderate-to-large (VEI > 3) volcanic eruptions; (d) time series of June–
September mean precipitation anomaly (%) during 1871 –2016 along with tropical (30° S–30° N) volcanic
eruptions indicated with stars. Bars in magenta and blue in panel (d) indicate El Niño and La Niña years,
respectively. Details of the volcanic eruption are listed in Table S1. Anomalies are obtained as difference in
rainfall amount of the respective year and climatology of 1871–2016 (figure created using the COLA/GrADS
software).
Figure 2. Aerosol vertical distribution during July 2011–November 2012 averaged over India (70–95° E; 10–30°
N). Scattering ratio at 532 nm in the ECHAM6-HAMMOZ (Vol) simulation (a), Scattering ratio at 532 nm from
CALIPSO (b), and Aerosol cloud index (ACI) estimates from MIPAS (c). Arrows indicate the transport of the
NABRO plume. The ATAL is indicated as contours in (a,b) (Figure are created using the COLA/GrADS software
and Fig. 2c is created using Python).
and aerosol cloud index (ACI) derived from MIPAS measurements confirm the simulated dispersion of the
volcanic aerosol plume (Fig. 2b,c). Both, the ECHAM6-HAMMOZ simulations and the CALIPSO data show
the presence of two aerosol layers (ATAL and the volcanic layer) during the summer monsoon of 2012 (note
there are no MIPAS data during this period). A previous study30 based on CALIPSO observations suggests that
quasi-isentropic differential advection in the vertically sheared flow surrounding the Asian anticyclone helped
Scientific Reports | (2021) 11:2714 | https://doi.org/10.1038/s41598-021-81566-0 3
Vol.:(0123456789)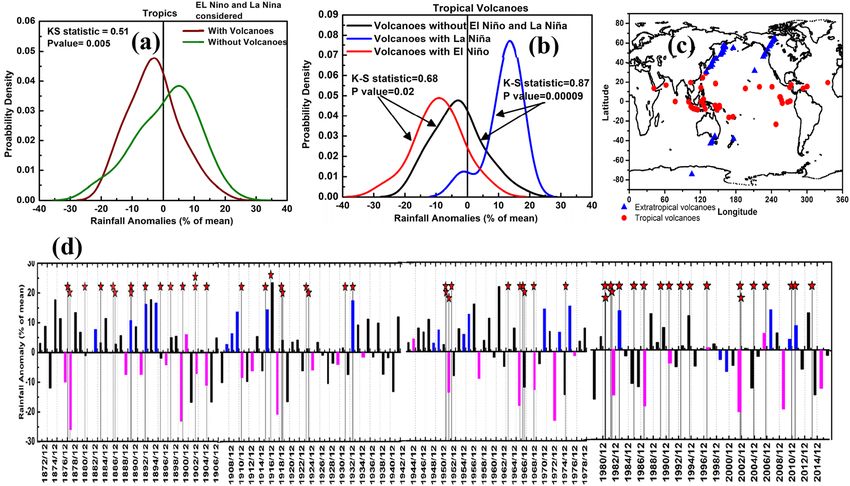
www.nature.com/scientificreports/
in the formation of the stratospheric aerosol layer over the Asian monsoon region, while deep convection in
the Asian monsoon played a minor role in transporting volcanic aerosols to the lower stratosphere. CALIPSO
satellite measurements also indicate a diabatic ascent of the Nabro plume in the lower stratosphere at rates of
10 K month−1 for the first two months after the eruption and 3 K.month−1 after the dissipation of the Asian
anticyclone30. Lidar observations in Tsukuba, Japan (36.05° N, 140.13° E), Saga, Japan (33.24° N, 130.29° E) and
Wuhan, China (30.5° N, 114.4° E) also show significant vertical spread of Nabro a erosols39. Also, MIPAS satellite
measurements and ground based lidar measurements in Europe show an increase of the aerosol layer thickness
with time40. Raman Lidar measurements at Gwangju, Korea (35.10° N, 126.53° E) show that the geometric depth
of the aerosol layer was 2–3 km in June 2011, which expanded to 10 km within the next two m onths41.
Radiative impacts and surface cooling
Large volcanic eruptions are known to cause a substantial increase in the stratospheric aerosol layer which typi-
cally lasts for about 2–3 years42,43. These aerosol particles are more efficient at reflecting shortwave solar radia-
tion than at attenuating longwave radiation emitted from the Earth’s surface, which results in a cooling of the
troposphere and s urface44. The El Chichón eruption in April 1982 produced a negative tropospheric radiative
forcing (RF) of −2 to −4 Wm−2 over a year45 and the Pinatubo eruption in June 1991 produced a RF at the top-
of-the-atmosphere (TOA) of approximately −4.5 Wm−2 over the region 40° S–40° N44. Stratospheric volcanic
aerosols from 2008 to 2011 have been estimated to have imposed an aerosol RF of −0.11 (−0.15 to −0.08) W m−246.
Our ECHAM6-HAMMOZ simulations analysed here indicate that the NABRO eruption has elevated strato-
spheric (potential temperature > 350 K) AOD by 0.024 (50%) (from 0.048 in the CTL simulation to 0.072 in the
Vol simulation) in July 2011 and by 0.0061 (14%) (from 0.044 in the CTL simulation to 0.05 in Vol simulation) in
July 2012 over the Asian region (5–105° E; 15–45° N). A previous s tudy31 has also reported an AOD enhancement
of 0.01 in the stratosphere over the Asian monsoon region in July 2011 in comparison with the volcanically qui-
escent period 1997 –2000. CALIPSO satellite observations show AOD variation similar to ECHAM6-HAMMOZ,
although the model overestimates AOD by 4–30% compared to CALIPSO (Fig. S2a).
The estimates of seasonal mean radiative impacts of the Nabro aerosol are provided for two subsequent mon-
soon seasons, July–September 2011 (June is not considered since the Nabro plume entered the anticyclone ~ 26
June 2011) and June–September 2012, referred hereafter as monsoon 2011 and monsoon 2012 respectively.
Estimates of mean RF over the Indian region (75–90° E; 10–28° N) obtained from ECHAM6-HAMMOZ simu-
lations (Vol-CTL) suggest that the Nabro aerosol layer produced negative RFs in 2011 monsoon (−0.81 W m−2
at the surface; −0.61 Wm−2 at TOA) and in 2012 monsoon (−0.23 Wm−2 at the surface; −0.21 Wm−2 at TOA)
(Fig. 3a). Using the SOCRATES m odel47,48 to isolate just the aerosol radiative effect (i.e. without accounting for
other associated changes, e.g. dynamics), we estimate the following direct aerosol radiative forcing (Vol-CTL):
−1.34 Wm−2 at the surface and −1.23 Wm−2 at TOA in 2011 monsoon, and −0.55 Wm−2 at the surface and −0.53
Wm−2 at TOA in 2012 monsoon (Fig. 3a). The SOCRATES model also allows us to quantify the contribution of
the simulated enhanced Nabro volcanic aerosol in the UTLS (150–30 hPa): −0.35 W m−2 at the surface and −0.3
Wm−2 at TOA in 2011 monsoon, and at −0.06 Wm−2 at the surface and −0.06 Wm−2 at TOA in 2012 monsoon
(Fig. 3a). A previous s tudy30 based on CALIPSO observations shows that the increase in Nabro aerosols (at
14–40 km) has imposed a RF at the TOA −0.8 W.m−2 to −0.5 W.m−2 over South Asia in July and August 2011
(a local peak of −1.6 W.m−2 July 2011)30 along with a global mean RF changes −0.3 Wm−2 during 2011–201231.
Our ECHAM6-HAMMOZ model simulations show that the volcanically enhanced sulphate aerosol layer
has led to a reduction in the solar flux reaching the surface over India (75–90° E; 10–28° N) by −1.23 W.m−2
and −0.50 W m−2 in the monsoon season of 2011 and 2012, respectively (Fig. 3b). The corresponding changes
in solar flux at the surface estimated using the SOCRATES radiation model (i.e. simulating only the volcanic
sulphate aerosol direct radiative effect) are −4.5 W m−2 and −2.0 W m−2 in the monsoon season of 2011 and
2012, respectively. The contribution of the volcanic aerosol layer in the UTLS (150–30 hPa) quantified with the
SOCRATES radiation model is a reduction in surface solar flux of −1.59 W m−2 and −0.27 W m−2 in the monsoon
seasons of 2011 and 2012, respectively (Fig. 3b).
Previous studies show that large volcanic eruptions can produce a global cooling at the surface for typically
2 to 3 years after the eruption49,50. Ocean–atmosphere climate model simulations show that an increase in the
moderate volcanic activity during 2003–2012 has led to a reduction in the global mean warming trend of 0.08 °C
in ten y ears50. Our MPI-ESM simulations, which couples the atmosphere, ocean and land surface (details in
“Methods” section) show that the Nabro volcanic sulphate aerosol over North India (75–90°E, 20–35°N) has
produced a mean cooling of −0.055 °C (−0.08 to −0.03 °C) in 2011 monsoon and −0.075 °C (−0.09 °C to −0.06 °C)
in 2012 monsoon. Dynamical changes and subsidence associated with El Niño might have caused higher cooling
in the monsoon season of 2012 than in 2011. This cooling is a factor of 10 smaller than the cooling caused by
the Mt Pinatubo eruption, which amounts to −0.6 °C to −0.5 °C global mean surface temperature change during
1992–199351. Observations suggest that large volcanic eruptions for the last 150 years have produced a global
mean surface cooling of 0.3°C52. Temperature records for the past 450 years from corals, tree rings and ice cores
show that volcanism in the tropics has produced a cooling of −0.1 °C in the t ropics53.
Using the SOCRATES model we estimated the changes in heating rates induced by the Nabro volcanic aerosol.
As shown in Fig. 3c, increases in heating rates of 0.01 K.day−1 at ATAL altitudes (15–20 km) and 0.003–0.005 K.
day−1 above ATAL altitudes (20–35 km) are simulated during the 2011 monsoon season, in conjunction with
some small reductions of −0.001 to −0.002 K.day−1 at lower altitudes in the troposphere. This is driven by: (i)
a local longwave (LW) heating, due to strong absorption of LW radiation by the aerosol; (ii) some LW heating
below the aerosol layer and some LW cooling above the aerosol layer; (iii) short wave (SW) heating above the
aerosol layer, due to scattered SW radiation from the aerosol layer being reflected upwards and absorbed by
radiatively active gases (e.g. ozone) in that region and direct radiative heating from SW absorption by the aerosol
Scientific Reports | (2021) 11:2714 | https://doi.org/10.1038/s41598-021-81566-0 4
Vol:.(1234567890)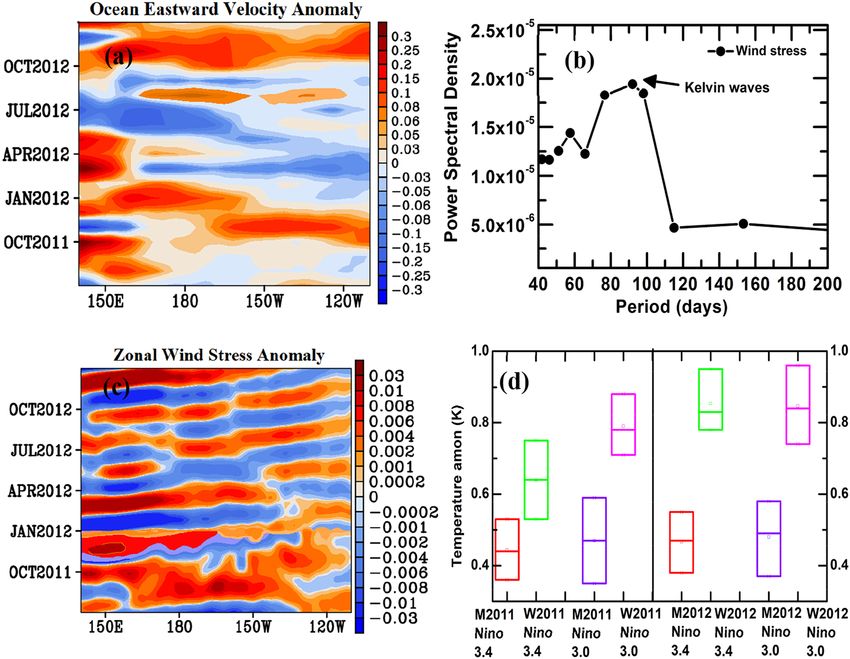
www.nature.com/scientificreports/
Figure 3. (a) Distribution of anomalies (Vol-CTL) in net direct radiative forcing at TOA ( Wm−2) and the
surface (Wm−2) for 2011 and 2012 monsoon from the ECHAM6-HAMMOZ simulations (ETOA and ESur),
SOCRATES model (STOA and SSur), aerosols in the UTLS from SOCRATES: STOAUTLS and SSurUTLS), (b)
same as (a) but changes in net solar radiation (flux) at the surface (W.m−2) (ECHAM6-HAMMOZ—E2011 and
E2012; SOCRATES—S2011 and S2012, aerosols in the UTLS from SOCRATES—SUTLS2011 and SUTLS2012).
Bars in panels (a) and (b) correspond to minimum, mean, maximum values. Vertical distribution of changes in
heating rate (K day−1) averaged for 70°E–95°E and monsoon (c) 2011, and (d) 2012. (Figure created using the
COLA/GrADS software).
itself; and (iv) SW cooling below the aerosol layer, due to the aerosol scattering SW radiation and therefore less
SW radiation reaching those lower levels of the atmosphere. Substantially smaller changes are simulated during
the monsoon season of 2012 (Fig. 3d) due to the much smaller aerosol loadings and their location at higher
altitudes. A thicker and broader ATAL over the Indian region due to aerosol enhancement during El Niño was
m−2 and negative heating rate anomalies of up to −0.05 K.
shown to lead to a reduction of solar flux of up to −5 W
−1 7
day over North I ndia .
Reduction in Indian summer monsoon precipitation
MPI-ESM simulated anomalies in precipitation (Vol-CTL) indicate that volcanic aerosols injected by the Nabro
eruption have induced a reduction precipitation over the Indian region by −4.6% (−4.85 mm day−1) in 2011
monsoon and −2.5% (−3.12 mm day−1) in 2012 monsoon (Fig. 4). Precipitation reductions by −5.0% in 2011
monsoon and −2.7% in 2012 monsoon in comparison with the climatology (1981–2015) are also evident from
the Global precipitation climatology project (GPCP) analysis of precipitation. India Meteorological Department
(IMD) precipitation data also show a reduction in precipitation of −4.0% in 2011 monsoon and −1.1% in 2012
monsoon compared to the climatology (1950–2015) (Fig. 4). The weekly departures of precipitation changes
(deviation from normal rainfall) of these measurements, when averaged over the Indian region, further show
reduction in rainfall in 2011 and 2012 monsoon (Fig. S2b,c). However, the Tropical Rainfall Measuring Mission
(TRMM) rainfall data show an increase in precipitation of 4.0% in 2011 and a reduction of −0.9% in 2012 in
comparison with the climatology (1998–2015) (Fig. 4). It should be noted however that TRMM data have a sub-
stantial bias (65%) over the Indian land mass in comparison with IMD rain gauge data54. Also, TRMM data show
large biases over the Himalayas in comparison to India meteorological rain gauge data55. We have also obtained
changes in rainfall in the 2011 and 2012 monsoon season in comparison with the climatology (1998–2015) over
the Indian region, which excludes the Himalayas and Western Ghats (80E—93° E; 8 N–27° N). This region shows
a reduction in rainfall in the monsoon season of 2011 (−0.59%) and 2012 (−4.2%). Importantly, the MPI-ESM
simulations captured the rainfall reduction in the monsoon seasons of 2011 and 2012.
Scientific Reports | (2021) 11:2714 | https://doi.org/10.1038/s41598-021-81566-0 5
Vol.:(0123456789)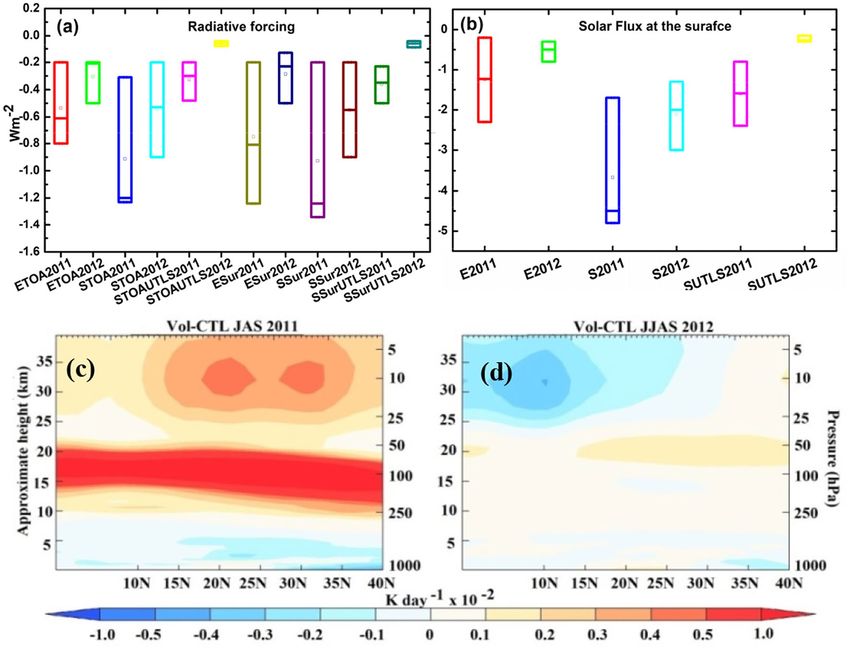
www.nature.com/scientificreports/
Figure 4. Distribution of anomalies (Vol-CTL) of rainfall (%) (averaged for 78–93°E, 8–35°N and for monsoon
2011 (July–September) and monsoon 2012 (June–September) from MPI-ESM represented as E2011, E2012;
Global Precipitation Climatology Project (GPCP) (precipitation of monsoon 2011/2012—climatology of
1981–2015), India Meteorology Department (IMD) data (precipitation of monsoon 2011/2012—climatology of
1950–2015) (Figure created using Origin (OriginLab, Northampton, MA)).
Figure 5. Anomalies (Vol-CTL) in temperature of sea water (K) from MPI-ESM (a)-(t) from July 2011 to
February 2013. (Figure created using the COLA/GrADS software).
Thus, our model simulates volcanic aerosol induces El Niño like warming in the central Pacific in 2011
(reduced La Niña signal) and in 2012 (strengthened El Niño condition) (Figs. 5a–t, S3) and El Niño is known to
cause reduction in ISMR4 (discussed in “Association of volcanic eruptions with ENSO” section). The precipitation
reduction is higher in the 2011 monsoon season than in 2012. During 2011, the Nabro volcano injected aerosols
into the monsoon anticyclone, which formed a thicker aerosol layer extending from the upper troposphere to
the lower stratosphere (150 hPa to 30 hPa) over the Indian region. In contrast, in 2012, the volcanic aerosol layer
was thinner and located in the lower stratosphere above the thin ATAL. A thicker aerosol layer in 2011 results in
a stronger reduction of solar insolation reaching the surface than in 2012, the stronger negative radiative forcing
in 2011 prompts a stronger tropospheric cooling in 2011 than the thin layer in 2012 (as discussed in “Radiative
impacts and surface cooling” section). Thus, the precipitation decrease in 2012 can for the most part be attributed
Scientific Reports | (2021) 11:2714 | https://doi.org/10.1038/s41598-021-81566-0 6
Vol:.(1234567890)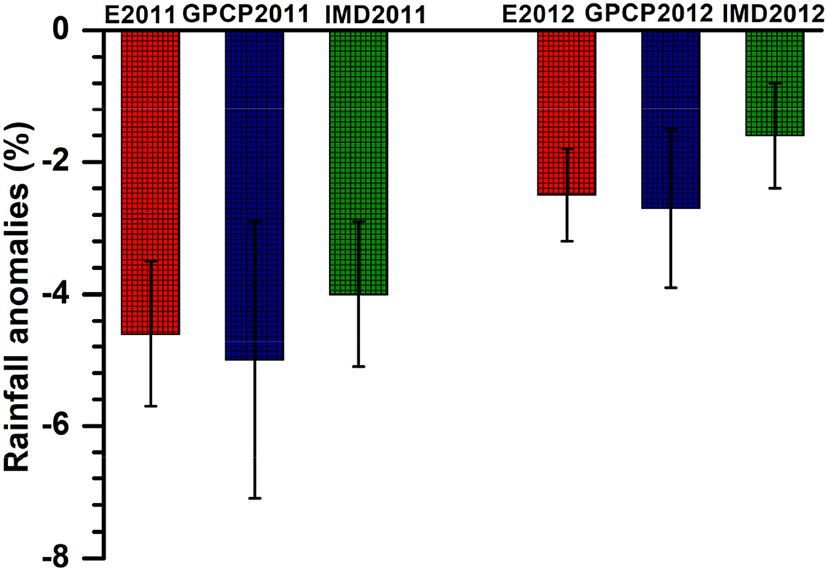
www.nature.com/scientificreports/
to the anomalous subsidence because of El Niño. Here, the thin layer of aerosol located in the lower stratosphere
in 2012, has less effect on solar inhibition. Thus solar dimming by the thicker aerosol layer (extending from 150
to 30 hPa) in the year of eruption causes a higher precipitation decrease than the following El Niño year (2012).
Sulfate geoengineering studies also show a reduction in Indian summer monsoon precipitation due to aerosol
dimming and dynamical changes caused by stratospheric heating induced by the injected aerosol19,21, e.g. an
8.5% (0.53 mm.day−1) reduction in precipitation was reported21. Our MPI-ESM simulations show that volcanic
sulfate aerosols cause stratospheric heating and tropospheric cooling, which further leads to dynamical changes
resulting in the precipitation reduction in 2011 and 2012. These are due to (1) the anomalous reversal of the
monsoon Hadley circulation (Fig. S4a,b), which is also seen in NCEP data (Fig. S4c,d), (2) weakening of the
low-level jet (Fig. S4c,d), (3) enhanced outgoing longwave radiation (OLR) (Fig. S4e,f) and (4) enhanced stability
in the upper troposphere (Fig. S4g,h).
Association of volcanic eruptions with ENSO
Stratospheric aerosols from explosive tropical volcanic eruptions are known to cause an anomalous surface
cooling within two years following the eruption. This cooling can induce atmospheric Kelvin waves and drive
equatorial westerly wind anomalies over the western Pacific, thereby favouring El Niño conditions and short-
ening La-Niña periods32. Further, an El Niño signature after volcanic eruptions has been reported by several
previous studies8,32. Also, 350 years of records show a large number of El Niño episodes associated with volcanic
eruptions56.
El Niño is one of the most important atmospheric phenomena causing Indian droughts4. The Hadley Centre
Sea Ice and Sea Surface Temperature (HadISST) data indicate that while 2011 was a moderate La Niña year, there
was a clear El Niño signal in 2012 (Fig. S3). CMIP5 simulations show that a volcanic forcing tends to favour
an anomalous central Pacific warming that peaks during the year of the eruption and therefore produces an El
Niño like signal irrespective of the ENSO p reconditioning32. Our MPI-ESM simulation (Vol-CTL) for the Nabro
eruption further confirms warming in the central Pacific in 2011 and 2012 (Fig. 5). The warming was relatively
weak during in 2011 and 2012 monsoons. It further strengthened in the winter season in 2011 and 2012 (from
November 2011 to January 2012 and December 2012—February 2013) (Fig. 5). The warming induced by the
Nabro eruption weakens the La-Niña condition in 2011 and strengthens the El Niño in 2012 (Figs. 5 and S3).
Our analysis indicates that the surface cooling over the Indian region induced by the layer of Nabro aerosols
caused an atmospheric westerly wind anomaly in the central Pacific in July 2011 after the eruption (Fig. 6a).
This wind anomaly resulted in downwelling equatorial oceanic Kelvin waves through air-sea interactions and
eventually drove a surface warming in the central Pacific during July 2011 to February 2013 (Fig. 6b–d). This is
consistent with analysis from CMIP5 simulations that showed how large volcanic eruptions can induce cooling
in tropical Africa, i.e. the volcanically induced atmospheric cooling produced a Kelvin wave, driving an El Niño
like warming in the P acific32. Interestingly, El Niño like warming by Kelvin wave dissipation is stronger in the
second year after the eruption32. In agreement to this, our model simulations (Vol-CTL) also show warming due
to Kelvin wave dissipation triggered by the eruption (Niño 3.0 and Niño 3.4 regions) is stronger in the following
year (monsoon and winter seasons in 2012) than the year of volcanic eruption (monsoon and winter seasons in
2012) (Figs. 5, 6d). A clear signal of El Niño like warming in 2011 and 2012 is also seen in Fig. 6d, it weakens La
Nina features in 2011 and strengthens the El Nino features in 2012 (Fig. S3).
El Niño is known to induce anomalous large scale subsidence over the Indian region associated with a sub-
dued precipitation4. The simulated (Vol-CTL) effect of the volcanic eruption on the regional circulation shows
subsidence associated with a descending branch of the Walker circulation over the Indian region during the
2011 and 2012 monsoons (Fig. S5a,b). This is caused by the volcanically induced warming in the central Pacific.
The model simulations also show a weakening of the Hadley circulation in monsoon seasons of 2011 and 2012
(Fig. S4a,b) in agreement with reanalysis data (Fig. S4c,d). Thus we can infer the role of volcanically induced El
Niño like warming in the central Pacific inducing the subsidence over the Indian region during the 2011 and
2012 monsoons.
Data records show that 49% (26 out of 53) of the moderate to large tropical volcanic eruptions during
1871–2016 have been associated with El Niño conditions within two years after the eruption and have caused
droughts over India (Fig. 1 and Table S1). We argue that these moderate to large volcanic eruptions are linked
to a reduction in monsoon precipitation for two consecutive years through a series of connected mechanisms:
(i) thickening of the ATAL over India; (ii) formation of a thick layer of volcanic aerosol above the ATAL extend-
ing to the stratosphere, i.e. a double blanket; (iii) this double blanket effect due to additional volcanic plumes
weakens the monsoon circulation via dynamical changes caused by the stratospheric heating and by its radiative
cooling effect in the troposphere; (iv) the tropospheric cooling induces atmospheric Kelvin waves, which lead
to warming in the central Pacific through air-sea interaction; (v) it also reduces La Niña features (e.g. following
the Nabro eruption in 2011) and strengthens El Niño like conditions (e.g. in 2012), (vi) the El Niño favoured
subsidence further exacerbates drought conditions in India (see Fig. 7). The precipitation reduction is higher
in the year of the eruption due to the formation of a thick aerosol layer extending from the upper troposphere
to the lower stratosphere in addition to the subsidence associated with the El Niño like warming. The year fol-
lowing the year of eruption continues as a drought year because of the stronger El Niño like warming compared
to the previous year.
Summary
This study highlights the role of tropical volcanic eruptions in enhancing the aerosol loading in the UTLS and
reducing the Indian monsoon precipitation. This reduction occurs due to solar dimming and dynamical inter-
actions through the weakening of the monsoon Hadley circulation and the low-level monsoon jet as well as by
Scientific Reports | (2021) 11:2714 | https://doi.org/10.1038/s41598-021-81566-0 7
Vol.:(0123456789)www.nature.com/scientificreports/
Figure 6. (a) Anomalies (Vol-CTL) in ocean eastward velocity (m s−1) averaged for 2°S–2°N, (b) Power
spectral density plot of anomalies (Vol-CTL) in zonal wind stress (Pa) averaged for 2°S–2°N and 140° W, it
indicates the Kelvin waves with dominant periodicity of 70–100 days during July 2011 to January 2013, (c)
Eastward propagating Kelvin waves near the equator (averaged for 2°S–2°N) after application of band pass
filter (70–100 days) on anomalies (Vol-CTL) in zonal wind stress (Pa), (d) Seasonal mean anomalies (Vol-CTL)
in surface temperature of sea water (K) at the Niño 3 (5°S to 5°N, 150 W and 90 W) and Niño 3.4 (170°W to
120°W, 5°S to 5°N) regions. M2011 represents as 2011 monsoon (JAS 2011), W2011 as 2011 winter (December
2011-Feb2012), M2012 as 2012 monsoon (JJAS 2012), and W2012 as 2012 winter (December 2012-Feb2013).
Bars in panel (d) correspond to minimum, mean, maximum values. Figure (a–d) are from the MPI-ESM model
simulations (Figure created using the COLA/GrADS software).
enhancing the stability of the upper troposphere. Volcanic eruptions may further cause a reduction of La Niña
signals or induce an El Niño signal over the tropical Pacific, thus reducing the Indian summer monsoon pre-
cipitation. The changes in the aerosol loading in the UTLS induced by volcanic eruptions resemble to a certain
extent those caused by intentional injections of stratospheric aerosol (or aerosol precursors) to compensate
for atmospheric C O2 increase19,21. Our results are thus also relevant for assessing the impact of solar radia-
tion management (SRM) geoengineering, which could exacerbate droughts in the Indian region. Further, an
increasing trend in anthropogenic SO2 emissions (~ 4.8% per year) over the South Asian region due to enhanced
industrialisation and biomass burning also leads to an increase in sulphate aerosols, which are transported to
the lower stratosphere by the Asian monsoon convection57. This impact of increasing anthropogenic aerosol is
also enhanced intermittently by episodic volcanic eruptions, which are injecting aerosol precursors and sulphate
aerosols directly into the lower stratosphere. Such eruptions lead to large aerosol loadings in the lowermost
stratosphere, with an important associated contribution to radiative f orcing31. Satellite measurements (CALIPSO,
SAGE II, GOMOS, and OSIRIS) confirm the rising trend in the stratospheric aerosol loading during 2002–2010,
which is mainly driven by a series of moderate but increasingly intense volcanic eruptions primarily at tropical
latitudes25. There are ~ 1500 active volcanoes worldwide58, including Asia (253), Japan (100), Africa (152), the
maritime continent (127), United States of America (71), and Canada (21) (https://www.volcan odisc overy .com).
They can significantly amplify the dimming already caused by the anthropogenic aerosol concentration over the
South Asian monsoon region, which will affect the hydroclimate of the Asian region. Hence, along with other
key factors, tropical volcanic eruptions are important contributors influencing Indian droughts with substantial
socio-economic implications.
Scientific Reports | (2021) 11:2714 | https://doi.org/10.1038/s41598-021-81566-0 8
Vol:.(1234567890)www.nature.com/scientificreports/
Figure 7. A schematic of the impact of volcanic eruptions on monsoon precipitation: (a) normal monsoon with
a strong Hadley circulation, (b) Nabro volcanic aerosol leading to a thick aerosol layer in the UTLS comprising
of the ATAL, which reflects more solar radiation leading to a weak Hadley circulation (anomalous; denoted with
sign reversal and dotted lines) and a reduction in rainfall. (c) The tropospheric cooling induced by the thicker
ATAL (as in volcano year, "b") induces an El Niño in the following year (through anomalous atmospheric Kelvin
and Rossby waves (shown as a blue wave in “b”), which induce a westerly wind burst (black wave) and produce
an El Niño through downwelling Kelvin waves (shown in white colour)). However, the reduced aerosol layer
lets pass more sunlight compared to the year of the eruption, but the El Niño weakens the Hadley circulation
(anomalous; shown in lines [since it is less reduction than in the year of the eruption] with the inverted arrow)
and retains the deficit rainfall condition. The SST patterns intend to indicate the normal and El Niño condition
over the Pacific, rest of the oceanic basins are kept the same in all maps for illustration purpose (and are not
connected with our simulations). Maps are prepared using NCL and 3D impact and schematic structures made
utilizing Adobe illustrator.
Methods
Model description and experimental setup. To understand the impact of the Nabro volcanic aerosol
on Indian summer monsoon precipitation we employed a two-step method, where the radiative properties of
Scientific Reports | (2021) 11:2714 | https://doi.org/10.1038/s41598-021-81566-0 9
Vol.:(0123456789)www.nature.com/scientificreports/
the aerosol plume were first simulated with an aerosol-chemistry-climate model and then implemented as pre-
scribed fields into a state-of-the-art Earth System Model. The ECHAM6-HAMMOZ aerosol-chemistry-climate
model was used for the Nabro volcanic plume simulations. The model comprises of an atmospheric general
circulation module (ECHAM6.3), a tropospheric chemistry module (MOZ1.0), and an aerosol module, namely
the Hamburg Aerosol Model (HAM2.3)59,60. The model parametrisation and other details are documented in
previous studies57. Aerosol microphysics is simulated by the Sectional Aerosol module for Large Scale Applica-
tions (SALSA) module61, where the aerosol size distribution is described by 10 size sections for soluble and 7 size
sections for insoluble particles. The model simulations were performed at a spectral resolution T63 correspond-
ing to 1.875° × 1.875° in horizontal and 47 vertical levels from the surface to 1 hPa with a time step of 20 min.
The anthropogenic and fire emissions of sulfate, black carbon (BC) and organic carbon (OC) are based on the
AEROCOM-ACCMIP-II emission inventory62. We performed Nabro volcano and control simulations starting
from 1 to 10 January 2011 to obtain a 10-member ensemble mean. These simulations end on 31 December 2013
(Table S3). In all 10 members of Vol simulations 1.5 Tg of S O2 was injected at 42° E, 13° N on 12 June 2011. The
plume was equally distributed between 10 and 17 km. It should be noted that the anthropogenic aerosols are the
same in the Vol and CTL simulations. Therefore the difference in radiative effect obtained from Vol and CTL
simulations correspond to volcanic aerosol effects.
To estimate rainfall we performed experiments with the MPI-ESM63. This model couples the atmosphere,
ocean and land surface through the exchange of energy, momentum, and water, which allows changes in SSTs,
temperature of sea water and signature of El-Niño and La Niña to be estimated. The model consists of the
atmospheric general circulation model E CHAM664 and the MPI Ocean Model (MPI-OM65). MPI-OM applies
a conformal mapping grid with a horizontal resolution ranging from 22 to 350 km. The ocean model includes a
Hibler-type dynamic–thermodynamic sea ice model with viscous–plastic r heology66. Ocean and atmosphere are
coupled daily without flux corrections using the Ocean–Atmosphere Sea Ice Soil, version 3 (OASIS3) coupler67.
The version of MPI-ESM used in this study does not simulate aerosols explicitly. To study climate impacts of the
Nabro volcanic eruption, the aerosol properties from ECHAM6-HAMMOZ simulations were implemented to
MPI-ESM as prescribed fields. The method is the same as68. The aerosol optical depth, single-scattering albedo,
and the asymmetry factor were archived for 14 shortwave bands and absorption AOD in 16 longwave bands of
radiative transfer model of ECHAM6-HAMMOZ. Then the aerosol radiative properties were implemented as
3D fields to MPI-ESM as monthly ensemble mean values. To include only upper tropospheric and stratospheric
aerosols from the Nabro volcanic eruption, the lowest 14 model level (up to 4–6 km altitude) of aerosols fields
of ECHAM6-HAMMOZ simulations were excluded and default MPI-ESM tropospheric aerosols69 were used
instead. The same T63L47 atmospheric resolution was used in MPI-ESM simulation, as in ECHAM6-HAMMOZ.
Simulations were based on Representative Concentration Pathway 4.570 scenario and started from the year 2011
and continued until the end of the year 2013. Ten ensemble members were simulated to both CTL and Vol
scenarios (Table S3).
The offline model estimates for the volcanic sulphate aerosol direct radiative forcing and associated changes to
heating rates were calculated with the SOCRATES radiative transfer m odel47,48 with 6 shortwave and 9 longwave
bands, using the CLASSIC aerosol s cheme71.
Observations and reanalysis data. Aerosol Optical Depth (AOD) measurements from two satellites
(1) Multi-Angle Imaging Spectroradiometer (MISR) (https://misr.jpl.nasa.gov/getData/accessData/)72, and (2)
CALIPSO27 (https://misr.jpl.nasa.gov/getData/accessData/), from July 2011 to December 2012 were used in this
study. (https://eosweb.larc.nasa.gov/project/calipso/calipso_table).
We used zonal and meridional wind data from the National Centre for Environmental Prediction (NCEP)
reanalysis, available for the period 1948–2016. Rainfall data sets used are from India Meteorology department
(IMD) for the period 1871–2016, Tropical Rainfall Measuring Mission (TRMM) daily rainfall data (3B42) for the
period 1998–2015 (https://gpm.nasa.gov/data-access/downloads/trmm) and Global Precipitation Climatology
Project (GPCP) containing data from rain gauge stations, satellites, and sounding observations for the period
1981–2015 (https://climatedataguide.ucar.edu/climate-data/gpcp-monthly-global-precipitation-climatolog
y-project). Hadisst data were used for the period 1980–2016 (https://climatedataguide.ucar.edu/climate-data/
sst-data-hadisst-v11). We considered the occurrence of strong El Niño during the years 1876, 1877, 1888, 1891,
1896, 1899, 1900, 1902, 1904, 1911, 1913, 1918, 1925, 1930, 1935, 1944, 1951, 1957, 1965, 1968, 1972, 1976, 1982,
1987, 1991, 1997, 2002, 2006, 2009 and 2015. The large volcanic eruption (VEI ≥ 3), the El Niño condition follow-
ing within two years and the Indian droughts are tabulated in Tables S1 and S2. In our analysis, we considered a
monsoon season of the co-occurring El Niño year since correlations between Indian summer monsoon rainfall
and Niño-3.4 index exhibits a maximum negative correlation for a zero-lag y ear73.
Evaluation simulated precipitation with rain gauge measurements. Figure S6a–h shows distribu-
tions of simulated precipitation (MPI-ESM Vol simulation), IMD measurements, TRMM satellite retrievals, and
GPCP data for the monsoon in 2011 (July –September) and 2012 (June–September). There is large spatial varia-
tion in precipitation among the data sets although all data sets show similar spatial patterns (e.g., higher rainfall
at Southern slopes of Himalayas, Western Ghats and Indo Gangetic plains). We quantify the difference in simu-
lated precipitation with respect to IMD, and GPC data over India (78–93°E, 8–35°N) (see Fig. S6i). The model
underestimates precipitation compared to IMD by 0.9 mm.day−1 (Vol: 7.6 mm.day−1; IMD: 8.5 mm.day−1) in
2011 and 1.0 mm.day−1 (Vol: 7.0 mm.day−1, IMD: 8.0 mm.day−1) in 2012. Also, simulated rainfall is higher than
GPCP by 1.1 mm.day−1 (Vol: 8.5 mm.day−1, GPCP: 7.4 mm.day−1) in 2011 and by 1.3 mm.day−1 (Vol: 8.0 mm.
day−1, GPCP: 6.7 mm.day−1) in 2012. Figure S6i shows that the model underestimates rainfall in comparison
with IMD and overestimates GPCP over the Indian landmass.
Scientific Reports | (2021) 11:2714 | https://doi.org/10.1038/s41598-021-81566-0 10
Vol:.(1234567890)www.nature.com/scientificreports/
At the Southern slopes of the Himalayas the model overestimates precipitation by 2.3 mm.day−1 than GPCP
and at Western Ghats it underestimates by 6.2 mm.day−1 in comparison with IMD and by 4.1 mm.day−1 in com-
parison with GPCP. These model deficiencies may be due to the fine orthography of these regions which is not
well represented in MPI-ESM due to its coarse resolution. An accurate monsoon simulation is still a challenge
even with high-resolution climate models2. There are uncertainties in the model due to transport processes,
employed emission inventory, and various parametrisations7,57. Importantly, there are differences between the
observational data sets, IMD, and GPCP as well. These differences may be due to different techniques of meas-
urements, while IMD uses a network of rain gauge station measurements and GPCP combines measurements
from rain gauge stations, satellites, and sounding observations. However, the limitations for the model results
are the same in CTL and Vol simulations and generate monsoon precipitation reduction (Vol-CTL) (Fig. S7).
Similarly IMD and GPCP also show precipitation reduction over the Indian region in monsoon 2011 and 2012
(Fig. S7). Considering fair performance of the model in simulating precipitation over India we proceed care-
fully employing model results for understanding the impact of the Nabro volcanic eruption in Indian summer
monsoon precipitation.
Evaluation of NABRO AOD and plume. Figure S8a–d shows the distribution of total AOD from MISR
observations and ECHAM6-HAMMOZ (Vol) simulations. It shows that the model could simulate the spatial
pattern of high amounts of aerosols over the Indo-Gangetic Plain and Mongolia desert, although the AOD is
underestimated by ~ 0.07 in the model.
The comparison of the simulated enhancement of AOD with observations at various locations also shows
reasonable agreement. Our simulations show an enhancement of AOD in the UTLS in a grid at Eritrea of ~ 0.08
on 25th June 2011, which is in agreement with observations, e.g., lidar measurements in Korea, Japan, and China
that show an increase in UTLS AOD of ~ 0.07 during June 2 01139,40. An increase in AOD ~ 0.012–0.03 between
12 and 20 km over Asia has also been reported in the past41 using CALIPSO measurements during 16–31 July
2011. CALIPSO satellite observations also show an increase in global mean AOD by ~ 0.01 in the UTLS in June
2011 due to the Nabro e ruption31.
Further, we analyse the dispersion of aerosols in the UTLS. Figure S9a–d shows anomalies of sulfate aerosols
(Vol-CTL) depicting the progression of simulated sulfate aerosol plume during 14–20 June 2011 at an altitude of
12–16 km. Figure S9a shows that on 14 June the sulphate aerosol plume was entrained in the south westerly flow
over the Middle East on the northwest. On 20th June 2011, the plume circumnavigated the Asian anticyclone
(Fig. S9d). The aerosol concentration is mostly located in the northern hemisphere. Aerosol measurements
from the MIPAS satellite on the same days, filled with Lagrangian trajectory traces calculated by MPTRAC from
measurements within ± 3 days driven by ERA5 data, indicate a similar progression of the NABRO plume during
14 –20 June (Fig. S9e–h). A similar distribution and progression of the Nabro plume is seen in CALIPSO and
AIRS observations30. The simulated zonal spread of the aerosol in the UTLS (16–20 km) also shows reasonable
agreement with the aerosol observations from MIPAS satellite (Fig. S9i–l).
Received: 22 July 2020; Accepted: 6 January 2021
References
1. Cook, E. R. et al. Asian monsoon failure and mega drought during the last millennium. Science 328, 486–490 (2010).
2. Krishnan, R. et al. Deciphering the desiccation trend of the South Asian monsoon hydroclimate in a warming world. Clim. Dyn.
47, 1007–1027 (2016).
3. Mishra, V. et al. Drought and famine in India 1870–2016. Geophys. Res. Lett. 46, 2075–2083 (2019).
4. Kumar, K. K., Soman, M. K. & Kumar, K. R. Seasonal forecasting of Indian summer monsoon rainfall: a review. Weather 50,
449–467 (1995).
5. Paul, S. et al. Weakening of Indian summer monsoon rainfall due to changes in land use land cover. Sci. Rep. 6(32177), 1–10 (2016).
6. Ramanathan, V. et al. Atmospheric brown clouds: impacts on South Asian climate and hydrological cycle. Proc. Natl. Acad. Sci.
USA 102, 5326–5333 (2005).
7. Fadnavis, S. et al. Elevated aerosol layer over South Asia worsens the Indian droughts. Sci. Rep. 9(10268), 1–11 (2019).
8. Paik, S. et al. Volcanic-induced global monsoon drying modulated by diverse El Niño responses. Sci. Adv. 6, eaba1212 (2020).
9. Liu, F. et al. Global monsoon precipitation responses to large volcanic eruptions. Sci. Rep. 6(24331), 1–11 (2016).
10. Zuo, M. et al. Hydroclimate responses over global monsoon regions following volcanic eruptions at different latitudes. J. Clim. 32,
4367–4385 (2019).
11. Haywood, J. M., Jones, A., Bellouin, N. & Stephenson, D. Asymmetric forcing from stratospheric aerosols impacts Sahelian drought.
Nat. Clim. Change 3, 660–665 (2013).
12. Paik, S. & Min, S. K. Assessing the impact of volcanic eruptions on climate extremes using CMIP5 models. J. Clim. 31, 5333–5349
(2018).
13. Iles, C. E. & Hegerl, G. C. Systematic change in global patterns of streamflow following volcanic eruptions. Nat. Geosci. 8, 838–842
(2015).
14. Trenberth K. E. and Dai A., Effects of Mount Pinatubo volcanic eruption on the hydrological cycle as an analog of geoengineering,
Geophys. Res. Let. L15702, (2007).
15. Man, W., Zhou, T. & Jungclaus, J. H. Effects of large volcanic eruptions on global summer climate and East Asian monsoon changes
during the last millennium: analysis of MPI-ESM simulations. J. Clim. 27, 7394–7409 (2014).
16. Colose, C. M., LeGrande, A. N. & Vuille, M. Hemispherically asymmetric volcanic forcing of tropical hydroclimate during the last
millennium. Earth Syst. Dyn. 7, 681–696 (2016).
17. Liang, E. et al. Strong link between large tropical volcanic eruptions and severe droughts prior to monsoon in the central Himalayas
revealed by tree-ring records. Sci. Bull. 64(14), 1018–1023 (2019).
18. Shi, F., Li, J. & Wilson, R. J. S. A tree-ring reconstruction of the South Asian summer monsoon index over the past millennium.
Sci. Rep. 4, 1–8 (2014).
Scientific Reports | (2021) 11:2714 | https://doi.org/10.1038/s41598-021-81566-0 11
Vol.:(0123456789)www.nature.com/scientificreports/
19. Tilmes, S. et al. The hydrological impact of geoengineering in the Geoengineering Model Intercomparison Project (GeoMIP). J.
Geophys. Res. Atmos. 118, 11036–11058 (2013).
20. Robock, A., Oman, L. & Stenchikov, G. L. Regional climate responses to geoengineering with tropical and Arctic S O2 injections.
J. Geophys. Res. Atmos. 113, 1–15 (2008).
21. Simpson, I. et al. The regional hydroclimate response to stratospheric sulfate geoengineering and the role of stratospheric heating.
J. Geophys. Res. Atmos. 124, 12587–12616 (2019).
22. Tilmes, S. et al. CESM1 (WACCM) Stratospheric Aerosol Geoengineering Large Ensemble (GLENS) Project. Bull. Am. Meteorol.
Soc. 99, 2361–2371 (2018).
23. Kravitz, B. et al. Comparing surface and stratospheric impacts of geoengineering with different SO2 injection strategies. J. Geophys.
Res. Atmos. 124, 7900–7918 (2019).
24. Berthet, G. et al. Impact of a moderate volcanic eruption on chemistry in the lower stratosphere: balloon-borne observations and
model calculations. Atmos. Chem. Phys. 17, 2229–2253 (2017).
25. Vernier, J.-P. et al. Major influence of tropical volcanic eruptions on the stratospheric aerosol layer during the last decade. Geophys.
Res. Lett. 38, L12807 (2011).
26. Ridley, D. A. et al. Total volcanic stratospheric aerosol optical depths and implications for global climate change. Geophys. Res.
Lett. 41, 7763–7769 (2014).
27. Vernier, J.-P., Thomason, L. W. & Kar, J. CALIPSO detection of an Asian tropopause aerosol layer. Geophys. Res. Lett. 38, L07804
(2011).
28. Vernier, J. P. et al. BATAL: The balloon measurement campaigns of the Asian tropopause aerosol layer. Bull. Am. Meteorol. Soc.
99, 955–973 (2018).
29. Vernier, J. P. et al. Increase in upper tropospheric and lower stratospheric aerosol levels and its potential connection with Asian
pollution. J. Geophys. Res. Atmos. 120, 1608–1619 (2015).
30. Fairlie, T. D., Vernier, J. P., Natarajan, M. & Bedka, K. M. Dispersion of the Nabro volcanic plume and its relation to the Asian
summer monsoon. Atmos. Chem. Phys. 14, 7045–7057 (2014).
31. Andersson, S. M. et al. Significant radiative impact of volcanic aerosol in the lowermost stratosphere. Nat. Commun. 6, 1–8 (2015).
32. Khodri, M. et al. Tropical explosive volcanic eruptions can trigger El Ninõ by cooling tropical Africa. Nat. Commun. 8, 1–12 (2017).
33. Ashok, K., Guan, Z., Saji, N. H. & Yamagata, T. Individual and combined influences of ENSO and the Indian Ocean Dipole on the
Indian summer monsoon. J. Clim. 17, 3141–3155 (2004).
34. Wu, X., Griessbach, S. & Hoffmann, L. Equatorward dispersion of a high-latitude volcanic plume and its relation to the Asian
summer monsoon: a case study of the Sarychev eruption in 2009. Atmos. Chem. Phys. 17, 13439–13455 (2017).
35. Kripalani, R. H. & Kulkarni, A. Climatic impact of El Niño/La Niña on the Indian monsoon: a new perspective. Weather 52, 39–46
(1997).
36. Maher, N., McGregor, S., England, M. H. & Gupta, A. S. Effects of volcanism on tropical variability. Geophys. Res. Lett. 42,
6024–6033 (2015).
37. India, National Commission on Agriculture, Report of the National Commission on Agriculture, Govt. of India, Ministry of Agri-
culture and Irrigation New Delhi, pp1–247 (1976).
38. Clarisse, L. et al. Retrieval of sulphur dioxide from the infrared atmospheric sounding interferometer (IASI). Atmos. Meas. Technol.
5, 581–594 (2012).
39. Zhuang, J. & Yi, F. Nabro aerosol evolution observed jointly by lidars at a mid-latitude site and CALIPSO. Atmos. Environ. 140,
106–116 (2016).
40. Griessbach, S. et al. Aerosol and cloud top height information of Envisat MIPAS measurements. Atmos. Meas. Tech. 13, 1243–1271
(2020).
41. Noh, Y. M., Shin, D. H. & Müller, D. Variation of the vertical distribution of Nabro volcano aerosol layers in the stratosphere
observed by LIDAR. Atmos. Environ. 154, 1–8 (2017).
42. Sawamura, P. et al. Stratospheric AOD after the 2011 eruption of Nabro volcano measured by lidars over the Northern Hemisphere.
Environ. Res. Lett. 7, 034013 (2012).
43. Pitari, G. et al. Stratospheric aerosols from major volcanic eruptions: A composition-climate model study of the aerosol cloud
dispersal and e-folding time. Atmosphere (Basel) 7, 75 (2016).
44. Minnis, P. et al. Radiative climate forcing by the Mount Pinatubo eruption. Science 259, 1411–1415 (1993).
45. Robock, A. & Mao, J. The volcanic signal in surface temperature observations. J. Clim. 8, 1086–1103 (1995).
46. Myhre, G. et al. Anthropogenic and natural radiative forcing. In T. F. Stocker, D. Qin, G.-K. Plattner, M. Tignor, S. K. Allen, J.
Boschung, et al. (Eds.), Climate change 2013: The physical science basis. Contribution of Working Group I to the Fifth Assessment
Report of the Intergovernmental Panel on Climate Change, Cambridge, United Kingdom and New York, NY, USA: Cambridge
Univ. Press. pp. 659–740 (2013).
47. Edwards, J. M. & Slingo, A. Studies with a flexible new radiation code, I: choosing a configuration for a LargeScale Model. Q. J. R.
Meteorol. Soc. 122, 689–719 (1996).
48. Rap, A. et al. Natural aerosol direct and indirect radiative effects. Geophys. Res. Lett. 40, 3297–3301 (2013).
49. Robock, A. Volcanic eruptions and climate. Rev. Geophys. 38, 191–219 (2000).
50. Timmreck, C. Modeling the climatic effects of large explosive volcanic eruptions. Wiley Interdiscip. Rev. Clim. Chang 3, 545–564
(2012).
51. Parker, D. et al. The impact of Mount Pinatubo on world-wide temperatures. Int. J. Cliomtol. 16, 487–497 (1996).
52. Gregory, J. M., Andrews, T., Good, P., Mauritsen, T. & Forster, P. M. Small global-mean cooling due to volcanic radiative forcing.
Clim. Dyn 47, 3979–3991 (2016).
53. D’Arrigo, R. et al. The impact of volcanic forcing on tropical temperatures during the past four centuries. Nat. Geosci. 2, 1–56
(2009).
54. Pokarel, S. & Sikka, D. R. Variability of the TRMM-PR total and convective and stratiform rain fractions over the Indian region
during the summer monsoon. Clim. Dyn. 41, 21–44 (2013).
55. Bharti, V. & Singh, C. Evaluation of error in TRMM 3B42V7 precipitation estimates over the Himalayan region. J. Geophys. Res.
Atmos. 120, 12458–12473 (2015).
56. Adams, J. B., Mann, M. E. & Ammann, C. M. Proxy evidence for an El Niño-like response to volcanic forcing. Nature 426, 274–278
(2003).
57. Fadnavis, S. et al. The impact of recent changes in Asian anthropogenic emissions of SO2 on sulfate loading in the upper troposphere
and lower stratosphere and the associated radiative changes. Atmos. Chem. Phys. 19, 9989–10008 (2019).
58. Whelley, P. L., Newhall, C. G. & Bradley, K. E. The frequency of explosive volcanic eruptions in Southeast Asia. Bull. Volcanol. 77,
1 (2015).
59. Stier, P. et al. The aerosol-climate model ECHAM5-HAM. Atmos. Chem. Phys. 5, 1125–1156 (2005).
60. Emmons, L. K. et al. Description and evaluation of the Model for Ozone and Related chemical Tracers, version 4 (MOZART-4).
Geosci. Model Dev. 3, 43–67 (2010).
61. Kokkola, H. et al. SALSA2.0: the sectional aerosol module of the aerosol–chemistry–climate model ECHAM6.3.0-HAM2.3-
MOZ1.0. Geosci. Model Dev. 11, 3833–3863 (2018).
Scientific Reports | (2021) 11:2714 | https://doi.org/10.1038/s41598-021-81566-0 12
Vol:.(1234567890)You can also read