Slope failure and mass transport processes along the Queen Charlotte Fault Zone, western British Columbia
←
→
Page content transcription
If your browser does not render page correctly, please read the page content below
Downloaded from http://sp.lyellcollection.org/ by guest on October 8, 2018

Slope failure and mass transport processes along the Queen
Charlotte Fault Zone, western British Columbia
H. GARY GREENE1*, J. VAUGHN BARRIE2, DANIEL S. BROTHERS3,
JAMES E. CONRAD3, KIM CONWAY2, AMY E. EAST3, RANDY ENKIN2,
KATHERINE L. MAIER2, STUART P. NISHENKO4,
MAUREEN A. L. WALTON3 & KRISTIN M. M. ROHR2
1
 Moss Landing Marine Laboratories and Tombolo Mapping Laboratory,
 142 Anchor Rock Lane, Eastsound, WA 98245, USA
2
 Geological Survey of Canada (Pacific), 9860 West Saanich Road, Sidney,
 BC V8L 4B2, Canada
3
 US Geological Survey, Pacific Coastal and Marine Center, 2885 Mission Street,
 Santa Cruz, CA 95060, USA
4
 Pacific Gas & Electric Company, 77 Beale Street, San Francisco,
 CA 94105, USA
  J.E.C., 0000-0001-6655-694X; K.L.M., 0000-0003-2908-3340;
M.A.L.W., 0000-0001-8496-463X; K.M.M.R., 0000-0001-6347-712X
*Correspondence: greene@mlml.calstate.edu

Abstract: Multibeam echosounder (MBES) images, 3.5 kHz seismic-reflection profiles and piston cores
obtained along the southern Queen Charlotte Fault Zone are used to map and date mass-wasting events at
this transform margin – a seismically active boundary that separates the Pacific Plate from the North American
Plate. Whereas the upper continental slope adjacent to and east (upslope) of the fault zone offshore of the
Haida Gwaii is heavily gullied, few large-sized submarine landslides in this area are observed in the MBES
images. However, smaller submarine seafloor slides exist locally in areas where fluid flow appears to be occur-
ring and large seafloor slides have recently been detected at the base of the steep continental slope just above its
contact with the abyssal plain on the Queen Charlotte Terrace. In addition, along the subtle slope re-entrant area
offshore of the Dixon Entrance shelf bathymetric data suggest that extensive mass wasting has occurred in the
vicinity of an active mud volcano venting gas. We surmise that the relative lack of submarine slides along the
upper slope in close proximity to the Queen Charlotte Fault Zone may be the result of seismic strengthening
(compaction and cohesion) of a sediment-starved shelf and slope through multiple seismic events.

The Queen Charlotte–Fairweather (QC–FW) Fault                    techniques (Brothers et al. 2017, this volume, in
System is a major structural feature that extends                press).
from north of Vancouver Island, Canada to well                       In the south, the Queen Charlotte (QC) Fault Sys-
into the bight of the Gulf of Alaska (Fig. 1). This sys-         tem extends for over 350 km along the western mar-
tem represents a major transform boundary that sep-              gin of British Columbia and offshore of the Haida
arates the Pacific Plate from the North American                  Gwaii (formerly Queen Charlotte Islands) archipel-
Plate, similar to the San Andreas (SAF) Fault System             ago (Fig. 1). It is a near-vertical fault zone that is
of California (Atwater 1970; Plafker et al. 1978). The           seismically active down to approximately 21 km
length of the QC–FW fault system is 1330 km,                     (Hyndman & Ellis 1981) with a mainly right-lateral
slightly longer than the SAF, with an estimated                  transform motion of approximately 50–60 mm a−1
width of 1–5 km and approximately 75% of the                     (Prims et al. 1997; Rohr et al. 2000). Barrie et al.
length located offshore (Carlson et al. 1985).                   (2013) presented MBES data along the QC Fault
Recently, most of the fault zone through SE Alaska               Zone offshore of southern and central Haida Gwaii,
has been imaged in detail using multibeam                        which assisted with documenting the fault morphol-
echosounder (MBES) data and other geophysical                    ogy and identifying features associated with

From: LINTERN, D. G., MOSHER, D. C., MOSCARDELLI, L. G., BOBROWSKY, P. T., CAMPBELL, C., CHAYTOR, J. D., CLAGUE, J. J.,
GEORGIOPOULOU, A., LAJEUNESSE, P., NORMANDEAU, A., PIPER, D. J. W., SCHERWATH, M., STACEY, C. & TURMEL, D. (eds)
Subaqueous Mass Movements. Geological Society, London, Special Publications, 477,
https://doi.org/10.1144/SP477.31
© 2018 The Author(s). Published by The Geological Society of London. All rights reserved.
For permissions: http://www.geolsoc.org.uk/permissions. Publishing disclaimer: www.geolsoc.org.uk/pub_ethics
Downloaded from http://sp.lyellcollection.org/ by guest on October 8, 2018

                               H. G. GREENE ET AL.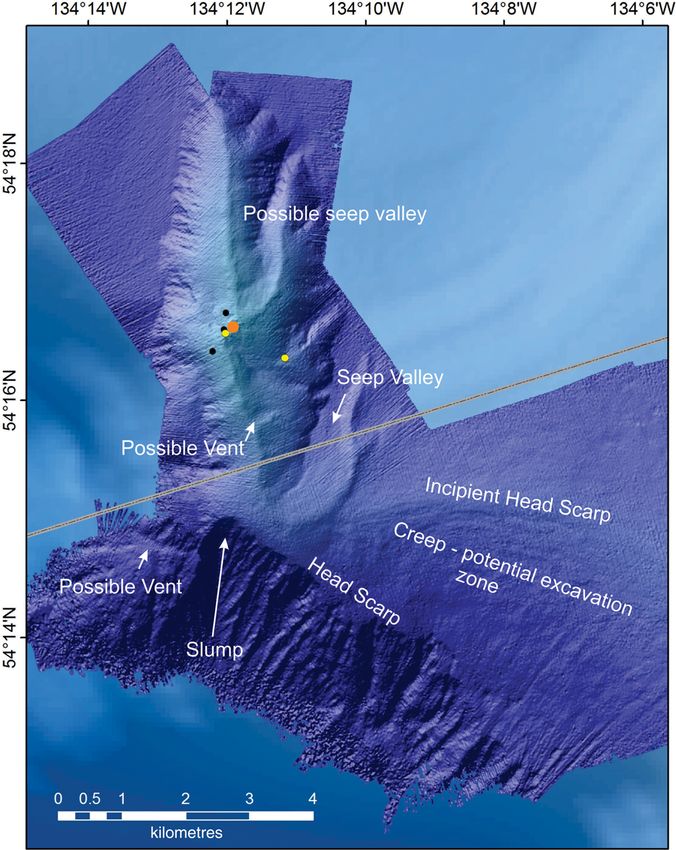
Downloaded from http://sp.lyellcollection.org/ by guest on October 8, 2018

                       MASS TRANSPORT ALONG QUEEN CHARLOTTE FAULT ZONE

localized deformation along the fault (e.g. step-            2017). The 2012 Haida Gwaii (MW 7.8) earth-
overs, submarine canyons, gullies and a submarine            quake involved slightly oblique thrust faulting on a
slide adjacent to the fault). This paper presents the        shallow-dipping fault plane whose strike is sub-
first detailed examination of mass-transport proces-          parallel to the QC Fault Zone (e.g. Lay et al. 2013).
ses evident along the QC Fault Zone south of the                 In addition, several other recent large earthquakes
USA (Alaska)–Canada International Boundary (Figs             have been reported along the fault zone (Page 1969;
1 & 2). In this companion paper to Brothers et al.           Carlson et al. 1985; Lisowski et al. 1987). This seis-
(this volume, in press), which describes mass-trans-         micity includes a shallow (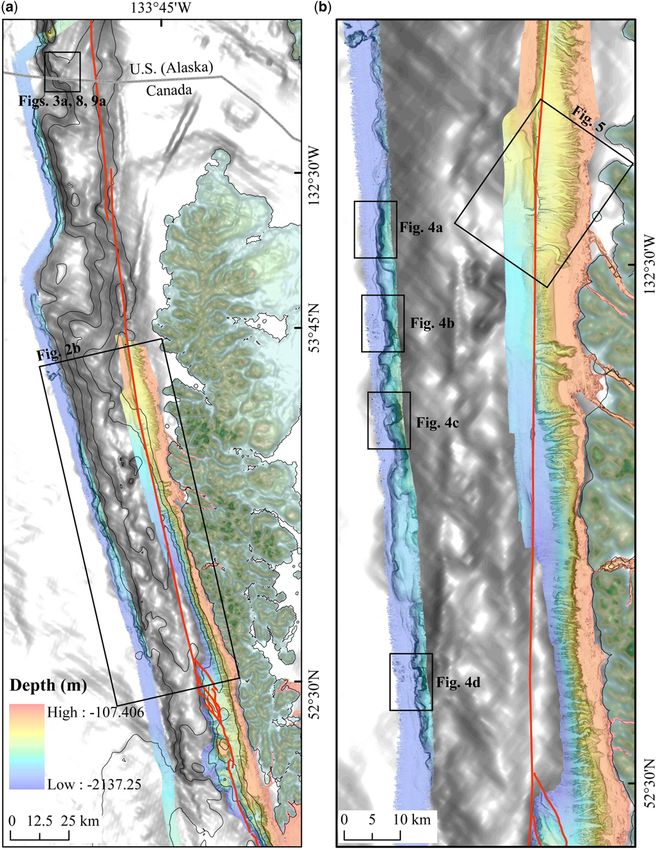
Downloaded from http://sp.lyellcollection.org/ by guest on October 8, 2018
H. G. GREENE ET AL.
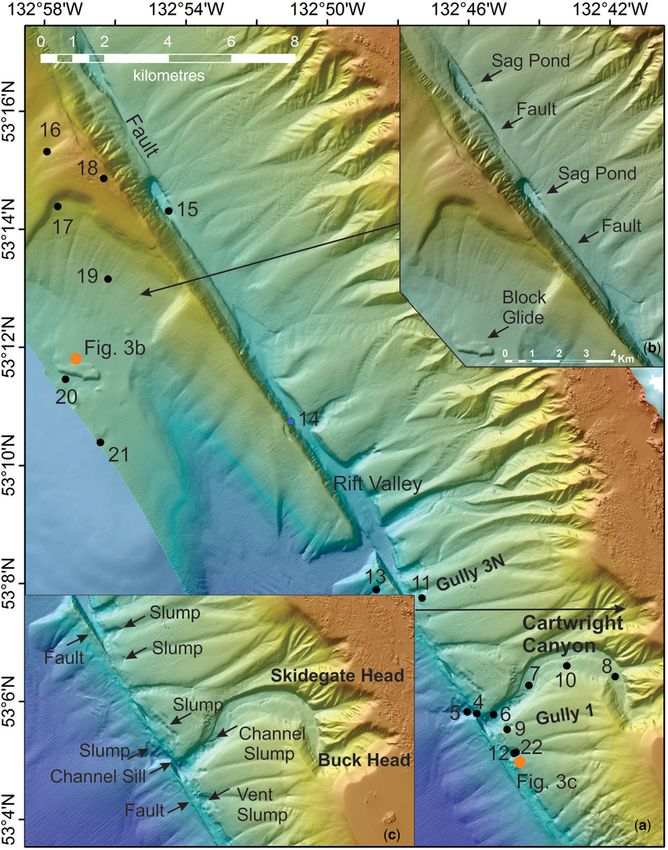
Fig. 2. Area of investigation offshore of western British Columbia, Canada: (a) map showing the location of the two
multibeam echosounder bathymetric datasets used in this study (blue, Sikuliaq bathymetry; multicoloured, Canadian
Hydrographic Services data; red line, QC Fault Zone; the white area at the top is Dixon Entrance; black-lined boxes
show the locations of figures); and (b) expanded view offshore of the central Haida Gwaii showing locations of
figures (black-outlined boxes).
(this volume, in press), which are characterized by Our area of study includes the continental margin
elongate ridgelines, very steep slopes (>30°) and geomorphic groups 4–6 that are described by Broth-
sediment bypass to the continental rise. ers et al. (this volume, in press, their figs 1 & 2) and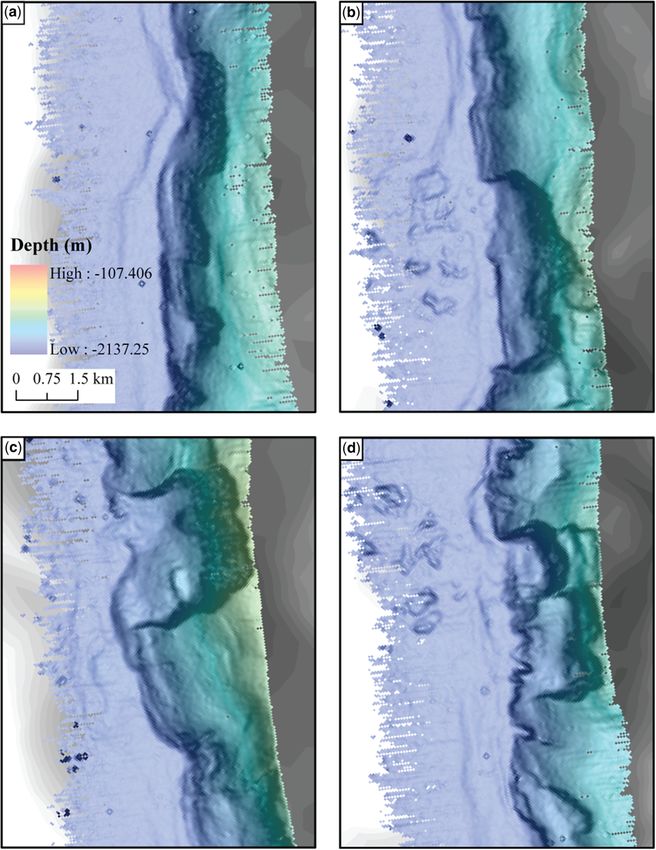
Downloaded from http://sp.lyellcollection.org/ by guest on October 8, 2018

                       MASS TRANSPORT ALONG QUEEN CHARLOTTE FAULT ZONE

which we summarize here. Group 4 extends from              Charlotte Terrace and lead to significant along-strike
Noyes Canyon to the northern tip of Haida Gwaii,           variation. The QC Fault Zone is located in water
which includes the Dixon Entrance Sea Valley               depths of between 600–2200 m. The largest slides
(Fig. 1). We consider Dixon Entrance to be one of          identified in Group 5 and Group 6 appear to be pref-
the major sediment routing pathways during the             erentially located along the western flank of the
Quaternary, although Lyles et al. (2017) and James         Queen Charlotte Terrace where the gradients exceed
Baichtal (pers. comm. 2017) present evidence that          15° (Brothers et al. this volume, in press, their fig. 2).
the major ice streams during the Last Glacial Maxi-        Similar to Group 3 and Group 4, the steep, rugged
mum (LGM) were north of Dixon Entrance with                and highly variable bathymetry to the west of
the predominant flow out through Chatham Strait,            Haida Gwaii contains few large slides, but displays
north of Noyes Canyon.                                     widespread evidence for mass-transport activity, par-
    The variation and complexity of the slope mor-         ticularly along the steep flanks of ridges and along
phology increase substantially towards the south           submarine canyon sidewalls.
from that in Group 4, which is just north of our               The maximum extent of glaciation in the Haida
study area, with more pronounced ridge crests that         Gwaii region occurred from approximately 16 to
appear to be associated with rugged, steep relief          15 ka, based on 14C radiometric age dating (Blaise
along the middle and lower slope. The ridgelines           et al. 1990), with deglaciation beginning around
are conjugate to the QC Fault Zone and create a            15 ka BP and marine ice-free areas occurring
series of elongate, margin-parallel topographical          approximately 13.5–13.0 ka (Barrie & Conway
boundaries that have step-like discontinuities every       1999). During the LGM, Haida Gwaii appears to
50–100 km. Small canyons and gullies emanating             have acted as an ice shadow preventing the glaciers
from the shelf edge and down the upper slope appear        from extending westwards onto the narrow western
to converge into higher-order channels that are            shelf of the archipelago, and thus starving the area
deflected in a margin-parallel direction along the          of glacially derived sediment. However, during
flanks of the ridges; these channels cross the lower        deglaciation, a flood of sediment was introduced to
slope and debouche onto the upper rise at discontinu-      the shelf and slope of western Haida Gwaii from
ities in the ridges. North of our study area, the QC       small alpine glaciers, which acted as point sources
Fault Zone is located farther seawards (700–               for sediment supply to the canyons and gullies
2200 m water depths) than in our area and appears          along the shelf and slope of the archipelago, thus
to separate the upper slope from the ridgelines that       bypassing the shelf and upper slope, and with little
define the morphology of the middle and lower               blanket sedimentation taking place. Due to the lack
slope. The steepest gradients are located on the           of significant sedimentation during the Holocene
seaward-facing flank of the lower slope or along            these erosional features were preserved as seafloor
the flanks of margin-parallel ridges in the south.          expressions and not buried. This abrupt cessation
    Geomorphic Group 5 and Group 6 are both                of sediment supply appears to have occurred around
located to the west of Haida Gwaii where a very nar-       14.5 ± 0.5 ka with little or no significant Holocene
row shelf (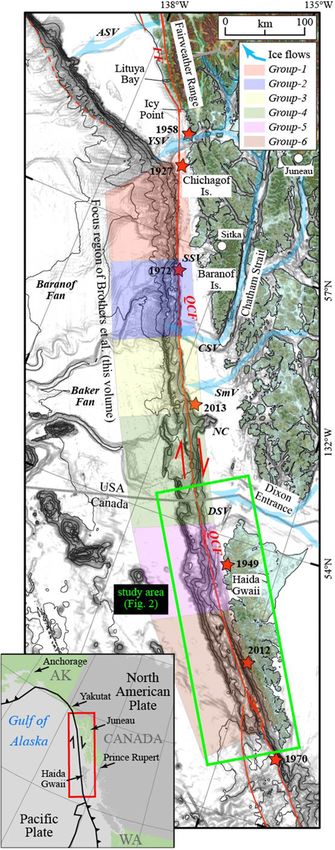
Downloaded from http://sp.lyellcollection.org/ by guest on October 8, 2018

                                           H. G. GREENE ET AL.

were corrected for sound velocity variations in the     addition to the global reservoir correction. These
stratified water column using sound speed casts.         dates are from shell fragments recovered in the
The data were edited for spurious bathymetric and       cores, which could be older than the dates measured
navigational points, and subsequently processed         as they may have been transported from upslope or
using CARIS® HIPS and SIPS software. The data           down canyons or gullies and may not record accurate
were gridded at 5 m resolution, exported as ASCII       depositional ages. Therefore, we use these ages as a
files, and imported into ArcInfo® software for analy-    relative estimate of sediment deposition times.
sis and image production. The beam-forming feature
of the EM710 multibeam system reduces the footprint
at nadir to around 5 m at 400 m water depth and about   Results
13 m at 1000 m water depth. Thus, by gridding the
data at 5 m the data are under-sampled above shal-      Results from the fieldwork suggest that the QC Fault
lower than 400 m and over-sampled at depths greater     System is a knife-edge plate boundary between the
than 400 m water depth. In addition, a single MBES      Pacific and North American plates. In addition, it
line collected in August 2016 along the base of the     appears that the fault system is characterized by leak-
slope offshore of Haida Gwaii Islands imaged well-      iness, including fluids and gases that are emanating
defined slumps using a hull-mounted Simrad               from fractures and faults that comprise the system.
EM302™ 30 kHz system aboard the University of           The northern segment of the system (referred to
Alaska, Fairbank’s R/V Sikuliaq (Fig. 2a: cruise        here as the northern segment of the QC Fault Zone),
SKQ2016-11T; http://www.rvdata.us/). Cores              extending from the Fairweather Mountain Range in
have not yet been collected along the base of the       Alaska southwards to where it connects with what
slope in this area.                                     we refer to here as the central segment of the QC
    The investigation of the southern and central       Fault Zone (located north of Haida Gwaii), has been
parts of the QC transform fault system was under-       characterized as a leaky transform fault. This is due
taken using the CCGS John P. Tully in September         to the Edgecumbe volcano offshore of Sitka, Alaska,
2015 (cruise ID: 2015004PGC) to determine fault         cited as an example of leakiness associated with mag-
geometry and activity. A Knudson™ low-power,            matic processes (Brew et al. 1969; Riehle et al. 1992;
12-element, 3.5 kHz high-resolution CHIRP (Com-         Greene et al. 2007). At the southern segment of the
pressed High Intensity Radar Pulse) seismic-reflec-      QC Fault Zone two cone-shaped features have been
tion profiling system was used to image the              reported to have fluid plumes emanating from their
subsurface stratigraphy and to select sampling sites,   crests (Barrie et al. 2013) but the origin of the fluids
but little penetration was obtained (on average         and the cones is unknown. The recent discovery of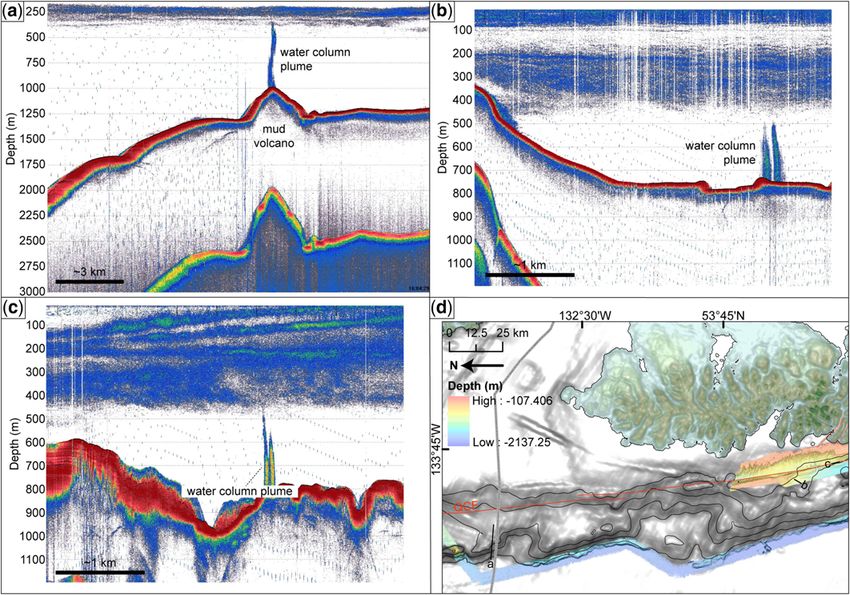
Downloaded from http://sp.lyellcollection.org/ by guest on October 8, 2018

                        MASS TRANSPORT ALONG QUEEN CHARLOTTE FAULT ZONE

Fig. 3. Examples of 18 kHz profiles and their locations showing sites of gas venting: (a) gas plume of the Dixon
Entrance mud volcano; (b) gas plumes at the distal edge of Rift Ridge slide at the base of the glide block; (c) gas
plumes at mouths of gullies near the QC Fault Zone north of Cartwright Canyon; and (d) location map showing the
position of profiles illustrated in previous (a)–(c) (note the large re-entrant near the location of a, which might be a
slide but is not well imaged and thus not discussed).

The headwalls (main or crown scarps) are generally             0.75 km, respectively, from north to south, and
steep (near-vertical) and high (c. 800 m) with the             each slide has an irregular, hummocky excavation
tops of the scarps located at approximately 1000–              area of approximately 0.75 km (Fig. 4a). The deposi-
2000 m water depth. The aggregate of these subma-              tional area extends from 0 to nearly 0.75 km for
rine slides produce distinct scalloped morphology to           the northermost larger slide and approximately
the base of the slope in this area (Fig. 2b). Most all of      0.75 km for the two more southern slides. The esti-
the slides appear geomorphically youthful, as the              mated area of mass movement in these three slides
images display sharp well-defined edges and scarps.             is approximately 3.45, 1.28 and 1.13 km2, respec-
    Interpretation of the Sikuliaq MBES data indi-             tively. All three submarine slides appear to head at
cates that the landslides generally increase in size in        a depth of approximately 2000 m.
our study area from north to south (Fig. 2b). These
slides also appear to be most concentrated offshore            Northern compound slide and block glide. Further
and downslope of where the upper slope is heavily              south, a double-headed compound slide and associ-
gullied and where two small submarine canyons are              ated block-glide zone is imaged in detail (Figs 2b
located. An obliquely north–south-orientated ridge             & 4b). Here two separate head scarps are seen: the
appears to separate the upper slope from the lower             larger with a width of approximately 3 km and the
slope (Fig. 2b). The floors of the excavation zones             other at approximately 1.5 km. The southern part
all appear to be at the same depth, on flat surface.            of the larger slide is less steep than elsewhere and
                                                               is composed of irregular, hummocky material that
Northern submarine slides. In the northern part of             has not been completely excavated with a relatively
the study area three separate, relatively small, sub-          large slumped block sitting at the base of the rubble.
marine slides notch the flat terrace-like feature at            The total excavation area is approximately 0.75 km
the base of the slope (Fig. 4a). These three slides            wide and 4.5 km long, covering an area of
have head (crown) scarp lengths of 2.30, 0.85 and              3.38 km2. A minimum run-out zone that includes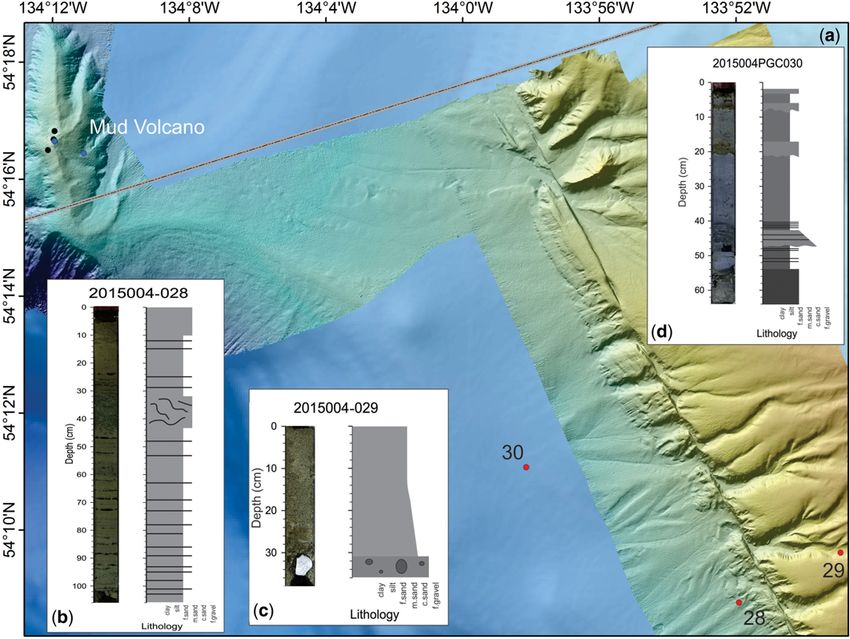
Downloaded from http://sp.lyellcollection.org/ by guest on October 8, 2018

                                               H. G. GREENE ET AL.

Fig. 4. Expanded views of submarine slides imaged from the Sikuliaq multibeam echosounder bathymetry at the base
of the central Haida Gwaii slope: (a) the northernmost and smaller slides imaged at the base of the slope; (b) large
(c. 26.25 km2) block glides and slides; (c) large (c. 13.5 km2) translational slide and block glide; and (d) large
(18.56 km2) compound block glide slide. See Figure 2 for the locations.

many block glides extends outwards from the base of         Central translational block-glide slide. A well-
the main scarps for 4.5 km and is about 5 km wide.          defined translational and block-glide submarine
The total area of the submarine slide is about              slide is located at the base of the slope just offshore
26.25 km2. A similar but smaller double-headed              of where extensive gullying occurs on the upper
slump is located just north of this failure.                slope (Figs 2b & 4c). The head scarp is not vertical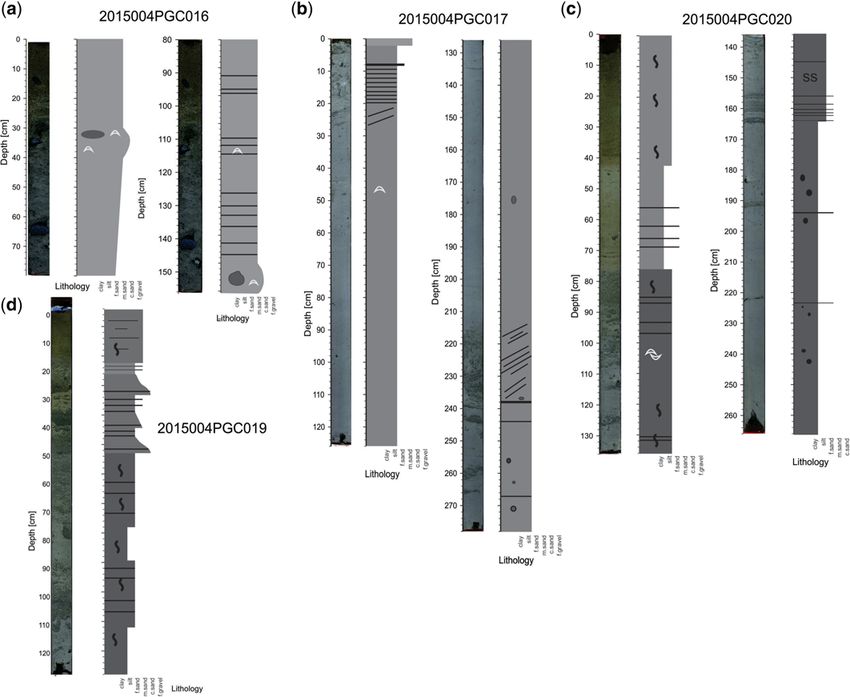
Downloaded from http://sp.lyellcollection.org/ by guest on October 8, 2018

                      MASS TRANSPORT ALONG QUEEN CHARLOTTE FAULT ZONE

but composed of irregular, hummocky material that        to what has been described in the Santa Barbara
produces a general inclined surface approximately        Channel and in the Monterey Bay region (Eichhubl
1 km long and 3 km wide. The excavation zone is          et al. 2001; Greene et al. 2002), and described for
approximately 3 km wide, 1.5 km long and includes        the gullies in this region (Harris et al. 2014). Evi-
a large block glide near the base of the upper           dence for present-day fluid flow and/or gas venting
southern sidewall. Small, scattered glide blocks can     was observed in an 18 kHz acoustic water-column
be seen extending outwards from the excavation           profile collected across the mouth of a gully just
zone for another 1.5 km. The total area of the excava-   south of Cartwright Canyon and in close proximity
tion part of the submarine slide is approximately        to the QC Fault Zone (Figs 3b, d & 5). Two addi-
10.2 km2; however, the total area including the entire   tional gas plumes were imaged in the 18 kHz dataset
depositional area is not measurable at present because   during the 2015 Tully cruise (Fig. 3b, c). One was
of the narrow data coverage, but could be as large as    emanating from the mouth of a gully truncated by
13.5 km2.                                                the QC Fault Zone just south of Cartwright Canyon
                                                         (Figs 3d & 5a) and north of a heavily gullied slope
Southern compound block-glide slump. A distinct          that appears to represent fluid-induced gulling
compound slide consisting of three main scarps is        (Figs 3c & 5a), and all were associated with hum-
located at the base of the slope in the southern part    mocky slopes that are likely to be fluid-induced
of our study area (Figs 2b & 4d). The northern slide’s   slumps. The other emanates from the base of a sub-
main scarp is approximately 1.5 km wide but exhib-       marine slide glide block at the distal edge of the large
its head and crown cracks defining two incipient          Rift Ridge slide located east of the fault zone and
rotational slump blocks upslope from the steeply         north of the rift valley opening (Fig. 5a).
dipping main scarp that are of the same width as              To the north, a rift valley associated with the QC
the crown scarp and extend upslope for at least          Fault Zone is well-imaged in the MBES data (Fig. 5).
0.75 km. Two excavation zones, approximately 1.5         An opening in the rift valley is located near the
and 0.75 km wide, are associated with this slide         southern part of a high bedrock ridge that tapers
and have a floor (sole) several hundred metres deeper     downwards toward the south, narrowing and termi-
than in the companion slumps to the south. The           nating at the mouth of Cartwright Canyon where
debris lobe, illustrated by many block glides, extends   reverse drainage occurs, blocks sediment transport
outwards for 3.75 km from the distal edge of the         to the east and directs it southwards (Fig. 5a). Here
excavation zone and is at least 3.75 km wide.            the image indicates that the rift valley is filling and
    The southern part of this compound slump is          acts as a sediment conduit. The large (c. 18 km2) sub-
composed of two adjoining main scarps: one approx-       marine slide, which exhibits fluid flow (Fig. 3b) near
imately 1.5 km wide and the other approximately          its toe, appears to have excavated a substantial part of
1 km wide (Fig. 4d). The main scarps appear less         this ridge (Fig. 5b).
steep than the northern slump, with the excavation            A series of core stations (18 in total, numbered in
zones being approximately the same length, at            Fig. 5a) were occupied in the area to determine sedi-
0.75 km, but considerably wider, at approximately        ment type and ages. Selected core logs are shown in
2.25 km. Therefore, the total slumped and excavated      Figures 6 & 7, and dates obtained from the cores are
area is approximately 4.5 km2, and, if the debris field   shown in Table 1.
imaged in the data (which is c. 3.75 m wide and
3.75 m long, covering a total area of 14.06 km2) is      Cartwright Canyon slumps. Small- to medium-sized
included, then the entire submarine slide appears to     slumps are imaged in the MBES data both north
cover at least 18.56 km2.                                and south of, and in and adjacent to, Cartwright
                                                         Canyon (Fig 5c). Within Cartwright Canyon, retro-
Upper central Haida Gwaii slope                          gressive slumping of canyon deposits appear to be
                                                         occurring, as well as failures along the upper part
The surface expression of the QC Fault Zone is well      of its lower northern wall (Fig. 5c). Immediately
imaged offshore of the west-central Haida Gwaii          to the north of the canyon mouth, a lateral spread
(Figs 2b & 5). Here, one of the larger submarine can-    submarine slide classified after Varnes (1978), con-
yons along the western margin of Haida Gwaii heads       sisting of a scalloped main scarp 1.25 km long with
at the shelf break, and is informally named here         an excavation zone about 0.25 km wide, represents
‘Cartwright Canyon’ (Fig. 5). Gullies at the lower       a failure along the lower part of a truncated spur
part of the upper slope east of the fault zone are all   whose submarine slide deposit is buttressed against
truncated along the fault zone. Channels south of        an uplifted fault scarp located north of the eastern
Cartwright Canyon and the distal upper slope, and        channel of the canyon. The entire slide including
larger gullies north of the canyon, all appear to be     the excavation zone and depositional area covers
fluid-induced as they exhibit rilling, retrogressive      approximately 3.5 km2. A smaller arcuate slump
slumping and slump movement down-gully; similar          (as per Hampton et al. 1996) along the southern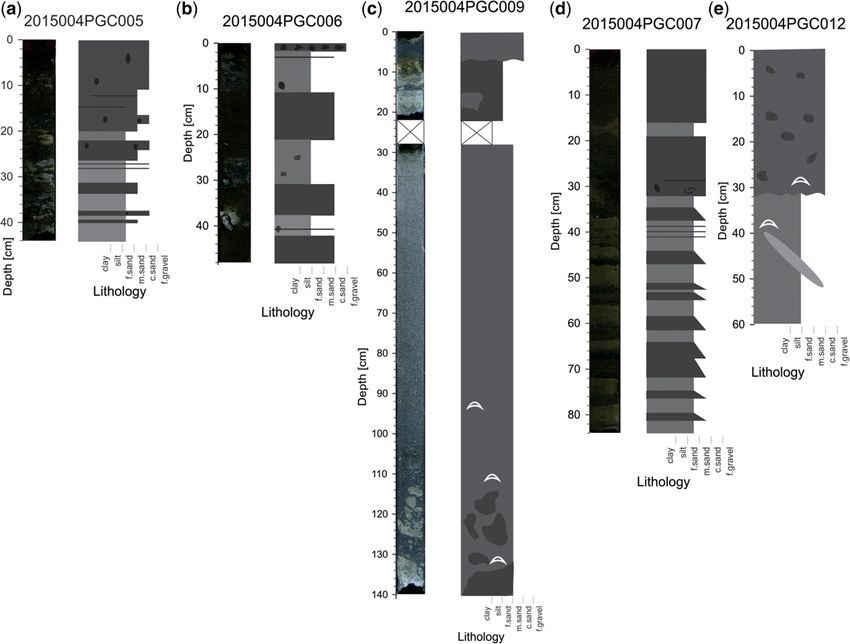
Downloaded from http://sp.lyellcollection.org/ by guest on October 8, 2018

                                               H. G. GREENE ET AL.

Fig. 5. Upper central Haida Gwaii slope study area: (a) Canadian Hydrographic Service multibeam echosounder
bathymetry in the vicinity of Cartwright Canyon and the QC rift valley offshore Haida Gwaii with piston core stations
shown as numbered solid black dots and seep locations shown as solid orange dots; (b) expanded view of large
(c. 18 km2) translational block glide slide and sag ponds within the QC Fault Zone; and (c) expanded view of the
Cartwright Canyon area showing fluid-induced slumps associated with gullies; note the linearity of the fault zone.

part of the slide appears to be evacuating slide             lower channel east of the fault zone (Fig. 5c). Small
debris into the channel of the canyon and a similar          slumps are also observed dipping into the fault zone
type of slide is located on the northern wall of the         further north of Cartwright Canyon and south of the
Downloaded from http://sp.lyellcollection.org/ by guest on October 8, 2018
MASS TRANSPORT ALONG QUEEN CHARLOTTE FAULT ZONE
Fig. 6. Core descriptions and logs of the Cartwright Canyon area: (a) Core 2015004PGC005 located in the western
offset channel of the canyon; (b) Core 006 located in the non-offset channel of the canyon just east of the QC Fault
Zone; (c) Core 009 located at the mouth of ‘Gully 1’ near the QC Fault Zone; (d) Core 007 located upchannel in the
canyon near a retrogressive slump east of the QC Fault Zone; and (e) Core 012 in the mouth of the gully south of
canyon (see Fig. 5a for core locations).
rift opening, east of the fault zone at the mouths of 2015004PGC005 (Figs 5a & 6a) in the western off-
gullies including ‘Gully 3N’, and west of the fault set channel of Cartwright Canyon, at the base of a
zone as gullied block glides (Fig. 5a). slump, near the fault and containing interbedded,
South of Cartwright Canyon a hummocky slope moderately sorted, gravelly coarse sand and silt
near the mouth of a gully indicates slope failures beds up to 10 cm in thickness. This material had a
(Fig. 5c). At this location a slump on the southern density of 2–2.4 g cm−3, magnetic susceptibility of
part of the gully exhibits a main scarp 0.75 km generally over 150 × 10−5 SI and a 14C date of
long and a disturbed zone of 0.5 km wide covering 39 080 ± 690 years BP obtained from a shell frag-
an area of approximately 0.38 km2. Further south ment taken at 38–40 cm depth in the core. Another
the slope east of the fault zone is heavily gullied short (48 cm) core of hard dense sand and mud
and exhibits many small slumps (Fig. 5a). was recovered in the thalweg of lower Cartwright
Four core samples recovered near and within Canyon at Station 2015004PGC006 (Figs 5a &
Cartwright Canyon close to the QC Fault Zone are 6b), in a flat area closest to, and east of, the fault
described here. At Station 2015004PGC004, no zone, and below the scarp of a retrogressive
core was recovered but the sediment in the core slump. This core contained interbedded dark grey
catcher (Downloaded from http://sp.lyellcollection.org/ by guest on October 8, 2018
H. G. GREENE ET AL.
Fig. 7. Core descriptions and logs of the Rift Ridge slide area: (a) Core 2015004PGC016 in undisturbed seafloor on
the slope above the head scarp of the slide; (b) Core 017 located at the base of the head scarp of the slide; (c) Core
020 located near the distal edge of the excavation zone near the base of a block glide; and (d) Core 019 located on
the floor of the excavation zone (see Fig. 5a for core locations).
mud was recovered at Station 2015004PGC007 mud, and possible distorted laminations with a
located in the middle part of Cartwright Canyon, sand lens extending from 40 to 55 cm deep. Den-
up-canyon from Core 006, in the lower part of a sity of the core was measured at 2–2.3 g cm−3 and
meander above what appears to be a retrogressive magnetic susceptibility varied from approximately
slump within the channel (Figs 5a & 6d). This 25 × 10−5–225 × 10−5 SI, with the highest values
core recovered interbedded very dark grey fine at the upper part (10–30 cm deep) of the core.
and very fine sand and mud with minor gravel Another core (Station 2015004PGC022) attempted
down to about 30 cm where grading occurs and just up the gully from Station 2015004PGC012
bedding is repetitive, alternating from olive grey to had no recovery, with a just small amount of sand
dark olive grey fine to very fine sand beds inter- found in the core catcher (Fig. 5a).
bedded with mud, identified as turbidites from the Cores recovered from the mouths of prominent
initial examination of the core. Density was mea- gullies (informally named ‘Gully 1’ and ‘Gully
sured at 1.8–2.2 g cm−3 and magnetic susceptibility 3N’: Fig. 5a) both south and north of Cartwright Can-
at between 100 and 275 × 10−5 SI, with the highest yon and near the QC Fault Zone are described here.
values at the top of the core (10–30 cm deep). A short (140 cm) core (Core 2015004PGC009)
A short core (80 cm) was recovered at the con- recovered at the upper reaches of a gully (informally
fluence of two gullies just south of Cartwright called ‘Gully 1’: Fig. 5a) located just south of Cart-
Canyon at Station 2015004PGC012 (Figs 5a & wright Canyon has a stratigraphy composed of very
6e). Lithology in this core consists of olive grey dark grey mud to fine sand over olive grey sandy
poorly sorted gravelly sand with minor shell and silt with sand clasts down to 22 cm. From 28 toDownloaded from http://sp.lyellcollection.org/ by guest on October 8, 2018
MASS TRANSPORT ALONG QUEEN CHARLOTTE FAULT ZONE
Table 1. Radiocarbon dates obtained from piston cores collected during the 2015 CCGS John P. Tully cruise
14
Laboratory No. Sample No. Cruise No. Station Core depth Material C age ± years BP
UCIAMS No. (cm)
167532 201504-0539 2015004PGC 5 38–40 Shell 39 080 ± 690
167533 201504-09129 2015004PGC 9 129 Shell 42 870 ± 1100
167534 201504-1528 2015004PGC 15 27–29 Shell 21 320 ± 80
167535 201504-1631 2015004PGC 16 31 Shell 13 450 ± 35
167536 201504-1648 2015004PGC 16 48 Shell 49 390 ± 2500
167537 201504-16165 2015004PGC 16 165 Shell 16 190 ± 45
167538 201504-1928 2015004PGC 19 27–28 Shell 14 110 ± 40
167539 201504-1940 2015004PGC 19 39–41 Shell 13 620 ± 35
167540 201504-20109 2015004PGC 20 109 Shell 20 980 ± 80
Dates obtained primarily from pelecypod shell fragments buried in the sediment (transported).
113 cm the core contains dark olive grey massive recovery from Core 016. The other core stations are
fine–medium sand with minor shell fragments; and within the landslide, with Core 2015004PGC021
from 113 to 140 cm sand and silt rip-up clasts were recovering a sample from the core catcher only.
found (Fig. 6c). Measured density in the core ranged At Station 2015004PGC016, a 170 cm-long core
from 2.1 to 2.3 g cm−3, magnetic susceptibility mea- was recovered consisting of olive grey medium–
sured from just below 200 × 10−5 SI at the top of the coarse sand with pebbles and mud (poorly sorted)
core gradually increased to nearly 350 × 10−5 SI at throughout, and with foraminifer down to 31 cm
125 cm deep, and a 14C date from a shell fragment where a shell fragment was taken for dating. From
of 42 870 ± 1100 years BP at 129 cm was obtained. 31 to 35 cm a large cobble was found, and from 35
Two other core stations were occupied north of to 170 cm olive grey mud with shell and sand lamina-
Cartwright Canyon including Station 011 near a sub- tions and some gravel and cobbles was recorded,
marine slide head scarp within the mouth of a major becoming muddier with depth; a large (2.5 cm)
gully (‘Gully 3N’: Fig. 5a) but this had poor core pebble (silicaclastic) and shell fragments were
recovery with only stiff mud obtained in the core located at the base (Fig. 7a). The density of the core
catcher. Similarly, nothing was recovered from Sta- was measured at 2.0–2.4 g cm−3, and magnetic sus-
tion 013 in the first gully south of the rift opening ceptibility was measured at between 250 × 10−5
on the west side of the fault zone. and 500 × 10−5 SI. Ages within the core were
obtained by 14C radiocarbon dates from shell frag-
Rift Ridge submarine slide. The Rift Ridge slide is a ments dated at 13 450 ± 35 years BP at 31 cm,
large translational block-glide slide (after Varnes 49 390 ± 2500 years BP at 40–48 cm and 16 190 ±
1978) that has an approximate 6 km-long, 100 m- 45 years BP at 165 cm (Figs 5 & 7a; Table 1).
high main scarp and a 3 km-wide gullied excavation Core 2015004PGC017 was obtained at the foot
zone, covering an area of approximately 18 km2, of the NE edge of the main scarp of the Rift Ridge
with the crown and top of the main scarp located in slide and recovered a 277 cm-long core that con-
approximately 400 m of water (Barrie et al. 2013) tained 20 cm of olive grey fine sand with shell frag-
(Fig. 5b). A large block glide is located 1.5 km ments unconformably (erosional boundary at 20 cm)
downslope from the distal edge of the excavation overlying massive grey mud with minor intervals of
zone in what appears to be a fairly extensive debris laminations, ice-rafted debris (IRD) and rare shell
field, although the total area of the field is indeter- fragments. From 216 to 234 cm, disturbed lamina-
minable due to incomplete MBES coverage. The tions with minor IRD are present (Fig. 7b). Density
main scarp and sidewalls at the head of the slump of the core measured 1.9–2.4 g cm−3, and magnetic
are rounded and less sharp in outline than the deeper susceptibility ranged between 200 × 10−5 and 300
slides imaged at the base of the slope. × 10−5 SI, except just above the erosional boundary
Six piston core stations (2015004PGC016– (20 cm deep) and at the disturbed zone (216–234 cm
2015004PGC021) were occupied within and deep) where magnetic susceptibility approached and
adjacent to the Rift Ridge slide (Fig. 5a), and all exceeded 400 × 10−5 SI.
recovered cores with little penetration into the sea- At Station 2015004PGC018, located in undis-
floor. Cores taken at stations 2015004PGC016 and turbed seafloor at the crest of the rift ridge, and just
2015004PGC018 were from undisturbed seafloor east of the Rift Ridge slide head scarp (Fig. 5a),
above the head of the slump, with just a core-catcher only a core catcher jammed with mud was recovered.
recovery at Station 2015004PGC018 and little At Station 2015004PGC019, located on the floor ofDownloaded from http://sp.lyellcollection.org/ by guest on October 8, 2018
H. G. GREENE ET AL.
the excavation zone, 128 cm of core was recovered of the southern part of the main (crown) scarp. This
(Figs 5a & 7d). The stratigraphy consisted of a slide has an excavation zone of at least 2 km, with the
thin (c. 20 cm-thick) weakly bedded olive grey fine slide covering an area of at least 7.40 km2. Smaller
sand that overlies a 10 cm-thick olive-coloured slides notch the western base of the north–
mud layer that in turn overlies dark olive grey inter- south-orientated ridge, which extends approximately
bedded fine–medium sand and mud about 22 cm 3 km north from the crater of the mud volcano
thick (Fig. 7d). Density in the core was measured at (Fig. 8). Along the SE flank of the ridge, a flat-floored
1.0–2.3 g cm−3, and magnetic susceptibility alter- valley measures 2.70 km wide and 4.40 km long,
nated between 200 × 10−5 and 400 × 10−5 SI. We sloping down from a depth of 1170–1290 m and
obtained two 14C dates of 14 110 ± 40 years BP extending for a minimum of 2.6 km. An apparent
from a shell fragment at 27–28 cm and another of incipient slump, that is not fully imaged and is evi-
13 620 ± 35 years BP from another shell fragment denced by a subtle arcuate crown or head scarp that
at 39–41 cm. is a minimum of 8.8 km long, lies at a depth of
At Station 2015004PGC020, located at the distal 1172 m with a base at 1230 m that is undercut by
edge of the slide near the foot of the glide block, a the gullied head of a large landslide (previously
257 cm core of mud was recovered. The stratigraphy described). This incipient slide has a potential exca-
of the core consisted of olive grey massive biotur- vation zone of >4.4 km, covering an area of at least
bated sandy mud down to about 40 cm, overlying 38.7 km2 and defined by irregular arcuate ridges or
olive grey massive to laminated silty clay that extends ripples (possible compression ridges) and troughs
down to about 73 cm deep and overlies very dark grey characteristic of creep and a weakly gullied slope
bioturbated to laminated sandy mud extending down (Fig. 8).
to about 155 cm deep, which overlies dark grey clay To the south of the mud volcano, three core
with minor gravel and laminations (Fig. 7c). Density stations (2015004PGC028–2015004PGC030) were
in the core was measured at 1.7–2.2 g cm−3, with occupied in the vicinity of the QC Fault Zone
magnetic susceptibility ranging from 75 × 10−5 to (Fig. 9a). Core 2015004PGC028 was obtained near
nearly 400 × 10−5 SI, with the lowest measurement a slump west and downslope of the QC Fault Zone
found in the massive to laminated silty clay (c. 60– where a 106 cm-long core consisting of an upper
70 cm deep) and the highest in the bioturbated lami- olive grey, muddy to fine sand layer with foraminif-
nated sandy mud (from 80 to 190 cm). A 14C date era, 30 cm thick, overlies a 12 cm-thick olive grey
of 20 980 ± 80 years BP from a shell fragment at mud with muddy sand and laminations (Fig. 9b).
109 cm was obtained (see Table 1). Beneath these upper layers, but within the upper
42 cm of the core, are olive grey mottled muddy
Dixon Entrance (mud volcano). A mud volcano sand and mud that gradually grade downwards into
venting gas was discovered on the slope west of olive mud with sand and subtle colour laminations
Dixon Entrance during the 2015 cruise of the and foraminifera near the bottom of the core at
Tully. Recently (August 2017), the CCG vessel Vec- approximately 85 cm deep. Density measurements
tor collected MBES data over the volcano (Barrie ranged from 1.6 to 1.95 g cm−3, being greatest in
et al. 2018) (Fig. 8), which shows that the volcano the upper laminated zone (30–34 cm deep), and
sits on a north–south-orientated ridge, exhibits sub- magnetic susceptibility varying between 75 × 10−5
marine slides along the western and southern base and nearly 225 × 10−5 SI in the upper 45 cm of the
of the ridge, and has a south-trending circular- core, and generally being less than 100 × 10−5 SI
headed valley bordering the eastern margin of the below 45 cm (Fig. 9b).
volcano. Two medium-sized submarine slides are Core station 2015004PGC029 was located in a
well-imaged in the recently collected Canadian gully on the Dixon Entrance slope and recovered
Hydrographic Service MBES bathymetry data, 38 cm of olive-coloured massive, medium-sorted,
including a rotational slump measuring 3.1 km fine–medium sand that overlies olive-coloured
along a subtle approximately 130 m-high main sandy gravel (gravel size up to 4 cm in diameter) at
scarp whose crest lies 1060 m deep, and has a head 30 cm deep (Fig. 9c). Density was measured at
and secondary block with possible vent sites. The 2–2.4 g cm−3 within the core and magnetic suscept-
main body of the slide lies at a depth of 1190 m ibility averaged about 100 × 10−5 SI, except at the
and extends a minimum of 0.69 km out from the gravel layer (30 cm deep) where it approached nearly
head block, with the entire imaged part of the slide 300 × 10−5 SI.
covering an area of 2.14 km2. The other medium- Core station 2015004PGC030 was located in a
sized slide is located at the base of the southern sediment pond west of the fault where 66 cm of
end of the ridge upon which the mud volcano sits cored sediment was recovered. The sedimentary
and appears to be a debris avalanche (see Varnes stratigraphy consists of interbedded dark olive grey
1978), not fully imaged, with a main scarp that mea- sandy mud and dark grey gravelly clay with an
sures 3.7 km long and a head slump block at the base erosional base at 40 cm deep, and overlies veryDownloaded from http://sp.lyellcollection.org/ by guest on October 8, 2018
MASS TRANSPORT ALONG QUEEN CHARLOTTE FAULT ZONE
Fig. 8. The Dixon Entrance study site with the 2017 Vector MBES bathymetric image of the recently (2015)
discovered mud volcano showing two medium-sized (c. 2.14–7.40 km2) submarine slides at the base of the western
and southern flanks of a north–south-orientated ridge upon which the volcano sits and a circular-headed
fluid-induced-like valley at the base of the eastern flank; locations of three IKU grab samples are shown as black dots;
the main vent is shown as a large solid orange dot; and camera drop locations are shown as small yellow dots, with
drop 2015004PGC031 at the crest of the ridge near the vent (orange dot) and 037 further down the flank about
half-way between the vent and the seep valley.
dark laminated clay, which in turn overlies graded susceptibility ranged from about 120 × 10−5 to
coarse–fine sand and laminated silt (Fig. 9d). Density approximately 225 × 10−5 SI, with the highest read-
was measured at 1.8–2.2 g cm−3 and magnetic ing (225 × 10−5 SI) occurring within the laminatedDownloaded from http://sp.lyellcollection.org/ by guest on October 8, 2018
H. G. GREENE ET AL.
Fig. 9. Recently (2017) collected MBES bathymetry of the Dixon Entrance area: (a) showing the mud volcano with
the locations of three IKU samples (small black dots) and the locations of piston cores (numbered small red dots);
(b) Core 2015004PGC028 located west and downslope of the QC Fault Zone; (c) Core 029 located in a gully east of
the QC Fault Zone; and (d) Core 030 located far down the slope east of the QC Fault Zone. Seep sites shown as
blue dots.
clay unit at 45 cm deep. No datable material was were also observed. The five IKU grab samples
recovered from these cores. (2015004PGC032–2015004PGC036, photographs
In addition to the cores described above, two drop P180, P88, P309, P238 and P90, respectively) were
camera short-tow transects (stations 2015004PG full of mud/clay, gravel, clams, mussels and
C031 and 2015004PGC037: Figs 8 & 9a) were carbonate-cemented mud slabs.
made to photograph the seafloor in the vicinity of A 3.5 kHz CHIRP seismic-reflection profile col-
the mud volcano during the 2015 Tully cruise. lected across the mud volcano (along the same tran-
Five IKU grab sampler sites were selected from sect as the 18 kHz profile showing the gas plume:
the photographs. Excellent photographs were Fig. 3a, d) illustrates the hard seafloor of the mud
obtained during the camera drops, which indicated volcano that is most likely to be the result of carbon-
that methane gas was emanating from the cone of ate cementation associated with the gas vent and
the mud volcano. Evidence of methane is given by seeps (Fig. 11). The profile is characteristic of most
the presence of methanogenic chemosynthetic com- of the 3.5 kHz sub-bottom data collected and illus-
munities consisting of tentatively identified Calypto- trates that the seafloor along the QC Fault Zone in
gena spp. clams (Fig. 10), a Vestimentiferan spp., our study area is dense.
tubeworm, Beggiatoa spp. bacterial mats and car-
bonate slabs. No lava or outcrops of volcanic rock
were photographed. In contrast, gravel, pebbles Discussion
and cobbles covering a mud slope were observed,
with many of the clasts being rounded. However, The MBES images of the QC Fault Zone collected
angular fragments of dark-coloured rock were seen by the Canadian Hydrographic Service illustrate
in the photographs. Small narrow rivulets of mud the linearity of the structure offshore of westernDownloaded from http://sp.lyellcollection.org/ by guest on October 8, 2018
MASS TRANSPORT ALONG QUEEN CHARLOTTE FAULT ZONE
Fig. 10. Seafloor photograph near the main vent site of the mud volcano off Dixon Entrance, Alaska showing
chemosynthetic clams (Caliptogena spp.), which appear to be associated with the methane seep.Downloaded from http://sp.lyellcollection.org/ by guest on October 8, 2018
H. G. GREENE ET AL.
Fig. 11. A 3.5 kHz profile across the newly discovered (2015) mud volcano on the Dixon Entrance slope showing a
hard-density seafloor, probably the result of carbonate cementation precipitated from gas venting from the volcano.
This profile is characteristic of most 3.5 kHz profiles collected in the study areas, which indicate a high-density
substrate. TWTT, two-way travel time.
Haida Gwaii and that many small submarine slides recovered along the western margin of Haida
are present on the upper slope which appear to be Gwaii, consisting of 44 ka calibrated, 25 ka cali-
fluid-induced (see Fig 5). With the exception of brated and 14 ka calibrated 14C years BP (Table 1).
one large submarine slide on the upper slope (Rift This suggests that little sediment younger than 14
Ridge slide: Fig. 5), the larger submarine slides are (14C) = 17 ka (calibrated) exist in the areas cored
located at the base of the slope, as shown in the Siku- because of significant sedimentation shutdown
liaq bathymetric data (see Figs 2 & 4). We speculate after the retreat of the glaciers, which is consistent
that the differences in the character and sizes of these with dates obtained by Blaise et al. (1990) and Barrie
submarine slides result from differing sedimentary & Conway (1999).
processes, and the tectonic and glacial history of
the region.
Fluid flow
Tectonics The apparent mud volcano on the continental slope
just west of Dixon Entrance discovered during the
The QC–FW Fault Zone is a major plate boundary Tully cruise of 2015 is a well-defined cone-like struc-
that separates the Pacific Plate from the North Amer- ture with a crest located at 1000 m water depth. At
ican Plate and, as such, is seismically active, result- the time of the survey, the cone was profusely vent-
ing in many large magnitude earthquakes through ing gas 700 m into the water column from within a
geological time that could have stimulated mass fail- small crater at the crest, as shown in the 18 kHz
ures along the western Haida Gwaii slope. However, sounder profile (Fig. 3a). The newly discovered
with the exception of the likely fluid-induced sub- mud volcano indicates that gas is venting along the
marine slides on the upper slope, no evidence has slope in this region, and we surmise that the slope
been found that indicates major large mass failures is locally unstable because of the presence of gas
on the slope east of the QC Fault Zone west of and other fluids in the sediment. Two medium-sized
Haida Gwaii. Sediment recovered in our coring submarine slides, a circular-headed flat-floored val-
campaign consists largely of dense sands and muds ley and many small sediment failures at the base of
(50% >2.0 g cm−3, 90% >1.8 g cm−3) that may a north–south-orientated ridge that the volcano sits
have been compacted by seismic shaking throughout upon indicate that mass wasting is occurring (see
the late Pleistocene and Holocene (age dates from Fig. 8). This geographical situation allowed for the
cores range from 14C 49 390 ± 2500 to 13 450 ± concentration of late Pleistocene glacial material,
35 years BP, which refer to the maximum age of the and Holocene terrestrial and pelagic organic-rich
sediments: see Table 1); while in contrast the blocky sediments which were deposited on the slope to
nature of the large slumps at the base of the slope eventually produce gas (methane) that accumulated
suggests that the failed materials there are probably and migrated through the sediment, increasing pore
less dense and more muddy than on the upper slope. pressures that eventually led to instability and mass
Core subsamples selected for 14C radiometric failures. Continuous deposition appears to have pro-
dating show three major ages for the sediment vided sediment in quantities that could accumulateDownloaded from http://sp.lyellcollection.org/ by guest on October 8, 2018
MASS TRANSPORT ALONG QUEEN CHARLOTTE FAULT ZONE
without being compacted by seismicity, resulting in covering an area of approximately 18 km2. This fea-
mass failures. ture is located on what appears to be a transpressional
We did not sample the gas, but speculate that it ridge associated with the QC Fault Zone, and we
contains methane as chemosynthetic (methanogenic) speculate that it may have failed due to seismicity
communities in the form of high concentrations of along the QC Fault Zone and possible uplift and
apparent living Calyptogena clams and mussels steepening of the slope associated with transpression.
that were observed in the bottom photographs and
sampled with the IKU grab (Fig. 10). In addition, Densification of sediment
extensive areas of carbonate slabs and chimneys,
apparent Biggiotoa bacterial mats, and a single Ves- Our inability to obtain long piston cores within the
timentiferin tubeworm were observed in the bottom upper slope areas of the QC Fault Zone because of
photographs close to the vents, which also suggest the high-density and well-packed sediments was sur-
the presence of methane. prising. We speculate that the reason for this densifi-
The 3.5 kHz sub-bottom profiles (e.g. Fig. 11) cation is associated with one of two causes or,
obtained during the 2015 geophysical investigation perhaps, both. First, during the LGM Haida Gwaii
and recently collected by CCGS Vector MBES acted as an ice shadow along the continental shelf
data offshore Dixon Entrance show the existence of British Columbia, preventing the glaciers and
of other cone-like features (possible vents in glacial-fed sediment from reaching the distal edge
Fig. 8) and a hummocky and deformed seafloor char- of the shelf and upper slope (Barrie & Conway
acteristic of slides (Fig. 5). We noted that Core 1999). This created a sediment-starved area west of
2015004PGC030, which is one of the cores recov- Haida Gwaii, as indicated by the old ages (late Pleis-
ered furthest away from the QC Fault Zone (see tocene) obtained from 14C dating of shell fragments
Fig. 9), had one of the lowest undisturbed, non- (see Table 1). Second, the high recurrence level of
turbidite densities measured (1.8–2.2 g cm−3) in medium- to large-magnitude earthquakes along the
the area of Dixon Entrance. In contrast, densities of QC Fault Zone may have increased the density of
the cores elsewhere in the vicinity of the QC Fault the sediment through shaking and packing (see
Zone were generally greater, at about 2.0–2.3 g Fig. 1). Sawyer & DeVore (2015) reported that
cm−3. Therefore, we infer that the upper continental even though earthquakes are a major stimulant for
slope west of Dixon Entrance is unstable and prone submarine slides, the most active areas on Earth
to mass wasting, probably the result of fluid flow are surprisingly devoid of such features. These
and gas expulsion. authors’ comparative studies of the Deep Sea Drill-
It appears that gas expulsion and fluid flow are ing Programs’ drill cores from active and passive tec-
prominent along most of the central QC Fault Zone tonic margins supports the concept of ‘seismic
offshore central Haida Gwaii. We consider this seg- strengthening’ or densification (consolidation) by
ment of the fault zone to be very leaky, in respect to in situ dewatering put forth by several investigators
gas and fluids, along most of its length, as in each (McAdoo et al. 2000; Locat & Lee 2002; Strozyk
of our survey areas we found gas plumes that origi- et al. 2010; Nelson et al. 2011), as active margins
nate close to, or within, the fault zone and speculate have higher undrained shear strength than passive
that the faults are acting as conduits for the venting margins. The combination of both a sediment-
of the gases and fluids. In addition, the gas could be starved slope and densification could result in a
accumulating in antiformal structures that form more stable slope that is difficult to penetrate using
many of the conjugate ridges of the QC Fault Zone. gravity or piston corers. However, exceptions should
The gas could have originated from multiple sources occur where fluid flow is present, as gas-charged sed-
such as from the compaction and degradation of iments have lower than normal shear strength
organic-rich sediment, as well as from continuously (Hampton et al. 1996).
forming hydrocarbon resources (Tinivella & Giusti- The characteristics of the base-of-slope slides
niani 2013), and dissolution of clathrates or frozen (base of central Haida Gwaii slope) contrast with
gas hydrate systems (Dimitrov 2000; Depreiter those submarine slides we observe on the upper
et al. 2005; Sauter, et al. 2006; Tinivella & Giusti- slope. Most all of the submarine slides on the
niani 2013). Heat at depth, such as from a magmatic upper slope appear to be composed of primarily dis-
source, also has the potential of producing mud volca- aggregated materials that result from debris flows
noes (Tinivella & Giustiniani 2013); although this is and retrogressive slumping stimulated by increased
most common along convergent margins, it also has pore pressures associated with fluid flow; at the
the potential to occur along transform margins, as base of the slope, the slides have a blockier character
indicated by the Edgecumbe volcano along the north- suggesting intact block glides and translational sub-
ern segment of the QC Fault Zone (Brew et al. 1969). marine slides possibly triggered by earthquakes.
The translational and block-glide Rift Ridge slide This difference in character may result from differing
is the largest located on the upper Haida Gwaii slope, sediment regimes, with the upper slope beingDownloaded from http://sp.lyellcollection.org/ by guest on October 8, 2018
H. G. GREENE ET AL.
influenced by the Haida Gwaii glacial shadow and • A few small (c. 0.4–1 km2) to medium (c. 2–
sediment-starved margin; while the base of the 4 km2) fluid-induced debris flows and retrogres-
slope received more fine-grained sediment, includ- sive slumps, locally stimulated by increased pore
ing pelagic deposition during the Pleistocene and pressures (e.g. Hampton et al. 1996) associated
Holocene, and was far enough removed from the with gas and fluid flow occur within the vicinity
seismic activity along the QC Fault Zone not to be of the QC Fault Zone.
subjected to densification. • Cores recovered sediment dated no younger than
14
However, the depositional regime and the pres- C 13 450 ± 35 years BP.
ence of fluids in the Dixon Entrance area indicate a • The sediment glacial shadow margin of Haida
less dense environment. A piston core collected Gwaii prevented sediment supply to the area dur-
from the Dixon Entrance slope (Core 2015004 ing the last glacial advance.
PGC028) recovered mud that exhibited the lowest • An exception to the sizes of failures in this area is
densities (1.6–1.95 g cm−3) of all the cores recov- the large (c. 18 km2) Rift Ridge slide that may
ered on the 2015 Tully cruise, suggesting that densi- have been stimulated by large magnitude earth-
fication of the sediment in this region is not as high as quakes, and transpressional uplift and tilting of
on the central Haida Gwaii slope, within the glacial the slope.
sediment shadow. Even though the core was located
near the QC Fault Zone, fluids within the sediment Base of central Haida Gwaii slope
may play a role in reducing densification here. In
• Mass failures at the base of the central Haida
addition, Core 201400PGC030 had a lower density
Gwaii slope exhibit different geomorphic charac-
(1.8–2.2 g cm−3) than reported for cores taken on
teristics than those failures found on the upper
the upper slope west of central Haida Gwaii. Glacial
slope.
deposition was probably more intense and continu-
• The submarine slides appear relatively unweath-
ous in the Dixon Entrance region because of the open-
ered and therefore youthful, suggesting recent
ing from mainland British Columbia to the abyssal
failures, are more blocky in appearance, and are
plain, although recent studies indicate that glaciers
larger in size (ranging from c. 0.56 to 10.20 km2
moved primarily to the north rather than west in this
for distinct single slope failures and upwards to
region during the LGM (Lyles et al. 2017).
26.63 km2 for compound slides) than observed
on the upper slope (see Fig. 2).
• No piston cores have been collected yet in this
Conclusions region, but we suspect that the sediments here
Recently collected MBES bathymetric data, 3.5 kHz are less dense than on the upper slope due to the
seismic-reflection profiles, piston cores and camera- greater distance the region lies from the QC
tow photographs were used to investigate slope fail- Fault Zone; thus, earthquakes have less effect on
ures and mass-transport processes along western compaction of the slope here than on slopes closer
British Columbia, Canada. Three physiographical to the fault zone.
regions were studied, consisting of: (1) the upper • More recent and continuous sedimentation has
central Haida Gwaii continental slope; (2) the basal probably occurred in this area than in areas closer
central Haida Gwaii continental slope; and (3) the to Haida Gwaii.
mid-continental slope off Dixon Entrance. Each of • The soles of the slides appear to be on a flat sur-
the physiographical regions exhibits different types face along the western edge of the Queen Char-
of submarine mass failures that we conclude are lotte Terrace of Hyndman (2015).
related to Quaternary sediment supply, fluid flow • We attribute the lack of densification to the dis-
and tectonic processes such as seismic activity and tance the region lies from the QC Fault Zone;
transpression. The characteristics that we conclude thus earthquakes have less effect on the lower
are diagnostic of the types of mass failures which slope here than on the upper slope closer to the
have occurred along the central QC Fault Zone are fault zone.
as follows.
Dixon Entrance (mud volcano)
Upper central Haida Gwaii slope • The newly discovered active mud volcano on the
mid-continental slope off of Dixon Entrance indi-
• High density sand and mud (densities range from cates that considerable gas is venting in the region.
1.6 to 2.4 g cm−3), with the highest densities in • Camera drop photographs show extensive chemo-
areas of no fluid flow, sediment appears to have synthetic communities to be associated with seeps
been compacted by seismic shaking (e.g. Sawyer on the volcano (e.g. Calyptogena-like clams
& DeVore 2015) throughout the late Pleistocene and mussels, suggesting that the gas contains
and Holocene, thus increasing slope stability. methane).Downloaded from http://sp.lyellcollection.org/ by guest on October 8, 2018
MASS TRANSPORT ALONG QUEEN CHARLOTTE FAULT ZONE
• Large areas of carbonate cementation and bacte- Southeastern Alaska. Cruise Report of 2017003PGC
rial mats were found that produce hard (high- CCGS Vector and 2017004PGC CCGS John P.
density) substrate (see Fig. 11). Tully, Geological Survey of Canada, Open File, 3398,
• The lowest density (1.6–1.95 g cm−3) sediment 159.
BLAISE, B., CLAGUE, J.J. & MATHEWES, R.W. 1990. Time of
measured in the cores were found off Dixon maximum Late Wisconsin glaciation, west coast of
Entrance. Canada. Quaternary Research, 34, 282–295.
• The MBES bathymetric data show that two BOSTWICK, T.K. 1984. A re-examination of the 1949 Queen
medium-sized (c. 2.14–7.40 km2) submarine Charlotte earthquake. Msc dissertation, University of
slides indent the western and southern base of a British Columbia, Vancouver, Canada.
north–south-orientated ridge that supports the BREW, D.A., MULLER, L.J.P. & LONEY, R.A. 1969.
volcano. Reconnaissance geology of the Mount Edgecumbe
• Mass failures along the flanks of the mud volcano Volcanic Field, Kruzof Island, southeastern Alaska.
suggest that pore pressures are high here and that In: Geological Survey Research 1969. United
States Geological Survey, Professional Papers, 650D,
gas-charged sediments may have lower-than- D1–D18.
normal shear strengths; thus facilitating failure BROTHERS, D.S., HAEUSSLER, P. ET AL. 2017. A closer look
that may have been, and still can be, stimulated at an undersea source of Alaskan earthquakes, Eos,
by earthquakes. 98, https://doi.org/10.1029/2017EO079019. Publi-
• We conclude that the mid-slope region off Dixon shed on 15 August 2017.
Entrance is prone to mass-wasting events due to BROTHERS, D.S., ANDREWS, B.D. ET AL. In press. Slope failure
the close proximity of the seismically active QC and mass transport processes along the Queen Charlotte
Fault Zone, based on the relatively low density Fault: southeastern Alaska. In: LINTERN, D.G., MOSHER,
of sediments in the region and local gas-charged D.C. ET AL. (eds) Subaqueous Mass Movements. Geo-
logical Society, London, Special Publications, 477,
sediments. https://doi.org/10.1144/SP477.30
BUFE, C.G. 2005. Stress distribution along the Fairweather–
Acknowledgements We wish to thank the Captain Queen Charlotte transform fault system. Bulletin of the
and crew of the CCGS John P. Tully for their support and Seismological Society of America, 95, 2001–2008.
encouragement while at sea collecting data. The Canadian CARLSON, P.R., PLAFKER, G. & BRUNS, T.R. 1985. Map and
Hydrographic Service compiled the bathymetry data. Selected Seismic Profiles of the Seaward Extension of
NOAA, NSF and the University of Alaska graciously the Fairweather Fault, Eastern Gulf of Alaska. United
shared bathymetric data they collected with the R/V Siku- States Geological Survey, Miscellaneous Field Studies
liaq. We thank the Royal Roads University for the use of Map, MF-1722.
their Geotek split-core multi-sensor core logger. Charlie CENTER FOR COASTAL AND OCEAN MAPPING JOINT HYDRO-
GRAPHIC CENTER. 2010. Gulf of Alaska—Bathymetry:
Endris and Norman Maher assisted in the preparation of
the figures. Any use of trade, firm, or product names is Law of the Sea Data, http://ccom.unh.edu/theme/
for descriptive purposes only and does not imply endorse- law-sea/law-of-the-sea-data/gulf-of-alaska [last
ment by the US Government. accessed September 2017].
DEPREITER, D., POORT, J., VAN RENSBERGEN, P. & HENRIET,
J.P. 2005. Geophysical evidence of gas hydrates in shal-
Funding Partial support for this investigation came from low submarine mud volcanoes on the Moroccan mar-
the USGS National Earthquake Hazards Reduction gin. Journal of Geophysical Research, 110, B10103,
Program (NEHRP) to H.G. Greene through a grant to the https://doi.org/10.1029/2005JB003622, 2005
Sitka Sound Science Center in Sitka, Alaska. DIMITROV, L.I. 2000. Mud volcanoes – the most important
pathway for degassing deeply buried sediments. Earth-
Science Reviews, 59, 49–76.
References DING, K., FREYMUELLER, J.T., WANG, Q. & ZOU, R. 2015.
Coseismic and early postseismic deformation of the 5
ATWATER, T. 1970. Implications of plate tectonics for the January 2013 Mw 7.5 Craig earthquake from static
Cenozoic tectonic evolution of western North America. and kinematic GPS solutions. Bulletin of the Seismolog-
Geological Society of America Bullutin, 81, ical Society of America, 105, 1153–1164.
3513–3536. EICHHUBL, P., GREENE, H.G., NAEHR, T. & MAHER, N. 2001.
BARRIE, J.V. & CONWAY, K.W. 1999. Late Quaternary gla- Structural control of fluid flow: Offshore fluid seepage
ciation and postglacial stratigraphy of the northern in the Santa Barbara Basin, California. Journal of Geo-
Pacific margin of Canada. Quaternary Research, 51, chemical Exploration, 69–70, 545–549.
113–123. GREENE, H.G., MAHER, N. & PAULL, C. 2002. Physiography
BARRIE, J.V., CONWAY, K.W. & HARRIS, P.T. 2013. The of the Monterey Bay region and Implications about con-
Queen Charlotte Fault, British Columbia: seafloor anat- tinental margin development. Marine Geology, 181,
omy of a transform fault and its influence on sediment 55–82.
processes. Geo-Marine Letters, 33, 311–318. GREENE, H.G., O’CONNELL, V.M., WAKEFIELD, W.W. &
BARRIE, J.V., GREENE, H.G. ET AL. 2018. The Queen BRYLINSKY, C.K. 2007. The offshore Edgecumbe lava
Charlotte–Fairweather Fault Zone–A Submarine field, southeast Alaska: geologic and habitat character-
Transform Fault, Offshore British Columbia and ization of a commercial fishing ground. In: TODD, B.J. &You can also read