Winter Orographic Precipitation Ratios in the Sierra Nevada-Large-Scale Atmospheric Circulations and Hydrologic Consequences
←
→
Page content transcription
If your browser does not render page correctly, please read the page content below
1102                                    JOURNAL OF HYDROMETEOROLOGY                                                                VOLUME 5

         Winter Orographic Precipitation Ratios in the Sierra Nevada—Large-Scale
                 Atmospheric Circulations and Hydrologic Consequences
                                                        MICHAEL DETTINGER
                           U.S. Geological Survey, Scripps Institution of Oceanography, La Jolla, California

                                                          KELLY REDMOND
                               Western Regional Climate Center, Desert Research Institute, Reno, Nevada

                                                           DANIEL CAYAN
                           U.S. Geological Survey, Scripps Institution of Oceanography, La Jolla, California

                                   (Manuscript received 30 January 2004, in final form 24 May 2004)

                                                               ABSTRACT
                The extent to which winter precipitation is orographically enhanced within the Sierra Nevada of California
             varies from storm to storm, and season to season, from occasions when precipitation rates at low and high
             altitudes are almost the same to instances when precipitation rates at middle elevations (considered here) can
             be as much as 30 times more than at the base of the range. Analyses of large-scale conditions associated with
             orographic precipitation variations during storms and seasons from 1954 to 1999 show that strongly orographic
             storms most commonly have winds that transport water vapor across the range from a more nearly westerly
             direction than during less orographic storms and than during the largest overall storms, and generally the strongly
             orographic storms are less convectively stable. Strongly orographic conditions often follow heavy precipitation
             events because both of these wind conditions are present in midlatitude cyclones that form the cores of many
             Sierra Nevada storms. Storms during La Niña winters tend to yield larger orographic ratios (ORs) than do those
             during El Niños. A simple experiment with a model of streamflows from a river basin draining the central Sierra
             Nevada indicates that, for a fixed overall basin-precipitation amount, a decrease in OR contributes to larger
             winter flood peaks and smaller springtime flows, and thus to an overall hastening of the runoff season.

1. Introduction                                                         may be subject to modulations by multiyear climatic
   About three-quarters of western U.S. water supplies                  fluctuations like El Niño–Southern Oscillation (ENSO;
are derived from high-altitude watersheds, where oro-                   Allan et al. 1996) air–sea interaction of the tropical
graphic precipitation from large-scale winter storms is                 Pacific and its multidecadal counterpart, the Pacific de-
the major contributor (Chang et al. 1987). On average,                  cadal oscillation (PDO; Mantua et al. 1997). Such mod-
precipitation on higher-altitude areas is enhanced com-                 ulation presumably would be accomplished by changes
pared to that on low-lying surroundings as moist air                    in regional atmospheric circulation conditions associ-
masses are lifted by mountain landforms. However, the                   ated with these large-scale climatic processes. If so, and
extent to which high-altitude catchments receive more                   if those circulation changes can be identified and pre-
precipitation than adjacent low-altitude areas varies                   dicted, then it may be possible to predict variations in
from storm to storm, and from year to year, from oc-                    orographic precipitation well in advance. It may even
casions during which nearly equal amounts of precip-                    be possible to project the future of orographic precip-
itation fall at high and low altitudes to occasions when                itation enhancements under global-warming scenarios.
10 or more times as much precipitation falls at the higher                 The objective of the present study, then, was to iden-
altitudes. These differences in precipitation distribution              tify and quantify large-scale atmospheric conditions as-
may have important implications for land and water                      sociated with variations in orographic precipitation on—
resources in the region (as will be illustrated herein) and             as a test case—the windward (western) slopes of the
                                                                        central Sierra Nevada (Fig. 1). Work presented here ex-
                                                                        pands upon previous regional-scale diagnostic efforts
  Corresponding author address: Michael Dettinger, U.S. Geological
Survey, Scripps Institution of Oceanography, Dept. 0224, 9500 Gil-
                                                                        by Reece and Aguado (1992), Aguado et al. (1993), and
man Drive, La Jolla, CA 92093-0224.                                     Pandey et al. (1999), and corroborates (locally) the re-
E-mail: mdettinger@ucsd.edu                                             lations between orographic precipitation and mountain-

q 2004 American Meteorological Society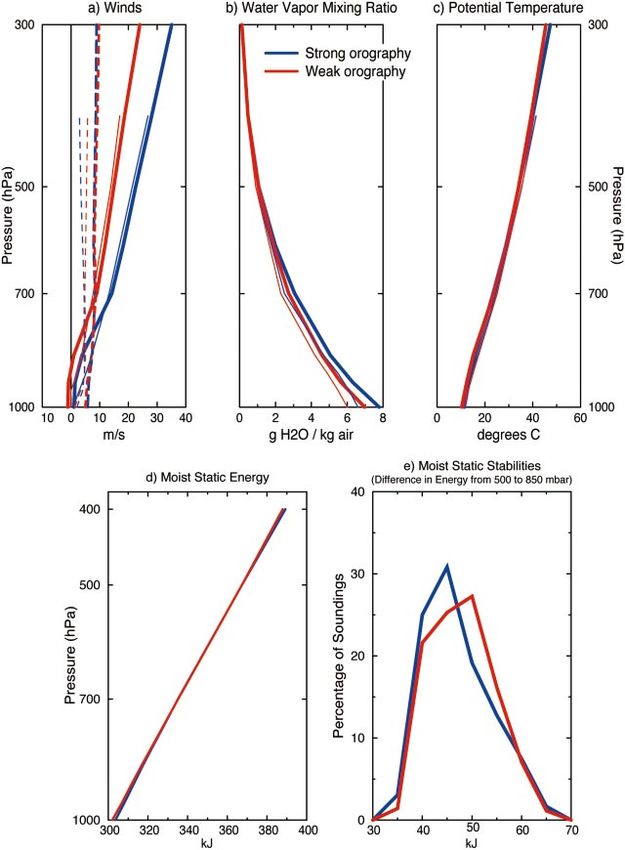
DECEMBER 2004                                       DETTINGER ET AL.                                                      1103

                    FIG. 1. Locations of weather stations used to estimate daily to seasonal orographic precipitation
                  gradients in the central Sierra Nevada; red stars indicate high-altitude stations, and yellow stars
                  indicate low-altitute stations (see Table 1 for details). Blue curve is the trace of the North Fork
                  American River.

slope orientations used in several simplified precipita-             tions to ENSO, as well as its hydrologic consequences
tion models (Rhea and Grant 1974; Colton 1976; Alpert                for a river basin typical of the range.
1986; Hay and McCabe 1998; Pandey et al. 2000).
These previous studies have shown the importance of
                                                                     2. Data
wind directions, relative to the topography of a mountain
range, in determining orographic precipitation amounts                  In order to characterize short- to long-term fluctua-
and distributions, but have neither addressed the long-              tions of these orographic gradients in the central Sierra
term historical variations of orographic precipitation nor           Nevada of California, a local orographic ratio (OR) in-
the influences of interannual climate variations like                dex was formed by computing (for all days with at least
ENSO and PDO. Previous studies also have not spe-                    some precipitation measured in both altitude zones) the
cifically addressed streamflow responses associated with             ratio of the average of precipitation measured at three
variations in orographic precipitation patterns. The pres-           weather stations on the western slope of the range to
ent study characterizes long-term characteristics of oro-            the average at three stations near sea level in the Central
graphic precipitation variations in the central Sierra Ne-           Valley (Fig. 1; Table 1). This ratio measures the local
vada, with the aim of better understanding its long-term             enhancement in precipitation that occurs (typically)
storm-to-storm and year-to-year fluctuations and rela-               from stations near the foot of the mountain range to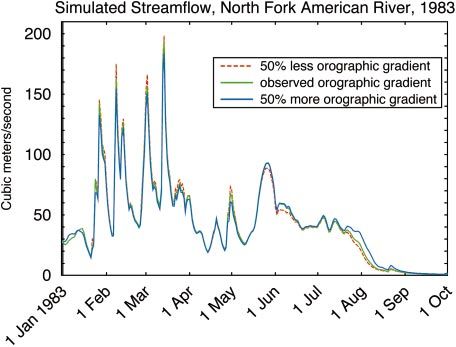
1104                                    JOURNAL OF HYDROMETEOROLOGY                                                               VOLUME 5

  TABLE 1. Locations and altitudes of weather stations used to estimate orographic-precipitation gradients in the central Sierra Nevada.

  Symbol on
    Fig. 1                            Station                              Alt (m)                 Lat                      Lon
                                                                                             Low-altitude stations
       1               Marysville                                             21                 398099N                 1218359W
       2               Sacramento                                              0                 388319N                 1218259W
       3               Stockton                                               10                 378549N                 1218159W
                                                                                            High-altitude stations
       4               Bowman Lake                                          1555                 398279N                 1208399W
       5               Central Sierra Snow Laboratory                       2200                 398199N                 1208229W
       6               Yosemite Park Headquarters                           1300                 378459N                 1198359W

stations a kilometer or two higher and about 100 km                   barrier blocking, jets, and even the evolving details of
farther to the east. The stations were chosen for their               frontal structures, are only distantly accommodated
long and largely unbroken daily precipitation records,                herein; these processes are simply not represented in
for their locations paralleling the range front near the              any but the most local detailed, technically intensive,
American River (Fig. 1), and for their altitudes. The                 and often short-term field campaigns [e.g., with weather
low-altitude stations were among the longest term of                  radar and wind profilers, as in Neiman et al. (2004)].
the near–sea level weather stations in this area, and the             Spatially detailed observations are required to untangle
high-altitude sites were several of the longest-term sta-             the complete determinants of orographic precipitation
tions at highest available altitudes, on the west slope of            and are a very desirable part of near-term local and
the range.                                                            regional weather and streamflow forecasting efforts.
   Ideally, more stations could be included in the av-                However, our longer-term and larger-scale objectives to
erages in order to further reduce the effects of very local           identify long-lead predictive aspects of orographic pre-
rain shadowing differences from site to site and to sta-              cipitation enhancements brought us to our current focus
tion-specific conditions and errors. However, averaging               on the largest-scale conditions, which can be analyzed
for a single OR index should be restricted to stations                consistently over the 50 yr of near-global climate ob-
on parts of the range front that face more or less in the             servations, including the National Centers for Environ-
same directions. Mixing stations from areas of the range              mental Prediction–National Center for Atmospheric Re-
that face, for example, southwestward with stations from
                                                                      search (NCEP–NCAR) reanalysis I atmospheric dataset
areas that face due westward would mix their respective
                                                                      (Kalnay et al. 1996)—which is gridded on the same
uplift influences and muddy the diagnosis of conditions
                                                                      scales as current seasonal climate predictions and cli-
favoring or disfavoring orographic precipitation. The
high-altitude stations used in OR were selected because               mate-change projections—and, as our local ‘‘ground
they were among the highest long-term stations on this                truth,’’ radiosonde soundings from Oakland, California,
part (and face) of the Sierra Nevada, and they lie about              just west of our study area. Profiles of air temperature,
halfway up the western slope in both altitude (Jeton et               water vapor mixing ratios, wind speeds and directions,
al. 1996) and eastward distance. For hydrologic appli-                and geopotential heights were extracted from both da-
cations of OR, this halfway location might actually be                tasets. The reanalysis profiles were used to compute
preferred to stations even higher in the range (if they               daily vertically integrated water vapor transport rates
exist) because, with it, OR measures precipitation near               and directions (described in section 4). Moist static en-
the center of the river basins, draining the range rather             ergies
than measuring it at the farthest extremities of the ba-
sins. Furthermore, Neiman et al. (2002) have shown that                                        gz 1 c p u 1 Lq
the height of the low-level jets in landfalling storms in
California’s Coast Ranges exerts considerable control                 were computed in profiles from the Oakland soundings,
as to where orographic precipitation reaches its maxima,              where g is gravitational acceleration, z is geopotential
and these heights typically are well below 850 hPa and                height, c p is the heat capacity of air, u is potential tem-
well below the highest altitudes in the Sierra Nevada.                perature, L is the latent heat of evaporation, and q is
   Although many local processes strongly influence                   water vapor mixing ratio. Vertical differences in moist
orographic precipitation (e.g., Browning et al. 1975;                 static energy are used as an index of the stability of the
Neiman et al. 2002; and references therein), the present              atmosphere to uplift and convection. Daily surface-air
study focuses on conditions that are reasonably well                  temperatures measured at the six sites used to calculate
represented in large-scale and long-term climatic data-               OR, and historical U.S. weather maps, were also ana-
sets and in current global-scale climate models. This                 lyzed in order to place the daily OR fluctuations into
focus means that a number of important influences, like               perspective with respect to the passage of cold fronts.
DECEMBER 2004 DETTINGER ET AL. 1105
FIG. 2. Distribution of ratios of daily precipitation at high- and FIG. 3. Distributions of daily precipitation amounts on days with
low-altitude sites (Table 1) during Dec–Feb 1954–99. weakly orographic and strongly orographic precipitation ratios, at
high and low altitudes, Dec–Feb 1954–99.
3. Variability of orographic precipitation
altitude and high-altitude sites with the largest OR val-
Daily OR indices were calculated for 723 wet days ues (totaling 181 cases) are compared to conditions on
during Decembers through Februarys from 1954 to an equal number of wet days with the lowest OR values;
1999. Wet days, constituting about one-sixth of the total these are the upper- and lower-OR quartiles, respec-
winter days during this period, were defined as days tively. By compositing winds, temperatures, and hu-
averaging more than 2 mm in both the high- and low- midities at various levels in the atmosphere from a 2.58
altitude stations. The distribution of daily OR values is latitude 3 2.58 longitude NCEP–NCAR reanalysis grid
shown in Fig. 2. On average, 3.3 times as much pre- cell over northern California, averaging values on the
cipitation falls at the high-altitude sites as at the low- storm days in the upper-OR quartile separately from
altitude sites, but the precipitation-weighted mean ratio those in the lower-OR quartile, the average vertical pro-
is 4.0, indicating that the wettest days have a (modest) files of atmospheric conditions associated with the two
tendency to yield more orographic precipitation en- types of storms can be determined (heavy curves; Figs.
hancement. Daily OR indices range from small fractions 5a–c). The corresponding profiles from the Oakland ra-
to almost 30. diosonde record confirm the qualitative aspects of the
The distributions of the high- and low-precipitation reanalysis-based result reasonably well (light curves;
rates during storms with smaller-than-average and larg- Figs. 5a–c). The profiles show that 1) the average east-
er-than-average, ORs (Fig. 3) indicate that storms differ ward components of winds in the large-OR storms are
more in their higher-altitude precipitation rates between stronger at all levels than those during small-OR storms,
large-OR values (strongly orographic storms) and small- 2) the winds during large-OR storms are more humid
OR values (weakly orographic storms) than in their low- at most levels, and 3) temperatures are—on average—
altitude rates. Not so obviously from Fig. 3, there is a
modest tendency for strongly orographic storms to yield
more overall precipitation (averaged over both high- and
low-altitude zones). On average, for every centimeter
of additional average precipitation, OR increases by
about 0.6, but this relation only describes about 10% of
the variance of OR.
Seasonal OR indices, computed from total precipi-
tation accumulations at the low- and high-altitude sta-
tions during winters (December through February),
from 1953 to 1999 are shown in Fig. 4. Winter ORs
average about 3, but, in some years, the ratio drops to
as low as 1 (as in 1991) or rises to as much as 4 or 5
(as in 1959 and 1999).
4. Atmospheric profiles and circulations
These variations in OR occur in response to differ-
ences in storm-time atmospheric conditions. Through-
out this paper, various weather conditions on the 25% FIG. 4. Ratios of high- to low-altitude Dec–Feb precipitation totals,
of all days with measured precipitation at both the low- 1954–99.1106 JOURNAL OF HYDROMETEOROLOGY VOLUME 5
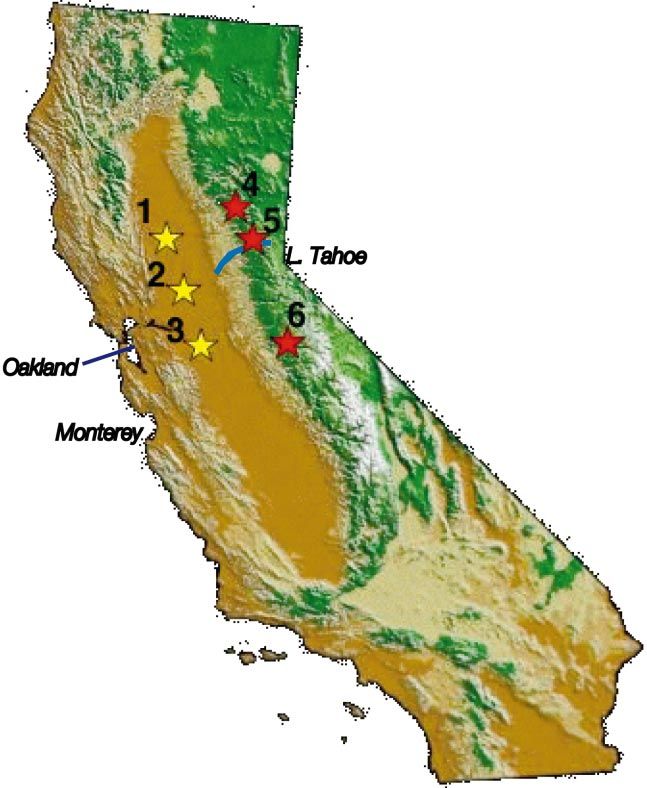
FIG. 5. (a)–(d) Average atmospheric profiles of wind speeds (west–east, solid; south–north,
dashed), water vapor mixing ratios, potential temperatures, and moist static energies, for storms
with orographic precipitation ratios in the upper quartile (blue) and lower quartile (red) of Dec–
Feb storms, 1954–99; heavy curves in (a)–(c) are from NCEP–NCAR reanalysis, and light curves
are from radiosonde soundings at Oakland. Both curves in (d) are from Oakland. (e) Distribution
of differences between moist static energy at 500 and 850 hPa in soundings at Oakland during
days in the upper-OR quartile (blue) and lower-OR (red) quartile.
slightly warmer (,18C below 500 hPa) in large-OR atmosphere is less stable than when the atmosphere is
storms than in small-OR storms. more stable. Case studies have shown that a less stable
The average profiles of moist static energy (Fig. 5d) profile increases the opportunities for more directly up-
indicate that, on average, the atmospheric profiles during and-over wind trajectories to develop, reduces the
large-OR storms are less stable than during small-OR chances for—and strength of—range-front blocking and
storms, having a smaller difference between the energies along-range jets, and also may allow convective en-
at 850 hPa than at 500 hPa in the large-OR storms. hancement of precipitation once topographic uplift of
Despite considerable overlap in the distributions of the air masses begins (Browning et al. 1975; Peterson
those 500- versus 850-hPa static-energy differences et al. 1991; Neiman et al. 2002)
(Fig. 5e), large-OR ratios develop more often when the Although atmospheric stability undoubtedly plays anDECEMBER 2004 DETTINGER ET AL. 1107
FIG. 6. Vertically integrated water vapor transport differences (on average) between Dec–Feb
days with orographic ratios in the upper quartile and the lower quartile, 1954–99. Length of vector
proportional to magnitude of (anomalous) transport and head indicates direction toward which
transport proceeds; star indicates central Sierra Nevada.
important role in establishing orographic precipitation sociated with all large- and small-OR storms can be
patterns, the clearest differences between the large-OR analyzed in more (statistical) detail than is possible with
and small-OR profiles are in their wind fields. To char- the more commonly used geopotential heights, and (b)
acterize these differences more completely, daily ver- that no particular pressure level needs to be specified
tically integrated water vapor transport directions and as the focus of study. Thus, (a) the following analysis
rates were analyzed. No obviously ‘‘special’’ atmo- is not restricted to means or other measures of central
spheric levels—where such differences are focused— tendencies, and (b) storm-to-storm differences in the
are observed in the large-scale data sources for Fig. 5, atmospheric profiles of vapor transport are naturally ac-
and therefore vertically integrated transports (capturing commodated.
the essence of both the wind and humidity profiles) are To visualize the differences in atmospheric circula-
a useful characterization of large-scale atmospheric cir- tions associated with large- and small-OR storms, con-
culations that affect OR. Vertically integrated vapor- sider first the anomalous-transport fields obtained by
transport vectors were calculated—from the NCEP– subtracting averages of the ^qu&’s and ^qy&’s from all
NCAR reanalysis fields—by integrating the products q wet days in the upper-OR quartile from those in the
3 u 3 dp/g and q 3 y 3 dp/g—where q is water vapor lower-OR quartile (Fig. 6). The largest transport dif-
mixing ratio, u is the west–east wind, y is south–north ferences are indicated over the West Coast of the United
wind, dp is the differential pressure (vertical distance States, where a cyclonic whorl of anomalous transports
measured in terms of atmospheric pressure), and g is brings vapor southeastward along the northwest coast
gravitational acceleration—from the earth’s surface to and then almost due eastward into the central Sierra
the 300-hPa pressure level, at each grid point, at 6-h Nevada. Overall, vapor is transported toward the range
intervals, and then summing to form the daily eastward more from the northeast Pacific rather than the sub-
transport component, ^qu&, and northward component, tropical Pacific during the high-OR storms.
^qy&. (Weighting by dp/g ensures that the transports are The transport pattern in Fig. 6 contrasts with the
weighted by the mass of water at each level.) The re- anomalous transports obtained by subtracting average
sulting vectors represent the daily rates and directions transports during the days in the overall-wettest quartile
of overall vapor transport above each grid point. The and subtracting from those in the lowest quartile (Fig.
vectors can be averaged to identify large-scale atmo- 7). The pattern is broadly similar, but has anomalous
spheric circulation patterns that are, on average, asso- transport into the central Sierra Nevada from a more
ciated with various storm types and climatic conditions. southwesterly direction (Pandey et al. 1999) and forms
The transport vectors have the advantages (a) that by a whorl that is centered offshore, rather than inland over
using them, locally over the Sierra Nevada region, the eastern Washington as in Fig. 6. The centers of these
statistical distributions of atmospheric circulations as- whorls represent the locations of low pressure anoma-1108 JOURNAL OF HYDROMETEOROLOGY VOLUME 5
FIG. 7. Same as Fig. 6, except for the differences between large (precipitation total) storms
and small storms.
lies, and, indeed, if similar composites (or correlations) by whether the primary low pressure anomalies are lo-
were made with 700-hPa heights (not shown), the char- cated over Washington or offshore.
acteristic pressure patterns associated with large-OR The full distributions of transport-vector directions at
storms, and with large storms, are distinguished mostly the reanalysis grid cell immediately west of the central
Sierra Nevada for the large-OR storms and small-OR
storms are shown in Fig. 8a; corresponding distributions
for large and small storms are shown in Fig. 8b. The
distribution of transport directions during large-OR
storms is more narrowly peaked than the distribution
for small-OR storms, and peaks with winds from about
608 west of southerly (note that the distributions in Fig.
8 are of actual transport directions rather than anoma-
lous directions). The distribution of transport directions
associated with small-OR storms peaks with winds from
roughly south-southeast and (less often) from slightly
south of westerly.
Notably, the planar slope joining the high- and low-
altitude sites that formed the OR index analyzed here
(Fig. 1) has a direction of steepest ascent that is about
358 south of westerly. Thus the transport direction that
provides the most orographic uplift for inflowing water
vapor is the direction that yields the largest OR values
for this set of stations. This direction of maximum uplift
over the Sierra Nevada also entails vapor transport over
parts of California’s Coast Ranges prior to arrival at the
stations used here (Fig. 1). Consequently, OR ratios may
be influenced by rain shadowing from the Coast Ranges,
especially shadowing of the low-altitude stations. How-
ever, as noted previously (Fig. 3), precipitation totals at
the low-altitude stations differ less—in both absolute
FIG. 8. Distributions of vertically integrated water vapor transport
and relative terms—from large-OR storms to small-OR
directions associated with storms that are (a) weakly or strongly oro- storms than do precipitation totals at the high-altitude
graphic, and (b) large or small storms to dry days. stations. Furthermore, when the calculations for Fig. 6DECEMBER 2004 DETTINGER ET AL. 1109
FIG. 9. (left) Idealized structure and (right) a historical example of a midlatitude low pressure cyclone, showing low
pressure center (‘‘L’’), wind directions, fronts, and air temperatures (after Carlson 1991); the weather map is for the
winter day with the highest OR index, 1 Feb 1963, with a star indicating the central Sierra Nevada [from a National
Oceanic and Atmospheric Administration (NOAA) Daily Weather Map, currently available online through the NOAA
Central Library Data Imaging Project, http://docs.lib.noaa.gov/rescue/dwm/dataprescuepdailypweatherpmaps.html].
are repeated using only the days with low-altitude pre- and those on days with largest OR are significantly dif-
cipitation totals above normal, and then using only days ferent, but they are closely linked in many midlatitude
with low-altitude precipitation totals below normal, the storm systems. The eastward-propagating circulations
same anomalous transport patterns across the central around many winter low pressure storm systems may
California coast and into the central Sierra Nevada are be idealized, as in the left panel of Fig. 9, with a sharp
obtained in each calculation. Thus, reductions of pre- cold front where a warm air mass fed by broadly south-
cipitation at the low-altitude stations, for example, due westerly winds is undercut by cold air with more west-
to rain shadowing or some other influence, do not con- erly and even northwesterly winds. The rapid swing in
trol the observed relation between westerly transport wind directions associated with the passage of such
direction and large-OR values. That relation seems to fronts can quickly substitute cold-sector winds and
have more to do with precipitation and atmospheric con- transports, from westerly directions that favor largest
ditions at the high-altitude stations than at the low-al- OR values, for the preceding warm-sector transports that
titude stations. Other influences certainly affect OR val- arrive from more southwesterly directions, which favor
ues, like rain shadowing by the Coast Ranges (Andrews largest overall precipitation totals.
et al. 2004), differences in stability of the atmosphere Although many winter storms over California are not
from storm to storm and within storms (Browning et al. well described by the idealization in the left panel of
1975), formation of barrier jets (Parish 1982; Neiman Fig. 9, especially not storms with occluded fronts and
et al. 2002), and interactions between the range and the more complex forms, the general pattern of winds
structure of the storms (Neiman et al. 2004), but the shown provides a useful conceptual model for the link-
first-order large-scale influences appear to be differences ages between cold fronts and OR variations in many
in uplift over the range. storms. Visual inspection of the historical daily U.S.
As indicated earlier, the transport directions that favor weather maps associated with the most extreme OR val-
the largest ORs (comparing Fig. 8a to 8b) are not the ues revealed that the idealized structure in the left panel
same as those associated with the largest storms (Pandey of Fig. 9 was clearly recognizable in all of the 20 storms
et al. 1999). Transport directions associated with large with largest OR values; for example, the right panel of
storms are mostly from a more southwesterly direction Fig. 9 shows the weather map for the storm with the
than are the large-OR storms. The winds from the more largest OR value in the time series constructed here.
southwesterly direction associated with large storms are, Visual inspection of the weather maps, furthermore,
on average, warmer and moister than are the more west- showed that the Sierra Nevada were in the cold sectors
erly winds associated with large-OR storms, and thus of 19 of the 20 largest OR storms. The central Sierra
can support larger storm totals (Pandey et al. 1999). Nevada area was in the warm sector of winter storms,
Transport directions on days with most precipitation distant from any mapped fronts, or affected by occluded1110 JOURNAL OF HYDROMETEOROLOGY VOLUME 5
FIG. 10. Same as Fig. 6, except for the differences between days in the upper-OR quartile and the day
before; inset shows distribution of directions of change in transport immediately off the California coast
(37.58N, 127.58W) from the day before to the day of the upper-quartile OR events.
frontal systems in each of the 20 smallest OR storms. most overall precipitation to their following days, which
The idealized Fig. 9 also was recognizable in the weath- form a pattern that is nearly the opposite of Fig. 10;
er maps for each of the 10 overall wettest storms, with this pattern is consistent, in turn, with an association
the Sierra Nevada in the corresponding warm sector of between the wettest days and the passage of warm sec-
each storm system. Thus, although many (perhaps, tors.
most) winter storms are not as simple as in Fig. 9, its Thus large-OR storms in the central Sierra Nevada
lessons apply well to the largest OR and largest overall are sometimes, and perhaps most often, derived from
storms in the central Sierra Nevada. the cold sectors of winter storms. In the central Sierra
The average differences between transports on days Nevada, this association is, in part, due to a propitious
in the upper-OR quartile and the immediately preceding orientation of the mountain front. However, orographic
day—and the overall distribution of these differences— precipitation is frequently enhanced in the cold sectors
are shown in Fig. 10. A strong reduction of southerly in many mountain settings, despite range orientations
components of West Coast winds on the days with larg- (e.g., Browning et al. 1975). The cold air behind mid-
est OR from the days immediately preceding is indicated latitude cold fronts tends to be less convectively stable
on average. This average reduction reflects the frequent than the warm air that precedes it (Carlson 1991), and
occurrence of changes in transport direction of between this frequently is true over the central California coast
about 21358 and 2608 away from westerly (Fig. 10, (Fig. 11) and may contribute to the orographic precip-
inset). Southerly transport components were reduced, itation rates when convection is initiated by orographic
from the previous day, on 72% of the days in the upper- uplift (e.g., Neiman et al. 2004).
OR quartile, and transport vectors rotated more than 458 In keeping with frequent occurrences of these rapid
counterclockwise, from the preceding days, on 88% of transitions between transports that favor more precipi-
the days. Thus, although it is difficult to be exhaustive tation to those that favor larger OR, on average, more
about the location of fronts on the climatological time (total) precipitation falls on the days before days in the
scales considered here (as no long-term digital database upper OR quartile than on the large-OR days them-
of front configurations is readily available), wind and selves. Conversely, on average, OR values are signifi-
transport conditions consistent with the passage of cold cantly smaller immediately before the highest OR days.
fronts are present on a large majority of the 181 days More than half of the days in the upper OR quartile are
in the upper quartile of OR. Figure 10 also suggests preceded by days in the upper 40% of total wetness;
that, although fronts are not well represented in re- only about one-third of the same high-OR days are this
analysis fields and global-climate simulations, the effect wet. Daily mean temperatures are modestly (but sig-
of cold-front passages on transport directions are rea- nificantly, at p ; 0.05) cooler on the highest OR days
sonably well captured for climatological purposes. Not than on the day before, and by the day after a high-OR
shown are the transport differences from the days with event, temperatures are substantially (21.58C) cooler,DECEMBER 2004 DETTINGER ET AL. 1111
southwesterly vapor transports into the Sierra Nevada.
During La Niña winters, in contrast, transport from the
south is diminished. These El Niño–La Niña differences
are more commonly identified in the changes (or cor-
relations) of geopotential heights in association with
variations of ENSO indices such as the Niño-3.4 sea
surface temperature index (Fig. 12b). Negative corre-
lations (associating low pressure anomalies with posi-
tive Niño-3.4 deviations) over the northeastern Pacific
and southern United States and positive correlations
over north-central North America reflect the southward
displacement of storm tracks during El Niño winters
(with their positive Niño-3.4 indices; Dettinger et al.
2001). The correlations of 700-hPa heights with the sea-
sonal values of OR (Fig. 4), shown in Fig. 12c, are
FIG. 11. Distribution of changes in moist static energy differences
between 500 and 850 hPa immediately off the California coast roughly the negative of the correlations with Niño-3.4
(37.58N, 127.58W) from the day before to the day of the upper-quartile (Fig. 12b), with positive correlations, indicating high
OR events. pressure anomalies over the northern Pacific and south-
ern states, and negative correlations (low pressures) over
northwestern North America. Thus on average, as sug-
on average. All of these rapid changes immediately be- gested by Fig. 12a, El Niño winters are negatively as-
fore and after the high-OR days are consistent with the sociated with the atmospheric circulations that favor
frequent occurrence of this sequence of events: (day 21) large-OR values.
the warm-air sector east of a cold fronts arrives with These associations of winter-averaged circulations
southwesterly winds that favor large precipitation totals; that favor (or disfavor) large values of the particular OR
(day 0) the passage of the front rapidly brings winds to series constructed here with La Niñas (El Niños) are
a westerly or northwesterly direction and introduces less neither exact nor unfailing. For example, the long-term
stable conditions, which favor high-OR values; and (day correlation between Niño-3.4 SST and our OR is only
11) cold air behind the front yields substantial cooling r 5 20.20. However, ENSO relations to OR values can
and less total precipitation (but continuing high-OR val- be stronger in some places; for example, correlations
ues). Thus, the passage of low pressure systems and, between an OR index of Sacramento and Lake Tahoe,
especially, of cold fronts can strongly and rapidly affect California, precipitation rates and another ENSO index
OR and precipitation amounts and may frequently serve (the Southern Oscillation index; Allan et al. 1996) was
to link, and yet separate, days with heaviest precipitation almost r 5 10.4. Given the local variations in the ENSO
to subsequent days with large-OR values. The associ- influence on OR, it is worth considering the full distri-
ation with cold sectors of midlatitude storms is a com- butions of transport directions into the Sierra Nevada
mon aspect of orographic precipitation in many settings during storms in El Niño winters and La Niña winters,
(e.g., Browning et al. 1975) due to enhanced instabilities as shown in Fig. 13a. Transport directions during storms
in these sectors, but the association may be enhanced in La Niña winters are more focused and are focused
in the central Sierra Nevada where the cold-sector vapor at more nearly the optimal direction for large-OR values
transport directions are often well suited to ensure nearly than are transports during storms in El Niño winters.
normal approaches to the range front. Interestingly, the distribution of transports during El Ni-
ños is bimodal, with a peak near the direction favored
by large-OR storms (Fig. 8a) and another, equal peak
5. Climatic underpinnings
near the direction favored by the overall largest storms
The atmospheric circulations that modulate OR, in (Fig. 8b). As a consequence of these transport-direction
turn, may be modulated on interannual time scales by distributions, (a) more storms during La Niña winters
fluctuations of ENSO between its warm tropical El Niño have had large-OR values, and fewer have had small
states and its cool tropical La Niña states. The global values, than among the El Niño storms (Fig. 13b), and
pattern of regression coefficients describing the varia- (b) El Niño winters include more of the largest winter
tions of the December–February averages of the verti- storms than do La Niña winters (not shown). Notably,
cally integrated water vapor transport vectors in re- in other settings in California, the topography is oriented
sponse to each degree Celsius of warming (by El Niños) differently from the area considered here, and El Niño
in the equatorial central Pacific is shown in Fig. 12a. circulations are almost ideally situated to generate large-
The ENSO-induced changes in wintertime transport di- OR values (e.g., in the Coast Ranges near Monterey,
rections over the northeastern Pacific and West Coast California; Andrews et al. 2004).
of North America are significant and, on average, El During El Niño winters, storm tracks tend to cross
Niño winters yield more anomalously southerly and the West Coast farther south than during La Niña winters1112 JOURNAL OF HYDROMETEOROLOGY VOLUME 5
FIG. 12. (a) Regression coefficients relating each 18C increase in average Dec–Feb SST in the Niño-3.4 region (58S
to 58N, 1208 to 1708W) to Dec–Feb mean water vapor transport vectors during wet days in the central Sierra Nevada,
1950–98; the eastward extent of each vector measures the regression coefficient relating Dec–Feb averages of eastward
vapor transport on wet days in the central Sierra Nevada to the corresponding Niño-3.4 SST index; the northward
extent of the vector measures the regression coefficient between northward transport and Niño-3.4. Vectors are only
mapped if at least one of the regression coefficients is significantly different from zero by a Student’s t test. (b), (c)
Correlations of Dec–Feb mean 700-hPa heights with the Niño–3.4 SST index and winter-mean OR for the central
Sierra Nevada, respectively.
(Dettinger et al. 2001). The southward displacement of exclusively ‘‘El Niño–like’’ or ‘‘La Niña–like.’’ Rather,
storm tracks during El Niño winters brings the storm ENSO status only conditions El Niño and La Niña OR
centers (like the idealized cyclone of Fig. 9) southward distributions that overlap considerably.
toward the Sierra Nevada and may explain the bimodal On decadal time scales, the anomalous vapor-trans-
(southwesterly and westerly) distribution of transports port pattern (not shown here) associated with the PDO
associated with El Niño storms (Fig. 13a). The south- (Mantua et al. 1997)—like so many other aspects of that
westerly and westerly winds around midlatitude cy- interdecadal variation of the North Pacific climate sys-
clones are typically strongest in the parts of the warm tem—closely resembles the corresponding ENSO pat-
and the cold sector nearest the low pressure center, and tern in Fig. 12a. However, on the multidecadal time
the southward displacement of the storms may increase scales that characterize fluctuations of the PDO, many
the chances that these sectors will impinge upon the different strong ENSO and weak ENSO winters are
range vigorously and in rapid succession. Winter storms mixed, and many different storm configurations reach
often arrive at the West Coast along more zonal paths the central Sierra Nevada. Thus, the distributions of
during El Niño winters (Dettinger et al. 2001). In con- transport directions associated with the positive (El
trast, during La Niña winters, the storm cores cross the Niño–like) and negative (La Niña–like) phases of PDO
West Coast farther north, and, in many instances, only are not as distinct (Fig. 14a) as were the corresponding
the cold-front ‘‘tail’’ and the westerly winds behind it distributions with ENSO (Fig. 13a). Fewer storms dur-
in the cold sectors reach the Sierra Nevada in force. ing the negative PDO phases have southerly transports
However, within any given El Niño winter, there is than in the positive PDO phase, and relatively more
enough scatter between storm tracks and configurations (about 5%) yield transports optimal for large-OR values.
(Yarnal and Diaz 1986) so that storm OR values are not The result is a small overall increase in the number ofDECEMBER 2004 DETTINGER ET AL. 1113
FIG. 14. Distributions of (a) water vapor transport directions and
(b) orographic precipitation ratios associated with storms during pos-
FIG. 13. Distributions of (a) water vapor transport directions and itive- and negative-PDO winters, 1954–99.
(b) orographic precipitation ratios associated with storms during El
Niño and La Niña winters, 1954–99.
that lower-OR values (for a given total precipitation
amount) can aggravate them.
large-OR storms, and a decrease in the number of small- This general set of hydrologic consequences can be
OR storms, during negative PDO regimes compared to illustrated succinctly with simulations of streamflow re-
positive PDO regimes (Fig. 14b). sponses to prescribed (hypothetical) changes in oro-
graphic precipitation in watershed models with enough
spatial detail to represent elevational differences in pre-
6. Hydrologic consequences
cipitation amounts, precipitation form (rain or snow),
Variations in OR, from storm to storm and from sea- and snowmelt rates. Thus, as an illustration of the in-
son to season, have the potential to significantly influ- fluence of OR on streamflow in the Sierra Nevada, a
ence the quantity and timing of water supplies from the detailed watershed model of the North Fork American
central Sierra Nevada, and analogous variations of the River above Sacramento (Fig. 1), developed and cali-
strength of orographic precipitation gradients in other brated by Jeton et al. (1996), was used to simulate
mountain ranges may exert similar influences on most streamflow differences during January through Septem-
western rivers. When disproportionately little precipi- ber of 1983, under three specified OR regimes.
tation is deposited at high altitudes (small-OR condi- The North Fork American River drains a basin that
tions), even a ‘‘wet’’ year may yield less of the crucial spans the full range of altitudes of the western slope of
warm-season snowmelt runoff than expected. Converse- the Sierra Nevada, in the midst of the stations used to
ly, the added high-altitude precipitation and snowpack calculate the OR time series considered here (Fig. 1).
associated with large-OR winters will yield more dis- The North Fork American River watershed model uses
charge when the snowpack finally begins to melt. Flood the Precipitation-Runoff Modeling System (Leavesley
generation by winter storms also depends on their OR and Stannard 1995) and represents spatial variations of
values, with warm-storm floods being aggravated when topography, climate, vegetation, and soils that are 100
the storms have larger-OR values so that they provide m or larger in terms of ‘‘pixelated’’ hydrologic response
more precipitation as rain at middle and higher altitudes. units (HRUs; Jeton and Smith 1993). The model sim-
Recall that, on average, high-OR storms are somewhat ulates streamflow generation by rainfall and snowmelt
warmer than storms with very low OR values; this re- runoff over the land surfaces and through the subsur-
sults in storm-time snow lines (on the surface) that are face, on daily time steps, in response to daily precipi-
150–300 m higher during high-OR storms. Cool-storm tation totals and maximum and minimum temperatures
floods are dependent on abundant low-altitude rains so at four long-term weather stations at altitudes ranging1114 JOURNAL OF HYDROMETEOROLOGY VOLUME 5
from 700 to 2100 m above sea level. The model has
been used previously to hindcast and forecast stream-
flow from days to months in the future (Dettinger 1997;
Dettinger et al. 1998, 1999; Miller et al. 1999) and to
estimate climate-change responses (Jeton et al. 1996;
Miller et al. 2001; Wilby and Dettinger 2000).
In the American River model, each HRU receives the
same daily precipitation as was measured at the weather
station closest in elevation to it. For simulations of the
effect of orographic precipitation gradients on stream-
flow, it was necessary to adjust the daily station pre-
cipitation rates to reflect the desired changes in the pre-
cipitation gradients while maintaining the simulation-
period basin-total precipitation at its observed value. An
adjustment factor for the daily precipitation inputs from
each station was derived by fitting a regression relation
between precipitation totals for 1983 at each station and FIG. 15. Simulated streamflow hydrographs for the North Fork
the elevations of the stations, to obtain American River, Jan–Sep 1983, with observed precipitation patterns
and patterns adjusted to maintain the same total amounts but with an
P i 5 C 1 bE i , (1) artificially imposed 50% increase in orographic precipitation gradient
and a 50% decrease in orographic precipitation gradient.
where P i is the annual total (or average) precipitation
at station i; E i is the elevation there; C is the fitted
intercept; and b is the slope of the regression line. For Streamflow was simulated in response to 1) k 5 1,
the simulations with alternative orographic precipitation the case where observed 1983 daily distributions of tem-
gradients, we required that a new (hypothetical) set of perature and precipitation were applied; 2) k 5 1.5, a
precipitation rates, P9i , equal hypothetical precipitation distribution with the basin-
total precipitation the same as observed, but with the
P9i 5 C9 1 kbE i , (2)
average orographic gradient increased by 50% (making
where C9 is a new constant (required to maintain the ORs uniformly larger), and 3) k 5 0.5, a hypothetical
observed basin-total precipitation rate), and k multiplies precipitation distribution with the precipitation total the
b to adjust the orographic precipitation gradient as de- same, but with the gradient decreased by 50% (making
sired. The multiplier k is specified, which leaves C9 to ORs uniformly smaller). Temperature inputs and all oth-
be determined from the constraint that basin-total pre- er variables and parameters were not changed from sim-
cipitation is not changed, ulation to simulation.
In response to these changes in the spatial distribu-
^A i P i & 5 ^A i P9&,
i (3)
tions, but not overall amounts, of precipitation, stream-
where brackets ^ & indicate totalling over the basin, and flow flood peaks caused by winter storms (which con-
A i is the area within the basin that receives P i . Solving tinued into May that year) increased by 15% when OR
for C9 in Eqs. (1) to (3), and then substituting back into was reduced, and streamflow during the April–July
Eq. (2), yields snowmelt decreased by about 10% (Fig. 15). Although
temperatures were not changed from simulation to sim-
P9i 5 ^A i P i &/^A i & 2 kb^A i E i &/^A i & 1 kbE i . (4)
ulation, the larger OR (k 5 1.5) precipitation distribu-
This equation describes the adjustments to the annual tion provides less precipitation at lower altitudes than
precipitation totals at each station, but on a daily basis, did the small OR (k 5 0.5) distribution. Because much
a multiplier is preferable (e.g., so that dry days remain of the missing precipitation at the lower altitudes would
dry). Thus, from Eq. (4), we derived multipliers g i of have been delivered as rainfall or as short-lived snow,
daily precipitation values at each station that ensure that less runoff was generated from rainfall and storm-time
the total P9i at the station, determined from Eq. (4), snowmelt in the large-OR simulation. Consequently,
would equal g i P i . The multipliers g i that accomplish winter flood peaks were smaller. More precipitation—
this are typically as snowfall—was delivered at the higher al-
titudes, so proportionally more of the precipitation input
g i 5 ^A i Pi &/^A i &Pi 2 kb^A i E i &/^A i &Pi 1 kbE i /Pi . (5)
to the basin was stored in high-altitude snowfields. Con-
A multiplier is thereby determined for each of the weath- sequently, spring and summer snowmelt runoff from the
er stations, depending on the desired OR adjustment k, high altitudes was larger and lasted longer. The effects
on the observed P i totals for 1983, and on the regression of the small-OR precipitation distribution on rainfall,
coefficient b fitted to total P i and E i . Then all daily snowmelt, flooding, and warm-season runoff were just
precipitation values were multiplied by the g i’s for each the opposite.
simulation described here. Together, the increases in winter runoff and decreasesDECEMBER 2004 DETTINGER ET AL. 1115
in spring runoff yield an earlier overall runoff regime vestigated large-scale atmospheric conditions from long-
under the small-OR conditions, with the day of year by term climatic datasets to explore associations with oro-
which half the year’s runoff has passed coming a full graphic precipitation in the central Sierra Nevada area.
week earlier. Similar results were obtained from simu- Strongly orographic storms most commonly have
lations (not shown) of streamflow responses to similarly winds that transport water vapor across the range from
specified OR changes in a model of the upper Merced a nearly westerly direction, which contrasts with wind
River basin (Wilby and Dettinger 2000), above Yosem- directions associated with the overall wettest storms. The
ite Valley (Fig. 1), and from simulations of both rivers atmosphere is also less convectively stable during highly
in years other than 1983. The North Fork American orographic storms; however, this association is not as
River, in 1983, yields especially large responses to OR distinct as is the influence of transport directions. Strong-
changes (i) because the American River model repre- ly orographic conditions often follow heavy precipitation
sents a more balanced mix of high and low altitudes events because they are present in the warm and cold
(and precipitation rates) than does the upper Merced sectors, respectively, of midlatitude cyclones that form
River model, which is almost entirely above 2000 m the cores of many wintertime storms in the Sierra Nevada.
above sea level, and (ii) because 1983 had an especially La Niña winters have yielded more storms with large
long wet season, which accentuated the different runoff orographic ratios (ORs) than have El Niños winters. Win-
responses of the low and high parts of the basins. Both ters during negative (La Niña–like) PDO winters tend to
of these factors heighten the effects of OR change. yield slightly more storms with large ORs than do pos-
This simulated hastening of runoff timing in Fig. 15 itive-PDO winters. No long-term trends are detected in
is in the same sense as, and is of comparable magnitude the particular OR series studied here.
to, observed trends in western North American runoff A simple experiment with a watershed model of the
timing during recent decades (Cayan et al. 2001). The North Fork American River shows that, for a fixed basin-
observed timing trends have been ascribed mostly to total precipitation amount, a decrease in OR contributes
long-term warming of winters and springs (Cayan et al. to larger winter flood peaks because more precipitation
2001). The possible role of OR variations in causing is deposited (largely as rain) at lower altitudes. A spec-
the observed timing trends needs more attention, be- ified reduction of OR also yields smaller springtime flows
cause, even with no change in temperatures or in overall because less snow is deposited at the highest altitudes.
precipitation amounts and timing, runoff timing can be Together these changes demonstrate that streamflow rates
changed by OR variations alone. In the present study, and timing from the Sierra Nevada can be influenced by
no long-term trend in OR of the duration or magnitude fluctuations of OR, even if temperatures, precipitation
needed to explain recent interdecadal runoff timing amounts, and precipitation timing do not change.
trends is evident (Fig. 4). However, other studies have Variations in large-scale atmospheric circulation pat-
argued that long-term historical changes in the oro- terns and transport directions can be used to identify
graphic gradients should be, and probably are, present long-term tendencies—when they exist—toward larger-
(Rosenfeld 2000; Rosenfeld et al. 2003), due to local or smaller-OR values. Variations in storm-time atmo-
influences of air pollution on winter storms. If OR is spheric stability also influence OR values, albeit some-
changing systematically in parts of the Sierra Nevada what less distinctly than do the transport directions. The
and other western mountain ranges, those changes large-scale circulation differences may be recognizable
would certainly complicate interpretations of recent even in models and predictions that do not contain
streamflow-timing trends in the Sierra Nevada. enough topographic detail, or adequate moist physics,
to directly represent the Sierra Nevada topography and
orographic precipitation. If the climate processes at
7. Summary
work in a particular prediction (e.g., midlatitude cy-
The extent to which winter precipitation is orograph- clones, El Niños, and even global warming) yield re-
ically enhanced as one moves up into the Sierra Nevada liable projections of changes in atmospheric circulations
varies from storm to storm, and season to season, from over the northeast Pacific, in ways that project signifi-
occasions when there is little difference between high- cantly onto, or away from, the ‘‘preferred’’ transport
and low-altitude precipitation rates to instances when pre- directions for orographic precipitation in the Sierra Ne-
cipitation rates at middle elevations (considered here) can vada, then projections of the future of orographic pre-
be as much as 30 times larger than at the base of the cipitation might be possible, even using a model with
range. Many local-scale processes strongly affect oro- no Sierra Nevada at all.
graphic precipitation; these processes are typically not However, the results presented here describe relations
recorded in large-scale or long-term climatic datasets, nor between large-scale atmospheric circulations and oro-
are they simulated in the large-scale models used for graphic precipitation distributions in a rather local set-
seasonal climate forecasts or climate-change projections. ting, centered on a part of the central Sierra Nevada.
In order to better interpret the longer history of oro- The results presented here locally confirm simple geo-
graphic precipitation patterns, and to prepare for predic- metric and stability relations with orographic precipi-
tions of future changes in those patterns, this study in- tation that have been used in simple precipitation-in-1116 JOURNAL OF HYDROMETEOROLOGY VOLUME 5
terpolation schemes (e.g., Rhea and Grant 1974; Hay Linkages: Present and Past Climates in the Americas and Their
Societal Effects, V. Markgraf, Ed., Academic Press, 1–16.
and McCabe 1998; Pandey et al. 2000). Further inves- Hay, L. E., and G. J. McCabe, 1998: Verification of the Rhea-Oro-
tigation of long-term climate-driven aspects of those graphic-Precipitation model. J. Amer. Water Resour. Assoc., 34,
relations, extending the present results to additional ar- 103–112.
eas and ranges, would provide a useful avenue for pre- Jeton, A. E., and J. L. Smith, 1993: Development of watershed models
dicting changes in the climatology of OR throughout for two Sierra Nevada basins using a Geographic Information
System. Water Resour. Bull., 29, 923–932.
the region, by allowing OR predictions of considerable ——, M. D. Dettinger, and J. L. Smith, 1996: Potential effects of
spatial detail to be formulated from mountain-slope ori- climate change on streamflow, eastern and western slopes of the
entations combined with predicted circulation changes Sierra Nevada, California and Nevada. U.S. Geological Survey
over the northeastern Pacific. Water Resources Investigations Rep. 95-4260, 44 pp.
Kalnay, E., and Coauthors, 1996: The NCEP/NCAR 40-Year Re-
analysis Project. Bull. Amer. Meteor. Soc., 77, 437–471.
Acknowledgments. This study was funded by the Cal- Leavesley, G. H., and L. G. Stannard, 1995: The precipitation-runoff
ifornia Energy Commission’s California Climate modeling system—PRMS. Computer Models of Watershed Hy-
drology, V. P. Singh, Ed., Water Resource Publications, 281–310.
Change Center at Scripps Institution of Oceanography, Mantua, N. J., S. R. Hare, Y. Zhang, J. M. Wallace, and R. C. Francis,
by NOAA’s California Applications Program, and by 1997: A Pacific interdecadal climate oscillation with impacts on
the Geological Survey’s Hydroclimatology and San salmon production. Bull. Amer. Meteor. Soc., 78, 1069–1079.
Francisco Bay Priority Ecosystem Programs. Miller, N., J. W. Kim, and M. D. Dettinger, 1999: California stream-
flow evaluation based on a dynamically downscaled 8-year hind-
cast (1988–1995), observations, and physically based hydrologic
models. Eos, Trans. Amer. Geophys. Union, 80 (Fall Meeting
REFERENCES Suppl.), Abstract H32G-09.
——, ——, and ——, 2001: Climate change sensitivity analysis of
Aguado, E., D. Cayan, B. Reece, and L. Riddle, 1993: Patterns of two California headwaters: American River and Russian River:
orographic uplift in the Sierra Nevada and their relationship to Proc. 17th Pacific Climate (PACLIM) Workshop, Santa Catalina
upper-level atmospheric circulation. Proc. Ninth Pacific Climate Island, CA, California Department of Water Resources, Inter-
(PACLIM) Workshop, Pacific Grove, CA, California Department agency Ecological Program Rep. 67, 110.
of Water Resources, Interagency Ecological Studies Program Neiman, P. J., F. M. Ralph, A. B. White, D. E. Kingsmill, and P. O.
Tech. Rep. 34, 153–163. G. Persson, 2002: The statistical relationship between upslope
Allan, R. J., J. Lindesay, and D. Parker, 1996: El Niño, Southern flow and rainfall in California’s coastal mountains—Observa-
Oscillation & Climatic Variability. CSIRO Publishing, 405 pp. tions during CALJET. Mon. Wea. Rev., 130, 1468–1492.
Alpert, P., 1986: Mesoscale indexing of the distribution of orographic ——, P. O. G. Persson, F. M. Ralph, D. P. Jorgensen, A. B. White,
precipitation over high mountains. J. Climate Appl. Meteor., 25, and D. E. Kingsmill, 2004: Modification of fronts and precipi-
532–545. tation by coastal blocking during an intense landfalling winter
Andrews, E. D., R. C. Antweiler, P. J. Neiman, and F. M. Ralph, 2004: storm in southern California: Observations during CALJET.
Influence of ENSO on flood frequency along the California coast. Mon. Wea. Rev., 132, 242–273.
J. Climate, 17, 337–348. Pandey, G. R., D. R. Cayan, and K. P. Georgakakos, 1999: Precipi-
Browning, K. A., C. W. Pardoe, and F. F. Hill, 1975: The nature of tation structure in the Sierra Nevada of California during winter:
orographic rain at wintertime cold fronts. Quart. J. Roy. Meteor. J. Geophys. Res., 104 (D10), 12 019–12 030.
Soc., 101, 333–352. ——, ——, M. D. Dettinger, and K. P. Georgakakos, 2000: A hybrid
Carlson, T. N., 1991: Mid-latitude Weather Systems. Harper Collins model for interpolating daily precipitation in the Sierra Nevada
Academic, 507 pp. of California during winter. J. Hydrometeor., 1, 491–506.
Cayan, D. R., S. Kammerdiener, M. D. Dettinger, J. M. Caprio, and Parish, T. R., 1982: Barrier winds along the Sierra Nevada Mountains.
D. H. Peterson, 2001: Changes in the onset of spring in the J. Appl. Meteor., 21, 925–930.
western United States. Bull. Amer. Meteor. Soc., 82, 399–415. Peterson, T. C., L. O. Grant, W. R. Cotton, and D. C. Rogers, 1991:
Chang, A. T. C., J. L. Foster, P. Gloersen, W. J. Campbell, E. G. The effects of decoupled low-level flow on winter orographic
Josberger, A. Rango, and Z. F. Danes, 1987: Estimating snow- clouds and precipitation in the Yampa River valley. J. Appl.
pack parameters in the Colorado River basin. Proc. Large Scale Meteor., 30, 368–386.
Effects of Seasonal Snow Cover, Vancouver, BC, Canada, In- Reece, B., and E. Aguado, 1992: Accumulation and melt character-
ternational Union of Geodesy and Geophysics, IAHS Publication istics of northeastern Sierra Nevada snowpacks. Managing Water
Resources under Global Change, H. Raymond, Ed., American
166, 343–353.
Water Resources Association, 631–640.
Colton, D. E., 1976: Numerical simulation of the orographically in-
Rhea, J. O., and L. O. Grant, 1974: Topographic influences on snowfall
duced precipitation distribution for use in hydrologic analyses.
patterns in mountainous terrain. Proc. Symp. on Advanced Con-
J. Appl. Meteor., 15, 1241–1251.
cepts and Techniques in the Study of Snow and Ice Resources,
Dettinger, M. D., 1997: Forecasting runoff pulses in the Merced River, Monterey, CA, National Academy of Sciences, 182–192.
Yosemite Valley, California, springs 1979–97: Eos, Trans. Amer. Rosenfeld, D., 2000: Suppression of rain and snow by urban and
Geophys. Union, 78 (Fall Meeting Suppl.), Abstract H21F-8. industrial air pollution. Science, 287, 1793–1796.
——, K. C. Mo, D. R. Cayan, and D. H. Peterson, 1998: Hindcasts ——, A. Givate, A. Khain, and G. Kelman, 2003: Urban aerosol-
and forecasts of streamflow in the Merced and American Rivers, induced changes of precipitation. Eos, Trans. Amer. Geophys.
Sierra Nevada, during recent El Niños. Eos, Trans. Amer. Geo- Union, 84 (Fall Meeting Suppl.), Abstract U51A-02.
phys. Union, 79 (Fall Meeting Suppl.), Abstract H22E-06. Wilby, R. L., and M. D. Dettinger, 2000: Streamflow changes in the
——, ——, ——, and A. E. Jeton, 1999: Global to local scale sim- Sierra Nevada, California, simulated using statistically down-
ulations of streamflow in the Merced, American, and Carson scaled general circulation model output. Linking Climate Change
Rivers, Sierra Nevada, California. Preprints, 14th Conf. on Hy- to Land Surface Change, S. McLaren and D. Kniveton, Eds.,
drology, Dallas, TX, Amer. Meteor. Soc., 80–82. Kluwer Academic, 99–121.
——, D. S. Battisti, R. D. Garreaud, G. J. McCabe, and C. M. Bitz, Yarnal, B., and H. F. Diaz, 1986: Relationships between extremes of
2001: Interhemispheric effects of interannual and decadal ENSO- the Southern Oscillation and the winter climate of the Anglo-
like climate variations on the Americas. Interhemispheric Climate American Pacific coast. J. Climatol., 6, 197–219.You can also read