Findings Report of the Speed Management and Speed Limits Bylaw 2009 Review - Attachment A
←
→
Page content transcription
If your browser does not render page correctly, please read the page content below
Attachment A

Findings Report of the
 Speed Management
   and Speed Limits
 Bylaw 2009 Review
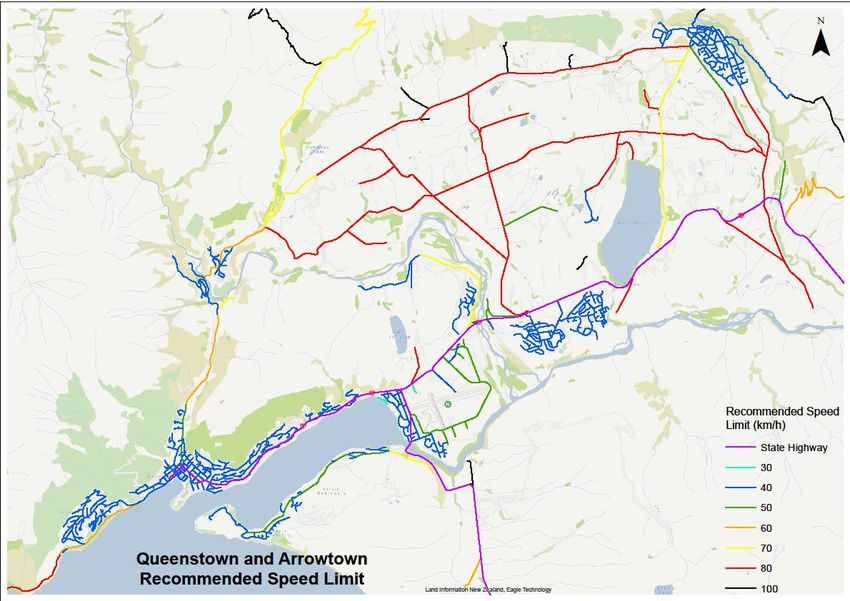
TABLE OF CONTENTS
1     Summary of key findings ................................................................................................................. 4
2     Introduction .................................................................................................................................... 6
    2.1      Purpose of the report ............................................................................................................. 6
    2.2      Why review now ..................................................................................................................... 6
      2.2.1          Changes in Legislation ..................................................................................................... 6
      2.2.2          Changes to Speed Management Guidance ..................................................................... 6
    2.3      Safer journeys strategy ........................................................................................................... 7
    2.4      Scope ....................................................................................................................................... 7
    2.5      Out of scope ............................................................................................................................ 8
    2.6      Methodology........................................................................................................................... 8
3     What currently governs speed limits .............................................................................................. 9
    3.1      The Government Policy Statement on Land Transport 2018 ................................................. 9
    3.2      National legislation regulating speed limits .......................................................................... 10
    3.3      Changes to the land transport rule 54001: setting of speed limits 2017 ............................. 10
    3.4      District plan ........................................................................................................................... 10
    3.5      Current bylaw........................................................................................................................ 11
4     Speed Management ...................................................................................................................... 12
    4.1      New Zealand Speed Management Guide ............................................................................. 12
      4.1.1          Speed Management Framework .................................................................................. 12
      4.1.2          Speed Management Map.............................................................................................. 12
      4.1.3          Inputs to Determining Safe and Appropriate Operating Speeds .................................. 13
5     District Context ............................................................................................................................. 17
    5.1      Vehicle use growth................................................................................................................ 17
    5.2      Local and national road crash data (Includes state highways) ............................................. 17
      5.2.1          District Crash Statistics Summary 2000-2017 ............................................................... 20
      5.2.2          District Crash Locations 2000-2017 .............................................................................. 20
    5.3      The role of speed in crashes ................................................................................................. 21
    5.4      Social Cost ............................................................................................................................. 22
    5.5      Council’s road network ......................................................................................................... 23
      5.5.1          Variable speeds ............................................................................................................. 23
      5.5.2          Temporary speed limits ................................................................................................ 23
    5.6      Police Enforcement of District Speed Limits ......................................................................... 23
6     Road characteristics with local examples and review recommendations .................................... 25
    6.1      Sealed Roads ......................................................................................................................... 25

                                                                                                                                                          2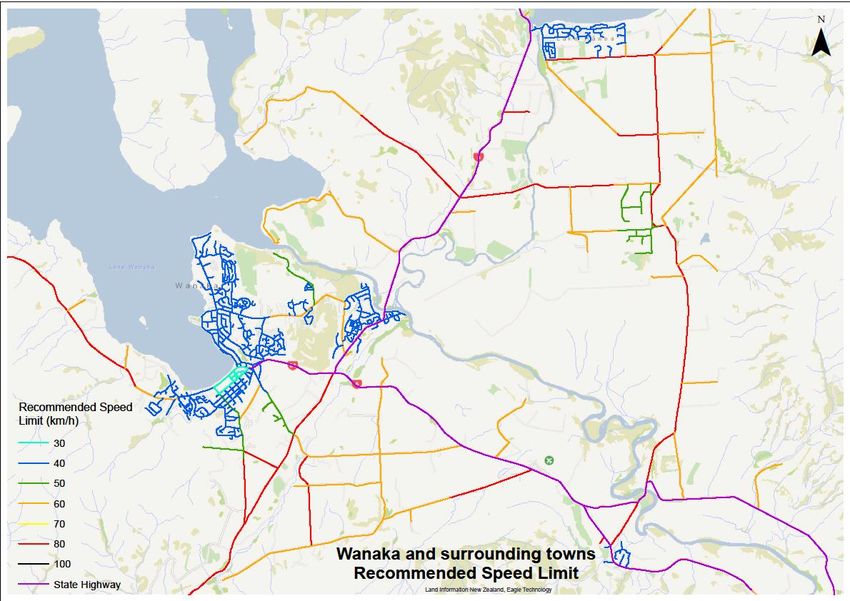
6.2       Unsealed Roads..................................................................................................................... 30
    6.3       Urban areas ........................................................................................................................... 34
7      Does the bylaw need to be changed............................................................................................. 43
    7.1       Purpose of the current bylaw ............................................................................................... 43
    7.2       Does the bylaw provide extra regulation than the district plan and legislation .................. 43
    7.3       Key Findings from District Plan ............................................................................................. 43
8 Is the bylaw and the speed limits it contains still the most appropriate means for managing
speed in the district .............................................................................................................................. 44
    8.1       Bylaw form ............................................................................................................................ 44
    8.2       Speed in the district - Key Findings from Stakeholder Engagement..................................... 44
       8.2.1          100km Roads ................................................................................................................. 44
       8.2.2          Rural Unsealed Roads ................................................................................................... 44
       8.2.3          Designated Urban Areas ............................................................................................... 45
       8.2.4          Variable speed limits ..................................................................................................... 45
       8.2.5          Loss of productivity ....................................................................................................... 45
       8.2.6          Other issues raised by stakeholders (that cannot be addressed through a bylaw) ..... 45
9      Review findings and conclusion .................................................................................................... 46
    9.1       Bylaw form ............................................................................................................................ 46
    9.2       Speed limit changes recommended...................................................................................... 46
       9.2.1          Recommended permanent speed limit changes to Urban Traffic Areas...................... 47
       9.2.2    Recommended permanent speed limit changes to roads identified as high benefit
       opportunities to reduce death and serious injury risk ................................................................. 47
       9.2.3          Areas with previously sign posted reduced speed limits .............................................. 48
    9.3       Full Network Future Recommendations ............................................................................... 49
       9.3.1          Recommended permanent speed limit changes to town centres................................ 49
       9.3.2          Recommended permanent speed limit changes to sealed roads ................................ 49
       9.3.3          Recommended permanent speed limit changes to unsealed roads ............................ 50
10 Appendices .................................................................................................................................... 53
    10.1      External stakeholder views ................................................................................................... 53
    10.2      Summary of legislation, regulation and rules applying to setting of speed limits................ 54
       10.2.1         Legislation ..................................................................................................................... 54
       10.2.2         Regulation ..................................................................................................................... 54
    10.3      Land Transport Act 2008- bylaw making provisions ............................................................. 55
    10.4      Summary of Setting of Speed Limits Rule ............................................................................. 55
    10.5      Consultation Network Maps ................................................................................................. 58
    10.6      Full Speed Management Review network Maps .................................................................. 73

                                                                                                                                                        3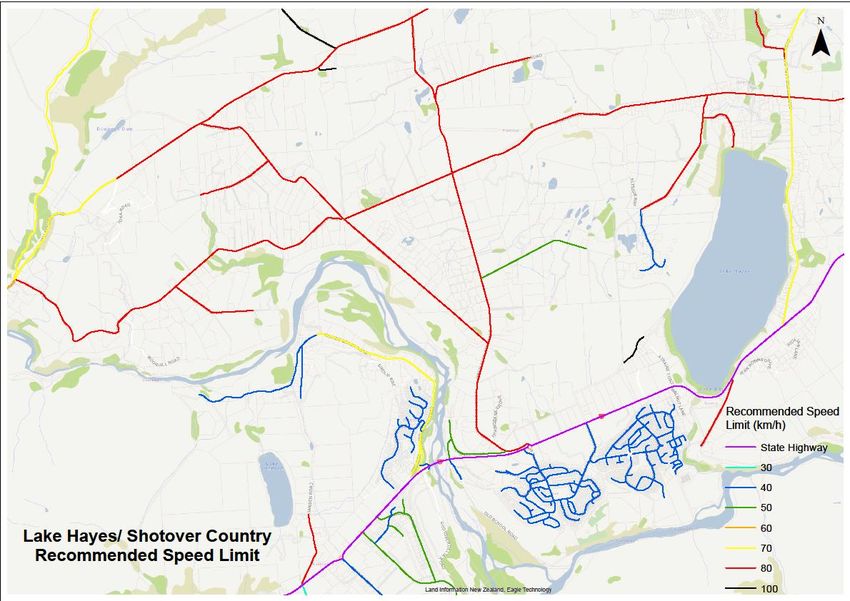
1 SUMMARY OF KEY FINDINGS
As a review of both the mechanism for setting permanent, variable and temporary speed limits in
the district (the bylaw) and the actual limits set (the speed management review), the findings are
presented in two distinct subsets.

•   The bylaw

A bylaw is required to establish legally enforceable permanent, temporary and variable speed limits.
As a moving vehicle offence, breaches of speed limits are enforced by the New Zealand Police.

Since the previous bylaw review and amendments to the current bylaw, there have been several
changes to legislation (including the legislation the bylaw is made under) and council has developed
several transport strategies in the face of unprecedented population growth and corresponding
increases in vehicles on the roads.

The current bylaw was made under the Local Government Act 2002 (LGA) and speed limit regulation
is now under the Land Transport Act 1998 (LTA). Although still applicable, it is appropriate to amend
the form and content of the bylaw to reflect the legislative changes.

Benchmarking with other territorial authority’s approaches also revealed opportunities to improve
the form and language of the bylaw, to make it easier to understand and apply.

The current bylaw includes schedules of current speed limits, which is unnecessary under the LTA if
the information is still easily accessible to the public.

Removal of the schedules from the bylaw would enable Council to make changes by resolution,
meaning a faster response time to issues identified in the district, address growth and enable
changes necessary for the transport network operation.

Any changes to speed limits in the district made by Council resolution must still be subject to
appropriate consultation; but will not automatically require the use of the Special Consultative
Procedure as they do when part of the bylaw itself (as at present).

•   The speed limits

This is the first formal speed management review of the district’s road network (and the first full
network review completed) since changes to national regulation and guidance documents altered
the practices required by Council to ensure its road network development and controls are
supporting safe and appropriate operating speeds.

The new process considers several factors including crash statistics (from the 55 fatalities over the
past 17 years on the district’s roads through to minor accidents), road age (the average age is 26
years) and condition, and surrounding environments/hazards.

Feedback from interviews with key internal and external stakeholders highlighted overwhelming
support for consistent speeds across the network and the need to achieve safe and appropriate
operating speeds, particularly in areas frequented by vulnerable road users e.g. around schools and
in town centres.

                                                                                                        4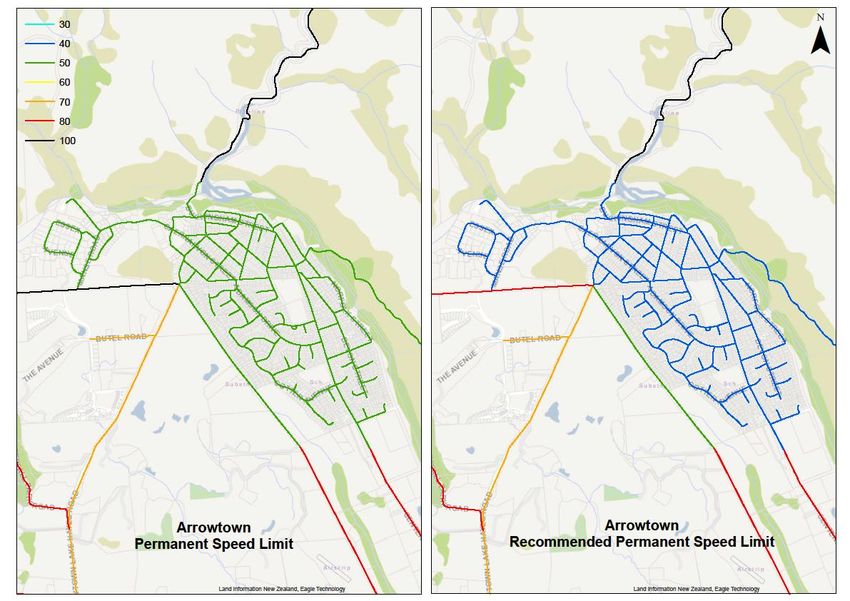
The speed management review has identified 40 sealed rural roads and 15 urban areas in the district
where a reduction in speed limit is recommended. A further 92 unsealed rural roads (347km) with a
current speed limit of 100km/h have been identified for a reduction to 60km/h or 40km.

This is an extensive and comprehensive proposal for change for the network and a staged approach
to implementing altered speed limits is recommended after considering several factors.

In summary, it recommended that initial speed limit changes are focused on:

•   improving safety for vulnerable road users (urban traffic areas)
•   improving safety on roads with high death or serious injury risk (five identified high benefit
    opportunity roads)
•   permanent changes to areas with recently posted reduced speed limits (four roads).

                                                                                                     5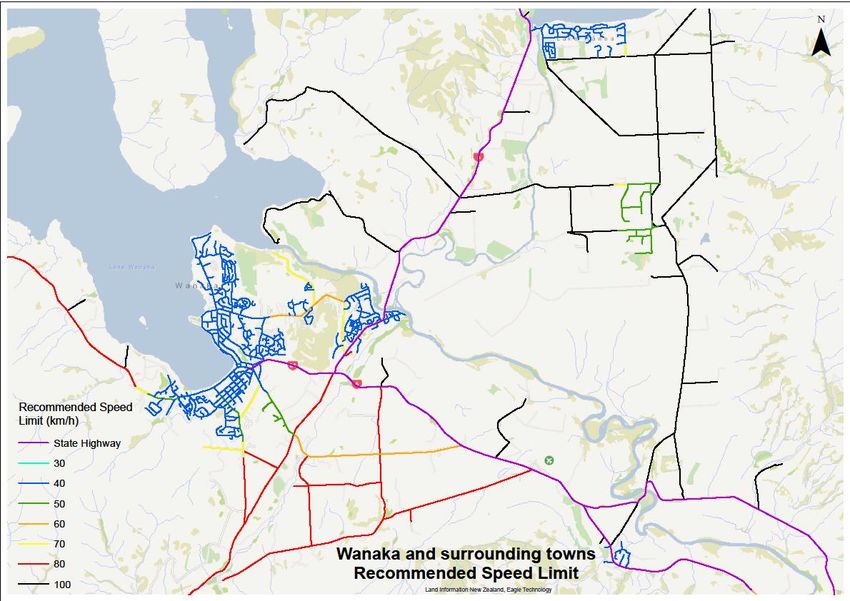
2 INTRODUCTION

2.1 PURPOSE OF THE REPORT
This report presents the findings of the Queenstown Lakes District Council (the Council) Speed
Management and Speed Limits Bylaw 2009 (the bylaw) Review.

The report sets out the review process undertaken and the reasoning underpinning the
recommendations to:

•   revoke the current bylaw and replace it with the Speed Limits Bylaw 2019
•   adopt recommended new speed limits for roads and urban traffic areas identified as required
    across the district to achieve safe and appropriate operating speeds
•   implement on-road changes for roads identified across the district as required to achieve safe
    and appropriate operating speeds.

2.2 WHY REVIEW NOW
Under section 22AB of the LTA, Council can establish bylaws for the setting of speed limits in
accordance with the Land Transport Rule 54001: Setting of Speed Limits 2017 (the Rule).

The bylaw was last reviewed in 2009 under the LGA and came in to force on 1 June 2009. Since then,
there have been three amendments in 2010, 2012, 2015 to implement speed limit changes in
accordance with the previous Land Transport Rule 54001: Setting of Speed Limits 2003.

In 2015, the Land Transport (Speed Limits Validation & Other Matters) Act 2015 was passed to
create a clear power for councils to make Speed Limit Bylaws under the LTA and to mandate existing
bylaws to be considered as being made under the LTA.

There are 50 outstanding customer requests for speed reductions across the district at present. For
Council to implement new permanent speeds a full special consultative process is required. It has
been four years since the last bylaw review, and it is considered good practice to review speed limits
annually.

2.2.1 Changes in Legislation
On 21 July 2015 the Land Transport (Speed Limits Validation and Other Matters) Act 2015 (Validation
Act) was passed under urgency by Parliament and came into force on 22 July 2015.

The Validation Act responded to concerns that some speed limit bylaws made up to that date may
have:

a. referenced incorrect or revoked empowering provisions
b. been made or amended using a non-compliant process
c. been revoked due to non-compliance with review requirements in the LGA.

The Validation Act also amended the LTA to place a specific power in Section 22AB for road
controlling authorities (RCAs), such as the Council, to make speed limit bylaws.

2.2.2 Changes to Speed Management Guidance
In 2016, the New Zealand Transport Agency (NZTA) introduced the New Zealand Speed Management
Guide (the Guide) to assist councils in determining road risk and in working with their communities
to address risks identified. The Guide fulfilled part of the 2012-2015 Safer Journeys Action Plan and

                                                                                                     6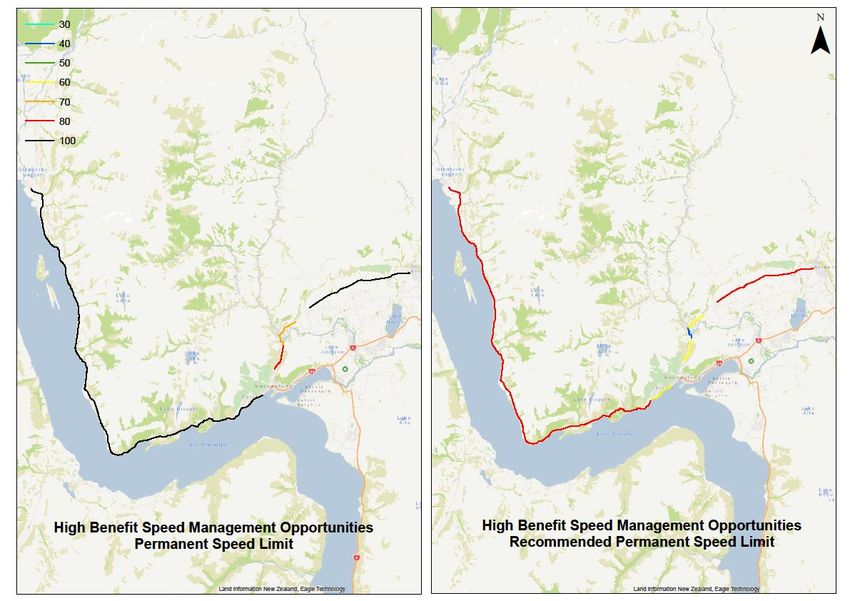
the overall direction for speed management continues through the 2016-2020 Safer Journeys Action
Plan.

To formalise the Guide’s new approach to speed management, the Rule was also updated in 2017
and in particular:

a.   requires NZTA to provide guidance on and information about speed management to councils
b.   requires councils to set speed limits that are, in the council’s view, safe and appropriate
c.   encourages a consistent approach to speed management throughout New Zealand
d.   replaces the methodology of the 2003 Rule with assessment criteria and outcome statements
     based on the approach in the Guide.

While the 2003 Rule has been replaced, a speed limit set, or an urban traffic area designated, prior
to the commencement of the 2017 Rule continues to apply.

An urban traffic area is defined area that sets a default speed limit in urban areas. For example, the
Wanaka township in the current bylaw is designated as an urban traffic area.

2.3 SAFER JOURNEYS STRATEGY
Every year, on New Zealand’s roads:

• Hundreds are killed
• Over 2,200 people are seriously injured
• Over 9,000 people suffer minor injuries
At a social cost of $4.4b per annum.
In 2010, NZTA launched Safer Journeys, a strategy designed to guide New Zealand’s efforts to
improve road safety from 2010-2020.

The aim of safer journeys is a safe road system increasingly free of death and serious injury. A safe
road system comprises:

•    Safe roads and road sides
•    Safe road use
•    Safe vehicles
•    Safe speeds.
The safe system approach recognises that:

•    people make mistakes
•    people are vulnerable
•    we have a shared responsibility [in keeping ourselves and others safe]
•    we must strengthen all parts of the system.
The safe system’s objectives are:

•    Make the road system more forgiving of human error
•    Reduce forces that injure in a crash to a level the body can tolerate without serious injury
•    Minimise the level of unsafe road use behaviour.

2.4 SCOPE
Consistent with the principles of the Guide, the scope of the Speed Management and bylaw reviews
was defined by the following questions:

                                                                                                         7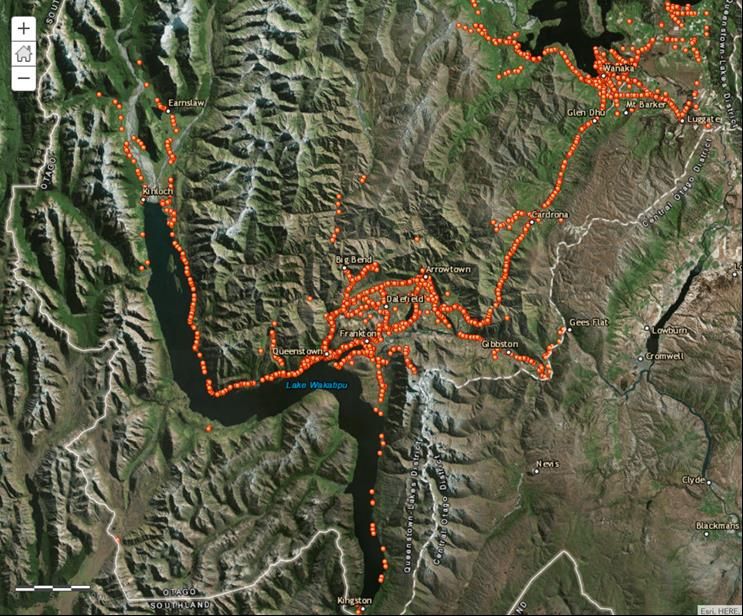
a.   Is the network area appropriately defined?
b.   Have the safe and appropriate speeds been determined?
c.   Are there high benefit opportunities to improve both safety and economic productivity?
d.   Does Council have the capacity to deliver on priority areas for speed management?
e.   How will Council monitor and evaluate the outcomes of its speed management activities?

This review has assessed the whole road network under Council’s jurisdiction. In contrast, previous
bylaw reviews or speed limit amendments have focused on specific roads or areas that have been
identified via the community or council officer’s assessments.

2.5 OUT OF SCOPE
Although the state highway network across the district provides key connections to and has
significant influence on the use of Council’s road network, these roads are out of scope for the
review.

NZTA has participated in Council’s review and had endeavoured to align its own network review,
however national priorities have been Auckland, Waikato and Christchurch. Staff will continue to
communicate with NZTA regarding the timing and implementation of changes to its speed limits
following this review.

2.6 METHODOLOGY
Various research and engagement methods were used to gain insight on the key questions.

Local data: Information was gathered and reviewed on local roads’ performance and status, vehicle
and operational speed counts, crash data and crash environments and speed infringements. On site
sense checking of the safe and appropriate operating speeds recommended on NZTA’s speed map
for the district was also completed.

Research: Desktop research was conducted on the existing plans and legislation for speed limit
management, including the Land Transport Act 1998, Land Transport Rule 54001: Setting of Speed
Limits 2017, Local Government Act 1974 and Local Government 2002. Benchmarking of other RCAs
speed management approaches was also undertaken.

Community request: Information from customer requests since the last bylaw amendment was
reviewed.

Internal stakeholder engagement: Feedback was received from Regulatory, Community Services,
Parks and Recreation and Property and Infrastructure.

External stakeholder engagement: All community and village associations, local education
providers, large tour operators, small passenger service vehicle operators, social service agencies,
local and central government agencies and representatives from business association were invited
to provide initial feedback on speed in the district.

Analysis of past speed limit bylaw reviews and amendments: Several reviews of the bylaw and
previous versions have been completed and the results of those reviews were considered.

                                                                                                       8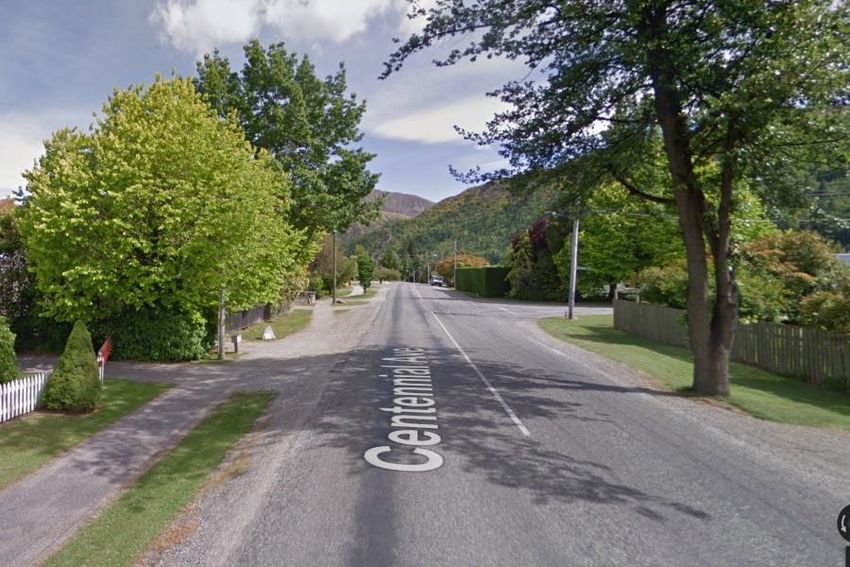
3 WHAT CURRENTLY GOVERNS SPEED LIMITS

3.1 THE GOVERNMENT POLICY STATEMENT ON LAND TRANSPORT 2018
The Government Policy Statement on Land Transport (GPS) 2018/19- 2027/28 sets out the
government’s priorities for expenditure from the National Land Transport Fund over the next 10
years.

The GPS sets out how funding is allocated between activities such as road safety policing, state
highway improvements, local and regional roads and public transport.

The new GPS presents several changes in direction, prioritising a safer transport system free of death
and injury, accessible and affordable transport, reduced emissions and value for money.

The new strategic direction, summarised below highlights ‘safety’ as one of two key strategic
priorities:

Data Source: Government Policy Statement on Land Transport 2018/19-2027/28

Safety as a key strategic priority:

•   reflects a significant increase in the level of ambition for delivering a land transport system free
    of death and serious injury
•   signals a greater focus on investing in safety improvements on high risk state highways and local
    roads across the network, including speed management and primary safe system treatments
•   outlines a commitment to deliver a new road safety strategy for New Zealand
•   drives improvements in safety outcomes for all road users, including increased investments in
    footpaths and cycleways to support access to, and uptake pf, active travel modes.

The GPS acknowledges New Zealand roads, speeds, vehicles and user behaviours are a long way
from what is required to achieve the government’s aim of a land transport system with minimal
death and injury.

Increased investment in infrastructure improvements on roads and speed management via safer
speeds, supported by education to assist in changing people’s behaviour has been proven in
numerous countries (e.g Sweden, Norway) to reduce significant injury and death.

                                                                                                       9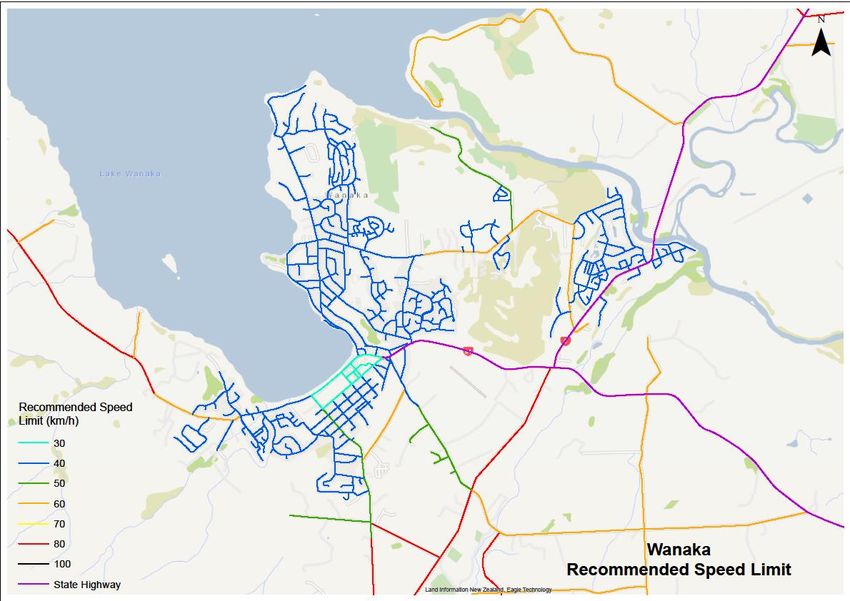
3.2 NATIONAL LEGISLATION REGULATING SPEED LIMITS
The overarching legislation for setting speed limits is the LTA. This is supported by regulations,
known as Rules, the most relevant being the Setting of Speed Limits 2017 as outlined above.

The LTA provides a specific bylaw making power to RCAs for the setting of speed limits on the roads
under its jurisdiction.

The intention of a bylaw is to provide the RCA the ability to regulate speed and enforce behaviours
that are not available through existing mechanisms (such as the LTA or Rules), noting that moving
vehicle offences are enforced by the New Zealand Police.

3.3 CHANGES TO THE LAND TRANSPORT RULE 54001: SETTING OF SPEED LIMITS 2017
The Land Transport Rule 54001: Setting of Speed Limits 2017 establishes the methodology for
setting permanent, variable and temporary speed limits.
The Rule formalises key elements of the Speed Management Guide, in that it:

•   requires NZTA to provide guidance to council’s on how to set safe and appropriate speeds on
    roads within their respective jurisdictions and that council’s must have regard to this guidance
    when reviewing speeds
•   encourages a consistent approach to speed management throughout New Zealand
•   replaces the previous methodology of setting speed limits.

The Rule also introduced the requirement for NZTA approval for new 70 km/h and 90km/h speed
limits. This reflects the goal of the Safer Journeys road safety strategy to, over time, reduce the
number of different speed limits applying at higher speeds to 60 km/h, 80 km/h, 100 km/h, and 110
km/h. The intention is to make speed limits safer and more consistent, that is to improve the
decision-making by drivers across the country relative to the posted speed limit.

While RCAs can set new permanent and temporary speed limits (outside of the 70km/h and 90km/h
discussed above), NZTA approval is required for the setting of new variable speed limits (e.g. such as
outside schools).

RCAs must maintain an up to date register of road speeds under the new Rule which shows set
speed limits of all roads, urban traffic areas, and designated traffic areas. The registers must always
be available to NZTA and the public.

3.4 DISTRICT PLAN
The Operative District Plan (ODP) and Proposed District Plan (PDP) outline the requirements for road
classification which aligns with the One Network Road Classification (ONRC). The ONRC is a
classification system, which divides New Zealand’s roads into six categories (that translate to four
classes with 1 being the highest) based on how busy they are, whether they connect to important
(key economic) destinations or are the only route available (resilience).

The six categories are:

•   National (e.g. SH1 Dunedin to Christchurch)
•   Arterial (e.g. SH 6 Cromwell – Wanaka)
•   Regional (e.g. SH 6 Queenstown to Cromwell)
•   Primary collector (e.g. Queenstown to Glenorchy Road)

                                                                                                       10
• Secondary collector (e.g. Speargrass Flat Road)
• Access (e.g. Skippers Road)
The PDP Chapter 24 Wakatipu Basin objectives include encouraging mode change (away from cars)
and improving both the safety and experience of residents and ratepayers on the district’s roads.
The PDP Chapter 29 Transport provides parameters around manoeuvring on to roads with certain
speeds limits from public and private facilities to ensure all road users safety. Ensuring safe and
appropriate speeds are in place around new subdivision and commercial development contributes
to the safety of road users.
At the date of writing, the PDP Chapters 24 and 29 have been through hearings, with
recommendations to be presented to Council on 7 March 2019.
3.5 CURRENT BYLAW
The Speed Limits Bylaw 2009 and the 2010, 2012 and 2015 amendments were made under the LGA
1974, the LGA 2002 and the Land Transport Rule 54001: Setting of Speed Limits 2003. The bylaw was
mandated by the Validation Act in 2015.
The bylaw has several schedules attached, meaning any speed limit changes require an amendment
to the bylaw and as a result, a special consultative procedure.
The bylaw sets out roads and designated areas in schedules to declare speed limits across the
district.
A designated area is outlined in the Rule as having a permanent speed, variable speed or a holiday
speed limit.
In practice this allows Council (as it does at present) to designate a township or area at a certain
speed that Council considers to be safe and appropriate.
114 SPEED MANAGEMENT
4.1 NEW ZEALAND SPEED MANAGEMENT GUIDE
4.1.1 Speed Management Framework
The Guide provides a framework (Figure 2.1 below) for the development of safe and appropriate
speeds across the country, with the purpose of a ‘one network’ approach to ensure consistency both
regionally and nationally.
Date Source: Speed Management Guide 2016
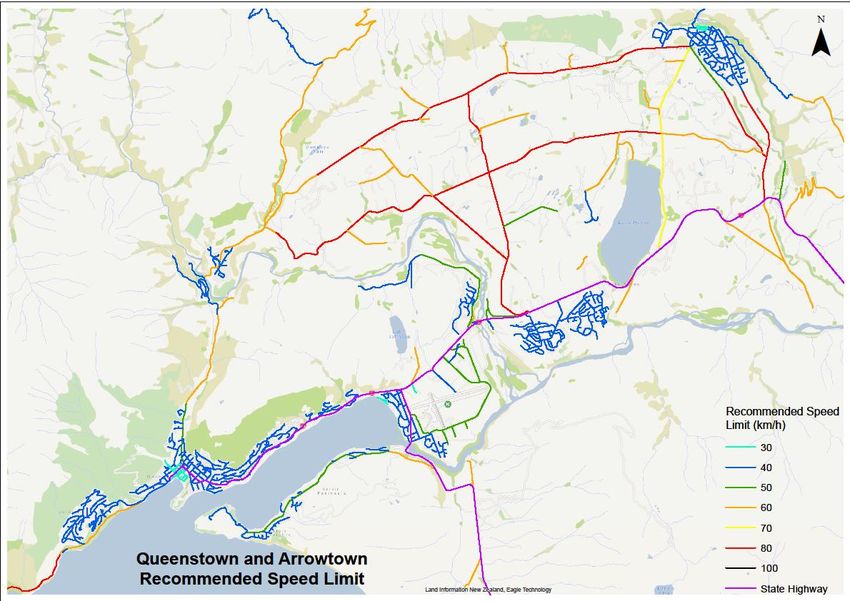
4.1.2 Speed Management Map
As part of the new process introduced under the Guide, early in 2018 NZTA provided Council with a
draft speed management map of the network that:
12- Shows where the existing speed limits differ from the frameworks safe and appropriate
operating speeds
- Identifies areas for speed limit changes
- Identifies areas Council can make infrastructure improvements to improve roads to increase
safety.
Safe and appropriate operating speeds are those deemed appropriate for the road function, design,
safety and use (i.e. both safety and efficiency are considered).
4.1.3 Inputs to Determining Safe and Appropriate Operating Speeds
4.1.3.1 Infrastructure Risk Rating
NZTA has developed the Infrastructure Risk Rating (IRR), which is a predictive tool that assesses road
safety risk and rates specific roads and corridors (lengths of roads), as an input to the process of
generating speed management maps.
The IRR considers the following eight key features that impact on road safety:
1. Road Stereotype: records whether a road is divided or undivided, two lane, multi-lane, sealed or
unsealed
2. Alignment: horizontal alignment measured in turns per km and divided into four categories,
straight, curved, winding, tortuous
3. Carriageway width: uses a matrix which has lane and shoulder width as inputs
4. Roadside Hazards: uses offset and severity of hazards. Left and right side assessed separately
and averaged
5. Land use: An assessment of surrounding lane use, how it is accessed, and the resultant level of
activity on the road
6. Intersection density: use and volume of intersection- considers vehicles, pedestrians, active
transport
7. Access density: use and volume of roads- considers vehicles, pedestrians, active transport
8. Traffic volume: number of vehicles
The eight influencing features combine to classify a road as low, low-medium, medium, medium-
high, high. Examples against each classification are provided below.
Low: Earl Street, Queenstown; Ardmore Street, Wanaka
Low-Medium: Lake Hayes Road, Queenstown; Golf Course Road, Wanaka
Medium: Glenorchy - Queenstown Road, Queenstown; Mt Aspiring Road, Wanaka
Medium-High: Crown Range Road, Queenstown; Mount Baker Road, Wanaka
High: Hogans Gully Road, Queenstown; Morris Road, Wanaka
4.1.3.2 Risk Rating
Collective and Personal risk is another input to speed management maps, as outlined in the
framework (Figure 2.1). The crash risk measure for roads is a combination Collective Risk (being
likelihood for a given location) or Personal Risk (being driver likelihood given distance travelled).
Collective Risk highlights road links that have a high number of fatal and serious crashes and helps in
prioritising investment and/or speed reduction to realise the greatest road safety gains.
13Unlike Collective Risk, Personal Risk considers the traffic volumes on each section of road. Personal
Risk shows the likelihood of a driver or rider, on average, being involved in a fatal or serious road
crash on a stretch of road.
Personal Risk is typically higher in more difficult terrain where traffic volumes and road standards
are often lower. In many cases infrastructure improvements on these roads are unlikely to be cost
effective and lower speed limits are recommended.
4.1.3.3 Road Classification
The Guide provides a classification method which combines the IRR and Collective and Personal Risk
metrics to determine a speed appropriate for the road function, design, safety and use for both
urban and rural areas as shown below.
Urban and Rural areas are defined in the Guide using Statistics New Zealand classifications. Urban
areas are defined areas with no administrative or legal basis to identify concentrated urban
settlements.
There is no internationally recognised definition of a ‘rural’ area. These are traditionally residual
areas not included in the urban definition. It is recognised that the differentiation between urban
and rural areas is not always clear cut, particularly in high growth areas undergoing changes in
function and land use.
Locally, Queenstown and Wanaka are considered urban areas whereas smaller townships such as
Arrowtown and Hawea are rural areas. Both urban and rural areas can be defined and mapped as
designated speed areas.
144.1.3.3.1 Proposed Safe and Appropriate Speeds - Urban Road Classification
154.1.3.3.2 Proposed Safe and Appropriate Speeds - Rural Road Classification
Data Source: Speed Management Guide 2016
165 DISTRICT CONTEXT
5.1 VEHICLE USE GROWTH
The Queenstown Lakes District has had significant growth in recent years. The Queenstown
Integrated Transport Business Case completed in 2017 by NZTA reported 55% of visitors to the
district are now arriving by vehicle, with independent travellers favouring self-driving options rather
than the more traditional tour coaches.
The table below demonstrates the growth across the permanent traffic count sites ranged from
3.9% to 16.5% annually. Council regularly monitors the volume of traffic across the district to
determine growth, travel trends, operating speeds and peak times.
5.2 LOCAL AND NATIONAL ROAD CRASH DATA (INCLUDES STATE HIGHWAYS)
In 2015, crashes in the New Zealand that involved driving ‘too fast for the conditions’ resulted in 101
deaths (a third of fatalities that year) and 496 serious injuries.
International research indicates reducing speeds has a direct impact on reducing deaths and injuries
when crashes occur. Key findings include:
- The likelihood of casualty crash involvement doubles for every 5 km/h above a 60 km/h posted
limit, and for every 10 km/h above a 100 km/h posted limit.
- A 5% decrease in average speed leads to around 10% fewer injury crashes and 20% fewer fatal
crashes.
- A review of evidence from speed studies in various countries showed that a decrease of 1km/h
in mean traffic speed typically results in a 3% decrease in the incidence of injury crashes, or a
decrease of 4-5% for fatal crashes.
The table below compares local, regional and national data 2000-2017 of crashes, and identifies
types of road (dry/wet), conditions such as road stereotype, time of day and speeds.
17QLDC Otago NZ
Population 2017: 37100 224,200 4,793,700
45 fatal crashes killed 55 people in the Queenstown Lakes District from 2000 275 fatal crashes 5,929 fatal crashes causing
to 2017. killing 314 people 6,710 fatalities
% Fatal Crashes % Fatalities % Fatal Crashes % Fatal Crashes
Single Vehicle 47% 49% 42% 41%
Multivehicle 38% 38% 41% 52.50%
Vehicle-Pedestrian 15% 13% 12% 11%
Flat Road 58% 56% 65% 75%
Hills 42% 44% 35% 25%
Midblock 91% 89% 80% 81%
Straight 42% 42% 51% 49%
Intersection 9% 11% 20% 19%
Easy Curve 24% 22% 22% 23%
Moderate Curve 27% 22% 23% 25%
Severe Curve 7% 11% 3.60% 3%
Open Road 89% 91% 78% 73%
Urban 11% 11% 22% 27%
Dry 78% 85% 82% 76%
Wet 11% 13% 18% 24%
Snow and Ice 2% 2% 0% 1%
100 km/hr 78% 82% 71% 69%
80 km/hr 11% 9% 7% 4%
70 km/hr 2% 2% 2% 4%
50 km/hr 9% 7% 18% 21%
Daylight 69% 71% 62% 57%
Dark 31% 29% 38% 42%
71% of fatal vehicle-pedestrian crashes occur in the dark
Car/Station Wagon 60% 65% 70%
Motorcycle 15.50% 14% 12%
SUV 11% 12% 11%
Taxi 4% 0.70% 0%
Truck 13% 20% 19%
Van/Utility 18% 20% 18%
Bus 4% 1% 2%
Bicycle 0% 4% 3%
Tree 22% 12% 12%
Fence 9% 34% 13%
Ditch 4% 9% 8%
Cliff bank 4% 8% 7%
Bridge 2% 2.50% 2%
Data source: NZ Transport Agency, 2018, Crash Analysis System
18The graphs below provide data on speed, road layout and conditions at the time of fatal crashes in
the district compares with New Zealand.
Crash statistics for the district indicate that most crashes are occurring on open roads with high
speed limits, 75% involving local drivers.
The diagram below shows the percentage of overseas drivers involved in all crashes across the
district for the years 2000-2017 inclusive.
Data source: NZ Transport Agency, 2018, Crash Analysis System
195.2.1 District Crash Statistics Summary 2000-2017
• 6,066 total crashes (4,022 on local roads, 2,044 on state highways)
• 55 people were killed on the district’s roads from January 2000 to December 2017.
• The total number of reported crashes has increased significantly to 46%. This compares to a
17% increase across Otago and the country over the same period.
• The greatest increase has been in non-injury crashes at 44%, from 184 crashes in 2000 to 330 in
2017.
• 75% involved local drivers
• 78% on dry roads
• 78% on roads with 100km/h speed limits
• 42% on straight roads.
5.2.2 District Crash Locations 2000-2017
Data source: QLDC RAMM
205.3 THE ROLE OF SPEED IN CRASHES
In 2017, speed was a contributing factor in 95 fatal crashes, 526 serious injury crashes and 1,362
minor injury crashes throughout New Zealand.
The below infographic shows the impact of a crash at speeds translated into a fall from the floor of a
building:
When a vehicle crashes, a rapid change of speed occurs, but the occupants keep moving at the
vehicle’s previous speed until they stop. The faster vehicles are travelling the more energy is
absorbed by the occupants at the time of impact; resulting in more severe injury.
Speed has a large impact on what happens during a crash to occupants or another
vehicle/pedestrian.
For example, if a pedestrian steps out in front of a vehicle it takes one second to react:
• At 50km/h, drivers need at least 27m to stop
• At 60km/h, drivers need at least 36m to stop
The probability that the pedestrian will die increases rapidly with relatively small increases in speed.
21For example, a pedestrian struck by a vehicle:
• at 40km/h has a 75% chance of survival
• at 50km/h has a 45% chance of survival
• At 60km/h has a 15% chance of survival.
Reducing speeds has a direct impact on reducing deaths and injuries when crashes occur.
• The likelihood of casualty crash involvement doubles for every 5 km/h above a 60 km/h posted
limit, and for every 10 km/h above a 100 km/h posted limit.
• A 5% decrease in average speed leads to around 10% fewer injury crashes and 20% fewer fatal
crashes.
• A decrease of 1km/h in mean traffic speed typically results in a 3% decrease in the incidence of
injury crashes, or a decrease of 4-5% for fatal crashes.
5.4 SOCIAL COST
Road crashes impose intangible, financial and economic costs on society. The average social cost per
road death in New Zealand is $4.18 million.
For non-fatal injuries, the average social cost is estimated at $439,100 per serious injury and $23,400
per minor injury.
225.5 COUNCIL’S ROAD NETWORK
Council’s road network consists of 856.9km of maintained road, comprising 509.9km sealed and
347km unsealed roads. Many unsealed roads are in rural areas and have a default speed limit of
100km.
The average age of the road network is approximately 26 years.
Council’s maintenance budget is approximately $14 million per annum, which includes
approximately $8 million contribution from NZTA. The capital programme for minor improvements
for the period covered by the Ten Year Plan is approximately $20 million.
5.5.1 Variable speeds
In addition to the permanent speed limits, the district has five areas of variable speeds contained in
the current bylaw:
• Schools in Wanaka, Arrowtown, Frankton and Queenstown where during pick up and drop off
times the speed reduces from 50km/h to 40km/h.
• Kinloch - Paradise where the speed reduces from 100km/h to 30km/h between 20 December
and 10 February
• Glendhu Bay where the speed reduces from 100km/h to 50km/h between 20 December and 10
February.
5.5.2 Temporary speed limits
An RCA can introduce temporary speed limits (for no more than 12 months) if it considers there is a
risk of danger to a worker or the public, or a risk of damage to a road, without changing the bylaw or
undergoing consultation, only in the following situations:
• physical work occurring on or adjacent to a road that impacts the function of the road (including
an ongoing work site outside of the hours of work)
• the presence of an unsafe road surface or structure
• a special event.
The district has recently had four areas where reduced speed limits have been sign posted in
response to community requests:
• Arthurs Point speed reduction from 70km/h to 50km/h
• Arrowtown urban area speed reduction from 50km/h to 40km/h
• Aubrey Road speed reduction from 70km/h to 50km/h
• Cardrona Valley Road reduction from 100km/h to 70km/h around the Cardrona ski field and
distillery.
5.6 POLICE ENFORCEMENT OF DISTRICT SPEED LIMITS
Speed infringements are issued by the NZ Police. In the district there are the following Police
resources:
Queenstown
Seven road policing positions plus a supervisor
Twenty frontline plus five supervisors
Wanaka
Two road policing positionsSix frontline plus one supervisor
There are some staff vacancies in the district and during holiday periods staff numbers can fluctuate
with additional officers being allocated to the district depending on expected numbers to the
district.
The number of speed infringements issued between 2009 and 2017 inclusive in the Central Otago
Lakes Area (noting the area is defined by policing district not territorial authority) is shown below.
Year 2009 2010 2011 2012 2013 2014 2015 2016 2017
Infringement 6,433 6,081 6,286 6,044 6,933 6,899 7,136 6,788 6,548
numbers
The Road Policing Action Plan, developed in consultation with NZTA, identifies five priority road
safety risks:
1) High risk behaviour
2) Vulnerable road users
3) Impaired drivers
4) Distraction/restrains
5) Speed
Responding to *555 calls also directs officers to specific roads and driver behaviour. Anecdotally,
local Police report spending the majority of on road time following up on these calls.
The Southern District (south from Oamaru) identifies four journey risk hotspots based on previous
crash data. Two of these areas are in the Queenstown Lakes District:
- SH6 from Frankton - Wanaka (NZTA state highway)
- Frankton to Wanaka via the Crown Range (Council road)
246 ROAD CHARACTERISTICS WITH LOCAL EXAMPLES AND REVIEW
RECOMMENDATIONS
6.1 SEALED ROADS
25Below are some local examples throughout the district of current 100km roads and relevant
classifications and characteristics used to assist in determining safe and appropriate speeds.
Glenorchy Road
ONRC Primary Collector
Class 3
Road stereotype Two lane undivided
Alignment Winding
Lane width 3.0 to 3.5 – Medium
Shoulder Width 0m toKane Road
ONRC Secondary Collector
Class 3
Road stereotype Two lane undivided
Alignment Straight
Lane width 3.0 to 3.5 – Medium
Shoulder Width 0m toCrown Range Road
ONRC Secondary Collector
Class 3
Road stereotype Two lane undivided
Alignment Tortuous
Lane width 3.0 to 3.5 – Medium
Shoulder Width 0m to29
6.2 UNSEALED ROADS

                     30
Below are some local examples throughout the district of current 100km unsealed roads and
relevant classifications and characteristics used to assist in determining safe and appropriate speeds.
Mt Aspiring Road (unsealed section)
ONRC Secondary Collector
Class 4
Road stereotype Two lane undivided
Alignment Winding
Lane widthDomain Road (Hawea)
ONRC Access
Class 4
Road stereotype Two lane undivided
Alignment Straight
Lane width33
6.3 URBAN AREAS

                  34
Below are Queenstown examples of urban roads and classifications and characteristics used to
assist in determining safe and appropriate speeds.
Lake Esplanade
ONRC Arterial
Class 4
Road stereotype Two lane undivided
Alignment Straight
Lane width 3.0 to 3.5 – Medium
Shoulder Width >2.0m – Very Wide
IRR Low-Medium
2010-2017 injury crashes 3
Current speed 50km
Safe and Appropriate Speed 40km
Camp Street
ONRC Primary Collector
Class 3
Road stereotype Two lane undivided
Alignment Straight
Lane width 3.0 to 3.5 – Medium
Shoulder Width >2.0m – Very Wide
IRR Medium- High
2010-2017 injury crashes 50km
Current speed 100km
Safe and Appropriate Speed 30km, 40km
35Robins Road
ONRC Primary Collector
Class 3
Road stereotype Two lane undivided
Alignment Straight
Lane width 3.0 to 3.5 – Medium
Shoulder Width 1.0m to 2.0m- Very Wide
IRR Medium- High
2010-2017 injury crashes 1
Current speed 50km
Safe and Appropriate Speed 30km, 40km
36Ardmore Street
ONRC Access
Class 4
Road stereotype Two lane undivided
Alignment Curved
Lane width 3.0 to 3.5 – Medium
Shoulder Width 0.5mBelow are Arrowtown examples of urban roads and classifications and characteristics used to
assist in determining safe and appropriate speeds.
Centennial Avenue
ONRC Primary Collector –
Class 3
Road stereotype Two lane undivided
Alignment Straight
Lane width 3.0 to 3.5 – Medium
Shoulder Width 0m toBelow is a Kingston example of a main urban road into township with classifications and
characteristics used to assist in determining safe and appropriate speeds.
Kent Street
ONRC Access
Class 4
Road stereotype Two lane undivided
Alignment Straight
Lane width 3.0 to 3.5 – Medium
Shoulder Width 0.5m-Below is a Glenorchy example of a main urban road into township with classifications and
characteristics used to assist in determining safe and appropriate speeds.
Argyle Street
ONRC Access
Class 4
Road stereotype Two lane undivided
Alignment Straight
Lane width41
42
7 DOES THE BYLAW NEED TO BE CHANGED

7.1 PURPOSE OF THE CURRENT BYLAW
The purpose of the bylaw is to set speed limits on roads under Council’s jurisdiction and to designate
urban traffic areas within the district. Setting safe and appropriate speed limits is a requirement of
Council, which supports the safe system approach. The bylaw enables signage, enforcement and
education of all road users.

7.2 DOES THE BYLAW PROVIDE EXTRA REGULATION THAN THE DISTRICT PLAN AND LEGISLATION
A bylaw is required by Council to set legally enforceable speed limits.

Under the LTA and in accordance with the Setting of Speed Limits Rule 2017, the Council, for roads
under its jurisdiction:

•   must review speed limits in accordance with the Rule
•   must set speed limits in accordance with the Rule
•   may set speed limits for designated locations in accordance with the Rule.

In carrying out its functions under the Rule, Council must consider whether a speed limit for a road is
safe and appropriate.

7.3 KEY FINDINGS FROM DISTRICT PLAN
The District Plan establishes the rules of land use, which is a consideration under the Speed
Management Framework, however the District Plan does not establish speeds which are safe or
appropriate.

Parameters are set for where private accessways (or driveways) join with a Council road in regards
to turning and joining the road.

Therefore, the District Plan is a necessary consideration in the management for setting speed limits
in the district but is not enough to address issues identified.

                                                                                                     43
8 IS THE BYLAW AND THE SPEED LIMITS IT CONTAINS STILL THE MOST
APPROPRIATE MEANS FOR MANAGING SPEED IN THE DISTRICT
8.1 BYLAW FORM
The current bylaw contains details of the speed limits that apply to each road under Council’s
jurisdiction and therefore changing or adding to these requires a special consultative procedure to
amend the bylaw.
It is not necessary under the LTA to include this information in the bylaw, instead it can be held in
publicly accessible schedules. Holding the information in this way enables Council to make changes
by resolution, meaning a faster response time to issues identified in the district, such as growth, and
enable changes necessary for the operation of the transport network.
All decisions would still be subject to appropriate community consultation before permanent speed
limits were changed or introduced.
The bylaw currently references old legislation and outdated rules. Any new bylaw will need to be
updated to reflect the current legislation and rules.
8.2 SPEED IN THE DISTRICT - KEY FINDINGS FROM STAKEHOLDER ENGAGEMENT
Feedback from interviews with key internal and external stakeholders highlighted substantial
support for consistent (including fewer limit changes across journeys) and generally lower speeds
across the network. Other issues or suggestions were identified as follows.
8.2.1 100km Roads
The state highways across the district in sections have a posted speed limit of 100km. The Council
has five main arterial roads with current speed limits of 100km/h;
• Malaghans Road (Arrowtown – Queenstown)
• Queenstown - Glenorchy Road
• Crown Range Road
• Cardrona Valley Road
• Wanaka – Mount- Aspiring Road.
These roads were identified through the speed management review and supported by several
stakeholders as roads which should be considered for a reduction to achieve a safe and appropriate
speed.
8.2.2 Rural Unsealed Roads
The International Transport Forum is an intergovernmental organisation with 59 members, of which
New Zealand is one. The forum acts as a think tank for transport policy and strategy and has an
annual summit with all countries Transport Ministers.
At the 2018 summit a recommendation that rural unsealed roads should be reduced to 70km/h
worldwide was discussed in detail. This approach is formally supported by Federated Farmers in
New Zealand as reported nationally in April 2018.
In contrast, this initiative is not supported by the Automobile Association (AA) based on reduced
productivity (this is discussed in more detail at 8.2.5).
448.2.3 Designated Urban Areas
A reduction in speed from the current 50km to 40km was supported by businesses associations, tour
operators, tertiary providers, the NZ Police, and NZTA.
Arrowtown operated with a 40km posted speed limit for a number of months, which had mixed
feedback from the local community.
8.2.4 Variable speed limits
The variable limits outside schools were recognised as valuable and should be retained.
8.2.5 Loss of productivity
The AA provided feedback that a reduction in speed limits has the potential to reduce productivity
and efficiencies for some operators in the district, especially trade services.
With changes to the Rule meaning Council can no longer set speed limits at 70km/h without NZTA
approval, this means where 80km/h is not considered safe and appropriate, 60km/h is the
recommended limit. Even if NZTA approval was to be given, it would be based on a confirmed
timeline for achieving a speed limit not requiring approval i.e. either through physical changes to the
road1 or a speed limit reduction.
The AA specifically highlighted this risk in relation to larger speed limit changes such as moving from
80km/h to 60km/h or 100km/h to 80km/h.
8.2.6 Other issues raised by stakeholders (that cannot be addressed through a bylaw)
Several schools identified unsafe road environments, which require safety improvements. In the
current bylaw several of the district’s schools have variable speed limits, with a reduction from 50km
– 40km during pick up and drop off periods.
It was identified given the location of some schools (on main arterial roads) further traffic calming
and layout improvements, including footpaths, would improve the safety of pupils, parents and staff.
1
Funding for physical road changes will be subject to NZTA assessment processes if proposals are to attract subsidy. In the
instance, proposed changes do not meet NZTA investment criteria, RCAs would need to either fully fund the investment
required to achieve a desired design speed or received a subsidy for changes to achieve a design speed supported by NZTA.
459 REVIEW FINDINGS AND CONCLUSION
9.1 BYLAW FORM
Updating the bylaw to reflect current legislation and rules, combined with moving speed limits to
schedules outside of the bylaw is recommended to improve the efficiency and effectiveness of
council’s decision making.
9.2 SPEED LIMIT CHANGES RECOMMENDED
The full speed management review has identified 40 sealed rural roads and 15 urban areas in the
district where a reduction in speed limit is recommended. A further 92 unsealed rural roads (347km)
with a current speed limit of 100km/h have been identified for a reduction to 60km/h or 40km.
This is an extensive and comprehensive proposal for change for the network and a staged approach
to implementing altered speed limits is recommended after considering several factors.
First, prioritising safety of vulnerable road users focuses concentration on areas with multiple types
and high volumes. These are most prevalent in the urban traffic areas and it is recommended these
are prioritised for implementation and included for public consultation with the new bylaw.
Second, prioritising reducing the numbers of death and serious injuries (DSI) focuses concentration
on high risk roads that display several identified characteristics and contribute disproportionately to
the district’s DSI statistics. Five roads are highlighted as high benefit opportunities to reduce DSIs,
and it is recommended these are prioritised for implementation and included for public consultation
with the new bylaw.
Third, some reduced speed limits have been sign posted at different times across the district in
response to specific community requests. Permanent changes to the speed limit applying in these
areas are supported by stakeholders and it is recommended these are prioritised for
implementations and included for public consultation with the new bylaw.
Fourth, the district’s network is heavily reliant on the connections provided by, and integration with,
the state highways. NZTA is pursuing its own review and while efforts have been made to align the
programme, the national priorities are currently Auckland, Waikato and Christchurch. Confirmation
on timing for the Otago state highway review is expected in the first half of calendar 2019. This
affects most of the rural sealed network and to ensure consistency in road user experience and
expectation of speed limits applying across the district, it is recommended that these are considered
by Council at a later stage in conjunction with the NZTA review.
Finally, the district’s network comprises a substantial number of rural unsealed roads. With one
notable exception (which is included in the high benefit opportunity recommendations), these roads
have low volumes and relatively low user speeds. It is recommended that these are in considered by
Council on a case by case basis in response to issues at a later stage.
In summary, it recommended that speed limit changes for public consultation at this stage are
focused on:
• improving safety for vulnerable road users (urban traffic areas)
46• improving safety on roads with high death or serious injury risk (five identified high benefit
opportunity roads)
• permanent changes to areas with recently posted reduced speed limits (four roads).
Full details of recommended speeds for consultation are included as network maps attached at
section 10.5.
The recommended speed limit changes for public consultation are as follows.
9.2.1 Recommended permanent speed limit changes to Urban Traffic Areas
Urban traffic area Current permanent Recommended
speed limit (km/h) permanent speed limit
(km/h)
Arrowtown 50 40
Queenstown 50 40
Fernhill, Sunshine Bay 50 40
Quail Rise 50 40
Shotover Country 50 40
Lake Hayes Estate 50 40
Arthurs Point (residential) 50 40
Kelvin Heights (residential) 50 40
Wanaka 50 40
Albert Town 50 40
Hawea 50 40
Kingston 50 40
Glenorchy 50 40
Luggate 50 40
Cardrona 50 40
9.2.2 Recommended permanent speed limit changes to roads identified as high benefit opportunities
to reduce death and serious injury risk
Road Current permanent Recommended
speed limit (km/h) permanent speed limit
(km/h)
Queenstown - Glenorchy Road 100 80
Sunshine Bay to Glenorchy township
Queenstown - Glenorchy Road 100 60
From One Mile roundabout to Sunshine Bay
Crown Range Road 100 80
As per map, small section of 80km after first zigzag from
Arrowtown side then Cardrona side of summit
Crown Range Road 100 60
From SH6 Junction to Cardrona side of summit (small
80km section as above)
Malaghans Road 100 80
From Lake Hayes Road junction through to speed change
East of Coronet peak turn off
Arthurs Point Road 80 60
From Coronet Peak Junction to Watties Track junction
47Gorge Road 80 60
From Arthurs Point Road through to Queenstown
township
Cardrona Valley Road 100 80
From distillery and ski field turn off to Wanaka township
Wanaka-Mount Aspiring Road (sealed and unsealed) 100 80
9.2.3 Areas with previously sign posted reduced speed limits
Area Current Current Recommended
permanent temporary speed permanent
speed limit limit (km/h) speed limit
(km/h) (km/h)
Arrowtown 50 40 40
Urban boundaries
Aubrey Road 70 50 60
From Anderson Road intersection to Albert Town
roundabout
Arthurs Point Road 70 50 60
From Coronet Peak Junction to Watties Track
junction
Cardrona Valley Road 100 70 80
From township to distillery
489.3 FULL NETWORK FUTURE RECOMMENDATIONS
The full details of all recommended speed reductions resulting from the review are shown in
network maps attached at section 10.6 and listed below.
9.3.1 Recommended permanent speed limit changes to town centres
Town centre Current permanent Recommended
speed limit (km/h) permanent speed
limit (km/h)
Arrowtown 50 30
(The area bounded by and including Buckingham St,
Ramshaw Lane, Arrow Lane)
Queenstown 50 30
(The area bounded by and including Stanley St/
Ballarat St roundabout, through to Man St, Brecon St
junction and Shotover St and Beach St junction and
the Camp St, Earl St block)
Wanaka 50 30
(The area bounded by and including Ardmore St,
Brownston St roundabout, Brownston St and
McDougall St junction and McDougall St and
Ardmore St junction)
9.3.2 Recommended permanent speed limit changes to sealed roads
Road Current permanent Recommended
speed limit (km/h) permanent speed
limit (km/h)
Queenstown/Arrowtown
Hogans Gully Road 80 60
Dalefield Road 80 60
Coronet Peak Road 70 60
Corsican Drive 100 60
Cove Lane 100 60
Drift Bay Road 100 80
Gibbston Back Road 100 80
Glencoe Road 100 60
Jane Williams Place 80 40
Marshall Ave 100 60
Threepwood Road 80 40
Jeffery Road 100 60
Littles Road 80 60
Moke Lake Road 100 60
Vista Terrace 100 80
Von Road 100 80
Wharf Street 100 60
Glenorchy
Glenorchy-Paradise Road 100 80
From Priory Road intersection to end
Glenorchy-Paradise Road 80 60
Small section from Glenorchy township to Priory road
intersection
49You can also read