VRL Logistics Gaining grounds - Company Report - Prabhudas Lilladher

Page created by Dave Murray
 
CONTINUE READING
VRL Logistics Gaining grounds - Company Report - Prabhudas Lilladher
Company Report
                                                                                      Industry: MidCaps

VRL Logistics
Gaining grounds...

Nishna Biyani (nishnabiyani@plindia.com)   Keyur Pandya (keyurpandya@plindia.com)
+91-22-66322239                            +91-22-66322247
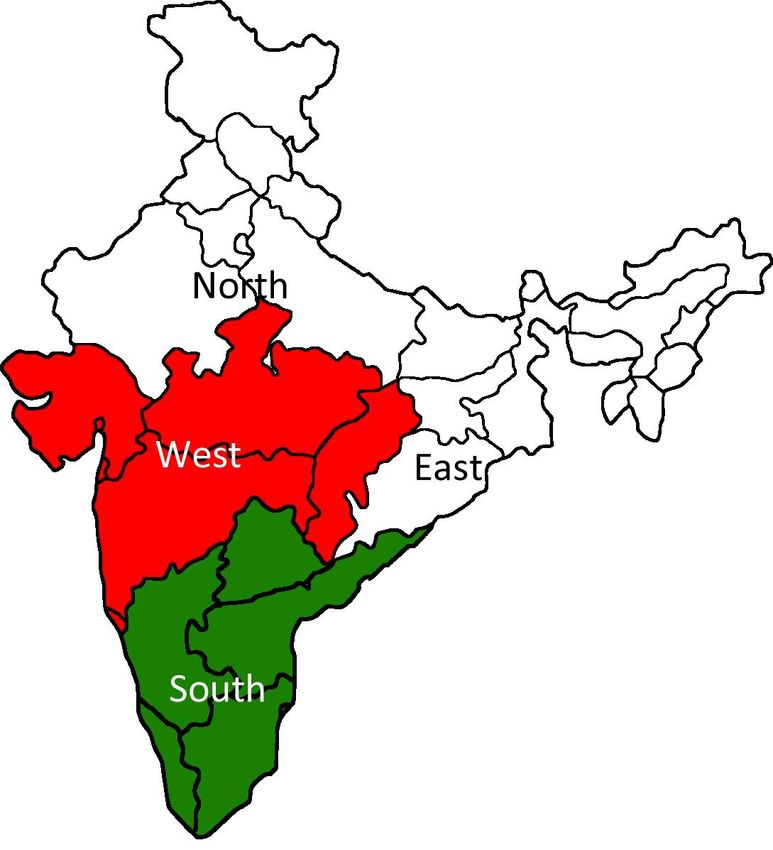
VRL Logistics Gaining grounds - Company Report - Prabhudas Lilladher
VRL Logistics

                     Contents
                                                                                                                                     Page No.
                       What’s making us bullish? .......................................................................................... 4
                       Best placed amongst domestic listed players ............................................................ 5
                       Investment Rationale.................................................................................................. 6
                          Market leader in goods transportation with largest owned truck fleet ............................................ 6
                          Focused player on high-margin LTL business .................................................................................... 6
                          Strong cash flows and healthy balance sheet, makes VRL Special .................................................... 7
                       Company Background ................................................................................................. 8
                          Management Personnel .................................................................................................................... 8
                       Industry Dynamics ...................................................................................................... 9
                          Surface Transportation, dominated by unorganized segment ........................................................ 10
                          GST can improve volumes for LTL organized operators .................................................................. 12
                       Business Segments ................................................................................................... 13
                          GT segment is the focal point contributing 77% of revenues ......................................................... 13
                          Passenger segment consolidating, focus is on premium routes ..................................................... 14
                          Air Charter Business ........................................................................................................................ 15
                          Wind Power Generation Business ................................................................................................... 16
                       VRL is looking to replicate its LTL business model in other regions ......................... 17
                          VRL has diverse clientele with no customer concentration ............................................................ 18
                          Efficient Working Capital Management .......................................................................................... 19
                          Fuel accounts for 34-37% of total operating costs; efficient cost management holds the key ...... 19
                          Use of Bio-diesel and lower crude prices to help in sustain margins .............................................. 20
                          In-house body design facility and maintenance enhances profitability .......................................... 20
                       Assumptions ............................................................................................................. 21
                       Financials .................................................................................................................. 22
                          VRL revenues growing @10.7% CAGR over FY15-FY18E ................................................................. 22
                          Business mix tilted towards Goods Transportation segment .......................................................... 22
                          EBITDA Margins bounce back to FY12 levels ................................................................................... 22
                          Robust operating performance over the past four years ................................................................ 23
                          IPO well received this time, raised Rs4.7bn in April 2015 ............................................................... 23
                          Return Ratios and Asset turnover impressive ................................................................................. 24
                       Valuation and Outlook .............................................................................................. 25
                          Limited free-float in the sector to command premium................................................................... 26
                       Risk and Concerns ..................................................................................................... 27
                          Shortage or non-availability of skilled drivers ................................................................................. 27
                          Inability to pass on increase in operating cost, particularly fuel price hikes ................................... 27
                          Outstanding litigations and proceedings against VRL ..................................................................... 27
                       Annexure................................................................................................................... 28
                          Road Safety and Transport Bill, 2014 .............................................................................................. 28

Prabhudas Lilladher Pvt. Ltd. and/or its associates (the 'Firm') does and/or seeks to do business with companies covered in its research reports. As a result investors should be aware that
the Firm may have a conflict of interest that could affect the objectivity of the report. Investors should consider this report as only a single factor in making their investment decision.
Please refer to important disclosures and disclaimers at the end of the report

December 07, 2015                                                                                                                                                                          2
Company Report
                                                                                                                                                    December 07, 2015
                                                                                    VRL Logistics
                                                                                    VRL Logistics (VRL) is the largest pan-India surface logistics and parcel delivery
Rating                                                                      BUY     service provider with an experience of four decades in the Indian markets. The
Price                                                                      Rs429    company owns and operates Pan-India a fleet of Commercial Vehicles (3713) in
Target Price                                                               Rs534    goods transportation (GT), while Bus operations (368 buses) are concentrated in
Implied Upside                                                             24.5%    Southern and Western regions of India. VRL provides general parcel and priority
Sensex                                                                    25,638
                                                                                    parcel delivery (less than truckload services -LTL), courier and full-truckload (FTL)
Nifty                                                                      7,782
                                                                                    services through its widespread transportation network covering more than 1000
(Prices as on December 07, 2015)                                                    locations. VRL is expected to have earnings CAGR of 24% over FY15-FY18E period
                                                                                    led by strong performance in Goods and Transport Segment. However, if reforms
                                                                                    like New Road Transport and Safety Bill & GST Bill gets implemented in time, then
                                                                                    VRL may emerge as a key beneficiary with almost double-digit volume growth as
Trading data                                                                        we anticipate the LTL to garner significant volume shift likely from unorganised to
Market Cap. (Rs m)                                                  39,143.5        organised segment. We initiate coverage on VRL with a ‘BUY’ and a TP of Rs534
Shares o/s (m)                                                          91.2        implying a 28x FY18E PER and 13.2x EV/EBITDA FY18E. The premium is justified
3M Avg. Daily value (Rs m)                                               148        considering: 1) Strong management pedigree with proven track record 2) High
                                                                                    visibility on operating cash-flows 3) Superior returns ratios (above 25% RoE) amidst
                                                                                    listed logistics players 4) Steady margins on the back of lower fuel prices and
Major shareholders                                                                  efficient use of Bio-diesel and 5) Strong balance sheet (D/E of 0.47x FY16E).
Promoters                                                                 69.57%
Foreign                                                                   10.78%       Goods transportation leads business growth, niche play and scale at work:
Domestic Inst.                                                             8.19%        VRL, over the last decade, has shown impressive execution prowess in
Public & Other                                                            11.46%        maintaining a large fleet and growing the fleet size @6.3% CAGR to 3713
                                                                                        vehicles, with ~30% fleet addition happening in the last five years alone. The
                                                                                        company’s focus on owning the fleet makes the business asset heavy. However,
Stock Performance                                                                       it brings in advantages of lower hiring and operational cost, reduced
(%)                1M                                    6M                 12M         dependence on third-party vehicles and better control over time-bound
Absolute          17.6                                  49.8                 NA         delivery. Andhra Pradesh and Telengana is its stronghold with ~20% of
Relative          20.6                                  54.5                 NA         branches/agencies in these two states alone. VRL intends to expand its network
                                                                                        in Northern and Eastern region over the next couple of years.

How we differ from Consensus                                                        Key financials (Y/e March)                2015         2016         2017E        2018E
EPS (Rs)              PL    Cons.                                         % Diff.   Revenues (Rs m)                          16,712       18,151       20,417       22,617
2017                16.6     18.1                                           -8.2      Growth (%)                               11.9           8.6        12.5         10.8
2018                19.0     21.6                                          -11.8    EBITDA (Rs m)                             2,728        3,213        3,461        3,777
                                                                                    PAT (Rs m)                                  912        1,276        1,513        1,738
                                                                                    EPS (Rs)                                   10.7         14.0         16.6         19.0
                                                                                      Growth (%)                               60.0         31.1         18.6         14.8
Price Performance (RIC: VRLL.BO, BB: VRLL IN)
                                                                                    Net DPS (Rs)                                 4.0          5.0          5.7          6.7
  (Rs)
     500
                                                                                    Profitability & Valuation                 2015          2016        2017E       2018E
    400                                                                             EBITDA margin (%)                         16.3           17.7        16.9        16.7
    300                                                                             RoE (%)                                   27.5           28.3        25.6        25.3
    200                                                                             RoCE (%)                                  15.8           19.6        20.4        21.1
    100                                                                             EV / sales (x)                              2.5           2.3         2.0         1.8
                                                                                    EV / EBITDA (x)                           15.0           12.9        11.8        10.6
      0
                                                                                    PE (x)                                    40.3           30.7        25.9        22.5
                                      Jul-15

                                                        Sep-15
                             Jun-15

                                               Aug-15
                    May-15

                                                                 Oct-15

                                                                           Nov-15
           Apr-15

                                                                                    P / BV (x)                                10.3            7.2         6.2         5.3
                                                                                    Net dividend yield (%)                      0.9           1.2         1.3         1.6
Source: Bloomberg                                                                   Source: Company Data; PL Research
VRL Logistics

What’s making us bullish?
Exhibit 1: VRL has grown its fleet at a CAGR of 12%, but revenues     Exhibit 2: Asset Turnover above 2.5x in Goods Transport segment
grew faster at 24% over the last 20 yrs
                                                                       2.7                         Asset Turnover (x)
                  Turnover (Rs. m)         Fleet Size (No) (RHS)       2.6
      20,000                                                           2.5
                                                                       2.4
      15,000                                                           2.3
      10,000                                                           2.2
                                                                       2.1
          5,000                                                        2.0
                                                                       1.9
             -
                                                                                    FY07          FY09         FY12      FY13        FY15
                   FY95       FY01     FY06      FY11         FY15
                                                                      Source: Company Data, PL Research
Source: Company Data, PL Research

Exhibit 3: Most efficient working capital management amongst peers    Exhibit 4: VRL’s growth has come at healthy Return Ratios

                         Receivable days for FY15                                                        RoE          RoCE

  70                                 66
                                                         59                  30.0
  60                                                                         25.0
  50                                                                         20.0
  40
                                                                      (%)

                                                                             15.0
  30              20                                                         10.0
  20
                                                                              5.0
  10
                                                                              0.0
   0
                                                                                           FY15          FY16E         FY17E       FY18E
                  VRL           Transport Corp           Gati

Source: Company Data, PL Research                                     Source: Company Data, PL Research

Exhibit 5: Operating cash flows looks robust with decent visibility   Exhibit 6: Debt inching down, Balance sheet strong with D/E of 0.47x
                                                                      FY16E
                          Operating Cash Flows
                                                                                    Total Debt (Rs m)            Debt/Equity Ratio (x) (RHS)
          3000
          2500                                                         7000                                                                 3.00
                                                                       6000                                                                 2.50
          2000
                                                                       5000
 (Rs m)

          1500                                                                                                                              2.00
                                                                       4000
          1000                                                                                                                              1.50
                                                                       3000
           500                                                         2000                                                                 1.00
                                                                       1000                                                                 0.50
             0
                  FY14       FY15E    FY16E      FY17E        FY18E       0                                                                 0.00
                                                                                     FY12         FY13     FY14        FY15     FY16E
Source: Company Data, PL Research
                                                                      Source: Company Data, PL Research

December 07, 2015                                                                                                                                  4
VRL Logistics

                                                          Best placed amongst domestic listed players

                                                          VRL compares well with Transport Corp (TCIL) in Freight, Express and Supply chain divisions in
                                                          surface transportation. While, VRL is an asset-heavy model where it owns fleet, TCIL is more
                                                          focused on third-party trucks. VRL segment capital employed is, thus, deployed to own assets,
                                                          whereas TCIL capital employed is mostly working capital. VRL, thus, commands higher margins
                                                          than TCIL as it has lower hired lorry charges. Even after owning assets, VRL RoCE is 16% vis-à-
                                                          vis 12% of TCIL

      VRL focuses on asset owning and leverage            Exhibit 7: VRL Vs TCIL a Snapshot in similar business operations
       on its distribution vis-à-vis other industry                                                                              VRL                  *TCIL
                                     participants.        Owned Fleet                                                          3,500                 ~1200
                                                          Hired Fleet (approx)                                                   360                  5,800
                                                          Own Fleet/Hired Fleet ratio                                            0.88                  0.17
                                                          Receivable days (Consolidated) FY15                                      20                    66
                                                          Full Truck Load (FTL)                                                  11%                  ~65%
                                                          Less Than Truck Load (LTL)                                             89%                  ~35%
                                                          EBIT margins (H1FY16)                                                12.7%                  4.5%

                                                          Capital Employed (Rs M)                                              4,277                  5,386
                                                          Locations covered                                                    1,000                  1,500
                                                          Segment Revenues (H1FY16) (Rs M)                                     6,824                 10,410

                                                          Source: Company Data, PL Estimates         * Freight, Express & Supply chain division included

                                                          VRL’s earnings are expected to grow faster than the industry and with sustained
                                                          margins over foreseeable future. RoEs above 25% and a dividend Payout ratio of 30-
                                                          35% are impressive which emphasises management focus on profitable growth and
                                                          creating value for stakeholders.

Exhibit 8:     Comparative Financials of key surface logistics players in India (Rs m)
                                    VRL                                 Transport Corporation                                Gati Ltd
                         FY15        FY16E            FY17E           FY15             FY16E        FY17E           FY15          FY16E              FY17E
Revenue                16,712       18,151            20,417        24,167           27,059        31,105         16,481          18,910            22,056
EBITDA                  2,728        3,213             3,461          1,974            2,231        2,642          1,412           1,420             1,768
     Margin (%)           16.3         17.7             17.0             8.2               8.5         8.8            8.6               7.5             8.0
PAT                       912        1,276             1,513            814             1,01        1,215            412               416             554
     RoE (%)              27.5         28.3             25.6            14.6            18.3         19.3             6.2               7.4             9.2
EV                                40,123                                          27,829                                      19,371

Source: Company Data, Bloomberg, PL Research

December 07, 2015                                                                                                                                        5
VRL Logistics

                                                  Investment Rationale

                                                  Market leader in goods transportation with largest owned truck fleet

                                                  VRL is the market leader in GT segment with ownership of 4081 CVs which includes
                                                  3713 GT Vehicles & 368 buses. VRL has strong presence in the Southern and Western
                                                  markets (~80% of business revenues) and intends to replicate its LTL model in the
                                                  Northern and Eastern markets over the next 2-3 years. Given the sheer size of the
                                                  market, we feel the growth opportunity for an organised and process driven player
                                                  like VRL is huge. Further, as a large fleet operator, VRL benefits from scale and
                                                  higher control over key operational levers which include freight rates, fuel costs,
                                                  fleet utilisation and load flexibility.

Exhibit 9: GT Business has grown @16% CAGR for past 10 yrs             Exhibit 10: Vehicle Split varies from 1T to 32T capacities helping to
                                                                       cater different business needs
             GT Revenues (Rs m)            EBIT Margins (RHS)
                                                                                 LCV     HCV         Tanker & Cranes     Car Carriers
   14,000                                                 14.0%
   12,000                                                 12.0%          4000
   10,000                                                 10.0%
    8,000                                                 8.0%           3000
    6,000                                                 6.0%
                                                                                                                       2423      2460
    4,000                                                 4.0%           2000     1916       1941          2210
    2,000                                                 2.0%
        -                                                 0.0%           1000
                                                                                   883         883         882         975       1002
                FY06      FY09        FY12       FY15
                                                                            0
                                                                                  FY12       FY13          FY14        FY15     H1FY16
Source: Company Data, PL Research
                                                                       Source: Company Data, PL Research

                                                  Focused player on high-margin LTL business

    Focus on LTL has helped VRL record better     VRL has adopted a differentiated consignee-driven business model with a focus on
   profitability when compared to other large     the high-margin LTL business. The company primarily caters to the requirement of
   organised players who largely focus on the     small and mid-sized customers who are not serviced by large players due to their
                                  FTL business    small cargoes. VRL’s widespread network of collection and delivery points enables it
                                                  to service a larger number of customers across different geographies. This reduces
                                                  its reliance on few large customers and thereby, the business concentration risk. The
                                                  India-wide network of collection and delivery points and its strategically located
                                                  transhipment hubs have enabled VRL to focus on the attractive LTL business. The LTL
                                                  service offers higher rates per load compared to the FTL service as it involves
                                                  consolidation and transportation of freight from numerous customers to multiple
                                                  destinations and, thus, generates higher net revenue per vehicle.

December 07, 2015                                                                                                                          6
VRL Logistics

                                                 Exhibit 11: LTL forms almost 78% of GT segment revenues

                                                                    LTL    FTL        Priority Parcel          Courier , Car and Liquid Transit

                                                           14,000
                                                           12,000
                                                           10,000
                                                            8,000

                                                  (Rs m)
                                                            6,000
                                                                                                                       9,063               10,050
                                                            4,000                              7,766
                                                                          6,865
                                                            2,000
                                                               -
                                                                          FY12                 FY13                    FY14                FY15

                                                 Source: Company Data, PL Research

                                                 Strong cash flows and healthy balance sheet, makes VRL Special
                                                 VRL has generated operating cash flows of Rs7.6bn during FY12-FY15 despite
                                                 subdued volume growth and tough operating environment. The next three years are
                                                 looking even stronger with operating cash flows expected to average Rs2.6bn/year.
                                                 VRL currently is in a sweet spot with strong balance sheet (D/E ratio of 0.47x FY16E)
                                                 and improving Return ratios. Considering capex of Rs1bn/yr and no working capital
                                                 requirements, VRL is a strong franchise which can be debt-free over the next three
                                                 years.

Exhibit 12: Return ratios looks impressive                                  Exhibit 13: D/E ratio inching lower

                             RoE        RoCE                                       2.00

       30.0
                                                                                   1.50
       25.0
       20.0
                                                                             (x)

                                                                                   1.00
 (%)

       15.0
       10.0                                                                        0.50
        5.0
        0.0                                                                        0.00
              FY13   FY14     FY15     FY16E   FY17E        FY18E                          FY13         FY14       FY15     FY16E    FY17E        FY18E

Source: Company Data, PL Research                                           Source: Company Data, PL Research

December 07, 2015                                                                                                                                         7
VRL Logistics

                                                   Company Background
   Exhibit 14: About The Company                   VRL was founded in 1976 by Dr. Vijay Sankeshwar in Gadag, a small town in North
   Employees             ~17000                    Karnataka with a single truck. VRL gradually expanded its services to Bengaluru,
                         28 States, 4 Union        Hubli and Belgaum. From this humble beginning, VRL has today grown into a
   Geographical Reach
                         territories
                                                   nationally renowned logistics and transport company which is also currently the
   Strong Regions        South and West
                                                   largest fleet owner of commercial vehicles in India with a fleet of 4081 Vehicles
   Cities Covered        662
                                                   (Including 368 Passenger Transport Vehicles & 3713 Goods Transport Vehicles
   Transshipment Hubs    48
                                                   amongst others). Mr. Vijay Sankeshwar has been joined by his son Mr. Anand
   Touch Points          1015
                                                   Sankeshwar now for over a decade, which brings in newer strategies to further drive
   Owned branches        20                        the growth of the company.
                         3713 CVs
   Fleet Size
                         368 PVs                   Over the years, VRL has pioneered in providing a safe and reliable delivery network
   Petrol Pumps          2 ( in Karnataka)         in the field of parcel service. The company has spread its operations to Courier
   Source: Company Data, PL Research               Service, Priority Cargo & Air Chartering to meet the growing demands of its
                                                   burgeoning customer base.

                                                   3PL & Warehousing solutions offered by VRL are tailor-made and cater to unique
                                                   needs of its diverse customer base. With the largest goods transportation network in
                                                   India, VRL parcel service is indispensable for a large number of Corporate Houses.
                                                   This network spans the length and breadth of the country and is supported by
                                                   strategically located transhipment hubs. The network spans across 1015 Branches
                                                   and franchisees to cater to the remotest locations of the country.

                                                   Management Personnel
                                                      Dr. Vijay Sankeshwar, CMD - Dr. Vijay Sankeshwar is actively involved in the
   Exhibit 15: Key Shareholders
                                                       day-to-day affairs of the company as a Whole Time Director. He is a former
   Major Share Holders        % Share Holding
                                                       member of parliament. He was also part of Committee of Finance, Committee of
   Vijay Sankeshwar                      34.8
                                                       Transport and Tourism etc. in the past. He has an industry experience of over
   Anand Sankeshwar                      34.3          three decades and has received many awards for contribution to the logistics
   New Silk Route PE                         5.2       sector.
   Goldman Sachs                             4.4
   Ashoka PTE                                2.3      Mr. Anand Sankeshwar, Joint MD - Mr. Anand Sankeshwar, aged 42 years, is a
   HDFC AMC                                  1.7
                                                       graduate in Commerce from Karnataka University, Dharwad. He is associated
                                                       with VRL for more than twenty years and is active MD of the company since
   Vani Sankeshwar                           0.4
                                                       2005. He directly oversees the finance and marketing function of the Company.
   Source: Bloomberg, PL Research                      He has 14 years of experience in the media industry as well and is also MD in
                                                       VRL Media which is carrying Printing and Publication of Kannada daily
                                                       Newspaper under the brand name of “VIJAYAVANI”

                                                      Mr. Sunil Nalavadi, CFO - Mr. Sunil Nalavadi, aged 37 years, is the Chief
                                                       Financial Officer of the Company. He holds a bachelor’s degree in commerce
                                                       from the Karnataka University, Dharwad and is a qualified associate of the
                                                       Institute of Chartered Accountants of India. He is with VRL for almost a decade
                                                       now.

December 07, 2015                                                                                                                    8
VRL Logistics

                                                     Industry Dynamics

                                                     The domestic freight transportation industry is largely dominated by road transport.
                                                     However, this segment is highly fragmented and dominated by large number of
                                                     small players. This provides consumers with high bargaining power and intensifies
                                                     competition amongst them. The industry broadly consists of transport operators,
                                                     intermediaries, brokers and consignors or end-users. In India, road freight
                                                     constitutes around 63-65% of the total freight movement which consists of ~2.2m
                                                     heavy duty trucks and 0.6m light duty trucks.

                                                     Despite being an economical mode of transport, railways has lost market share in
                                                     freight movement to roads primarily on three counts: 1) Govt impetus on improving
                                                     road connectivity 2) Cost effectiveness and flexibility on Road and 3) Capacity
                                                     constraints and poor quality of service in railways.

Exhibit 16: Share    of   Roadways     dominate     total   freight   traffic   Exhibit 17: Share of Transport in Public Sector Expenditure in different
movement                                                                        Five-Year Plans since independence

                    Rail (% Share)          Road (% Share)                                                  Total Transport Sector (LHS)**
                                                                                                            Railways (% of Total)
                                                                                                            Roads (% of Total)
  100
                                                                                  8,000                                                                    60
   80
   60                                                                             6,000
                                                                                                                                                           40
   40                                                                             4,000
                                                                                                                                                           20
   20                                                                             2,000
    0                                                                                 -                                                                    0
                                                                                              1951-85

                                                                                                        1985-90

                                                                                                                   1992-97

                                                                                                                             1997-02

                                                                                                                                       2002-07

                                                                                                                                                 2007-12
Source: Ministry of Road Transport and Highways, PL Research                    Source: Planning Commission 2013, PL Research
*(GDP = 6.9 per cent)                                                           ** (At Current Prices in Rs bn)

         Railways capacity in both freight and       The freight transport market is driven mostly by the rapid growth in industries such
   passenger traffic has not increased enough        as automobiles, pharmaceuticals, FMCG and retail; increase in trade of chemicals,
   simply due to inadequate investment when          Textiles, and miscellaneous products with the world & government initiatives in
        compared to road. Also, profitability of     development of logistics infrastructure. However, sluggish economic activity and
          freight division in railways is used to    poor monsoon for the past two years have impacted growth of the freight transport
            subsidize the passenger movement         business to some extent. But considering a decisive government mandate and clear
                                                     message of spurring investments in infrastructure, we feel IIP numbers and GDP
                                                     growth are looking up over the foreseeable future. According to the published
                                                     estimates of IMF in Oct 2015, Indian GDP growth is expected to grow @7.3% in 2015
                                                     and 7.5% in 2016. This augurs well for the logistics sector at large which grows at a
                                                     multiple of 1.2-1.5x of GDP growth.

December 07, 2015                                                                                                                                               9
VRL Logistics

Exhibit 18: IIP numbers clearly showing signs of bottoming out                                                                                                  Exhibit 19: GDP growth looking to inch higher

       20                                                                                                                                                                 9
                                                                                                                                                                          8
       15
                                                                                                                                                                          7
       10                                                                                                                                                                 6
                                                                                                                                                                          5
 (%)

                                                                                                                                                                    (%)
       5
                                                                                                                                                                          4
       0                                                                                                                                                                  3
                                                                                                                                                                          2
       -5
                                                                                                                                                                          1
   -10                                                                                                                                                                    0
                              Sep-10
                                       Feb-11

                                                                                                                                                 Sep-15
                                                                                                      Jan-14

                                                                                                                                                                                       Sep-12

                                                                                                                                                                                                                           Sep-13

                                                                                                                                                                                                                                                               Sep-14

                                                                                                                                                                                                                                                                                                   Sep-15
                                                                                    Mar-13
                                                         Dec-11

                                                                                                               Jun-14

                                                                                                                                                                                                         Mar-13

                                                                                                                                                                                                                                             Mar-14

                                                                                                                                                                                                                                                                                 Mar-15
                                                                                                                                                                              Jun-12

                                                                                                                                                                                                Dec-12

                                                                                                                                                                                                                  Jun-13

                                                                                                                                                                                                                                    Dec-13

                                                                                                                                                                                                                                                      Jun-14

                                                                                                                                                                                                                                                                        Dec-14

                                                                                                                                                                                                                                                                                          Jun-15
                                                Jul-11

                                                                                             Aug-13
                                                                           Oct-12
                     Apr-10

                                                                  May-12

                                                                                                                                        Apr-15
            Nov-09

                                                                                                                               Nov-14
Source: Bloomberg, PL Research                                                                                                                                  Source: Bloomberg, PL Research

        At the simplest level, roads provide basic                                                             Unlike other modes of transport, roads address the demand for goods to cities as
            accessibility to the rest of the world. No                                                         well as remote areas of the country. Since 1999-2000, road freight has increased
       other piece of transport infrastructure can                                                             from 467 billion tonne kilometres (BTKM) to 1,250 BTKM in 2011-12, at a CAGR of
              replace the street outside one’s home                                                            8.6%. According to the Ministry of Road Transport and Highways, road freight is
                                                                                                               expected to reach 1,987 BTKMs by 2016-17E, a CAGR growth of 9.8%.

                                                                                                               Exhibit 20: Road transportation freight movement in BTKM is growing @9.8% for past 12 yrs

                                                                                                                                    2500

                                                                                                                                    2000
                                                                                                                   (Bn tonnes km)

                                                                                                                                    1500

                                                                                                                                    1000

                                                                                                                                     500

                                                                                                                                         0
                                                                                                                                                          1970-71         1990-91                         2004-05                            2011-12                       2016-17E*

                                                                                                               Source: National Transport Development Policy Committee, PL Research

                                                                                                               Surface Transportation, dominated by unorganized segment

                                                                                                               The transport operators are broadly classified as small fleet operators (SFOs),
                                                                                                               medium fleet operators (MFOs) and large fleet operators (LFOs). Road freight
                                                                                                               transport due to its highly fragmented nature is dominated by small operators
                                                                                                               having 65-70% share. However, SFOs have very restricted geographical reach as
                                                                                                               compared to LFOs who enjoy nationwide presence. LFOs are preferred by large
                                                                                                               corporate due to their reach, service quality and timely delivery. Introduction of GST
                                                                                                               can further accelerate this trend as the price differential in freight rates will narrow
                                                                                                               down between organized and unorganized segment.

December 07, 2015                                                                                                                                                                                                                                                                                       10
VRL Logistics

    SFOs are small fleet operators owning up         Exhibit 21: LFOs gain share over the past three decades but SFOs still dominant
      to five vehicles, MFOs are medium fleet
                                                                                                     SFO      MFO      LFO
    operators owning between six and twenty
        vehicles whereas LFOs are large fleet                   100            2                 2                 6
                                                                                                13                                 11               18
   operators owning more than twenty trucks                                                                       17
                                                                  80                                                               15
                                                                                                                                                    15
                                                                  60

                                                          (%)
                                                                              98
                                                                  40                            85
                                                                                                                  77               74               67
                                                                  20

                                                                   0
                                                                           1978-79            1993-94          2002-03          2008-09          2014-15E

                                                     Source: Company Data, PL Research

Exhibit 22: Forces which impacts Road Freight

                                                                Threat of New Entrant - HIGH
                                                                Initital Investment of Rs.3-5lacs with
                                                                LTV ratio upto 90%
                                                                Easy licensing availability
                                                                Labour with basic skills are required

      Rivalry Among Exisiting Players - MODERATE                                                                  Threat of Substitutes - LOW
      Lack of any USP makes price the only                                                                        Other modes like Rail, Air and Waterway
      differentiator                                                                                              can be substitutes
      Unorganized players resort to price cutting to                                                              Due to last mile connectivity and supply
      attain higher utilization                                                                                   constraints, rail isn't a large threat in the
                                                                                                                  short term
      LFOs face less of price rivalry but more focus is
      on quality of service                                                 Forces                                Lower fuel prices favours road over
                                                                                                                  other modes
                                                                          impacting
                                                                         Road Freight

             Bargaining Power of Suppliers - LOW to MODERATE                                            Bargaining Power of Cutomers - HIGH
             As the fuel prices are market determined, there isn't                                      Large consigners and organisations
             much to bargain for both the parties                                                       have better bargaining power due to
             Transporters with larger share of outsourced truck have                                    bulk volumes
             less bargaining power, especially in peak seasons                                          Due to unorganized nature of
             Transporters which own fleet have better bargaining                                        business, pricing remains the key to
             power on bulk purchases                                                                    garner business

Source: Company Data, PL Research

December 07, 2015                                                                                                                                                 11
VRL Logistics

                                                   GST can improve volumes for LTL organized operators

    VRL is well positioned to benefit from GST     Goods and Service Tax (GST) is expected to change the existing indirect tax structure
           implementation and already holds        in India. Under existing structure, industry is levied tax both at centre (Excise, Service
         leadership position in the LTL freight    Tax etc.) as well as state level (VAT, Octroi, Sales Tax etc). This double taxation has
                           movement in India       forced companies to keep their warehouses in multiple cities across different states.
                                                   Under proposed GST, tax will be levied by both centre and state simultaneously
                                                   with easy mechanism of input tax credit.

                                                   With GST, companies which are currently forced to set up many small warehouses
                                                   across multiple cities can set up just a few, big warehouses region wise and can
                                                   follow the hub-and-spoke model for freight movement from the warehouses to the
                                                   different manufacturing plants, wholesale outlets, retail outlets and the various
                                                   points of sale. These large warehouses will help organised players like VRL to
                                                   position themselves as one point solution providers across the warehouses of
                                                   companies. This shall also shift volumes from the unorganised sector which thrives
                                                   on small inter-city routes in different states towards the organised sector.

                                                   Waiting time for trucks to go down: While most states have replaced the octroi
                                                   gates (on city borders) with a local body tax (LBT), it has still not reduced the waiting
     On an average, a truck is idling for 25% of
                                                   time for vehicles. Similarly, at check posts on state borders, different requirements
  times waiting at different check-posts across
                                                   for documentation and tax payment lead to considerable delays. However, post GST,
 India for documentation requirements and tax
                                                   the waiting time for trucks is expected to reduce significantly which may result in
                                     payments.
                                                   higher utilization of trucks for goods transit rather than waiting at check posts.

December 07, 2015                                                                                                                        12
VRL Logistics

                                                   Business Segments

                                                   VRL primarily operates in two business segments, namely, Goods Transportation
                                                   (GT) and Passenger Transportation (BT).

                                                   GT segment is the focal point contributing 77% of revenues

                                                   VRL offers services for transportation of goods across India to its customers using
                                                   LTL, FTL and priority services. The company owns 3713 commercial vehicles covering
                                                   all major cities and towns spread across 28 States & four Union Territories. It has an
                                                   extensive network with nearly 1000 plus branches and franchisees that enables it to
                                                   provide connectivity covering most remote locations as well. The branch network is
                                                   further complemented by 48 strategically located transhipment hubs.

                                                   The GT business is broadly divided into General Parcel and Priority parcel. General
                                                   Parcel basically caters to godown-to-godown movement of consignments across the
                                                   country and is mainly used by wholesalers, retailers and other non-corporate
                                                   entities. VRL Priority caters to door-to-door movement of consignments and this
                                                   service is mainly availed by corporate customers. The other verticals include car
                                                   carrying, liquid transportation and courier activities.

Exhibit 23: GT Business is further divided into four segments, general parcel dominates
Segment           Description                                                                           % Contribution to GT revenues for FY15
General parcel    It primarily includes godown-to-godown movement of goods                                                              77.9%
Priority Parcel   It involves door-to-door movement of cargo                                                                             7.7%
Full Truck Load   Caters in regions and routes to optimize return traffic                                                               10.6%
Others            It include car carrying, liquid transportation and courier activities                                                  3.8%

Source: Company Data, PL Research

                                                   Exhibit 24: Fleet Split end of period
                                                                         Small                             Car                          Total
                                                                                       LCV       HCV               Tanker    Cranes
                                                                       Vehicle                          Carrier                       Vehicles
                                                   FY11                     171        892       1575         0         7        10      2655
                                                   FY12                     139           883    1916      102         27        12      3079
                                                   FY13                     122           883    1941      102         27        13      3088
                                                   FY14                     122           882    2210      102         23        13      3352
                                                   FY15                     120           975    2423      102         16        13      3649
                                                   H1FY16                   119           1002   2460      102         17        13      3713

                                                   Source: Company Data, PL Research

December 07, 2015                                                                                                                          13
VRL Logistics

                    Exhibit 25: Revenue Split of VRL across different business segments
                     75.9%                77.2%           78.2%           78.9%
                                        Goods Transport      Bus Operations       Wind Power      Air Charter

                               25,000

                               20,000                                                                    17.2%
                                                                                          18.5%
                               15,000                                         18.9%
                                                             19.8%

                      (Rs m)
                                              20.7%
                               10,000
                                              75.9%          77.2%            78.2%       78.9%          80.4%
                                5,000

                                    -
                                              FY14            FY15            FY16E       FY17E          FY18E

                    Source: Company Data, PL Research

                    Passenger segment consolidating, focus is on premium routes

                    VRL operates passenger buses in high density urban markets such as Bengaluru,
                    Mumbai, Pune, Hyderabad, Ahmedabad, Jodhpur & Panjim. It also connects
                    metropolitan and Tier-II cities such as Hubballi, Dharwad, Hospet, Mangalore,
                    Bagalkot, and Bhatkal. VRL has pioneered the country’s largest commercial bus route
                    of nearly 2,000 km, from Bengaluru to Jodhpur. The passenger transportation
                    business operates in the key states of Karnataka, Maharashtra, Andhra Pradesh,
                    Telangana, Tamil Nadu, Gujarat, Rajasthan and Goa through its fleet of 368 buses.
                    This division operates through 81 branches (74 lease and 7 owned), 739 franchisees,
                    including web agents and 416 prepaid. Bus operations contributed 19.8% of overall
                    revenues in FY15.

                    Exhibit 26: VRL’s key bus routes
                    Bengaluru-Ahmedabad                   Bijapur-Bengaluru             Hospet-Mumbai
                    Bengaluru-Jodhpur                     Bengaluru-Mangalore           Belgaum-Bengaluru
                    Hubballi-Bengaluru                    Bengaluru-Goa                 Belgaum-Mumbai
                    Hubballi-Mumbai                       Bengaluru-Shirdi              Belgaum-Pune
                    Mumbai-Bengaluru                      Hubballi-Pune                 Hyderabad-Goa
                    Mumbai-Mangalore                      Bijapur-Bengaluru             Hyderabad-Mangalore
                    Bidar-Bengaluru                       Hopset-Bengaluru              Hyderabad-Bengaluru
                    Gulbarga-Mangalore                    Goa-Mumbai                    Hyderabad-Mumbai
                    Gulbarga-Bengaluru                    Pune-Nagpur                   Hyderabad-Shirdi

                    Source: Company Data, PL Research

December 07, 2015                                                                                                 14
VRL Logistics

                                                 Exhibit 27: Revenues strong despite fall in fleet implies focus on premium routes

                                                                    Total Bus Segment Reveneus (Rs m)              Total Buses (RHS)

                                                    4500                                                                               600
                                                    4000
                                                                                                                                       500
                                                    3500
                                                    3000                                                                               400
                                                    2500
                                                                                                                                       300
                                                    2000
                                                    1500                                                                               200
                                                    1000
                                                                                                                                       100
                                                     500
                                                       0                                                                               0
                                                               FY13        FY14        FY15        FY16E       FY17E          FY18E

                                                 Source: Company Data, PL Research

           Currently, VRL is concentrating on    VRL has become leaner by 100 buses over the past one year primarily due to a
   premium routes connecting major cities to     conscious decision to let bus permits expire and wait for the New Road and Safety
       perk up the realization and utilization   transport bill to be passed. The Bill proposes a unified vehicle registration system like
                                                 the commercial vehicles and simpler online transfers of vehicles across various
                                                 States in India, which will significantly improve operating efficiencies and reduce
                                                 operational costs for the passenger transportation segment. This is expected to
                                                 make the inter-state passenger transport smoother and efficient, as compared to
                                                 current complex and restrictive rules.

                                                 Air Charter Business

                                                 VRL entered the air charter business in 2008 by purchasing a new Premier 1A aircraft
                                                 from Hawker Beechcraft Inc., USA. The Premier 1A aircraft is a twin engine
                                                 sophisticated aircraft with space for two pilots and six passengers. Further in 2013,
                                                 VRL purchased a second hand aircraft from M/s Force Motors, Pune for a
                                                 consideration of Rs120m. VRL offers charter services, bulk-charters or any
                                                 customized requirement and offer services to individuals, corporate clients and
                                                 Government of Karnataka. Most of management travels and allied expenses are a
                                                 part of this division. Capital employed in this division is Rs378m and it has generated
                                                 revenues of Rs51m and EBIT of Rs (17m) for H1FY16.

                                                 Exhibit 28: Air Charter business Snapshot
                                                 Air charter Business                            FY14                 FY15             H1FY16
                                                 Revenues                                          78                   117                  51
                                                 EBIT                                             (21)                 (23)                (17)
                                                 No of aircrafts                                               2
                                                 Capital Employed                                          Rs 378m

                                                 Source: Company Data, PL Research

December 07, 2015                                                                                                                            15
VRL Logistics

                    Wind Power Generation Business

                    In 2006 VRL commenced its wind power business in Southern India at Kappatgudda,
                    Gadag district in Karnataka by setting up a wind farm of 42.5MW. The wind farm
                    consists of 34 Wind Turbine Generators (WTGs) having individual capacity of
                    1.25MW. The turbines are of S66 technology developed by Suzlon Energy and the
                    power generated is sold to Hubli Electricity Supply Company (HESCOM) under six
                    Power Purchase Agreements (PPAs). The project is registered with United Nations
                    Framework Convention on Climate Change (UNFCCC) and necessary approvals for
                    the trade of carbon credits have been procured.

                    Exhibit 29: Wind Power Business Snapshot
                    Wind Power                                 FY14             FY15         H1FY16
                    Revenues                                   250               222             166
                    CER                                         61                 -               -
                    EBIT                                        71               48               84
                    Power Capacity                                    42.5 MW
                    Capital Employed                                  Rs 1259m

                    Source: Company Data, PL Research

December 07, 2015                                                                                16
VRL Logistics

                                                 VRL is looking to replicate its LTL business model in other
                                                 regions

                                                 VRL has adopted a differentiated consignee-driven business model with a focus on
                                                 the high-margin LTL business. It primarily caters to the requirement of small and
                                                 mid-sized customers. VRL’s widespread network of collection and delivery points
                                                 enables it to serve a larger number of customers across different geographies. VRL
                                                 has strong presence in the Southern and Western markets (~65% of originating
                                                 business revenues). Over the next 2-3 years, it is planning to replicate its LTL model
                                                 in the Northern and Eastern markets as well.

Exhibit 30: VRL has strong foothold in the South and West market, Focus is to enhance reach in Northern and Eastern markets

                                                                                            North
                                                                 Agencies                    56
                                                                 Branches                    76
                                                                 Transshipment Hubs          6

                                                                                                                                     East
                                                                                                            Agencies                  7
                                                                                                            Branches                  38
                          West                                                                              Transshipment Hubs        3
 Agencies                  81
 Branches                  119
 Transshipment Hubs        10
                                                                                                    South
                                                                       Agencies                     202
                                                                       Branches                     391
                                                                       Transshipment Hubs            29

Source: Company Data, PL Research

December 07, 2015                                                                                                                          17
VRL Logistics

                    VRL has diverse clientele with no customer concentration

                    VRL services customers across a wide range of industries which include
                    Pharmaceuticals, FMCG, Paper, Wood, Automotive parts & machinery, Plastics,
                    Appliances, Furniture, Metal & Metal products etc. In the Goods transport business
                    for FY15, the client concentration is relatively low, with the largest customer and top
                    10 customers accounting for only 1.1% and 6.1% of revenues, respectively. VRL has a
                    strong recovery system with bad debts not exceeding Rs1m a year for the past five
                    years. In addition, working capital requirement has moved down from 25 days in
                    FY12 to 20 days in FY15.

                    Exhibit 31: VRL’s caters across wide range of industries

                                                               Pharma

                                              FMCG                                   Plastics

                                                                VRL
                                           Paper                                      Machinery

                                                 Wood                      Automotive

                    Source: Company Data, PL Research

                    Exhibit 32: Revenue Contribution from the largest and Top Ten Customers

                                                 Largest Customer     Top 10 Customers

                           10.0

                            8.0
                                                                                                        6.1
                            6.0            5.1                 5.3                    5.4
                     (%)

                            4.0

                            2.0      1.3                 1.5                                      1.1
                                                                               0.9

                            0.0
                                       2012                2013                 2014              9MFY15

                    Source: Company DRHP, PL Research

December 07, 2015                                                                                             18
VRL Logistics

                    Efficient Working Capital Management

                    VRL runs a process driven business and is always selective in choosing freight on
                    their business terms. It has strong internal systems to ensure that collection
                    mechanism is robust and they do not have to compromise in any manner. This has
                    resulted in lower receivable days for VRL as compared to industry players, which
                    again reinforces the fact that it does not compromise on its business principles even
                    if it results in sub-par revenue growth for some time. ~70% of business in GT
                    segment does not require any working capital.
                    Exhibit 33: Receivables tilted towards upfront payments

                                       Paid Option     To Pay Option     Ongoing accounts             Others

                           100
                                              8                 11                   11                     14
                             80               23                22                   18                     17

                             60
                     (%)

                             40               58                56                   59                     57

                             20
                                              11                11                   11                     12
                             -
                                             FY12             FY13                  FY14                   FY15

                    Source: Company Data, PL Research

                    Fuel accounts for 34-37% of total operating costs; efficient cost
                    management holds the key
                    Fuel cost is an important element which constitutes ~34-37% of total operating
                    costs. Out of the total requirement of ~2,50,000 litres/day, VRL gets ~60% fuel from
                    IOCL. Further, VRL owns two fuel stations in Karnataka which constitutes ~25% of
                    fuel requirement. Also, they have tied up with IOCL across 80-100 locations in India
                    and drivers are required to purchase fuel from these company designated fuel
                    pumps only during transit.
                    Exhibit 34: Split of operating costs amongst various constituents (FY15)
                         Clearing and   Tyres, flaps and re- Vehicle taxes
                                                                           Others
                          forwarding         treading            3%         3%
                              3%                 4%
                      Stores and spares                                                             Vehicle operation-
                         consumed                                                                      diesel cost
                             4%                                                                           38%
                                    Hamaali
                                       5%
                             Agency
                           commission
                                               Rent
                               5%
                                                6%

                           Bridge and toll            Vehicle running,                 Lorry hire
                              charges                    repairs &                        11%
                                8%                     maintenance
                                                           10%

                    Source: Company Data, PL Research

December 07, 2015                                                                                                        19
VRL Logistics

                                                                                                        Use of Bio-diesel and lower crude prices to help in sustain margins
            VRL has devised an innovative way to
         control its fuel cost by rewarding those                                                       VRL has started blending Bio-diesel for both Passenger and Goods Transportation
   drivers in cash incentives who consume less                                                          business in FY16. It started with 12.5% blending in Q1FY16 and has gradually ramped
    fuel than estimated by VRL on a particular                                                          it up to optimum levels of ~36% in Q2FY16. This has reduced the fuel cost per litre by
                                                                                 route                  ~Rs4-5, resulting in almost 200bps savings in fuel costs. However, savings from lower
                                                                                                        fuel costs in H1FY16 were netted off against high employees cost.

Exhibit 35: Diesel price Movement (in Rs)                                                                                              Exhibit 36: Crude movement USD

  70.0                                                                                                                                  160
                                                                                                                                        140
  60.0
                                                                                                                                        120
  50.0                                                                                                                                  100
                                                                                                                                         80
  40.0                                                                                                                                   60
                                                                                                                                         40
  30.0
                                                                                                                                         20
  20.0                                                                                                                                    0
                                                                                                                                              Nov-02
                                                                                                                                                       Nov-03
                                                                                                                                                                Nov-04
                                                                                                                                                                         Nov-05
                                                                                                                                                                                  Nov-06
                                                                                                                                                                                           Nov-07
                                                                                                                                                                                                    Nov-08
                                                                                                                                                                                                             Nov-09
                                                                                                                                                                                                                      Nov-10
                                                                                                                                                                                                                               Nov-11
                                                                                                                                                                                                                                        Nov-12
                                                                                                                                                                                                                                                 Nov-13
                                                                                                                                                                                                                                                          Nov-14
                                                                                                                                                                                                                                                                   Nov-15
         Apr-02
                  Apr-03
                           Apr-04
                                    Apr-05
                                             Apr-06
                                                      Apr-07
                                                               Apr-08
                                                                        Apr-09
                                                                                 Apr-10
                                                                                          Apr-11
                                                                                                   Apr-12
                                                                                                            Apr-13
                                                                                                                     Apr-14
                                                                                                                              Apr-15

Source: IOCL Website, PL Research                                                                                                      Source: Bloomberg, PL Research

                                                                                                        In-house body design facility and maintenance enhances profitability

                  VRL has focussed on cutting cost by                                                   VRL has in-house body design facility at Hubli where it buys chassis from the
   sourcing spare parts and Tyres from OEMs                                                             manufacturer and fabricates the vehicles with lighter and longer bodies which
    at discounted rates. Also, most of the fleet                                                        reduces the overall weight of the vehicle and ensure higher payloads without
    maintenance is carried in-house which not                                                           violating permissible payload limit. VRL also has two major workshops in Hubli where
      only curtail costs but also enhances fleet                                                        all the major servicing is done.
                                                                                     life
                                                                                                        Ashok Leyland & VE commercial (Volvo) have established their own spare parts yard
                                                                                                        in VRL’s premises, resulting in procurement of spare parts directly from
                                                                                                        manufacturers at factory rates and saving on carrying cost. Further, company has
                                                                                                        arrangement with Michelin India and CEAT which allows it to get tyres at ~7-8%
                                                                                                        cheaper than the retail selling price.

December 07, 2015                                                                                                                                                                                                                                                           20
VRL Logistics

Assumptions
Exhibit 37: Assumptions (Rs m)
Y/e March                            FY13    FY14     FY15    FY16E    FY17E           FY18E
Goods Transport Revenues            9,923   11,334   12,908   14,132   16,025         18,093

Fleet Size                          2,946    3,214    3,518    3,718    3,958          4,238
Additions per year                     8      268      304      200      240             280
Revenue/Tonne (Rs)                  4,200    4,710    4,967    5,254    5,517          5,792

Volume Growth                        1.7%    1.8%     8.0%     3.5%     8.0%            8.0%
Realization Growth                  13.0%   12.2%     5.4%     5.8%     5.0%            5.0%
EBIT Margins                        10.1%   11.0%    12.9%    13.5%    13.0%           12.7%

Bus Transport Revenues              2,848    3,091    3,316    3,406    3,759          3,872

Fleet Size                           460      477      375      368      380             385
Additions per year                    37       17     (102)      (7)      12               5
EBIT Margins                         6.6%    0.7%    10.9%    13.5%    12.5%           13.0%
Tax Rate                            28.1%   25.7%    33.8%    33.0%    32.0%           32.0%

Diesel Cost (Rs/litre)               48.4     56.5     59.7     54.0     57.0           60.0

Segment overview
Revenues
Goods Transport Business            9,923   11,334   12,908   14,132   16,025         18,093
Passenger Transport                 2,848    3,091    3,316    3,406    3,759          3,872

Segment EBIT
Goods Transport Business            1,003    1,251    1,670    1,908    2,083          2,298
Passenger Transport                  187       23      362      460      470             503

Capital Employed
Goods Transport Business            4,127    4,395    4,912    5,177    5,542          6,017
Passenger Transport                 1,742    1,537    1,318    1,150    1,200          1,250
Wind Power                          1,469    1,370    1,256    1,142    1,027            913
Air chartering service               251      382      358      339      320             301
Un-allocable assets                 2,063    2,092    1,687    1,700    1,650          1,600

Segment RoCE
Goods Transport Business            17.5%   21.1%    22.5%    24.7%    25.6%           26.0%
Passenger Transport                  7.7%    1.1%    18.2%    26.8%    26.6%           27.4%

Source: Company Data, PL Research

December 07, 2015                                                                         21
VRL Logistics

                                                 Financials

                                                 VRL revenues growing @10.7% CAGR over FY15-FY18E

                                                 VRL is expected to grow revenues @10.7% over FY15-FY18E, primarily on the back of
                                                 12% growth in GT segment and 6% growth in BT segment. GT segment is expected to
                                                 benefit from sustained volume recovery with improved road infrastructure and fleet
                                                 addition of ~720 trucks over FY16-FY18E period. We have not yet factored in
                                                 significant ramp-up in BT segment since VRL is only concentrating on profitable
                                                 routes and is consolidating its Bus operations.

Exhibit 38: GT Business looking strong over FY15-FY18E period         Exhibit 39: BT segment consolidating, margins inching higher

               Revenues (Rs m)          EBIT Margin (RHS)                            Revenues (Rs m)          EBIT Margin (RHS)

  20,000                                                    15.0%       5,000                                                     15.0%

                                                                        4,000
  15,000
                                                            10.0%                                                                 10.0%
                                                                        3,000
  10,000
                                                                        2,000
                                                            5.0%                                                                  5.0%
   5,000
                                                                        1,000

       -                                                    0.0%            -                                                     0.0%
             FY13   FY14   FY15 FY16E FY17E FY18E                                FY13    FY14    FY15 FY16E FY17E FY18E

Source: Company Data, PL Research                                     Source: Company Data, PL Research

                                                 Business mix tilted towards Goods Transportation segment

                                                 VRL derives 77% of its revenues from Goods Transportation segment and 20% from
                                                 Passenger Transportation, while wind power generation, air charter operation and
                                                 other contribute 1.35%, 0.7% and 0.9%, respectively. LTL contributes 86% of the
                                                 Goods Transport segment, while remaining is contributed by FTL, Car Carrier, Liquid
                                                 Transport and Courier service

                                                 EBITDA Margins bounce back to FY12 levels

                                                 VRL has always strived to optimize revenues and curtail operating costs by investing
                                                 in technology, in-house facilities for body building and maintenance, operate fuel
                                                 pumps, tie-up with IOCL for fuel refilling and use of Bio-diesel. However margins
                                                 slipped in FY13-FY14 owing to the Telangana stir and rapid rise of diesel prices which
                                                 were not being passed to the end customers entirely because of overall slag in
                                                 economic activity. With normalization returning back in Telangana, margins have
                                                 recovered back to FY12 levels. VRL currently is focusing on LTL business which
                                                 ensures optimum utilization of fleet and ensures higher margins than the traditional
                                                 FTL business.

December 07, 2015                                                                                                                         22
VRL Logistics

                                                  Exhibit 40: EBITDA and OPM over FY12-FY18E Period

                                                                                    EBITDA (Rs m)                Margin (RHS)

                                                     4,000                                                                                   18.0%
                                                     3,500
                                                                                                                                             17.0%
                                                     3,000
                                                                                                                                             16.0%
                                                     2,500
                                                     2,000                                                                                   15.0%
                                                     1,500
                                                                                                                                             14.0%
                                                     1,000
                                                                                                                                             13.0%
                                                       500
                                                         -                                                                                   12.0%
                                                                FY12    FY13             FY14      FY15      FY16E       FY17E      FY18E

                                                  Source: Company Data, PL Research

                                                  Robust operating performance over the past four years

                                                  VRL has generated operating cash flows of Rs7.6bn during FY12-FY15 despite
                                                  subdued volume growth and tough operating environment. These were used to
                                                  create assets worth Rs4.7bn and debt repayment of Rs1.85bn over the same period.
                                                  With Rs1.17bn raised from the IPO and capex program of Rs1bn for FY16, VRL is a
                                                  strong franchise which can be debt-free over the next three years.

Exhibit 41: Operating Cash flows averaging Rs 2.6bn/yr for next 3 yrs   Exhibit 42: Debt inching down over FY14-FY18E period
           3,000                               Avg. Rs2.6bn                      6,000

           2,500                                                                 5,000

           2,000                                                                 4,000
                                                                        (Rs m)
  (Rs m)

           1,500                                                                 3,000

           1,000                                                                 2,000

            500                                                                  1,000

               -                                                                     -
                   FY12   FY13   FY14   FY15 FY16E FY17E FY18E                              FY14          FY15      FY16E       FY17E    FY18E

Source: Company Data, PL Research                                       Source: Company Data, PL Research

                                                  IPO well received this time, raised Rs4.7bn in April 2015

                                                  VRL raised Rs4.7bn through an IPO route in April, 2015 which included Rs1.17bn of
                                                  fresh issue and Rs3.5bn of offer for sale from promoters (Rs0.5bn) and New Silk
                                                  Route PE (Rs3bn) at a price of Rs205/share. The object of the issue was to purchase
                                                  goods transportation vehicle of ~Rs674m and repayment of borrowing worth
                                                  ~Rs280m. VRL has repaid debt out of the said proceeds and purchased vehicles
                                                  worth Rs230m till H1FY16.

December 07, 2015                                                                                                                                 23
VRL Logistics

                                                  Return Ratios and Asset turnover impressive

                                                  VRL’s return ratios are amongst the best in listed logistics space with RoE in excess of
                                                  25%. Optimum utilization of fleet in GT segment and focus on premium routes in BT
                                                  segment has enabled VRL to report healthy return on investment. Asset turnover,
                                                  too, over the years have been above 2x which re-enforces confidence in the hub-
                                                  spoke model and optimum utilization of fleet infrastructure.

Exhibit 43: Return Ratios continue to impress                           Exhibit 44: Asset turnover above 2x for the GT and BT business

                       RoAE (%)           RoACE (%)                            3.00

   30.0                                                                        2.50             Avg. 2.19x
   25.0                                                                        2.00
   20.0

                                                                         (x)
                                                                               1.50
   15.0
   10.0                                                                        1.00
    5.0                                                                        0.50
    0.0
                                                                               0.00
            FY14       FY15       FY16E      FY17E     FY18E
                                                                                      FY14     FY15      FY16E     FY17E      FY18E

Source: Company Data, PL Research                                       Source: Company Data, PL Research

December 07, 2015                                                                                                                        24
VRL Logistics

                                                       Valuation and Outlook

                                                       VRL is expected to almost double its earnings over FY15-FY18E period led by strong
                                                       performance in Goods and Transport Segment. However, if reforms like new Road
                                                       Transport and Safety Bill and GST Bill get passed in time, then VRL may emerge as a
                                                       key beneficiary with almost double-digit volume growth as we anticipate the LTL to
                                                       garner significant volume shift happening from unorganised to organised segment.
                                                       We expect VRL to have a payout of ~35% as operating cash flows remain strong and
                                                       capex requirements ease off. We initiate coverage on VRL with a ‘BUY’ and a TP of
                                                       Rs534, implying a 28x FY18E PER and 13.2x EV/EBITDA FY18E. The premium is
                                                       justified considering:

                                                          Strong management pedigree with proven track record

                                                          High visibility on operating cash-flows and high dividend payout ratio

                                                          Superior returns ratios amidst listed logistics players

                                                          Efficient working capital management

                                                          Margin improvement due to lower fuel prices and efficient use of Bio-diesel

                                                          Strong balance sheet to leverage emerging opportunities in logistics space.

Exhibit 45: Comparative Valuation
                      Mcap      Sales (Rs Bn)                  PE (x)                 RoE (%)           EV/EBITDA (x)         FY15-FY17E CAGR (%)
COMPANY
                     (Rs bn)   FY15 FY16E FY17E        FY15 FY16E FY17E        FY15 FY16E FY17E        FY15 FY16E FY17E       Sales EBITDA      PAT
Road Freight
Blue Dart               169    22.7   27.4      33.7 130.8       88.0   64.4   27.2     50.2    51.6   76.5   50.3   38.3      21.8    41.3    43.1
VRL Logistics            40    16.7   18.2      20.4    40.2     30.7   25.9   27.5     28.3    25.6   14.7   12.5   11.6      10.5    12.6    28.8
Transport Corp           25    24.2   27.1      31.1    29.7     24.7   20.5   14.6     18.3    19.3   14.1   12.5   10.5      13.4    15.7    22.2
GATI                     15    16.5   18.9      22.1    36.9     36.3   27.2    6.2      7.4     9.2   13.7   13.6   11.0      15.7    11.9    15.9
Multi Modal / CFS
Cont. Corp.             276    61.5   65.6      75.9    26.2     27.8   23.2   14.7     12.5    13.5   17.8   18.3   15.1      11.1     8.4      5.1
AllCargo Logistics       48    56.3   60.9      67.1    19.9     16.2   13.7   13.0     14.5    15.0   10.5    8.7      8.0     9.2    14.4    20.4
Gateway
                         35    11.1   11.4      13.7    18.7     22.8   18.2   21.3     15.1    17.6   11.7   12.6   10.0      10.9     7.7      0.9
Distriparks
Navkar Corp.             28     3.3    3.3       3.8    38.4     33.5   18.6   12.4     10.8     6.1   23.4   21.2   14.0      31.3    29.4    44.3

Source: Company Data, Bloomberg, PL Research

December 07, 2015                                                                                                                                   25
VRL Logistics

                    Exhibit 46: VRL have commanded higher one yr fwd multiple in its limited trading history

                       600

                       500                                                                                31x
                                                                                                          27x
                       400
                                                                                                          23x
                       300                                                                                19x
                                                                                                          15x
                       200

                       100

                           0
                           Apr/15   May/15     Jun/15     Jul/15    Aug/15     Sep/15     Oct/15      Nov/15

                    Source: Company Data, Bloomberg, PL Research

                    Limited free-float in the sector to command premium

                    We observe that the promoter ownership in the sector is quite high, barring Gati.
                    Institutional ownership in most logistics stocks is yet to cross even 20%. We feel VRL
                    can continue to trade at premium valuations considering its leadership position and
                    scarcity premium.

                    Exhibit 47: Institutional ownership less than 20% in most stocks-Scarcity premium remains
                    SHAREHOLDING PATTERN (%)                  VRL            TCIL           Gati       Blue Dart
                    Promoters                                69.6            66.5           41.4            75.0
                    FIIs                                     10.8             2.9            9.3               7.1
                    Banks and FIs                             8.2             6.5            0.3               5.8
                    Public                                   11.5            24.1           49.0            12.1

                    Source: Company Data, PL Research

December 07, 2015                                                                                              26
VRL Logistics

                    Risk and Concerns

                    Shortage or non-availability of skilled drivers

                    Shortage of qualified drivers in the transportation industry could force VRL to either
                    increase driver compensation further or hire third-party owned trucks which may
                    not be available at commercially viable rates. Thus, VRL needs to attract and retain
                    sufficient number of skilled drivers. Any inability to do so would force VRL to rely
                    heavily on hired transportation which can result in idling of owned vehicles and limit
                    profitable growth.

                    Inability to pass on increase in operating cost, particularly fuel price
                    hikes

                    Fuel costs, Toll charges and Rent represent almost 37% of total costs for VRL. Thus,
                    any rapid increase in diesel prices can adversely affect its profitability since it may
                    not be able to pass through increased fuel costs to the customers on a real time
                    basis. However, historically VRL has been able to pass on fuel price hikes and other
                    operating costs to its customers by way of increase in freight rates or bus ticket
                    prices with a lag of 4 to 6 weeks.

                    Outstanding litigations and proceedings against VRL

                    There are 1171 civil complaints filed against VRL involving a total amount of
                    Rs1244m most of which pertains to road accidents involving death of a person,
                    damage of goods in transit, transportation of goods not permitted, goods theft etc.
                    However, substantial portion of the expected liability/payment arising out of these
                    cases would devolve on third parties such as insurance companies.

                    Exhibit 48: Outstanding litigations and proceedings against VRL
                    Nature of cases                          Number of cases          Amount involved (Rs m)
                    Criminal                                                9                            0.9
                    Civil*                                               1171                       1244.1*
                    Writ                                                    1                            NIL
                    Labour                                                103                           78.4
                    Consumer Cases                                         38                            9.1
                    Tax                                                     8                         161.3

                    Source: Company Data, PL Research            * As on March 28, 2015

December 07, 2015                                                                                        27
VRL Logistics

Annexure
Exhibit 49: Company Timeline
1976               Commencement of Goods Transport Service by Mr. Vijay Sankeshwar with single truck
1983               Business being converted into a private limited company by the name of Vijayanand Roadlines Private Limited
1992               Commencement of Courier Service within the State of Karnataka
1994               Vijayanand Roadlines Private Limited becomes Deemed Public Limited Company
1996               Commencement of Passenger Transportation Business
1997               The status of the company changed to Public Limited Company
2003               Vijayanand Printers Limited becomes a wholly owned subsidiary
2003               Entry in to LIMCA BOOK OF RECORDS as the single largest fleet owner of commercial vehicles in the private sector in India
2004               Commercial operation of gigantic infrastructure facility at Varur, Hubballi
2005               ISO 9001:2000 Certification for providing passengers travels service at Hubballi, Bengaluru, Belgaum (presently ISO 9001:2008)
2006               Entire stake in Vijayanand Printers Limited divested to Times Group
2007               Company diversified into power generation and installed 34 Wind Turbine Generators with capacity of 1.25 MW each
2008               Company entered into air charter business and purchased a brand new IA aircraft from Hawker Beechcraft Incorporation
2009               UNFCCC approval for Company’s wind power project – Eligible for carbon credits
2010               Efforts of Company being recognised by way of several awards and recognitions
2011               Foray into New Logistics Verticals – Car Carrying and Liquid Transportation
2012               CER income recognised for the first time in accounts
2012               Private Equity investment by NSR PE Mauritius LLC in the Company
2013               Addition of one more Aircraft to the Air Charter business of the Company

Source: Company Data, PL Research

                                                       Road Safety and Transport Bill, 2014

             Passenger transport to enjoy same         The Government has proposed a new Road Safety and Transport Bill, 2014 to amend
       flexibility as goods transport with ease of     the existing Motor Vehicles Act, 1988 to provide a comprehensive framework for
                     movements between states          goods transportation and passenger transportation activities in India.

                                                       The Transport Bill proposes unified, transparent and single window driver licensing
                                                       system with simplified procedures, relaxed requirements for drivers to obtain driving
                                                       licenses, automated driving tests, unified biometric systems and adoption of
                                                       technology-based driver testing facilities which are likely to result in increased
                                                       availability of qualified drivers through the introduction of simplified licensing
                                                       procedures.

                                                       The Bill also proposes a unified vehicle registration system and simpler online
                                                       transfers of vehicles across various states in India, which will significantly improve
                                                       operating efficiencies and reduce operational costs for the passenger transportation
                                                       segment. This is expected to make the inter-state passenger transport smoother and
                                                       efficient as compared to the current complex and restrictive rules.

December 07, 2015                                                                                                                                   28
VRL Logistics

Income Statement (Rs m)                                                    Balance Sheet Abstract (Rs m)
Y/e March                       2015         2016      2017E     2018E     Y/e March                         2015       2016     2017E     2018E
Net Revenue                    16,712       18,151     20,417    22,617    Shareholder's Funds               3,563      5,458     6,355     7,375
Raw Material Expenses          11,794       12,433     14,139    15,719    Total Debt                        4,434      2,550     2,500     2,000
Gross Profit                    4,918        5,718      6,278     6,898    Other Liabilities                   973        990     1,022     1,055
Employee Cost                   1,980        2,269      2,552     2,827    Total Liabilities                 8,969      8,998     9,877    10,430
Other Expenses                    211          236        265       294    Net Fixed Assets                  7,159      7,080     7,158     7,136
EBITDA                          2,728        3,213      3,461     3,777    Goodwill                             —          —         —         —
Depr. & Amortization              877          932      1,002     1,072    Investments                         846        811       811       811
Net Interest                      586          436        303       270    Net Current Assets                  962      1,107     1,909     2,483
Other Income                      114           60         70       120       Cash & Equivalents               166        249       747       971
Profit before Tax               1,379        1,904      2,225     2,555       Other Current Assets           1,359      1,443     1,607     1,767
Total Tax                         467          628        712       818       Current Liabilities              563        585       445       255
Profit after Tax                  912        1,276      1,513     1,738    Other Assets                         —           1        —         —
Ex-Od items / Min. Int.            —            —          —         —     Total Assets                      8,968      8,998     9,877    10,430
Adj. PAT                          912        1,276      1,513     1,738
Avg. Shares O/S (m)              85.5         91.2       91.2      91.2
EPS (Rs.)                        10.7         14.0       16.6      19.0

Cash Flow Abstract (Rs m)                                                  Quarterly Financials (Rs m)
Y/e March                        2015         2016     2017E     2018E     Y/e March                      Q3FY15      Q4FY15    Q1FY16    Q2FY16
C/F from Operations               2,317        2,438     2,581     2,846   Net Revenue                       4,299      3,974     4,479     4,272
C/F from Investing                (491)        (750)     (850)     (850)   EBITDA                              746        590       832       694
C/F from Financing              (1,812)      (1,605)   (1,233)   (1,771)   % of revenue                       17.4       14.8      18.6      16.3
Inc. / Dec. in Cash                  15           83       498       225   Depr. & Amortization                232        185       223       224
Opening Cash                        125          140       223       721   Net Interest                        145        136       103        74
Closing Cash                        140          223       721       946   Other Income                         21         58        19        23
FCFF                              1,827        1,688     1,731     1,996   Profit before Tax                   390        327       525       420
FCFE                                472        (637)     1,161       959   Total Tax                           139        133       172       130
                                                                           Profit after Tax                    251        194       354       290
                                                                           Adj. PAT                            251        194       354       290

Key Financial Metrics                                                      Key Operating Metrics (Rs m)
Y/e March                        2015         2016     2017E     2018E     Y/e March                         2015       2016     2017E     2018E
Growth                                                                     Segment Revenues
Revenue (%)                          11.9       8.6      12.5      10.8    Goods Transport                  12,908     14,132    16,025    18,093
EBITDA (%)                           32.0      17.8       7.7       9.1    Bus Operations                     3,316     3,406     3,759     3,872
PAT (%)                              60.0      39.9      18.6      14.8    EBIT
EPS (%)                              60.0      31.1      18.6      14.8    Goods Transport                    1,670     1,908     2,083     2,298
Profitability                                                              Bus Operations                       362       460       470       503
EBITDA Margin (%)                    16.3      17.7      16.9      16.7    Source: Company Data, PL Research.
PAT Margin (%)                        5.5       7.0       7.4       7.7
RoCE (%)                             15.8      19.6      20.4      21.1
RoE (%)                              27.5      28.3      25.6      25.3
Balance Sheet
Net Debt : Equity                     1.2       0.4        0.3      0.1
Net Wrkng Cap. (days)                  20        21         21       24
Valuation
PER (x)                              40.3      30.7      25.9      22.5
P / B (x)                            10.3       7.2       6.2       5.3
EV / EBITDA (x)                      15.0      12.9      11.8      10.6
EV / Sales (x)                        2.5       2.3       2.0       1.8
Earnings Quality
Eff. Tax Rate                        33.9       33.0     32.0      32.0
Other Inc / PBT                       5.7        3.2      3.1       4.7
Eff. Depr. Rate (%)                   7.1        7.0      7.0       7.0
FCFE / PAT                           51.8     (49.9)     76.7      55.2
Source: Company Data, PL Research.

December 07, 2015                                                                                                                             29
VRL Logistics

                    THIS PAGE IS INTENTIONALLY LEFT BLANK

December 07, 2015                                                     30
VRL Logistics

                    THIS PAGE IS INTENTIONALLY LEFT BLANK

December 07, 2015                                                     31
VRL Logistics

Prabhudas Lilladher Pvt. Ltd.
3rd Floor, Sadhana House, 570, P. B. Marg, Worli, Mumbai-400 018, India
Tel: (91 22) 6632 2222 Fax: (91 22) 6632 2209
 Rating Distribution of Research Coverage                                                                             PL’s Recommendation Nomenclature

                         50%   44.7%                                                                                  BUY                           :     Over 15% Outperformance to Sensex over 12-months
                                            42.7%
                                                                                                                      Accumulate                    :     Outperformance to Sensex over 12-months
                         40%
   % of Total Coverage

                                                                                                                      Reduce                        :     Underperformance to Sensex over 12-months
                         30%                                                                                          Sell                          :     Over 15% underperformance to Sensex over 12-months
                         20%                                     12.6%                                                Trading Buy                   :     Over 10% absolute upside in 1-month

                         10%                                                                                          Trading Sell                  :     Over 10% absolute decline in 1-month
                                                                                       0.0%                           Not Rated (NR)                :     No specific call on the stock
                         0%
                               BUY      Accumulate              Reduce                  Sell                          Under Review (UR)             :     Rating likely to change shortly

DISCLAIMER/DISCLOSURES
ANALYST CERTIFICATION
We/I, Mr. Nishna Biyani (BE, MBA-Finance), Mr. Keyur Pandya (Mcom, MBA-Finance), Research Analysts, authors and the names subscribed to this report, hereby certify that all of the views expressed in this research
report accurately reflect our views about the subject issuer(s) or securities. We also certify that no part of our compensation was, is, or will be directly or indirectly related to the specific recommendation(s) or view(s) in
this report.
Terms & conditions and other disclosures:
Prabhudas Lilladher Pvt. Ltd, Mumbai, India (hereinafter referred to as “PL”) is engaged in the business of Stock Broking, Portfolio Manager, Depository Participant and distribution for third party financial products. PL is a
subsidiary of Prabhudas Lilladher Advisory Services Pvt Ltd. which has its various subsidiaries engaged in business of commodity broking, investment banking, financial services (margin funding) and distribution of third
party financial/other products, details in respect of which are available at www.plindia.com
This document has been prepared by the Research Division of PL and is meant for use by the recipient only as information and is not for circulation. This document is not to be reported or copied or made available to
others without prior permission of PL. It should not be considered or taken as an offer to sell or a solicitation to buy or sell any security.
The information contained in this report has been obtained from sources that are considered to be reliable. However, PL has not independently verified the accuracy or completeness of the same. Neither PL nor any of its
affiliates, its directors or its employees accepts any responsibility of whatsoever nature for the information, statements and opinion given, made available or expressed herein or for any omission therein.
Recipients of this report should be aware that past performance is not necessarily a guide to future performance and value of investments can go down as well. The suitability or otherwise of any investments will depend
upon the recipient's particular circumstances and, in case of doubt, advice should be sought from an independent expert/advisor.
Either PL or its affiliates or its directors or its employees or its representatives or its clients or their relatives may have position(s), make market, act as principal or engage in transactions of securities of companies
referred to in this report and they may have used the research material prior to publication.
PL may from time to time solicit or perform investment banking or other services for any company mentioned in this document.
PL is in the process of applying for certificate of registration as Research Analyst under Securities and Exchange Board of India (Research Analysts) Regulations, 2014
PL submits that no material disciplinary action has been taken on us by any Regulatory Authority impacting Equity Research Analysis activities.
PL or its research analysts or its associates or his relatives do not have any financial interest in the subject company.
PL or its research analysts or its associates or his relatives do not have actual/beneficial ownership of one per cent or more securities of the subject company at the end of the month immediately preceding the date of
publication of the research report.
PL or its research analysts or its associates or his relatives do not have any material conflict of interest at the time of publication of the research report.
PL or its associates might have received compensation from the subject company in the past twelve months.
PL or its associates might have managed or co-managed public offering of securities for the subject company in the past twelve months or mandated by the subject company for any other assignment in the past twelve
months.
PL or its associates might have received any compensation for investment banking or merchant banking or brokerage services from the subject company in the past twelve months.
PL or its associates might have received any compensation for products or services other than investment banking or merchant banking or brokerage services from the subject company in the past twelve months
PL or its associates might have received any compensation or other benefits from the subject company or third party in connection with the research report.
PL encourages independence in research report preparation and strives to minimize conflict in preparation of research report. PL or its analysts did not receive any compensation or other benefits from the subject
Company or third party in connection with the preparation of the research report. PL or its Research Analysts do not have any material conflict of interest at the time of publication of this report.
It is confirmed that Mr. Nishna Biyani (BE, MBA-Finance), Mr. Keyur Pandya (Mcom, MBA-Finance), Research Analysts of this report have not received any compensation from the companies mentioned in the report in
the preceding twelve months
Compensation of our Research Analysts is not based on any specific merchant banking, investment banking or brokerage service transactions.
The Research analysts for this report certifies that all of the views expressed in this report accurately reflect his or her personal views about the subject company or companies and its or their securities, and no part of his
or her compensation was, is or will be, directly or indirectly related to specific recommendations or views expressed in this report.
The research analysts for this report has not served as an officer, director or employee of the subject company PL or its research analysts have not engaged in market making activity for the subject company
Our sales people, traders, and other professionals or affiliates may provide oral or written market commentary or trading strategies to our clients that reflect opinions that are contrary to the opinions expressed herein,
and our proprietary trading and investing businesses may make investment decisions that are inconsistent with the recommendations expressed herein. In reviewing these materials, you should be aware that any or all o
the foregoing, among other things, may give rise to real or potential conflicts of interest.
PL and its associates, their directors and employees may (a) from time to time, have a long or short position in, and buy or sell the securities of the subject company or (b) be engaged in any other transaction involving
such securities and earn brokerage or other compensation or act as a market maker in the financial instruments of the subject company or act as an advisor or lender/borrower to the subject company or may have any
other potential conflict of interests with respect to any recommendation and other related information and opinions.
DISCLAIMER/DISCLOSURES (FOR US CLIENTS)
ANALYST CERTIFICATION
The research analysts, with respect to each issuer and its securities covered by them in this research report, certify that: All of the views expressed in this research report accurately reflect his or her or their personal
views about all of the issuers and their securities; and No part of his or her or their compensation was, is or will be directly related to the specific recommendation or views expressed in this research report
Terms & conditions and other disclosures:
This research report is a product of Prabhudas Lilladher Pvt. Ltd., which is the employer of the research analyst(s) who has prepared the research report. The research analyst(s) preparing the research report is/are
resident outside the United States (U.S.) and are not associated persons of any U.S. regulated broker-dealer and therefore the analyst(s) is/are not subject to supervision by a U.S. broker-dealer, and is/are not required to
satisfy the regulatory licensing requirements of FINRA or required to otherwise comply with U.S. rules or regulations regarding, among other things, communications with a subject company, public appearances and
trading securities held by a research analyst account.
This report is intended for distribution by Prabhudas Lilladher Pvt. Ltd. only to "Major Institutional Investors" as defined by Rule 15a-6(b)(4) of the U.S. Securities and Exchange Act, 1934 (the Exchange Act) and
interpretations thereof by U.S. Securities and Exchange Commission (SEC) in reliance on Rule 15a 6(a)(2). If the recipient of this report is not a Major Institutional Investor as specified above, then it should not act upon
this report and return the same to the sender. Further, this report may not be copied, duplicated and/or transmitted onward to any U.S. person, which is not the Major Institutional Investor.
In reliance on the exemption from registration provided by Rule 15a-6 of the Exchange Act and interpretations thereof by the SEC in order to conduct certain business with Major Institutional Investors, Prabhudas
Lilladher Pvt. Ltd. has entered into an agreement with a U.S. registered broker-dealer, Marco Polo Securities Inc. ("Marco Polo").
Transactions in securities discussed in this research report should be effected through Marco Polo or another U.S. registered broker dealer.

                                                                                                                                                                                                   Digitally signed by RADHAKRISHNAN SREESANKAR

December 07, 2015                                                                                                                                                         RADHAKRISHNA             DN: c=IN, o=Personal, cn=RADHAKRISHNAN
                                                                                                                                                                                                   SREESANKAR,
                                                                                                                                                                                                   serialNumber=8859da2df03122989b585ad520865a4
                                                                                                                                                                                                                                                  32
                                                                                                                                                                          N SREESANKAR             f59be69fbc1b7ba2c5315941f987f41de,
                                                                                                                                                                                                   postalCode=400104, st=MAHARASHTRA
                                                                                                                                                                                                   Date: 2015.12.07 14:42:57 +05'30'
You can also read