The 2018 Mw7.5 Palu 'supershear' earthquake ruptures geological fault's multisegment separated by large bends: results from integrating field ...
←
→
Page content transcription
If your browser does not render page correctly, please read the page content below
Geophys. J. Int. (2021) 224, 985–1002                                                                                            doi: 10.1093/gji/ggaa498
Advance Access publication 2020 October 20
GJI Geodynamics and tectonics

The 2018 Mw 7.5 Palu ‘supershear’ earthquake ruptures geological
fault’s multisegment separated by large bends: results from
integrating field measurements, LiDAR, swath bathymetry and
seismic-reflection data

Danny Hilman Natawidjaja ,1 Mudrik R. Daryono,1 Gegar Prasetya,2 Udrekh,3 Philip
L-F. Liu,4 Nugroho Dwi Hananto,1 Widjo Kongko,5 Wahyu Triyoso,6 Anggraini
Rizkita Puji,1 Irwan Meilano,6 Endra Gunawan,6 Pepen Supendi,7 Astyka Pamumpuni,6

                                                                                                                                                            Downloaded from https://academic.oup.com/gji/article/224/2/985/5932272 by guest on 15 October 2021
Mashyur Irsyam,6 Lutfi Faizal,8 Sri Hidayati,9 Benyamin Sapiie,6 Mipi A. Kusuma6 and
Sukardan Tawil10
1 Indonesian   Institute of Science, Indonesia. E-mail: danny.hilman@gmail.com
2 Indonesian   Association of Tsunami
3 National Agency for Disaster Management (BNPB)
4 National University of Singapore, Singapore
5 Agency for The Assessments and Applications of Technology (BPPT)
6 Institute of Technology Bandung, Bandung, Indonesia
7 Agency for Meteorology, Climatology, and Geophysics (BMKG), Jakarta, Indonesia
8 Ministry of Public Works and Housing, National Center for Earthquake Studies(PuSGeN), Bandung, Indonesia
9 Geological Agency of Ministry of Mines and Energy, Center for Volcanology and Mitigation of Geological Disaster, Bandung, Indonesia
10 Geology Department Palu,Tadulako University, Palu, Indonesia

Accepted 2020 October 18. Received 2020 October 10; in original form 2020 July 7

                                       SUMMARY
                                       On 2018 September 28, 18:02:44 local time, the magnitude 7.5 earthquake accompanied by
                                       a tsunami and massive liquefaction devastated Palu region in Central Sulawesi, Indonesia.
                                       Comprehensive post-disaster surveys have been conducted, including field survey of surface
                                       ruptures, LiDAR, multibeam-bathymetry mapping and seismic-reflection survey. We used
                                       these data to map fault ruptures and measure offsets accurately. In contrast to previous remote-
                                       sensing studies, suggesting that the earthquake broke an immature, hidden-unknown fault
                                       inland, our research shows that it occurred on the mappable, mature geological fault line
                                       offshore. The quake ruptured 177-km long multifault segments, bypassing two large releasing
                                       bends (first offshore and second inland). The rupture onset occurred at a large fault discon-
                                       tinuity underwater in a transition zone from regional extensional to compressional tectonic
                                       regimes. Then, it propagated southward along the ∼110-km submarine fault line before reach-
                                       ing the west side of Palu City. Hence, its long submarine ruptures might trigger massive
                                       underwater landslides and significantly contribute to tsunami generation in Palu Bay. The
                                       rupture continued inland for another 67 km, showing predominantly left-lateral strike-slip up
                                       to 6 m, accompanied by a 5–10 per cent dip-slip on average. The 7 km sizeable releasing bend
                                       results in a pull-apart Palu basin. Numerous normal faults occur along the eastern margin.
                                       They cut the Quaternary sediments, and some of them ruptured during the 2018 event. Our
                                       fault-rupture map on mature straight geological fault lines allows the possible occurrence of
                                       early and persistent ‘supershear’, but significant asperities and barriers on segment boundaries
                                       may prohibit it.
                                       Key words: Tsunamis; Earthquake hazards; Continental tectonics: strike-slip and transform;
                                       Neotectonics; Paleoseismology; Submarine landslides.


C The Author(s) 2020. Published by Oxford University Press on behalf of The Royal Astronomical Society. This is an Open Access

article distributed under the terms of the Creative Commons Attribution License (http://creativecommons.org/licenses/by/4.0/), which
permits unrestricted reuse, distribution, and reproduction in any medium, provided the original work is properly cited.
                                                                                                                                                     985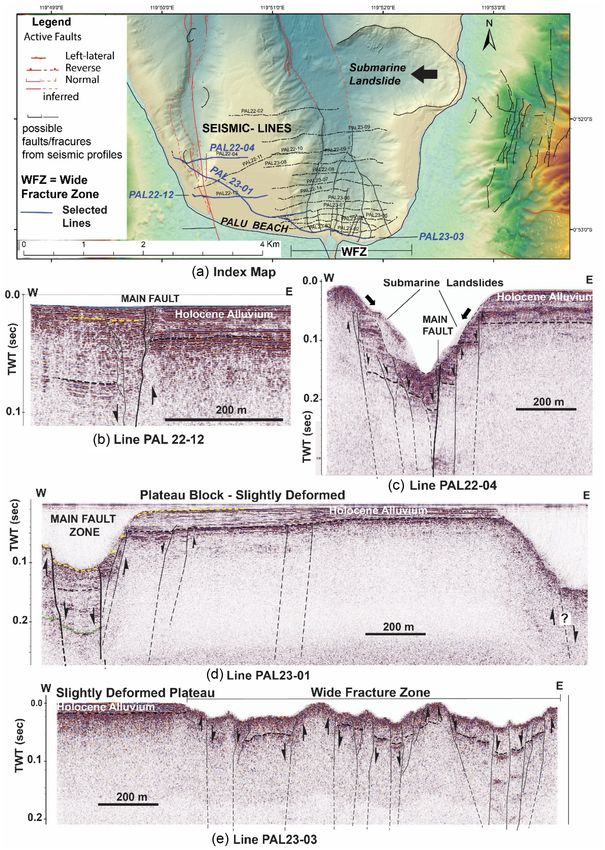
986       D.H. Natawidjaja et al.

                                                                             fault ruptures were thought to be buried or not quite reaching the
1 I N T RO D U C T I O N
                                                                             ground surface (e.g. Bacques et al. 2020). This remote-sensing fault
On the 2018 September 28, the Mw 7.5 earthquake (Fig. 1a) associ-            model might have misled our fundamental understanding since it
ated with a tsunami and massive liquefaction in the Palu-bay region,         allows us to consider the possibility that a massive strike-slip fault
Central Sulawesi, Indonesia, resulted in more than 2000 fatalities           earthquake with M7.5 can be nucleated on and ruptured along a
and an estimated total costs of about 22,8 trillion Indonesian Rupi-         70-km buried, immature (secondary) fault zone without reaching
ahs (∼USD 1,5 billion on current-exchange rate) for rehabilitation           the ground surface. Unlike buried thrust faults or blind thrusts
and reconstructions, based on the report of BAPPENAS and Cen-                (e.g. Shaw & Suppe 1996), buried large strike-strike fault rup-
tral Sulawesi Provincial-Government (BAPPENAS and Central-                   tures have never been observed anywhere since strike-slip fault
Sulawesi-Local-Government 2018). The Palukoro fault zone pro-                earthquake with sizeable displacement commonly propagate to the
ducing the earthquake is a west-end part of a long, fast-moving              surface (King & Wesnousky 2007).
left-lateral strike-slip fault in East Indonesia. The fault begins from         It had also led to tsunami-source modelling misinterpretations,
Papua (Yapen and Sorong Faults), through the North Molucca re-               since it only accounts for the fault rupture that runs at a short
gion (Sula-Sorong Fault) before it finally continues to Sulawesi as          distance underwater across the Bay (Muhari et al. 2018; Gusman
the Matano and Palukoro Fault (Silver et al. 1983; Charlton 2000;            et al. 2019; Heidarzadeh et al. 2019). Hence, it underestimates

                                                                                                                                                      Downloaded from https://academic.oup.com/gji/article/224/2/985/5932272 by guest on 15 October 2021
Socquet et al. 2006; Watkinson & Hall 2017) (Fig. 1b).                       tsunami excitation due to underwater fault movements but solely
   This regional east Indonesia strike-slip fault has resulted from          attributed to (suspected) massive underwater landslides. Tsunami-
the oblique convergence between the Pacific and Australia plates             wave models based on coastal landslides alone cannot explain the
(Puntodewo et al. 1994; Bock et al. 2003). The amount of strain              tsunami-wave records (Liu et al. 2020).
that partitions into left-lateral movements are up to 80 mm a−1 ,               This study comprehensively integrates the results of field ob-
accommodated by a 300-km wide zone focusing on the Yapen and                 servations, inspections of LiDAR-data coupled with mosaic high-
Tarera-Aiduna fault (Watkinson & Hall 2017). Based on regional               resolution aerial photos, and analysis of high-resolution multibeam
GPS data, the slip rate on the Yapen fault is 46 ± 12 mm a−1                 bathymetry and seismic-reflection sections (Fig. 2). We applied
(Bock et al. 2003), which is the indifference with the slip rate of          standard techniques for mapping active faults based on visual in-
the Matano—Palukoro fault, about 37 ± 8 mm a−1 (Bellier et al.               spections of tectonic landforms, such as fault scarps, linear and
2001; Socquet et al. 2006). The age of initial movement on the               pressure ridges, long-straight valleys and displaced or deflected
Sorong fault in the Bird’s head of Papua has been estimated to be            streams both for land topography and bathymetry (e.g. Yeats et al.
about 12 Ma (million years ago) (Charlton 2000). The so-called               1997; Sieh & Natawidjaja 2000; Burbank & Anderson 2001). As
Sula platform consisting of Paleozoic-early Mesozoic rocks (Sil-             standard in mapping, we also included liquefaction and landslide
ver et al. 1983) was estimated to have been left-laterally displaced         features associated with the 2018 earthquake and previous events.
about 850 km strike-slip fault from the Bird’s head before it has            Hence, we provide the most complete and accurate map of active
collided with the east-arm Sulawesi (Charlton 2000). The collision           faults together with the 2018 Palu earthquake ruptures through-
resulted in the formation of the Matano and the Palukoro faults. The         out the Palu region both inland and offshore (Figs 3, 4 and 6, and
total offset along the Matano–Palukoro faults, based on geological           Figs S1 and S2a–h, Supporting Information). Detailed fault geome-
reconstructions, is about 250 km (Silver et al. 1983). This primary          tries and precise measurements of co-seismic slip variations provide
strike-slip fault in Sulawesi has a tectonics role as a transform fault      new insight into the fault rupture kinematics and its related hazards
connecting the Tolo thrust and the Sulawesi trench, and accommo-             (Fig. 6 and Table S1, Supporting Information). Our fault map can
dating westward-northward movement of a rigid central-Sulawesi               be viewed in the Google Maps at link: https://goo.gl/maps/pkiou8
block in a clockwise rotation driven by collision of the Sula plat-          t68DVcu2YE6. We also provide the KMZ extension files of the
form in the east (Silver et al. 1983; Walpersdorf et al. 1998; Stevens       fault lines in the e-Supplement for viewing in the Google Earth or
et al. 1999; Socquet et al. 2006).                                           others.
   An advanced remote-sensing method, satellite geodesy optical-
image-correlation and InSAR (Interferometric Sinthetic Aperture
Radar) analysis could publish maps of surface ruptures and co-
                                                                             2 T H E PA L U KO R O FAU LT Z O N E :
seismic displacements in just days after the event (Valkaniotis et al.
                                                                             G E O M E T RY A N D S E G M E N TAT I O N S
2018). Then, combined with the location of the main shock and the
distribution of aftershocks, led to the interpretation that the initiation   The Palukoro fault is very segmented. We divide it into four main
of the rupture broke an unknown, hidden fault, a couple of tens of           segments separated by large bends and stepovers, from north to
km away east of the previously known mature geological fault line            south: Tanimbaya, Donggala, Palu and Saluki segments (Fig. 3).
(Fang et al. 2019; Socquet et al. 2019; Song et al. 2019; Wang et al.        The fault regionally curves clockwise from the Tanimbaya Penin-
2019). In this scenario, the initial rupture propagated southward            sula toward the North Sulawesi trench, resulting in a broad com-
along the island’s neck, then crossing the Bay and coalescing onto           pressional tectonic regime that connects the strike-slip fault system
the principal fault zone on the Palu Bay’s west side. This rupture           to the subduction zone (Fig. 1a). Therefore, the Tanimbaya seg-
scenario gains acceptance worldwide as used or cited in numerous             ment is the beginning of the contractional strike-slip fault regime.
literature (e.g. Muhari et al. 2018; Bao et al. ; Bradley et al. 2019;       The Tanimbaya segment is separated from the Donggala segment
Carvajal et al. 2019; Gusman et al. 2019; Heidarzadeh et al. 2019;           in the south by a 4.2 km width restraining stepover, with secondary
Patria & Putra 2020). Even though the data coverage is only partial          reverse faults as a part of flower structures along a compressional
since satellite-image data in Palu-bay water is blank; hence, there is       strike-slip zone (Harding 1985). The Donggala segment has a slight
a significant mismatch in the modelling (e.g. Song et al. 2019).             restraining bend in the middle (Fig. 3 and Fig. S2b, Supporting
   Besides, indications of fault movements in the neck, the narrow           Information). The 2018 main shock location is determined at about
land connecting the central Sulawesi with the north-arm Sulawesi,            15 km northeast from this bend, based on the relocated main shock
are also hardly discernable (e.g. Wang et al. 2019). Therefore, the          epicentre (Supendi et al. 2020).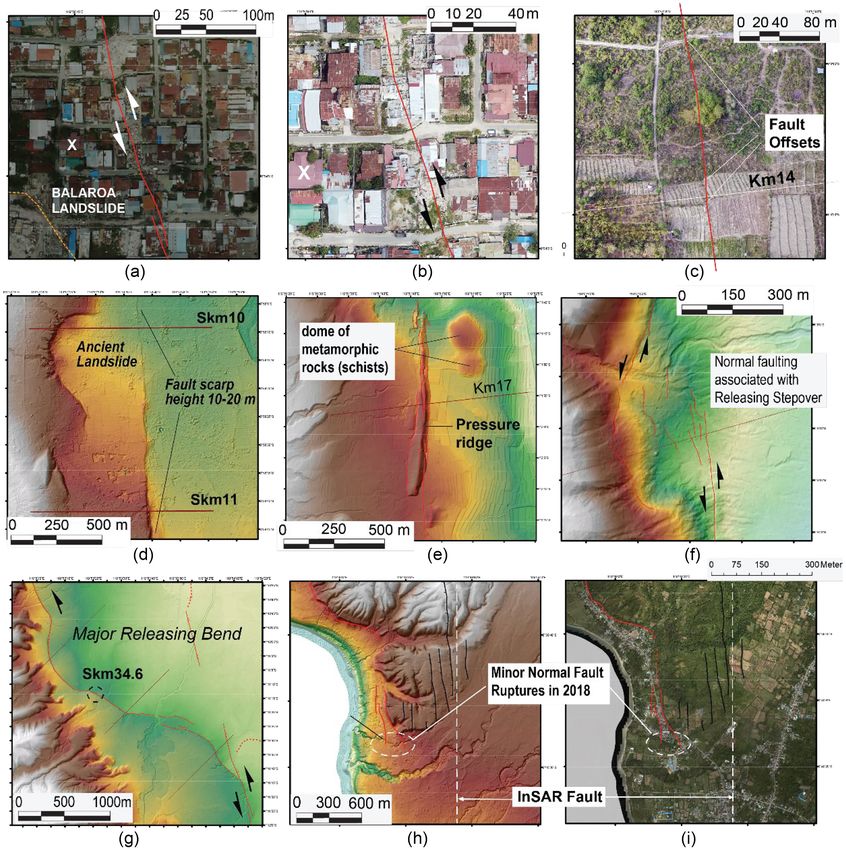
2018 Mw 7.5 Palu earthquake ruptures                987

                                                                                                                                                              Downloaded from https://academic.oup.com/gji/article/224/2/985/5932272 by guest on 15 October 2021

Figure 1. (a) Relocated main shock and aftershock epicentres of the 2018 earthquake from Supendi et al. (2020), plotted on active fault map of the Sulawesi
region. (b) Index map of the regional left-lateral fault system in east Indonesia. YF = Yapen Fault, SF = Sorong Fault, SSF = Sula-Sorong Fault, TT = Tolo
Thrust, MF = Matano Fault, PKF = Palukoro Fault, ST = Sulawesi Trench, TAF = Tarera-Aiduna Fault, KBF = Kawa-Boboi Fault. SP = Sula Platform,
BAT = Banda-Arc Thrust, Se = Seram, Bu = Buru. (c) The relative uncertainty of epicentre relocations. The mean uncertainty is 6.5 km measured from the
original position (from Supendi et al., 2020).

   Southward from the Tanimbaya Peninsula, the fault orienta-                    the fault segments marks these extensional tectonics. The first is
tion regionally rotates eastward, implying an extensional left-lateral           the 3.5 km width fault bend underwater in the Palu Bay, separating
strike-slip fault regime. The two large releasing bends separating               the Donggala and Palu segments. The second is the 7-km width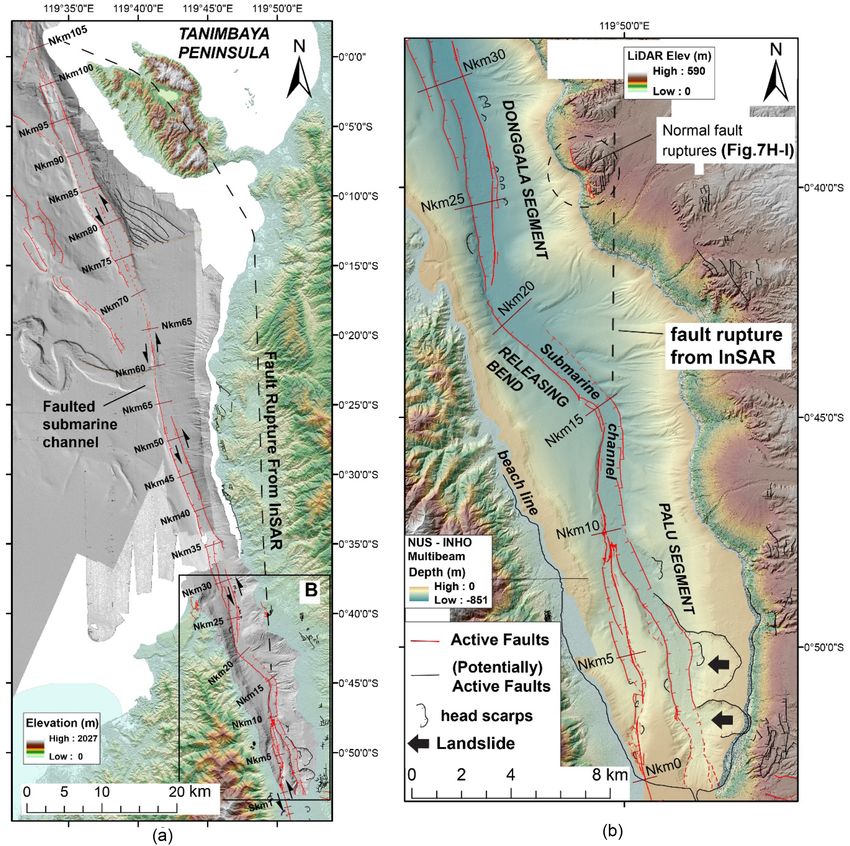
988      D.H. Natawidjaja et al.

                                                                                                                                                           Downloaded from https://academic.oup.com/gji/article/224/2/985/5932272 by guest on 15 October 2021

Figure 2. Index map of LiDAR coverage, various swath bathymetry data and the sparker seismic-reflection survey of JICA used in this study. The LiDAR is
from the Agency of Geospatial Information of Indonesia (BIG). Swath bathymetry data are from the Baruna-Jaya survey (Frederik et al. 2019), the NUS-INHO
(National University of Singapore—Indonesia Tsunami Society and Navy Hydrography Office) (Liu et al. 2020), and the old TGS data (see the text for
discussions).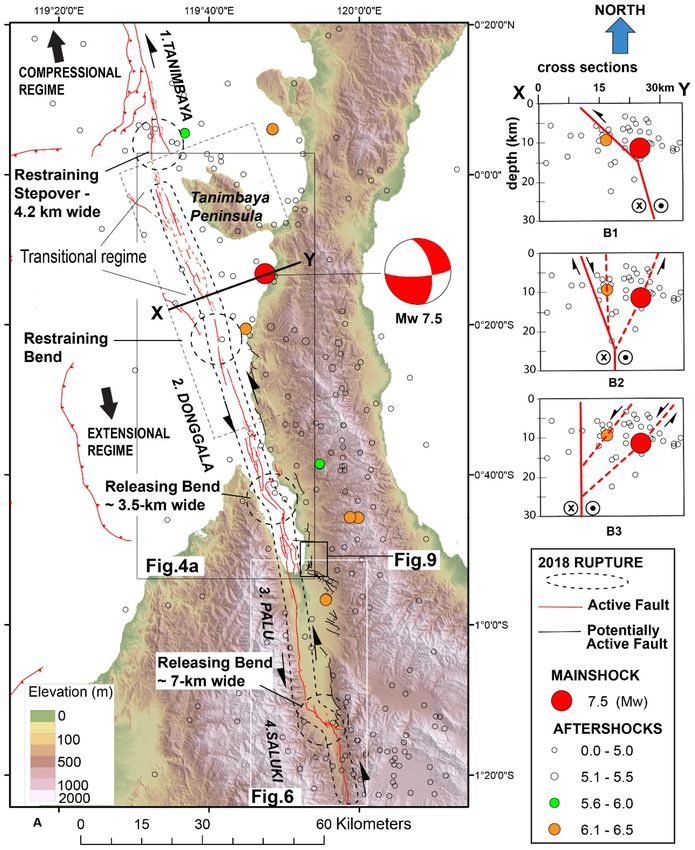
2018 Mw 7.5 Palu earthquake ruptures                  989

                                                                                                                                                                    Downloaded from https://academic.oup.com/gji/article/224/2/985/5932272 by guest on 15 October 2021

Figure 3. (a) The new map of active faults and the proposed location of the 2018 Mw 7.5 ruptures from this study together with plots of the relocated main shocks
and aftershocks (Supendi et al. 2020). Palukoro Fault divides into four segments: Tanimbaya, Donggala, Palu and Saluki. The dashed rectangle perpendicular to
the X–Y line is the area of projected earthquake data. B1, B2 and B3 are plausible options of subsurface fault geometry along the X–Y cross-section concerning
the main shock’s location and rupture nucleation, drawn with the 2-D plots of the 2018 main shock and aftershocks (see the text for discussions).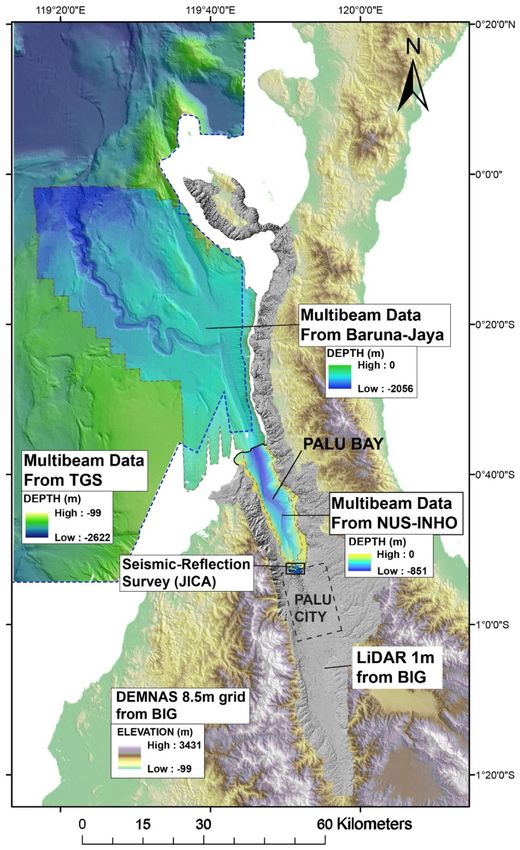
990       D.H. Natawidjaja et al.

                                                                                                                                                                 Downloaded from https://academic.oup.com/gji/article/224/2/985/5932272 by guest on 15 October 2021
Figure 4. (a) Offshore fault lines mapped on swath bathymetry data, marked every 5 km from the Palu Beach northward. (b) Detailed active fault traces inside
Palu Bay, including the presence of massive submarine landslides. The black dashed line is the inferred fault rupture deducted from InSAR (Socquet et al.
2019). Normal-fault ruptures occurred on the neck around the InSAR fault rupture, drawn as red colour lines in contrast to the rest of the black colour normal
faults, denoted as potentially active faults (see the text for discussions).

bend inland, around the southern edge of the Palu pull-apart basin,               LiDAR data. Numerous open fractures and some normal faults
separating Palu and Saluki segments (Fig. 3). Thus, the Donggala                  also occurred during the main shock and aftershocks of the 2018
segment is in the transition zone between the compressional and                   earthquakes. Here, the normal faults along the Palu-valley eastern
extensional tectonic regimes and, hence, it is a rather complicated               margin are drawn in black lines as they are secondary slow-moving
fault zone portraying both regimes’ influence.                                    faults compared to the primary fast-moving Palukoro fault zone,
   A broad extensional zone along the eastern margin of the Palu                  drawn in red. The black-line faults are denoted here as potentially
pull-apart basin and the west side of the neck region facilitate the              active faults (e.g. Figs 3 and 4) since we do not have clear evidence
extensional tectonics, as shown by numerous normal faults, mapped                 that they cut the Holocene alluvium, except those ruptured in the
from the field survey and inspections of tectonic landforms on                    2018 earthquake (Figs 4b, 7h and i and 8i and j).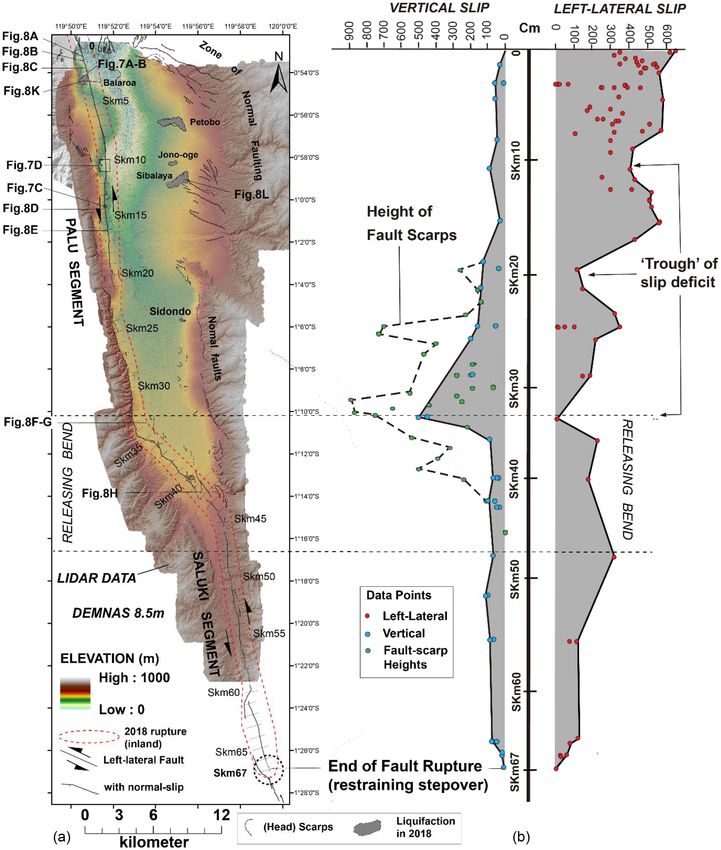
2018 Mw 7.5 Palu earthquake ruptures 991
Downloaded from https://academic.oup.com/gji/article/224/2/985/5932272 by guest on 15 October 2021
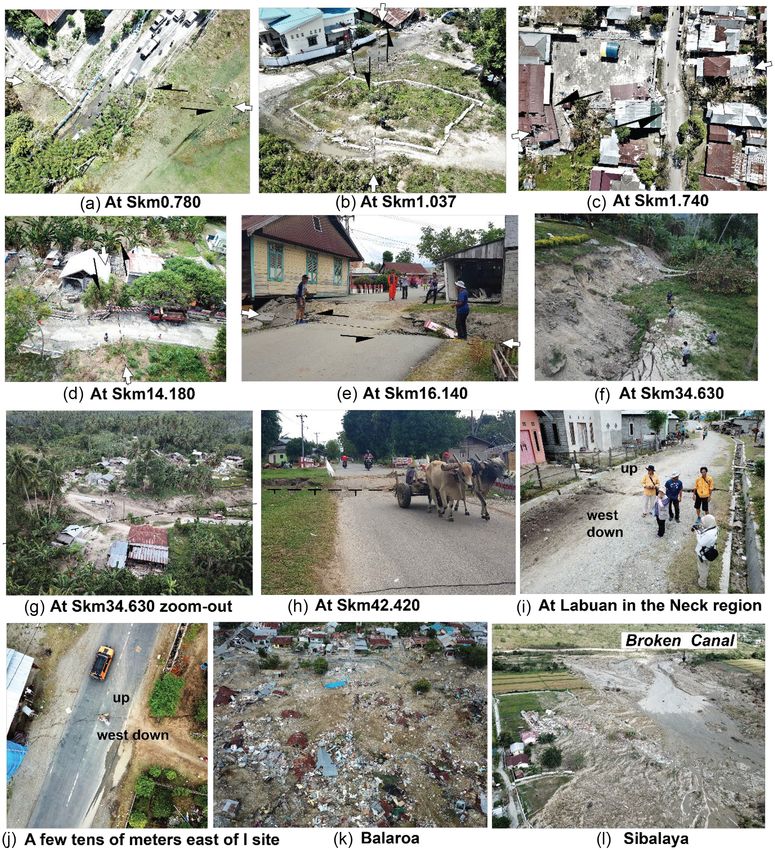
Figure 5. Sparker (single channel) seismic reflection profiles across Palu Bay. The B–E profiles have 2x vertical exaggeration, directed from west to east. The
average seismic velocity is ∼1000 m/sec; hence 0.1 TWT is about 100 m. (a) Index map, (b) PAL22-12 profile showing a sharp boundary of the main fault,
(c) PAL 22—04 profile showing a wide normal fault graben around the main fault, (d) PAL23-01profile is showing the principal fault zone and the slightly
deformed plateau block and (e) PAL23-03 profile across the east side of the bay showing a broad zone of extensional fractures.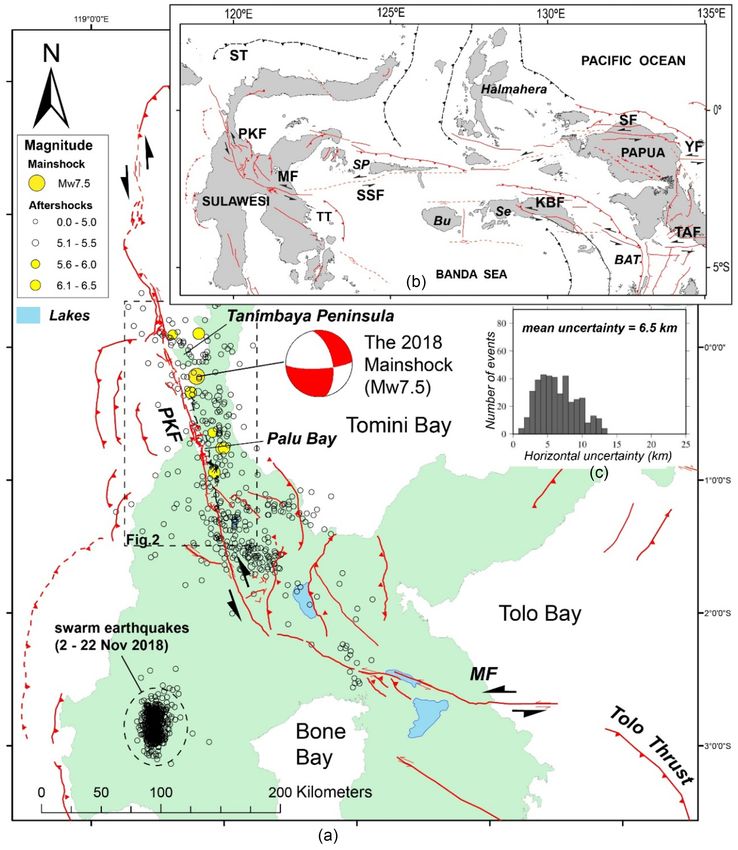
992       D.H. Natawidjaja et al.

                                                                                                                                                                     Downloaded from https://academic.oup.com/gji/article/224/2/985/5932272 by guest on 15 October 2021

Figure 6. (a) Map of inland active fault ruptures from this study. The 2018 main ruptures occurred along the geological fault line. For descriptions, it is marked
every 1km from the Palu Beach southward (Skm1, Skm2, etc.). (b) Distributions of left-lateral, and vertical (normal) slips along the ruptures. The shaded areas
are under the graphical lines enveloping the offset data points. Note that normal slip increases approaching the fault bend while the left-lateral slip decreases.
2018 Mw 7.5 Palu earthquake ruptures 993
Downloaded from https://academic.oup.com/gji/article/224/2/985/5932272 by guest on 15 October 2021
Figure 7. Illustrations of mapping methods and results. (a) Mapping surface ruptures on LiDAR orthophoto, (b) mapping surface ruptures assisted by higher
resolution drone’s photo, (c) an example of fault offsets of roads and paddy-field alignments on drone’s orthophoto and (d) the 2018 surface ruptures along
pre-existing active fault scarps seen on LiDAR DTM. Note that there is an ancient head scarp from the previous landslide hiding under heavy vegetations, (e)
the 2018 ruptures along a pre-existing active fault strand associated with a pressure-ridge linear hill, (f) LiDAR DTM shows small releasing stepover associated
with normal faulting, (g) mapping structural complexity around the very-large releasing bend, (h) minor normal fault ruptures around the InSAR-inferred
ruptures plotted on LiDAR DTM and (e) similar map but plotted LiDAR orthophoto. Locations of figures are marked in Figs 4 and 6 (Figs S2e and c and d,
Supporting Information).
3 MAPPING OFFSHORE ACTIVE survey inside the Palu Bay (10–200 m depth, Fig. 2). The intera-
FAU LT S gency rapid-survey team conducted the first deep-water survey from
2018 October 9 to 18 using the Baruna Jaya I research vessel of
3.1 Swath-bathymetry data and previous interpretations BPPT (The Agency for Assessment and Application of Technology,
Frederik et al. 2019). The vessel was equipped with a hull-mounted
There were three swath bathymetry surveys conducted after the
Hydro Sweep DS Multibeam operating at 14–16 kHz with a beam
2018 earthquake: two deep swath bathymetry surveys (>100 m
resolution of 2◦ × 2◦ and a geo-positioning system (GPS C-NAV
depth) inside and outside the Palu Bay and one shallow bathymetry994 D.H. Natawidjaja et al.
Downloaded from https://academic.oup.com/gji/article/224/2/985/5932272 by guest on 15 October 2021
Figure 8. Field photos showing examples of fault ruptures and offsets of the 2018 event. (a) Km1 + 740, (b) Km0 + 780, (c) Km1 + 037, (d) Km14 + 180,
(e) Km16 + 140, (f) Km34 + 630, (g) Km34 + 630, (h) Km42 + 420, (i) and (j) on land rupture in the eastern side of Km25 seabed—northern side of Palu
City, (k) Liquefaction, and land movements in Balaroa and (l) liquefaction and land movements in Sibalaya. The location of the photos are marked in Fig. 6
and Fig. S2e in the Supporting Information.
2050) and can collect data between depths of 10–11 000 m. Data 2018 November 27 to December 11 (Liu et al. 2020). This sur-
were acquired using the PDS 2000 software package (Teledyne) vey used an adapted fishing boat equipped with differential GPS, a
for hydrographic surveys (www.teledyne-pds.com) and the CARIS single-beam echo-sounder, accelerometers and an MBES (Kongs-
Hips and Sips 10 software package (Teledyne) for hydrographic berg EM2040C). The MBES can collect data up to 250 m water
data processing (www.teledynecaris. com). The second-deep swath- depth and has a swath width of 2 times the depth. The horizontal
bathymetry survey was carried out by the Indonesian Navy Hydrog- resolution in the near-shore survey was about 0.8 m, and vertical
raphy Office (INHO)(PUSHIDROSAL) using the KRI Spica 934 uncertainties range from 5 cm to a maximum of 0.4 per cent (i.e.
boat during 2018 October 4–10. The bathymetry data were mea- 0.8 m at 200 m water depth). Liu et al. (2020) have combined the
sured using a Kongsberg EM302 echo sounder (MBES), which can processed deep bathymetry data, provided by INHO, with the NUS
collect data for water depths up to 7000 m and has a swath width of shallow bathymetry survey into a single bathymetry DEM with 5-m
5.5 times the depth. The horizontal resolution is 10 m, and maxi- grid data, used by this study. The multibeam data from Frederick
mum vertical uncertainties are 0.6 per cent (i.e. 5 m at 850 m water et al. (2019) overlapped with Liu et al. (2020) inside the Palu Bay.
depth). We also use old TGS multibeam bathymetry to further map the fault
The NUS (National University of Singapore), in collaboration zone to the Sulawesi trench associated with the active subduction
with IATsI (Indonesia Tsunami Society), conducted the shallow zone. The TGS data outside the Palu Bay overlapped with Frederick
water bathymetry survey (10–200 m) inside the Palu Bay from et al. (2019, Fig. 2).2018 Mw 7.5 Palu earthquake ruptures 995
From the multibeam bathymetry survey results, Frederick et al. channel or graben. This bend separates the northern and southern
(2019) and Liu et al. (2020) have clearly shown the existence of parts of the Donggala segments.
submarine channels inside and outside the Palu Bay. The active sub- Between Nkm 60–55, a primary fault trace, associated with fresh-
marine channel started from Palu river mouth, developing a braided looking sharp-linear fault scarps facing east, runs in the front of the
river, and continued northward along the long-narrow submarine 1500-m submarine channel that turns sharp 90◦ to the west. Here, we
valley (sub) parallel to the coastline. There is also an inactive or suggest that the submarine channel might initially flow northward.
a former channel on the west side of the active Palu delta river, Since the restraining bend has uplifted the area between Nkm60–
which merges at the bifurcation point about 10 km north of the 70, then the submarine channel flow has been blocked and deflected
Palu beachfront (Frederik et al. 2019, Fig. 4b and Fig. S2d, Sup- to the west (Fig. 4a, and Fig. S2b, Supporting Information). From
porting Information). Outside the Palu Bay, the submarine channel Nkm60 southward, the long-narrow submarine channel or graben
continues into the deeper water. Around 0.22◦ –0.24◦ S, it devel- re-appears and continues very straight until reaching Nkm20. From
oped into two channels. The first continuous along an ∼N-S strik- Nkm20 to Nkm15, the submarine channel sharply bends eastward,
ingly straight channel or valley toward the Tanimbaya Peninsula and interpreted as the 3.5 km width releasing fault bend, associated with
the second has a sharp 90◦ anticlockwise turn toward the Makas- predominated normal faulting.
sar strait (Frederik et al. 2019, Fig. 4a and Fig. S2b, Supporting From Nkm15 toward the beach (Nkm0), the fault-controlled sub-
Downloaded from https://academic.oup.com/gji/article/224/2/985/5932272 by guest on 15 October 2021
Information). marine channel is relatively straight, but it bifurcates into two at
Frederick et al. (2019) have described and concluded that the Nkm10. The larger eastern channel goes to the mouth of the active
submarine-river channels along the narrow graben associated with Palu River, and the western smaller channel runs toward the location
the offshore continuation of the Palukoro fault zone inside the Palu of the 2018 main fault rupture, located close to the western margin
Bay and outside the Bay toward the Tanimbaya Peninsula. Accord- of the Palu valley (Fig. 4b, and Fig. S2d, Supporting Information).
ingly, these fault-bounded submarine channels tend to be straight, The fault movement has uplifted the western submarine channel
so they have a low sinuosity index closer to 1. The sinuosity in- relative to the main eastern channel, leaving it as a hanging sub-
dex of the channel attributes to the influenced of the alluvial fans marine channel no longer active (Fig. 4b, and Fig. S2d, Supporting
surrounding the Bay. In contrast, the second deeper water channel Information).
that turns 90◦ toward the Makassar Strait develops a meandering
river and has a high sinuosity of 1.7, suggesting less influence by
fault (Frederik et al. 2019) as it flows away from the Palukoro fault 3.3 Fault analysis of seismic-reflection profiles
zone according to our fault map. However, Frederick et al. (2019) PT HGS (Hydro Geophysical Survey) conducted the single-channel
did not provide the details of submarine active fault traces. Liu seismic-reflection survey under Japan International Corporation
et al. (2020) also did not analyse and discuss the tectonic aspects of Agency (JICA) and The National Agency for Planning and De-
the multibeam bathymetry but focused on mapping and quantifying velopment (BAPENNAS) project. The survey used seismic energy
submarine landslides that significantly contributed to the destructive source CSP-D2400, Applied Acoustics Squid 2000 Sparker with
tsunami. floats, single-channel 8 hydrophone streamer, and CODA DA2000
data recording system suitable for a local-wooden boat equipped
with a 7.5 KW 220 V generator. Data acquisitions use a 1.2 s shot-
3.2 Fault analysis of swath bathymetry
point interval at ∼1 m s−1 vessel speed with a sampling rate of
The traces of active submarine faults reveal their tectonic land- 8 kHz. Streamer and sparker tow-depth are approximately 0.3 and
scapes on the high-resolution bathymetry (Fig. 4 and Figs S2a–d, 0.2 m. Data processing includes deconvolution and filtering, cal-
e-Supplement 1, Supporting Information). However, identifying the culation of the CDP positions, geometry corrections and band-
2018 fault ruptures from the available bathymetry data (i.e. ≥5-m pass filter at 400–2000 Hz 24 dB/octave and IIR Zero phase filter.
grid DEM) is impossible because of insufficient resolution. Close The positioning during mobilization in Palu used the Trimble GPS
to the fault lines, arcuate head scarps mark numerous submarine SPS 461 and heading with Marine Star signal HPG 2 with 10 m
landslides with a radius of a couple of hundred meters to as large accuracy.
as a couple of kilometres wide. Some of them have fresh scarps To help detailed interpretation in this study, we conducted ad-
indicating their possible relations with the recent 2018 event. The vanced seismic data processing to reduce noises and enhance sig-
two most massive fresh submarine head scarps with radius 1.5 and nals based on the raw seismic data. The aim is to improve the
2.5 km occurred inside Palu Bay (Liu et al. 2020, Fig. 4b, and Fig. coherence of signal quality. Furthermore, several preconditions are
S2d, e-Supplement 2, Supporting Information). carried out, such as FX deconvolution and amplitude balancing to
For the ease of descriptions, we put 5-km interval marks along improve coherence and continuity. Based on our filter test, the sig-
the offshore fault zone from the Palu-City beach northward with no- nal bandwidth is in the range of 250–500–1250–2500 Hz, and the
tations Nkm5, Nkm10, etc. (Fig. 4, and Figs S2a–d, e-Supplement better coherence and continuity resulted after predictive deconvo-
3, Supporting Information). From Nkm90 on the northern Dong- lution with the bandpass filter of about 250–500–750–1250 Hz. We
gala segment northward to Nkm105, the fault runs into ∼ 4.2 km exercised the step of predictive deconvolution and several parame-
width restraining stepover, marked by the closing of its associated ters of Gap and Operator Length. It appears the optimum predictive
submarine long-narrow graben valley. From Nkm90 southward to deconvolution parameter with the Gap = 1 and OL = 140. It is
Nkm70, the fault zone is marked by a narrow, straight submarine probably related to the relatively high bandwidth of the data.
graben with a width up to 2700 m at depth about ∼1000 m. From To develop the velocity model, first, we do the simulation seis-
Nkm70 to NKm50, the fault swings clockwise before returns to the mic migration based on the single velocity model (110 per cent, 105
initial trend along Nkm50 to Nkm35. Hence, it forms a restraining per cent, 100 per cent, 95 per cent and 90 per cent) on the default
bend, marked by disappearing and re-appearing of the submarine ProMAX marine seismic velocity model. The 95 per cent velocity996 D.H. Natawidjaja et al.
model appears to be good enough. The next step is constructing left-lateral slip inland near the location of the proposed PSN fault
a straightforward interpretation and lumping the simple velocity (Figs 4b, 7h and 8i and j, and Fig. S2c, Supporting Information).
model based on the seismic horizon interpretation. Then, to collapse Hence, in contrast to the previous studies postulating the 2018
the diffractions, we use this simple velocity model for the Kirchhoff rupture was nucleated on an unmappable, immature fault line be-
method of the seismic migration process. Finally, we conducted a neath the island’s neck (Bao et al. 2019; Socquet et al. 2019), we
geological interpretation of the enhanced seismic-reflection profiles propose that the 2018 Palu earthquake nucleated on the mature
across the Palu-City Bay Front to identify subsurface structures re- geological fault, that is, the Donggala segment. There are several
lated to the 2018 fault ruptures and local tectonics (Fig. 5). Together plausible explanations for the main shock epicentre being somewhat
with high-resolution bathymetry data, we mapped the continuation off the surface fault trace, listed according to preference.
of the inland fault rupture lines into Palu Bay. First, since all of the large aftershocks occurred on the east of the
We interpret that from NKm10 southward, where the submarine fault zone (Supendi et al. 2020), epicentre determination might have
channel splits into western and eastern channels, the Palukoro-fault been systematically shifted eastward, which, for example, could be
graben widens. The western smaller linear graben representing the caused by inaccuracy of the used seismic velocity model. Supendi
negative-flower-structure becomes narrower and disappears toward et al. (2020) used 26 BMKG broadband seismic stations throughout
the beachfront. From the beachfront southward, the fault formed Sulawesi and four stations along the east side of Kalimantan. Most
Downloaded from https://academic.oup.com/gji/article/224/2/985/5932272 by guest on 15 October 2021
a sharp straight line. This gradual change correlates well with the of the stations sit on the east side of the epicentre. Their velocity
subsurface geological structures captured by the seismic-reflection model is from Widiyantoro & van der Hilst (1997) with a regional
profiles, PAL22-04 (Fig. 5c), PAL23-01 (Fig. 5d) and PAL22-12 one-degree grid 3-D velocity model; Hence, it serves like a 1-D
(Fig. 5b). Hence, it shows the reliability of fault mapping from model, which might not be suitable for a complex 3-D geological
morphological expressions (on bathymetry or topography). structures. Moreover, the determination of the main shock and after-
The eastern longitudinal graben runs to the east side of the Palu shock locations have average uncertainty of about 6.5 km, measured
valley and correlates with a wide graben with irregular sea-bottom relatively from the original locations; hence it is not the absolute
topography shown in the east end of the Line PAL23-01 and Pal23- uncertainty (Supendi et al. 2020).
03 seismic sections (Figs 5d and e). The wide graben’s subsurface Second, the fault plane may dip eastward as inferred from broad-
structures on the east side are generally fuzzy because of high band seismic data (Fang et al. 2019; Supendi et al. 2020) so that the
noises. However, the irregular topography appears to correlate with projection of the epicentre location is on the main fault (Fig. 3-b1).
the underlying fracture zones. This subsurface broad fracture zone However, assuming the main shock epicentre is accurate, the fault
also coincides with abundant fractures and open fissures observed shall dip up to 45◦ , which is unrealistic for a strike-slip fault. Third,
on the alluvial plain after the 2018 event. The broad fracture zones the fault zone has a sizeable negative flower structure (Harding
might also correlate with numerous normal faults trending N-S and 1985), as mapped in this study. Hence its secondary fault branch
NW-SE along the eastern margin and the neck land’s west side. might lie beneath the main-shock epicentre location (Fig. 3-b2)
Hence, overall, the seismic-reflection profiles across the bay show so that the earthquake might become first nucleated on the fault
three main structural features (from west to east): (1) the main branch before it propagated to the central fault plane. The fourth
fault zone on the west side; (2) the plateau block that only slightly is like the third reason but assuming a more vertical main fault
deformed in the middle and (3) the broad fracture zones facilitating offshore (Fig. 3-b3).
the ongoing tectonic subsidence of the eastern side of the Palu
pull-apart basin.
4 M A P P I N G I N L A N D FAU LT RU P T U R E S
AND OFFSETS
3.4 Synthesis
The survey for acquiring the LiDAR data set, including DTM, DSM
Our geomorphological analysis on the high-resolution bathymetry and orthophoto, was conducted between 2018 mid-November and
inside and outside the Palu Bay, coupled with interpretations of 2019 January by the Agency for Geospatial Information (BIG).
single-channel seismic sections near the mouth of the Bay, has LiDAR data covers about 2 million km2 areas around the Palu Bay
identified the continuations of the Palukoro main fault zone and its (Fig. 1) with an accuracy of the 1-m grid. The associated orthophoto
associated secondary normal faults into the Bay. It runs northward has a pixel resolution of 10 cm. For mapping fault outside the LiDAR
continuously underwater toward the west side of the Tanimbaya coverage, we use DEMNAS, Indonesian DEM with 8.5 m grid data,
Peninsula and still goes further north, approaching the western end provided by BIG and freely available at http://tides.big.go.id/DE
of the Sulawesi trench. The fresh-looking fault scarps bounded the MNAS/.
long-straight-narrow submarine valleys represent the main fault and We conducted the inland field surveys in two campaigns. The first
associated negative flower structure (normal-fault graben). Sharp fieldwork was in 2018 October, a few weeks after the event, as part of
linear valley and ridges and fault scarps on the seafloors reveal PuSGeN (National Center for Earthquake Studies)’s activities under
individual fault traces. the Ministry of Public Works and Housing (PuSGeN 2018, 2019).
The plot of the remote-sensing inferred fault rupture from pre- The second fieldwork was conducted in 2020 January, supported by
vious studies (Socquet et al. 2019), the so-called PSN (Palukoro the JICA as part of the ‘Building Back Better Palu Region After
Sulawesi Neck) Fault (Bacques et al. 2020), is not confirmed by the 2018 Disaster’ (https://undpindonesia.exposure.co/palu-central
any morphological evidence on the multibeam bathymetry related -sulawesi-building-back-better).
to fault movements (Fig. 4b, and Fig. S2c, Supporting Information). We mapped fault ruptures and measured lateral and vertical off-
Similarly, its continuation on to the neck land is also not confirmed sets with measuring tapes, geological compass and hand-held GPS.
by fault-related landscapes as analysed from LiDAR DTM as well as Before, during, and after field surveys, we conducted visual inspec-
from field observations. Instead, we only found minor normal-fault tions of LiDAR DTM, DSM, and associated orthophoto using GIS
ruptures with a few tens of centimetres dip slip and less than 10 cm software. During the fieldwork, we also conducted an aerial survey2018 Mw 7.5 Palu earthquake ruptures 997
using a small UAV (Unmanned Aerial Vehicle) quadruple drone, en- and f, Supporting Information). Accordingly, the zone of predomi-
abling us to develop higher resolution orthophoto (i.e. ∼3 cm pixel nantly normal faults along the eastern margin also shifts westward
resolution) and DEM (Digital Elevation Model) as complementary to around the N-S ridge slope breaks. The massive liquefaction oc-
to the LiDAR data set. Hence, we have comprehensive documenta- curred in Sidondo around the alluvial fan’s toes that came from the
tion of fault ruptures, including associated horizontal and vertical mountain ridge (Fig. 6a, and Fig. S2f, Supporting Information).
offsets. The result is shown in Fig. 6(a). Larger scale maps are pro- From Skm33 to Skm45, the ruptures propagate through the
vided in Supporting Information (Figs S2e–h, e-Supplement 4 and 12 km NW-SE releasing fault bend, dominated by normal fault-
e-Supplement 5). To improve clarity, we put 1-km interval marks ing (Figs 6a, 7g and 8f and g, and Fig. S2g, Supporting Informa-
for the fault ruptures south of the Palu Beach with notation Skm1, tion). In two places between Skm 36–37 and Skm 40–41, secondary
Skm2, etc. strike-slip faults displaced the primary rupture zone left-laterally.
The fault ruptures run NNW-SSE to N-S across several alluvial Prominent normal fault scarps occurred from SKm33 to SKm40.
fans in the front of the slope breaks along the mountainous western The largest normal-dip slip occurred at Skm34–35 showing a verti-
edge. From the beach, Skm0, to Skm21, the ruptures mostly oc- cal displacement of 5 m (Figs 8f and g). Around Skm40, it spreads
curred in sharp fault lines with clear 4–6 m left-lateral slip as mea- into several branching splay faults that curve away from the main
sured from offsets of artificial structures, including roads, fences and strike anticlockwise as concordance with left-lateral shear move-
Downloaded from https://academic.oup.com/gji/article/224/2/985/5932272 by guest on 15 October 2021
house linings traces (e.g. Figs 7a–c and 8a–e, Table S1, Supporting ment. The curving fault splay is a classic feature of the so-called
Information). From Skm0, the rupture orientation is NNW-SSE, a horse-tail splay that commonly marks the endpoint of strike-slip
but from Skm8, it slightly swings westward and becomes almost fault in a brittle medium. On the eastern margin, the mountainous
N-S until Skm21. Massive liquefaction and landslide occurred in ridge front cutting by normal faults shifts westward again in corre-
Balaroa area between Skm2 and Skm3 (Figs 6a and 8k, and Fig. lation with the sudden turn of the fault-rupture around the northern
S2e, Supporting Information). The arcuate head scarps diameter is end of the fault bend between Skm34–35 (Fig. 6a, and Fig. S2g,
about 500 m, and the longitudinal length of the slide is ∼ 900 m. Supporting Information). From Skm45 southward, the fault rupture
The toes of the landslide lie right on the west side of fault ruptures. line swings back to the initial NNW-SSE orientation up to the end
Interestingly, the surface ruptures along the front of the toes did of the rupture around Skm67 at a 1.5-km wide restraining stepover
not occur as a single primary fault line like its north and south (Fig. 6a, and Figs S2g and h, Supporting Information).
sides but locally disperse into several lines within a few-hundred- We combined direct measurements of fault offsets in the field
metres zone. The Balaroa liquefaction zone occurred just next to and analyses from LiDAR orthophoto, DTM, DSM, mosaic aerial
the broad alluvial fan’s northern edge between Skm2–Skm10 (Fig. photographs and higher resolution DEM developed from UAV sur-
S2e, Supporting Information). Note that the liquefaction occurred veys (Table S1, Supporting Information). The existence of many
in the area of a housing estate; it is not associated with any irrigation human-made infrastructure alignments of (asphalt) roads, bricked
canal like in Sibalaya (Fig. 8l, e-Supplement 2) or a paddy field as fences, buildings and field-rice boundaries, which were cut by the
suggested to play a significant role in liquefaction (Bradley et al. fault ruptures, provide excellent markers for offset measurements
2019; Cummins 2019; Watkinson & Hall 2019). (Figs 7a–c and 8a–j).
Around Skm10, there is an ancient head scarp of comparable size, The left-lateral slip slightly decreases from Skm0 to Skm15, but
probably occurred during a previous earthquake event (Fig. 7d, and with a significant slip deficit between Skm7 and Skm12.5 (showing
Fig. S2e, Supporting Information). Hence, the previous liquefac- as a ‘trough’ in Fig. 6b), interestingly coincides with the location
tion and landslides did not occur at the same place; so, it might also of a massive ancient landslide in Sibedi (Fig. 6a, and Fig. S2e,
occur in different spots in the future. Hence, ascribing liquefaction Supporting Information). Fault slips are not pure strike-slip but
hazard zones for the future should take this evidence into account for are accompanied by dip-slip of a few tens of centimetres up to
further evaluations. Around Skm10–11, we mapped a very-straight 1 m, mostly east down. The significant dip-slip movement relates
fault scarp on alluvial plain hidden under heavy vegetations but to a prominent fault scarp with 10–20 m high around Skm10–
revealed on LiDAR DTM (Fig. 7d). The scarps’ height is between 11 (Fig. 7d). From Skm15 toward the south, the left-lateral slip
10–20 m with east-side down, testifying significant dip-slip move- steeply decreases, accompanied by a steady increase in dip slip.
ments. Around Skm17, there is a spectacular linear pressure ridge The increasing dip-slip concurs with the restraining stepover and
on the Holocene alluvial fan (Fig. 7e). Behind it are peculiar twin the westward shift of the fault-rupture strands onto the mountain
domes underlying by metamorphic rocks (schists). slope breaks at Skm22. Hence, the rate of vertical fault movement
From Skm21 to Skm25, the fault ruptures shift toward the exceeds the rate of erosions and sedimentations. The restraining
hill slope forming a 1-km wide restraining stepover. However, stepover also coincides with the trough of the left-lateral slip deficit
southward, the rupture shifted back toward the east, forming a (Fig. 6b).
smaller releasing stepover, accompanied by numerous normal fault- The left-lateral slip goes to zero at Skm34.6, coinciding with
ing (Fig. 7f). The fault lines rotate back to NNW-SSE direction, the maximum vertical displacement of ∼5 m around the fault bend
running along the slope breaks indicating a significant amount of (Figs 6, 7g and 8f and g). Large dip-slip sharply decreases south-
normal-dip slips (Fig. 6a, and Fig. S2f, Supporting Information). eastward and returns to the average background value at Skm37,
A minor releasing bend occurred around Skm27–28, accompanied coinciding with secondary strike-slip faults tearing the normal fault
by intensive extensional fractures and normal faulting on the east lines. Concurrently, the left-lateral slip picks up, reaches ∼2 m offset
side of the main rupture (Figs 6a and 7f, and Fig. S2f, Supporting at Skm37; it increases toward the southend of fault bend at SKm46
Information). From Skm28 southward to Skm32, the rupture line’s and continues southward along with the Saluki fault segments,
orientation slightly rotated back to a more northerly direction. In the culminating at Skm49 with ∼320 cm offset. From Skm49 south-
eastern margin, a significant landscape change occurred, where the ward, the left-lateral-slip gradually decreases to 100 cm at Skm66,
mountainous ridge shifted westward; hence, the Palu basin becomes before it disappears around Skm67 at a 1.5-km wide restraining
narrower from latitude Skm19 southward (Fig. 6a, and Figs S2e stepover.998 D.H. Natawidjaja et al.
5 T H E PA L U P U L L - A PA RT B A S I N propagation only reached 30 km away before being arrested (Fang
et al. 2019), which, according to our map, is the large 4.2-km wide
This study shows that the 2018 Palu earthquake occurred along
restraining stepover. The fact that the Donggala segment has high
the Palukoro left-lateral strike-slip fault with large releasing bends
asperities due to the transition between the extensional and compres-
resulting in prominent extensional tectonics. The vertical dip-slip
sional tectonic regimes allows the plausible pre-existing high-stress
component on the primary left-lateral faults and associated nor-
accumulation, and, thus, might lead to rupture nucleation with a
mal faults accommodate the extensional field (e.g. Figs 5c and d).
high-stress drop that generated the so-called supershear wave by
Besides, numerous normal faults trending N-S and NW-SE occur
previous studies (e.g. Socquet et al. 2019). There is a previous large
along the eastern margin, characterized by their linear fault scarps
strike-slip fault earthquake in 1968 (Mw 7.4) that also generated a
(Fig. 6a, e.g. Figs 7h and i). These normal faults are classified as
large tsunami and in 1998 (Mw 6.6), occurring on Palukoro Fault
potentially active faults since they deformed the Late-Pleistocene
just north of the Donggala segment (Prasetya et al. 2001; He et al.
sedimentary layers (Becker et al. 2005, Fig. 9). However, they might
2019), possibly on the Tanimbaya segment, which might contribute
not have moved in the Holocene period since the fault traces obscure
to increase the stress on the Donggala segment.
on the Holocene alluvium or inexistence. Hence, further studies are
The rupture propagated southward broke the submarine fault
required to evaluate their level of activity or slip rates (Fig. 8).
lines up-to 110-km passing the 3.5-km width releasing bend, dom-
Their black colour lines on the maps express this ambiguity, noted
Downloaded from https://academic.oup.com/gji/article/224/2/985/5932272 by guest on 15 October 2021
inated by normal faulting, before reaching the Palu Beach. Thus,
as potentially active faults (e.g. Fig. 4b, and Fig. S2a, Supporting
unlike previously thought, it implies that the long submarine fault
Information).
movements with significant dip-slip component could significantly
Nonetheless, part of the prominent N-S trending normal faults
contribute to the tsunami generation. Furthermore, the fault geom-
in the neck area ruptured during the 2018 earthquake, as observed
etry in the Palu Bay (Skm30–Skm0) is rather complicated, having
(Fig. 4b, and Figs S2c and d, Supporting Information). Bellier et al.
large releasing bend and fault bifurcations. Hence it acts as barri-
(2001) have dated the Late-Pleistocene sediment on the western
ers to the fast-southward rupture propagation. Thus, it could cause
margin using the cosmogenic dating by measuring in situ produced
10 higher ground shaking and intense deformations that trigger mas-
Be concentrations in quartz boulders exposed on top of old al-
sive submarine landslides and generate a large tsunami.
luvial fan surfaces. The dating yielded an age 125 ± 20 ka (kilo-
On land, the ruptures continued southward for almost 40 km
annum = thousand years ago) for the old fan (Qp in Fig. 9a), which
along mostly sharp or narrow fault zone before passing the large
indicates the time just after the highest sea level (MIS 5e). With a
7-km width releasing bend fault; then, it still propagated southward
similar method, they also dated the age of the young alluvial fan
for another 25 km. Hence, the 2018 earthquake subsequently rup-
(Qa). They yielded the age of 11 000 ± 2300 yr, which indicates that
tured the 177-km multifault segments bypassing large stepovers and
its emplacement was at the beginning of the Holocene right after
bends. Fault kinematics shows a primary left-lateral slip but accom-
the end of the Last Glacial Period. The (normal) faults interpreted
panied by a prominent 5–10 per cent dip-slip as had been generally
to deformed these two generations of the alluvial fans (Bellier et al.
predicted from InSAR and seismological data (Bao et al. 2019;
2001).
Fang et al. 2019). Our offset measurements reveal more details of
The normal fault assemblage on the eastern margin occurred
the offsets and interplay between left-lateral and dip-slip compo-
to accommodate the Palu pull-apart-basin subsidence associated
nent, particularly when passing the fault bend, where the dip-slip
with the sizeable releasing bend between the Palu and the Saluki
becomes dominant.
segments. In other words, normal faults are parts of the negative
According to the worldwide empirical relationships between the
flower structures (Harding 1985). The model of structural config-
rupture length and earthquake magnitude, a 177-km fault rupture is
uration is illustrated in Fig. 10(a). The cross-section across the
comparable to an average of Mw 7.7 (Wells & Coopersmith 1994),
Palu basin shows the asymmetric graben of the flower structures
so the Mw 7.5 Palu earthquake is below the average value. The
(Fig. 10b). Therefore, the normal faults may move accompanying
fact that the 2018 rupture propagated through two large fault seg-
the main earthquake event on the Palukoro fault producing smaller
ment’s releasing stepover, the 3.5-km width separation offshore and
earthquakes as the aftershocks. However, they may also rupture
the 7-km width separation on land, is essential to be noted. Ac-
independently in between the main event on the Palukoro Fault.
cording to data of 26 strike-slip earthquake worldwide bypassing
stepovers, only a small number could pass through the 3–4 km
stepover (Wesnousky 2006). None could continuously propagate
6 C O N C LU S I O N A N D D I S C U S S I O N S
through the stepover larger than 4-km wide. However, the postulate
Advanced remote-sensing technology, such as high-resolution satel- was based on the stepovers where the fault segments are not con-
lite images and InSAR, is powerful to produce information on earth- nected, not fault bends. In other words, the fault terminations posed
quake rupture zone and co-seismic displacements in an incredibly by Wesnousky (2006) may not apply to the fault (releasing) bends.
short time after the event. However, it could not cover all details, It is also important to note that the nucleation and termination of
particularly without a good knowledge of local geology. Our study the Palu 2018 rupture are both on the restraining stepovers, where
concludes that for the 2018 Palu earthquake rupture is nucleated the two segments are not connected. Thus, it seems that a fault bend
and then propagated along the pre-existing, underwater geological is less significant than a fault stepover (i.e. a complete separation of
fault lines, not on the immature, unmappable, or hidden fault that two fault segments) in prohibiting rupture propagations.
swings eastward to the Sulawesi neck, the so-called the PSN Fault The 2018 Palu rupture was determined to have ‘supershear’ speed
as previously interpreted (Bao et al. 2019; Fang et al. 2019; Socquet from the onset and persistently stable until the end (Bao et al. 2019;
et al. 2019). Fang et al. 2019). However, it is implausible to have been occurred
Our study suggests that the 2018 rupture nucleated near the centre on the buried, immature, undamaged fault zone (Bao et al. 2019).
of the Donggala segment. This rupture-nucleation spot fits perfectly Theoretically, the supershear rupture must occur on a straight and
with seismological data showing that in the first 8 s, the rupture smooth, mature fault zone (Bouchon et al. 2010; Das 2015). Our
propagated bilaterally northward and southward. The northward fault rupture map shows that the fault sections between major bends2018 Mw 7.5 Palu earthquake ruptures 999
Downloaded from https://academic.oup.com/gji/article/224/2/985/5932272 by guest on 15 October 2021
Figure 9. The upper figure is the map of normal faults trending N-S on the Talise beach in the eastern margin of the Palu depression. The lower figure is the
critical outcrop showing the normal faults cutting the Late-Pleistocene sediment layers (Qp) but is obscured on the Holocene alluvial (Qa), T-P = Tertiary and
Pre-Tertiary basement rocks. The location of the map is marked in Fig. 3 (Fig. S2d, Supporting Information).
are relatively simple and straight; hence, it favours the occurrence Therefore, the 2018 Palu supershear rupture is not so ‘super’ but
of the supershear. However, the fault discontinuities around seg- run at ∼4.1 km s−1 , just a little higher than the maximum local shear
mentation boundaries suggests significant asperities and barriers. wave velocity (3.4–3.8 km s−1 ). The 2018 rupture velocity is lower1000 D.H. Natawidjaja et al.
Downloaded from https://academic.oup.com/gji/article/224/2/985/5932272 by guest on 15 October 2021
Figure 10. (a) Schematic diagram of the Palu Pull-apart structures associated with the extra-large releasing bend. (b) Schematic profile along the X–Y line.
than Eshelby’s speed, the lower end of a stable supershear velocity (h) Detailed active fault/fault-rupture map from Skm52 to the end
(48–53 km s−1 , Bao et al. 2019; Fang et al. 2019). of the 2018 rupture around Skm67 at the 1.5 km width restraining
stepover.
Table S1. Data of the offset measurements along the 2018 Palu
S U P P O RT I N G I N F O R M AT I O N earthquake’s main rupture inland Palu Valley. The site locations are
marked in Figs S2e–h.
Supplementary data are available at GJ I online.
e-Supplement 1. Undersea faults.
Figure S1. Index map of the larger-scale active fault maps in Figs e-Supplement 2. Land movement.
S2a–h. e-Supplement 3. Northward notation KM.
Figure S2. (a) Results of active fault mapping based on visual e-Supplement 4. Fault rupture 2018 earthquake.
inspections of multibeam-bathymetry data around the Tanimbaya e-Supplement 5. Potentially active fault on land.
Peninsula area and plots of relocated epicentres of the 2018 main e-Supplement 6. Southward notation KM.
shock and aftershocks from Supendi et al. (2020). (b) Active fault
Please note: Oxford University Press is not responsible for the
map and plots of the relocated epicentres of the 2018 main shock and
content or functionality of any supporting materials supplied by
aftershocks in the area between Tanimbaya and Palu Bay. (c) Un-
the authors. Any queries (other than missing material) should be
derwater fault map in the northern part of the Palu Bay and plots of
directed to the corresponding author for the paper.
the relocated epicentres of the 2018 aftershocks. The grey dashed
line is the inferred fault ruptures deducted from InSAR analysis
from Socquet et al. (2019). Note that the InSAR’s fault line does
AC K N OW L E D G E M E N T S
not associate with any visible strike-slip fault traces on the swath
bathymetry and LiDAR data; Instead, it is associated with the ob- This study is funded by the CHL\R1\180173–GCRF grant from
served secondary normal-fault ruptures inland around Labuan. (d) The Royal Society, UK. The fieldworks were supported and fa-
Detailed subaqueous active fault map in the Palu Bayfront mapped cilitated by The National Center for Earthquake study (PuSGeN),
from high-resolution bathymetry coupled with 2-D seismic reflec- Japan International Cooperation Agency (JICA), the Ministry of
tion profiles. (e) Inland 2018 fault ruptures and active fault map in Public Works, and Its Special Task Force for Palu Rehabilitation
the central Palu City area from 0-km to Skm16, plotted on LiDAR and Reconstructions, and the Central Sulawesi Province and Palu-
DTM together with the relocated aftershock’s epicentres (i.e. ab- City local governments. We are also grateful to The Agency of
sence). (f) Detailed Active fault/fault-rupture map in the southern Geospatial Information (BIG) to develop and share the LiDAR data
part of Palu City from Skm16 to Skm32, together with the plots set. We thank all the Baruna Jaya 1 marine cruise crews and the
of relocated aftershock’s epicentres. (g) Detailed active fault/fault- NUS-IATsI team for their hard works and sharing the bathymetry
rupture map around the large releasing fault bend structure, from data. We thank JICA for providing the seismic reflection data set
Skm32 to Skm50 in the southernmost part of the Palu depression. and supporting the post-processing analysis. Finally, we appreciate2018 Mw 7.5 Palu earthquake ruptures 1001
Hiroyuki Tsutsumi and Timothy Henstock for their thorough and He, L., Feng, G., Li, Z., Feng, Z., Gao, H. & Wu, X., 2019. Source parameters
critical reviews in improving the manuscript. and slip distribution of the 2018 Mw 7.5 Palu, Indonesia earthquake
DHN is the main contributor in conceptualization, methodology, estimated from space-based geodesy, Tectonophysics, 772, 228216.
investigation, formal analysis, writing—original draft and visual- Heidarzadeh, M., Muhari, A. & Wijanarto, A.B., 2019. Insights on the source
of 28 Septemberr 28 2018 Sulawesi Tsunami, Indonesia based on spectral
ization. MRD and ARP led the fault analysis based on field obser-
analyses and numerical simulations, Pure appl. Geophys., 176(1), 25–43.
vations, LiDAR, orthophoto and bathymetry data, and assisted visu-
King, G.C.P. & Wesnousky, S.G., 2007. Scaling of fault parameters for
alization. GP, PL, U and NDH conducted the multibeam bathymetry continental strike-slip earthquake, Bull. seism. Soc. Am., 97(6), 1833–
survey and provided the DEM data. WT conducted advanced pro- 1840.
cessing and helped interpretations of the seismic-reflection data. Liu, P.L.F., Higuera, P., Husrin, S., Prasetya, G.S., Prihantono, J., Diastomo,
PS conducted relocations of the 2018 pre-shocks, main shocks and H., Pryambodo, D.G. & Susmoro, H., 2020. Coastal landslides in Palu
aftershocks and provided the data. LF, MI and ST help organize and Bay during 2018 Sulawesi earthquake and tsunami, Landslides, 17(9),
facilitate fieldwork. All authors participated in field surveys and 2085–2098.
contributed to developing and editing the manuscript. Muhari, A., Imamura, F., Arikawa, T. & Afriyanto, B., 2018. Finding of
the Unexpected Tsunami due to the Strike-Slip Fault at Central Sulawesi,
Indonesia28 Septemberr 28 2018, from the Preliminary Field Survey at
Palu, Tohoku Universty, Japan.
Downloaded from https://academic.oup.com/gji/article/224/2/985/5932272 by guest on 15 October 2021
REFERENCES Muhari, A., Imamura, F., Arikawa, T., Hakim, A.R. & Afriyanto, B., 2018.
Bacques, G., de Michele, M., Foumelis, M., Raucoules, D., Lemoine, A. & Solving the puzzle of the September 2018 Palu, Indonesia, Tsunami mys-
Briole, P., 2020. Sentinel optical and SAR data highlights multi-segment tery: clues from the Tsunami waveform and the initial field survey data,
faulting during the 2018 Palu-Sulawesi earthquake (Mw 7.5), Sci. Rep., J. Disaster Res., 13, sc20181108–sc20181108,.
10(1), 1–11,. Patria, A. & Putra, P.S., 2020. Development of the Palu–Koro Fault in NW
Bao, H., Ampuero, J.-P., Meng, L., Fielding, E.J., Liang, C., Milliner, C.W.D., Palu Valley, Indonesia, Geosci. Lett., 7(1), 1–11,.
Feng, T. & Huang, H., 2019. Early and persistent supershear rupture of Prasetya, G.S., de Lange, W.P. & Healy, T.R., 2001. The Makassar Strait
the 2018 magnitude 7.5 Palu earthquake, Nat. Geosci., 12(3), 200–205. tsunamigenic region, Indonesia, Nat. Hazards, 24, 295–307.
BAPPENAS, and Central-Sulawesi-Local-Government, 2018. Rehabilita- Puntodewo, S.S.O. et al., 1994. GPS measurement of crustal deformation
tion and Reconstruction in Palu Area After the 2018 Earthquake (Pemuli- within the Pacific-Australia plate boundary Zone in Irian Jaya, Indonesia,
han dan Pembangunan Kembali Wilayah Pasca Bencana Provinsi Su- Tectonophysics, 237, 3-4, 141–153,.
lawesi Tengah), BAPPENAS (National Agency for Planning and Devel- PuSGeN, 2018. Post-event Studies of The 28 September 2018 Earthquake
opment). in Palu, Central Sulawesi (Kajian Gempa Palu Provinsi Sulawesi Tengah,
Becker, J., Saunders, W. & Van Dissen, R.J., 2005. Planning for The Devel- 28 September 2018 (M7.4)), Pusat Perumahan dan Pemukiman, Balitbang
opment of Land on or close to Active Faults: A Study of the Adoption and PU.
Use of the Active Fault Guidelines, GNS, New Zealand. PuSGeN, 2019. Progress Report of Post-2018 earthquake Studies forf Map-
Bellier, O. et al., 2001. High slip rate for a low seismicity along the Palu-Koro ping The Palukoro Fault Hazard Zone (Laporan Pemetaan Zona Rawan
active fault in central Sulawesi, Indonesia, Terra Nova, 13, 463–470. Bencana Sesar Palukoro Pasca Gempa P28 Septemberr 28 2018), Center
Bock, Y., Prawirodirdjo, L., Genrich, J.F., Stevens, C.W., McCaffrey, R., For Research And Development For Housing, Agency for Research and
Subarya, C., Puntodewo, S.S.O. & Calais, E., 2003. Crustal motion in Development, Ministry of Public Works and Housing.
Indonesia from Global Positioning System measurements, J. geophys. Shaw, J.H. & Suppe, J., 1996. Earthquake hazards of active blind-thrust
Res.: Solid Earth, 108(B8), 2367–2389. faults under the central Los Angeles basin, California, J. geophys. Res.:
Bouchon, M. et al., 2010. Faulting characteristics of supershear earthquakes, Solid Earth, 101(B4), 8623–8642.
Tectonophysics, 493(3), 244–253. Sieh, K. & Natawidjaja, D., 2000. Neotectonics of the Sumatran fault, In-
Bradley, K. et al., 2019. Earthquake-triggered 2018 Palu Valley landslides donesia, J. geophys. Res., 105(B12), 28,295–228,326.
enabled by wet rice cultivation, Nat. Geosci., 12(11), 935–939. Silver, E.A., McCafrey, R. & Smith, R.B., 1983. Collision, rotation, and the
Burbank, D.W. & Anderson, R.S., 2001. Tectonic Geomorphology, Black- initiation of the subduction in the evolution of the Sulawesi, Indonesia, J.
well Science, Inc., p. 273. geophys. Res.: Solid Earth, 88(B11), 9407–9418.
Carvajal, M., Araya-Cornejo, C., Sepúlveda, I., Melnick, D. & Haase, J.S., Socquet, A., Hollingsworth, J., Pathier, E. & Bouchon, M., 2019. Evidence
2019. Nearly instantaneous tsunamis following the Mw 7.5 2018 Palu of supershear during the 2018 magnitude 7.5 Palu earthquake from space
earthquake, Geophys. Res. Lett., 46(10), 5117–5126. geodesy, Nat. Geosci., 12(3), 192–199.
Charlton, T.R., 2000. Tertiary evolution of the eastern Indonesia collision Socquet, A., Simons, W., Vigny, C., McCafrey, R., Subarya, C., Sarsito,
complex, J. Asian Earth Sci., 18, 603–631. D., Ambrosius, B. & Spakman, W., 2006. Microblock rotations and fault
Cummins, P.R., 2019. Irrigation and the Palu landslides, Nat. Geosci., 12, coupling in SE Asia tripple junction (Sulawesi, Indonesia) from GPS and
881–882. earthquake slip vector data, J. geophys. Res., 111, B8,.
, ed. Das, S. & Ansal, A., 2015. Supershear earthquake ruptures—theory, Song, X., Zhang, Y., Shan, X., Liu, Y., Gong, W. & Qu, C., 2019. Geodetic
methods, laboratory experiments and fault superhighways: An update, in observations of the 2018 Mw 7.5 Sulawesi earthquake and its implications
Perspectives on European Earthquake Engineering and Seismology, vol. for the kinematics of the Palu fault, Geophys. Res. Lett., 46(8), 4212–4220.
39, Geotechnical, Geological and Earthquake Engineering. Stevens, C. et al., 1999. Rapid rotations about a vertical axis in a collisional
Fang, J., Xu, C., Wang, S., Xu, G., Zhao, Y. & Yi, L., 2019. The 2018 Mw 7.5 setting revealed by the Palu fault, Sulawesi, Indonesia, Geeophys. Res.
Palu earthquake: a supershear rupture event constrained by InSAR and Lett., 26, 2677–2680.
broadband regional seismograms, Remote Sens., 11(11), 1330–1345,. Supendi, P. et al., 2020. Relocated aftershocks and background seismicity
Frederik, M.C.G. et al., 2019. First results of a bathymetric survey of in eastern Indonesia shed light on the 2018 Lombok and Palu earthquake
Palu Bay, Central Sulawesi, Indonesia following the Tsunamigenic Earth- sequences, Geophys. J. Int., 221, 1845–1855.
quake28 Septemberr 28 2018, Pure appl. Geophys., 176(8), 3277–3290. Valkaniotis, S., Ganas, A., Tsironi, V. & Barberopoulou, A., 2018. A Pre-
Gusman, A., et al., 2019. Source model for the Tsunami inside Palu bay liminary Report on the M7.5 Pau Earthquake Co-seismic Ruptures and
following the 2018 Palu earthquake, Indonesia, Geophys. Res. Lett, 46, Landslides using Image Correlation Techniques on Optical Satellite Data,
15, 8721–8730,. EMSC.
Harding, T.P., 1985. Seismic characteristics and identifications of negative Walpersdorf, A., Vigny, C., Subarya, C. & Manurung, P., 1998. Monitoring
flower structures, positive flower structures, and positive structural inver- of the Palu-Koro fault (Sulawesi) by GPS, Geophys. Res. Lett., 25, 2313–
sion, Bull. Am. Assoc. Petrol. Geol., 69(4), 582–600. 2316.You can also read