Automated Methods for Detection and Classification Pneumonia based on X-Ray Images Using Deep Learning - arXiv
←
→
Page content transcription
If your browser does not render page correctly, please read the page content below
Automated Methods for Detection and Classification Pneumonia based on
                X-Ray Images Using Deep Learning
                        Khalid EL ASNAOUI1, Youness CHAWKI2, Ali IDRI1, 3
        1
            Complex system engineering and human system, Mohammed VI Polytechnic University
                                          Benguerir, Morocco
                     2
                       Moulay Ismail University, Faculty of Sciences and Techniques
                                          Errachidia, Morocco
    3
     Software Project Management Research Team, ENSIAS, University Mohammed V in Rabat,
                                           Morocco

                khalid.elasnaoui@um6p.ma, youness.chawki@gmail.com, ali.idri@um6p.ma

  Abstract: Recently, researchers, specialists, and companies around the world are rolling out deep
learning and image processing-based systems that can fastly process hundreds of X-Ray and
computed tomography (CT) images to accelerate the diagnosis of pneumonia such as SARS, COVID-
19, and aid in its containment. Medical images analysis is one of the most promising research areas, it
provides facilities for diagnosis and making decisions of a number of diseases such as MERS,
COVID-19. In this paper, we present a comparison of recent Deep Convolutional Neural
Network (DCNN) architectures for automatic binary classification of pneumonia images based fined
tuned versions of (VGG16, VGG19, DenseNet201, Inception_ResNet_V2, Inception_V3, Resnet50,
MobileNet_V2 and Xception). The proposed work has been tested using chest X-Ray & CT dataset
which contains 5856 images (4273 pneumonia and 1583 normal). As result we can conclude that fine-
tuned version of Resnet50, MobileNet_V2 and Inception_Resnet_V2 show highly satisfactory
performance with rate of increase in training and validation accuracy (more than 96% of accuracy).
Unlike CNN, Xception, VGG16, VGG19, Inception_V3 and DenseNet201 display low performance
(more than 84% accuracy).
  Keywords: Pneumonia, Coronavirus, COVID-19, Image Processing, Deep Learning.

I. Introduction
Throughout history, epidemics and chronic diseases have claimed the lives of many people and
caused major crises that have taken a long time to overcome. To describe a disease within populations
that arise over a specific period of time, two words are used epidemic and outbreak (Obrane et al.,
2017; CDCP, 2012). Indeed, we can define epidemic as the occurrence of more cases of illnesses,
injury or other health condition than expected in a given area or among a specific group of persons
during a particular period. Mostly, the cases are pretending to have a common cause (CDCP, 2012).
The outbreak is distinguished from an epidemic as more localized, or the term less likely to evoke
public panic.
Past epidemics include pneumonia. The pneumonia is an infection of the lungs most often caused by a
virus or bacteria. More specifically, the infection affects the pulmonary alveoli, the tiny balloon-
shaped sacs at the end of the bronchioles (see figure 1). It usually affects only one of the 5 lobes of the
lung (3 lobes in the right lung and 2 in the left), hence the term lobar pneumonia. When pneumonia
also reaches the bronchial tubes, it is called "Bronchopneumonia". It is the most important cause of
death in the world for children younger than 5 years (about 12.8% of annual deaths) (PERCH, 2019;
Liu et al., 2016). It is also a leading cause of morbidity and mortality in adults worldwide and in
particular in China (Tian et al., 2020; Prina et al., 2015; Welte et al., 2012).Pneumonia is the third
leading cause of death in Japan with a higher mortality rate for the elderly, particularly among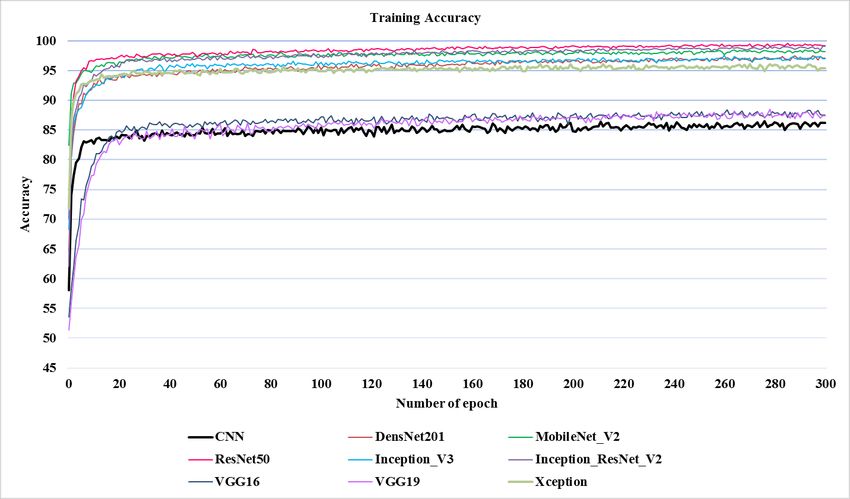
individuals ≥80 years old (Kondo et al., 2017). Excluding lung cancer, in Portugal, Pneumonia is the
huge cause of respiratory death (Hespanhol and Barbara, 2017).

                                       Fig. 1: Pneumonia Diagram

Several Coronavirus have passed over the species barrier to cause deadly pneumonia in humans since
the beginning of the 21st century. To know the pathogenesis of these deadly epidemics, the specialists
have to examine the structure of the viruses and the mechanism of infection. This allows them to help
elucidate and provide information for the development of effective treatment and possibly vaccines
(Yang et al., 2020). Here, we will provide a brief summary of the epidemiology and history of type of
Coronavirus in particular: SARS, MERS and Covid-19. Table 1 shows the major pandemics that have
occurred over time:
Table1: Major pandemics that have occurred over time
          Name                   Time            Type/Pre-human host                   Death toll
                                period
Antonine Plague                 165-180       Believe to either smallpox or                5M
                                              measles
Japanese          smallpox      735-737       Variola major virus                          1M
epidemic
Prague of Justinian             541-542       Yersinia pestis bacteria/Rats,             30-50M
                                              fleas
Black death                    1347-1351      Yersinia pestis bacteria/Rats,              200M
                                              fleas
New World Smallpox               1520-        Variola major virus                         56M
Outbreak                        onwards
Great Plague of London           1665         Yersinia pestis bacteria   / Rats,         100 000
                                              fleas
Italian plague                 1629-1631      Yersinia pestis bacteria   / Rats,           1M
                                              fleas
Cholera Pandemics 1-6          1817-1923      V. cholerae bacteria                         1M+
Third Plague                     1985         Yersinia pestis bacteria   / Rats,           12M
                                              fleas                                  (China and India)
Yellow Fever                   Late 1800s     Virus / Mosquitos                    100 000-150 000 (US)
Russian Flu                    1889-1890      Believed to be H2N2        (avian             1M
                                              origin)
Spanish Flu                    1918-1919      H1N1 virus / Pigs                          40-50M
Asian Flu                      1957-1958      H2N2 virus                                  1.1M
Hong Kong Flu                  1968-1970      H3N2 virus                                   1M
HIV/AIDS                         1981-        Virus / Chimpanzees                        25-35M
Present
Swine Flu                     2009-2010      H1N1 virus / Pigs                          200 000
SARS                          2002-2003      Coronavirus / Bats, Civets                   774
Ebola                         2014-2016      Ebolavirus / Wild animals                   11 000
MERS                            2015-        Coronavirus / Bats, Camels                   850
                               Present
Covid-19                        2019-        Coronavirus –                       34,845 (as of Mar 28,
                               Present       Unknown (possibly Bats or                  2020)
                                             pangolins)

SARS-Cov (Severe Acute Respiratory Syndrome Coronavirus) (Drosten et al., 2003; Ksiazek et al.,
2003) is an acute respiratory illness caused by a coronavirus, characterized by fever, coughing,
breathing difficulty, and usually pneumonia. SARS It appeared first time in China exactly in the
province of Guangdong in 2002 and spread to the world through airtravel routes. Approximately 8098
people were affected, causing in 774 deaths (Walls et al., 2020; Roussel et al., 2020; Wit et al., 2016)
with a lethal rate about 10% (Wu et al., 2020). It is suggested to originate from bats (Walls et al.,
2020; Hu et al., 2017). SARS symptoms are usually same to flu symptoms: fever, chills, muscle
aches, headache and occasionally diarrhoea. After about one-week, other symptoms appear like fever
of 38°C or higher, dry cough, breath shortness (Wu et al., 2020).
MERS-Cov (Middle East Respiratory Syndrome Coronavirus) a viral respiratory illness caused by a
virus (WHO, 2018). First, it was appeared in the Middle East and exactly Saudi Arabia in 2012 (Van
Boheemen et al., 2012, Zaki et al., 2012). Other cases were identified in Jordan (Hijawi, 2013), Qatar
(Farooq et al., 2020) then spread to the world. MERS is a zoonotic virus that can be transmitted
between animals and people. Indeed, the World Health Organization has confirmed that humans are
affected because they were on contact with affected dromedary camels (WHO, 2019; Mohd et al.,
2016; Azhar et al., 2014). Studies have shown that how the virus is transmitted from animals to
humans is not yet understood, and also the human-to-human transmission is very limited unless there
is close contact (WHO, 2018; Ki, 2015; Oboho et al., 2015). The different MERS symptoms are as
follows: Fever, Cough (Dry, Productive), Shortness of breath, Diarrhea, Myalgia, Headache, Nausea,
Vomiting, Abdominal pain, Chest pain, Sore throat, Haemoptysis (Farooq et al., 2020; Wang et al.,
2019; Baharoon et Memish, 2019; Al-Omari et al., 2019; WHO, 2018; Aguanno et al., 2018). The
world is currently experiencing a dangerous viral epidemic caused by a virus that has killed tens of
thousands of people. This new virus called Covid-19 was identified in Wuhan, China in December
2019 (Guo et al., 2020; Lippi et al. 2020; Amrane et al., 2020; Cortegiani et al., 2020; Tian et al.,
2020; Tang et al., 2020; Faralli et al., 2020; Wilder-Smith et al., 2020; Driggin et al. 2020; Cheng et
al., 2020; Pung at al., 2020; Zhang et al., 2020; El Zowalaty and Järhult, 2020). It belongs to the
Corona family of viruses, but it is more deadly and dangerous than the rest of the coronaviruses (Li et
al., 2020; WHO, 2020). First cases of the disease have been related to a live animal seafood market in
Wuhan, denoting to a zoonotic origin of the epidemic (Kandel et al., 2020; Sun et al., 2020; El
Zowalaty and Järhult, 2020; Wilder-Smith et al., 2020; Roosa et al., 2020; CNHC, 2020). The routes
of transmission, treatments, and results of Covid-19 continually receiving much research attention in
the world (Guo et al., 2020). Indeed, researchers have identified three main modes of the virus
transmission: close person-to-person contact, aerosol transmission and transmission by touch. (Yang
et al., 2020; Lu et al., 2020; Li et al., 2020; Liu et al., 2020). What makes the Corona virus very
dangerous is that it can have up to two weeks of incubation without symptoms. We can cite the
symptoms of Covid-19: high fever, dry cough, tiredness, shortness of breath, aches and pains, sore
throat and very few people will report diarrhoea, nausea or a runny nose (Simcock et al., 2020; Yang
et al., 2020; WHO, 2020).
As the number of patients infected by this disease increases, it turns out to be increasingly hard for
radiologists to finish the diagnostic process in the constrained accessible time (Zhang et al., 2011).
Medical images analysis is one of the most promising research areas, it provides facilities for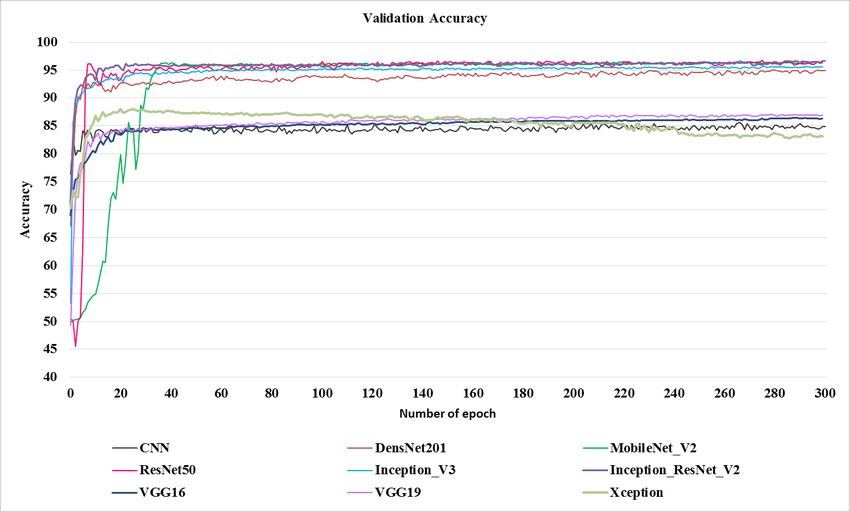
diagnosis and making decisions of a number of diseases such as MERS, COVID-19. Recently, many
efforts and more attention are paid to imaging modalities and DL in pneumonia. Therefore,
interpretation of these images requires expertise and necessitates a several algorithms in order to
enhance, accelerate and make an accurate diagnosis. Following this context, DL algorithms (Bhandary
et al., 2020) have obtained better performance in the detection of pneumonia, and demonstrated high
accuracy compared with previous state of the art methods. Motivated by the fastest and accurate
detection rate of pneumonia using deep learning (DL), our work is going to present a comparison of
recent Deep Convolutional Neural Network (DCNN) architectures for automatic binary classification
of X-Ray images between normal and pneumonia in order to answer to the following research
question: Is there any Deep Learning techniques which distinctly outperforms other DCNN
techniques?
The contributions of our paper are as followings: (1) We design fined tuned versions of (VGG16,
VGG19, DenseNet201, Inception_ResNet_V2, Inception_V3, Xception, Resnet50, and
MobileNet_V2), (2) To avoid overfitting in our models, we used weight decay and regularizers that
are provided under keras and have the name L2. Our models have been tested on the chest X-Ray &
CT dataset (Kermany et al., 2018) for binary classification.
The remainder of this paper is organized as follow. Section 2 deals with some related work. In Section
3, we describe our proposed methods. Section 4 presents some results obtained using our proposed
models and interpreting the results. The conclusion is given in the last section.

II. Related works
To make a very good diagnosis and to detect the source of the problems of the diseases and in an
oppurtum time remains a major challenge for the doctors in order to reduce the sufferings of the
patients. Indeed, the use of image processing and deep learning algorithms in the analysis and
processing of biomedical images has given very satisfactory results. In this section, a brief review of
some important contributions from the existing literature is presented.
Pneumonia remains one of the diseases that is increasingly becoming research hotspots in recent
years. Indeed, Toğaçar et al. (Toğaçar et al., 2019) used the lung X-ray images. They employed the
convolutional neural network as feature extractor and used some existing convolutional neural
network models like AlexNet, VGG-16 and VGG-19 to realize a specific task. The number of deep
features was reduced using of deep features was reduced for each deep model. Then a step of
classification was done using decision tree, KNN, linear discriminant analysis, linear regression, and
SVM. The obtained results showed that the deep features provided robust and consistent features for
pneumonia detection.
In (Liang and Zeng, 2020), Liang and Zeng have proposed a new deep learning framework to classify
child pneumonia image bay combining residual thought and dilated convolution. To overcome the
over-fitting and the degradation problems of the depth model and the problem of loss of feature space
information caused by the increment in depth of the model the proposed method used the residual
structure and dilated convolution respectively.
The work presented in (Jaiswal et al., 2019) proposes a deep learning-based method to identify and to
localize the pneumonia in Chest X-Rays images. The identification model is based on Mask-RCNN
that can incorporate global and local features for pixel-wise segmentation. Good performances
evaluated on chest radiograph dataset showed the effectiveness and robustness of the model.
The investigation of post-stroke pneumonia prediction models using advanced machine learning
algorithms, specifically deep learning approaches has been presented in (Ge et al., 2019). Indeed,
authors have used the classical methods (logistic regression, support vector machines, extreme
gradient boosting) and have implemented methods based on multiple layer perceptron neural
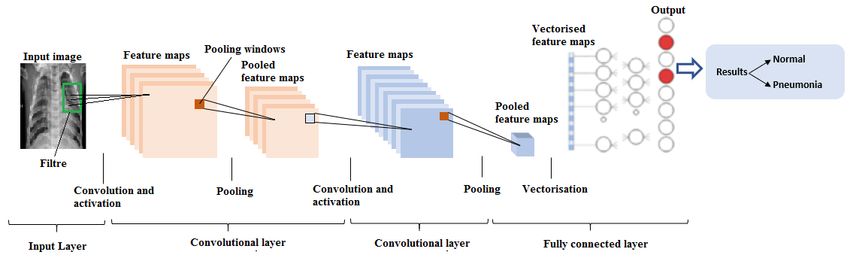
networks and recurrent neural network to make use of the temporal sequence information in electronic
health record systems. The obtained results showed that the deep learning-based predictive model
achieves the optimal performance compared to many classic machine learning methods.
In (Sirazitdinov et al., 2019), authors have proposed an automated detection and localization method
of pneumonia on chest x-ray images using machine learning solutions. They presented two
convolutional neural networks (RetinaNet and Mask R-CNN). The proposed method was validated on
a dataset of 26,684 images from Kaggle Pneumonia Detection Challenge and the obtained results
were satisfactory.
Bhandary et al. (Bhandary et al., 2020) have proposed a Deep Learning framework for examining
lung pneumonia and cancer. Indeed, they proposed two different deep learning techniques: the first
one was Modified AlexNet. It was intended to classify chest X-Ray images into normal and
pneumonia class using Support Vector Machine and its performance were validated with other pre-
trained deep learning (AlexNet, VGG16, VGG19 and ResNet50). Whereas the second one
implemented a fusion of handcrafted and learned features in the MAN for improving classification
accuracy during lung cancer assessment.
The work presented in (Behzadi-khormouji et al., 2020) presents a method that can detect
consolidations in chest x-ray radiographs using Deep Learning especially Convolutional Neural
Networks assisting radiologist for better diagnosis. Authors have used a Deep Convolutional Neural
Network pre-trained with ImageNet data to improve the accuracy of the models. Then, to enhance the
generalization of the models, they proposed three-step pre-processing approach.
When we use DL and image processing, especially in medical imaging, a natural question arises: how
we use this DL, and which is the best architecture of DL will be used? Following the context of X-
Ray images classification, we present a comparison of recent Deep Convolutional Neural Network
(DCNN) architectures for automatic binary classification based fined tuned versions of (CNN,
VGG16, VGG19, DenseNet201, Inception_ResNet_V2, Inception_V3, Xception, Resnet50, and
MobileNet_V2).

III. Proposed contributions
Deep Learning (DL) methods have recently demonstrated huge potential with state-of-the-art
performance on image processing and computer vision (Alom et al., 2018). These techniques have
been applied in various modalities of medical imaging with high performance in segmentation,
detection, and classification (Litjens et al., 2017). Some DL methods incorporate skin cancer
detection, breast cancer detection, and classification, lung cancer detection, etc. Despite the fact
that these methods have shown huge achievement in terms of success in medical imaging, they
require a large amount of data, which is as yet not available in this field of applications. Following the
context of no availability of medical imaging dataset, our work is going to fine-tuned (Transfer
learning (Bhandary et al. 2020))) the top layer of the following DL architectures (CNN, VGG16,
VGG19, DenseNet201, Inception_ResNet_V2, Inception_V3, Xception, Resnet50, and
MobileNet_V2) and compare between them their performances.

 III.1. Proposed baseline CNN architecture

Generally, a CNN model consists of five layers which are: input layer, convolutional layers, pooling
layers, full-connection layers, and output layer (Figure 2). Moreover, it is known that CNN model is
can be trained end-to-end in order to allow the feature extraction and selection, finally, classification
or prediction. How the network understands an image or process the image is difficult, but it is known
that features obtained in different layers of a network works better than human built features (Ouhda
et al., 2019).
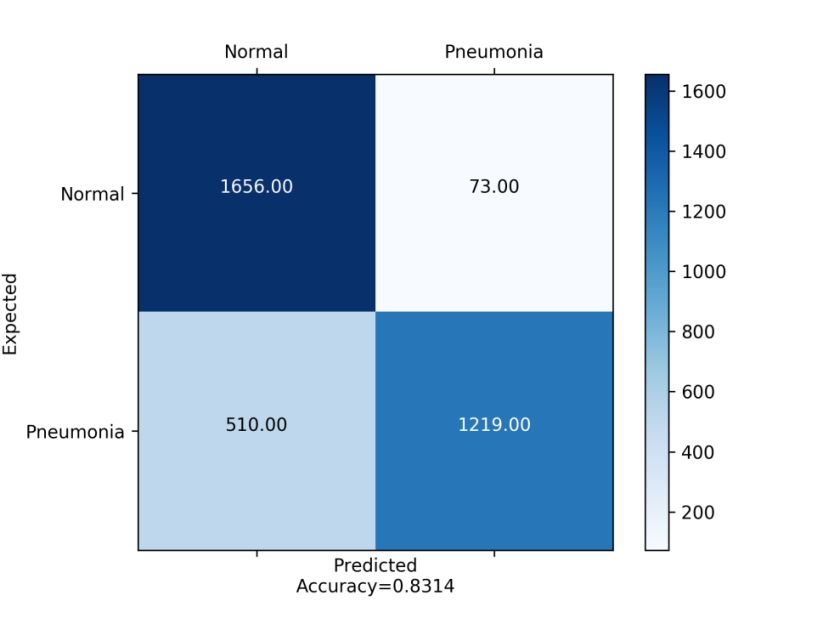
Fig. 2. Main architecture of our baseline CNN
The proposed baseline CNN for our experiment has the following architecture:
Input layer: In our experiment the inputs are X-Ray images. The parameters are defining the
image dimension (244x244).
Convolutional layers: a convolution is a linear operation that consists on the multiplication of
a set of weights with the input. It's designed for two-dimensional input; the multiplication is
performed between a two-dimensional array of weights (filters) and an array of input data. In
the proposed architecture we have 3 layers with a filter of size 3x3 and zero padding.
Pooling Layers: Pooling layers is a technique to down sample feature maps by summarizing
the presence of features in patches of the feature map. There is two type of pooling methods
that are average pooling and max pooling. In the proposed architecture we used Max pooling
in order to calculate the maximum value in each patch for every feature map. The max
pooling is set to 2x2 with a stride of 2.
ReLU layers: we have used 4 ReLU layer for each convolutional layer
Inner-product layers or fully connected layers: Treats the input data as a simple vector and
produce an output as a single vector. We have one inner-product layer in this model. The last
one, a fully connected output layer with sigmoid activation.
III.2. Deep Learning architectures
Deep learning architectures is highly used for the diagnosis of pneumonia since 2016 (Bhandary et al.
2020; Kermany et al. 2018), the most investigated DL techniques are VGG16, VGG19, Inception_V3,
DenseNet201, Xception, Resnet50, Inception ResnetV_2, and MobileNet_V2. We have chosen these
8 techniques due to the high result and accuracies they offer.
VGG16 and VGG19
Proposed on 2014 by Simonyan and Zisserman VGG (Visual Geometry Group) is a convolution
neural net (CNN) architecture and used to win ILSVR(ImageNet) competition in 2014 (K. Simonyan
and A. Zisserman, 2014). The major characteristic of this architecture is instead of having a large
number of hyperparameters, they concentrated on simple 3×3 size kernels in convolutional layers and
2×2 size in max pooling layers. In the end, it has 2 FC (Fully Connected layers) trailed by a softmax
for output. The most familiar VGG models are VGG16 and VGG19 which include 16 and 19 layers,
respectively. The difference between VGG-16 and VGG-19 is that VGG-19 has one more layer in
each of the three convolutional blocks (Zhang et al., 2019.)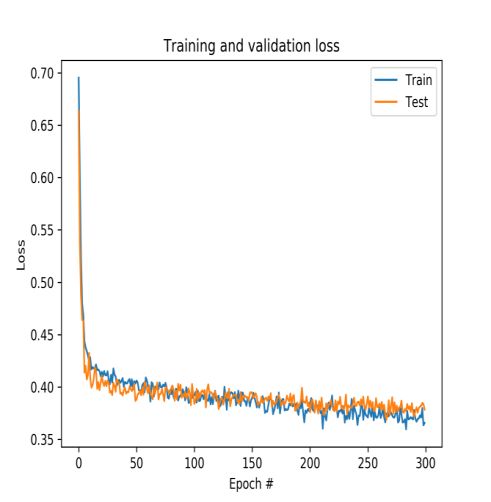
Inception_V3

Inception models are a type on Convolutional Neural Networks developed by Szegedy on 2014
(Szegedy et al., 2014). The inception models differ from the ordinary CNN in the structure where the
inception models are inception blocks, that means lapping the same input tensor with multiple filters
and concatenating their results. Inception_V3 is new version of inception model presented for the first
time on 2015 (Szegedy et al., 2015). It is an improved version of inception_V1 and inception_V2 with
more parameters. Indeed, it has block of parallel convolutional layers with 3 different sizes of filters
(1x1, 3x3, 5x5). Additionally, 3×3 max pooling is also performed. The outputs are concatenated and
sent to the next inception module.

Resnet 50

Resnet50 is a deep residual network developed by (He at al., 2016) and is a subclass of convolutional
neural networks used for image classification. It is the winner of ILSVRC 2015. The principal
innovation is the introducing of the new architecture network-in-network using residual layers. The
Renset50 consists of five steps each with a convolution and Identity block and each convolution block
has 3 convolution layers and each identity block also has 3 convolution layers. Resnet50 has 50
residual networks and accepts images of 224 × 224 pixels.

Inception_Resnet_V2

Inception-ResNet-v2 is a convolutional neural network that is trained on more than a million images
from the ImageNet database (Szegedy et al., 2016). It is a hybrid technique combining the inception
structure and the residual connection. The model accepts images of 299×299 image, and its output
is a list of estimated class probabilities. The advantages of Inception ResnetV2 are converting
inception modules to Residual Inception blocks, adding more Inception modules and adding a new
type of Inception module (Inception-A) after the Stem module.

Densenet201

DenseNet201 (Dense Convolutional Network) is a convolutional neural network that is 201 layers
deep and accepts an image input size of 224 × 224 (Huang et al., 2018). DenseNet201 is an
improvement of ResNet that includes dense connections among layers. It connects each layer to every
other layer in a feed-forward fashion. Unlike traditional convolutional networks with L layers that
have L connections, DensNet201 has L(L+1)/ 2 direct connections. Indeed, compared to traditional
networks, DenseNet has can improve the performance by increasing the computation requirement,
reducing the number of parameters, encouraging feature reuse and reinforcing feature propagation.

MobileNet_V2

MobileNet_V2 (Sandler et al., 2018) is a convolutional neural network and an improved version of
MobileNetV1 and is made of only 54 layers and has an image input size of 224 × 224. Its main
characteristic is instead of performing a 2D convolution with a single kernel, instead of performing a
2D convolution with a single kernel uses depthwise separable convolutions that consists in applying
two 1D convolutions with two kernels. That means, less memory and parameters required for training
and small and efficient model. We can distinguish two types of blocks: first one is residual block with
stride of 1, second one is block with stride of 2 for downsizing. For each block, there are layers: the
first layer is 1×1 convolution with ReLU6, the second layer is the depthwise convolution and the third
layer is another 1×1 convolution but without any non-linearity.
Xception

Xception, presented by Chollet (Chollet, 2017), is a convolutional neural network that is 71 layers
deep. It is an improved version of Inception architecture and involves depthwise deparable
convolutions. More precisely, Xception replaces the standard Inception modules with depthwise
separable convolutions. It showed good results compared to VGG16, Resnet and Inception in classical
classification problems. Xception has an image input size of 299x299.

IV. Experimental results and analysis
We implemented our contributions for automatic binary classification on a new publicly available
image dataset (chest X-Ray & CT dataset). As it can be observed in Figure 3 which shows the
diagram of the main proposed contributions, the entire contributions are mainly divided into three
steps: data acquisition, data pre-processing and classification. The following sections give out in detail
the steps of our contribution.

                             Fig. 3: Block diagram of the proposed contributions

 IV.1. Dataset

This present work introduces a publicly available image dataset which contains X-Ray and computed
tomography (CT) images. This dataset, named chest X-Ray & CT dataset available in this link, is
composed of 5856 images (jpeg format) and has two categories (4273 pneumonia and 1583 normal).
As can be seen from Figure 4 that illustrates an examples of chest X-Rays in patients with pneumonia,
the normal chest X-Ray (Figure 4. (a)) shows clear lungs with no zones of abnormal opacification.
Moreover, Figure 4. (b) regularly shows a focal lobar consolidation (white arrows), while figure 4. (c)
shows with a more diffuse “interstitial” pattern in two lungs (Kermany et al., 2018).

           (a). Normal                   (b). Bacterial Pneumonia                (c). Viral Pneumonia
                         Fig. 4: Examples of Chest X-Rays in patients with pneumonia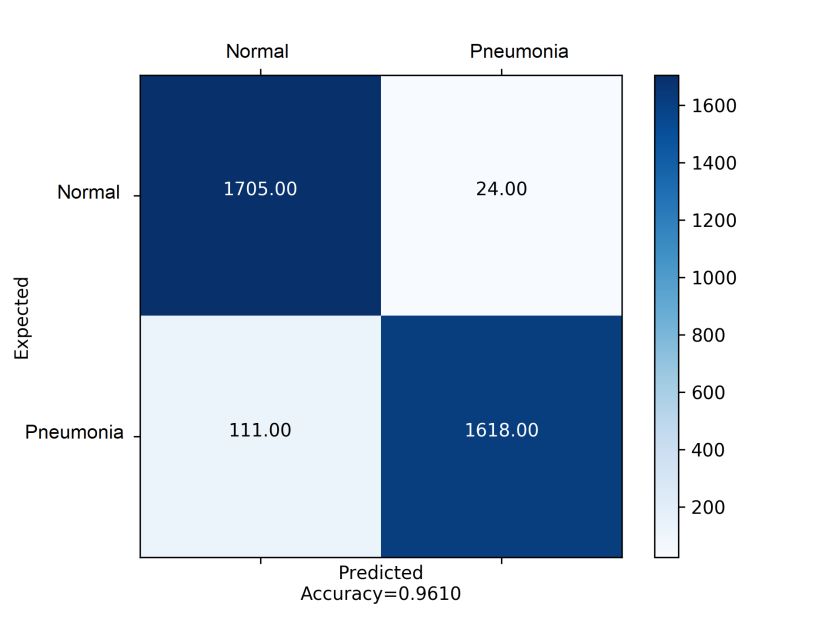
IV.2. Data pre-processing and data splitting
The next stage is to pre-process input images using different pre-processing techniques. The
motivation behind image pre-processing is to improve the quality of visual information of each input
image (eliminate or decrease noise present in the original input image, improve image quality through
increased contrast, delete the low or high frequencies, etc). In this study, we used intensity
normalization and Contrast Limited Adaptive Histogram Equalization (CLAHE).
Intensity normalization is an interesting pre-processing step in image processing applications (Kassani
et al., 2019). In our models, we normalized input images (Figure 5. (a)) to the standard normal
distribution using min-max normalization (Equation1). Furthermore, before feeding input images into
the proposed models, CLAHE is a necessary step to improve the contrast in images (Kharel et al.,
2017; Makandar and Halalli, 2015). Figure 5 illustrates an example of using these techniques.
x xmin
X norm (1)
xmax xmin
(a) (b) (c)
Fig. 5. Normalized image:
(a). Original image, (b). Normalized image, (c). CLAHE
For data splitting, we used in this experiment 60% of the images for training and 40% of the images
for validation. We ensure that the images chosen for validation are not used during training in order to
perform successfully the binary classification task. Moreover, we observed that our dataset is
imbalanced, indeed 75% of the images represents the pneumonia class. In order to overcome this
issue, we resampled our dataset by using data augmentation. In fact, we generated from each single
input image 2 new images with different augmentation techniques. Therefore, the total number of
images in normal class was increased by 2 times.
IV.3. Data augmentation
Data augmentation is used for the training process after dataset pre-processing and splitting and has
the goal to avoid the risk of over fitting. Moreover, the strategies we used include geometric
transforms such as rescaling, rotations, shifts, shears, zooms and flips (Table 2).
Table 2: Data augmentation used
Argument Parameter Description
value
Rescale 1 / 255.0 Scale images from integers 0-255 to floats 0-1
Rotation range 90 Degree range of the random rotations
Vertical shift range 0.2 The parameter value of horizontal and vertical shifts (20%) is a fraction
of the given dimension
Horizontal shift 0.2
range
Shear range 0.2 Controls the angle in counterclockwise direction as radians in which our
image will allowed to be sheared
Zoom range 0.2 Allows the image to be “zoomed out” or “zoomed in”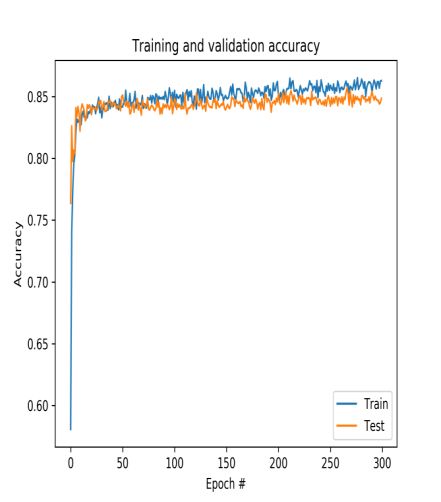
Horizontal flip True Controls when a given input is allowed to be flipped horizontally during
the training process
Fill mode Nearest This is the default option where the closest pixel value is chosen and
repeated for all the empty values
IV.4. Training and classification dataset
After data pre-processing, splitting and data augmentation techniques used, our training dataset size is
increased and ready to be passed to the feature extraction step with the proposed models in order to
extract the appropriate and pertinent features. The extracted features from each proposed model are
flattened together to create the vectorized feature maps. The generated feature vector is passed to a
multilayer perceptron to classify each image into corresponding classes. Finally, the performance of
the proposed method is evaluated on test images using the trained model. We repeat each experiment
three times and report their average results.
IV.5. Experimental setup
Toward an automatic binary classification based on a publicly available image dataset (Chest X-Ray
dataset), our experimentations were carried out based on following experimental parameters: All the
images of the dataset were resized to 224x224 pixels except those of Inception_V3 model that were
resized to 299x299. To train our models, we set the batch size to 32 with the number of epochs set to
300. The training and validation samples are respectively set to 159 and 109. Adam with β1=0.9,
β2=0.999 is used for optimization, and learning rate set to 0. 00001 and decreased it to 0.000001.
Moreover, we used weight decay to reduce overfitting of our models. The regularizers are provided
under keras and have the name L2. The implementation of the proposed models is done using
computer with Processor: Intel (R) core (TM) i7- 7700 CPU @ 3.60 GHZ and 8 Go in RAM running
on a Microsoft Windows 10 Professional (64-bit). For simulation, python 3 is used and
Keras/tensorflow as deep learning backend. Our training and validation steps are running using
NVIDIA Tesla P40 with 24 Go RAM.
IV.6. Evaluation criteria
After extracting the appropriate feature, the last step is to classify the attained data and assign it to a
specific class (Blum et al., 2001). Among the different classification performance properties, and
since our data is balanced our study uses the following benchmark metrics, including accuracy,
sensitivity, specificity, precision and F1 score (Blum et al., 2001; Bhandary et al. 2020). These
popular parameters are defined as follows:
TP+TN
Accuracy=
TN+TP+FP+FN
TP
Sensitivit y=
TP+FN
TN (2)
Specificit y=
TN+FP
TP
Pr ecision=
TP+FP
Re call precision
F1=2
Re call precisionWhere: TP: True Positive. FP: False Positive.TN: True Negative, and FN: False Negative.
IV.7. Results and discussion
In this section we present the result for the binary classification for the chest X-Ray & CT images
with the following architectures (Baseline CNN, Fine tuning the top layers of VGG16, VGG19,
Inception_V3, Xception, Resnet50, Inception_Resnet_V2, DenseNet201, and MobileNet_V2). In
addition, to check the performance and robustness of each proposed model, several experiments are
conducted on chest X-Ray dataset. The results are presented separately (Fig.6 - 15) using training and
validation curves of accuracy and loss. Other experiments are tabulated below (Table.3).
IV.7.1. Classification results of the proposed architectures
This subsection presents and discusses of the classification results of chest X-Ray & CT images.
Before to discuss these results, let us define the two most parameters used in the state of the art of
deep learning and computer vision: Train curve is calculated from the training dataset that provides an
idea of how well the model is learning, while the validation curve or test curve is calculated from a
hold-out validation dataset that provides an idea of how well the model is generalizing. Moreover, the
training and validation loss is defined as a summation of the errors made for each example in
validation or training sets. In contrast to accuracy, loss is not a percentage. To summarize, a model
that generalizes well is a model that is neither overfit nor underfit, is the best model. Furthermore, the
confusion matrix shows the detailed representation of what happens with images after classification
(Bhandary et al., 2020).
Baseline CNN
Fig. 6. Accuracy and loss curve and confusion matrix of Baseline CNNAccording to the figure above, it is observed that the accuracy curve of train data is rapidly increasing
from epoch 0 to epoch 6 where the accuracy is equal to 83.17% then it starts to be stable until epoch
300 where the accuracy is equal to 86.28% Same for the accuracy curve of test data with an accuracy
of 84.84 for epoch 300.
For the loss curve of train data is rapidly decreasing from epoch 0 to epoch 6 where the loss is 43.77%
then it starts to be stable until the end of training (epoch 300) where the loss is equal to 36.56%. Same
for loss curve of data test with a loss of 37.85% for epoch 300.
From the confusion matrix, it is observed that the first images class (Normal), the model was able to
identify 1634 images correctly in the normal class, but 95 were labelled as Pneumonia. Likewise, for
the second images class (Pneumonia), the model was able to identify 1277 images correctly, but 252
images were labelled as Normal.
VGG16
Fig. 7. Accuracy and loss curve and confusion matrix of VGG16
The following figure presents accuracy and loss curve and confusion matrix of VGG16. Indeed, from
the epoch 0 to epoch 11, the accuracy curve of train data is quickly increasing where is equal to
81.05% then it converges to a value of 87.51%. Same for the accuracy curve of test data with an
accuracy of 86.32% for epoch 300.
A rapid decreasing of loss curve can be observed for train data from epoch 0 to epoch 25 where the
loss is equal to 1.43% then a kind of stability can be observed up to the value 1. 15%. The same goes
for the loss curve of test data where the loss is equal to 2.21 for epoch 300.
From the confusion matrix, we can observe for images class (Normal) the model was able to predict
1517 images correctly in the normal class, but 212 were labelled as Pneumonia. For the images class(Pneumonia), the model was able to identify 1466 images correctly, but 263 images were labelled as
Normal.
VGG19
Fig. 8. Accuracy and loss curve and confusion matrix of VGG19
As it is showed in the figure above, the curve of train data (test data) can be divided into two intervals:
the first one starts from epoch 0 to epoch 13 (from epoch 0 to epoch 10) where we can observe a
quick increase of accuracy where the accuracy is equal to 81.01% (83.05%). The second interval the
accuracy starts to be stable and converges to 87.42% (86.89%).
For the loss curve of train and test data, we can observe a good fit. Indeed, from epoch 0 to epoch 18
the loss is rapidly decreasing where is equal to 1.27% then it starts to be stable until the epoch 300
where is equal to 1.31%.
As observed in the normal class, the VVG19 model was able to predict 1390 images correctly and 339
images as Pneumonia. The model also was able to classify 1582 images as Pneumonia and 147
images as Normal for the Pneumonia class.
Inception_V3
The next figure shows accuracy and loss curve and confusion matrix of Inception_V3. In fact, for the
train and test accuracy and from epoch 0 to epoch 7, we can observe that the accuracy is increasinguntil the value 91.03%. After epoch 7 the accuracy starts to be stable where is equal to 97.01% and
95.94% for training data and test data respectively.
A good fit can be observed for the loss curve of train data in either the quick increasing interval from
epoch 0 to epoch 32 where the loss is 3.98% or in the other interval where the decreasing is slow and
converges to 1.76%.
Fig. 9. Accuracy and loss curve and confusion matrix of Fine-tuned Inception_V3
As shown in the confusion matrix, for the Pneumonia class, the model was able to identify 1650
images as Pneumonia and 79 images as Normal. It can be seen that for images class (Normal),
Inception_V3 model was able to predict 1621 images as Normal and 108 as Pneumonia.
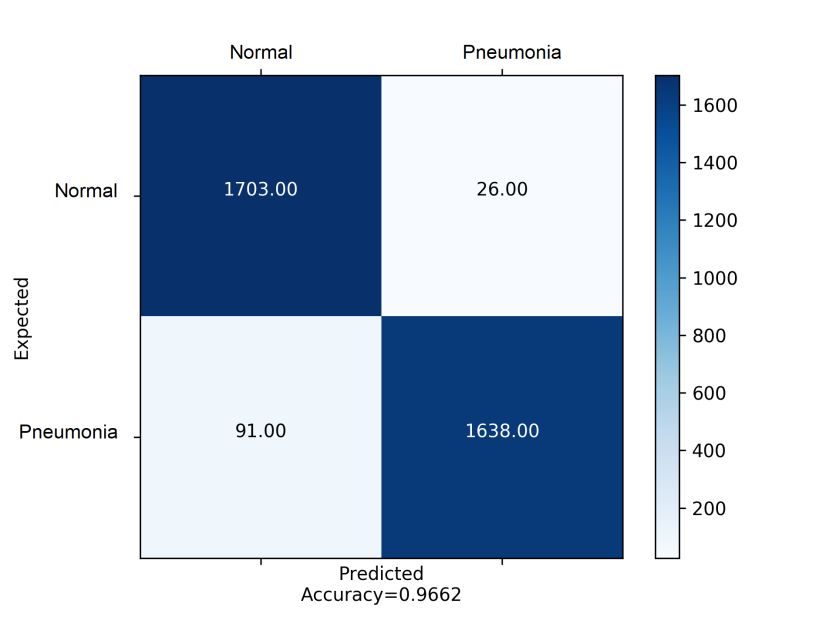
ResNet50
The figure bellow illustrates the results attained by Resnet50. In fact, from epoch 0 to epoch 24 the
accuracy values are increasing expeditiously either for train data or test data where the maximum
value is 97.36%. After that, the values start to be stable where the value is 99.23% and 96.23% for
training data and test data respectively.
We can observe a good fit for the loss curve of train and test data, Indeed, from epoch 0 to epoch 21
the loss is briskly decreasing where is equal to 6.89% then it starts to be stable until the epoch 300
where is equal to 0.85%.
The confusion matrix indicates that, for images class (Normal), 1703 images were predicted correctly
as Normal and 26 were labelled as Pneumonia. Same for the second images class (Pneumonia), the
model was able to identify 1638 images correctly, but 91 images were labelled as Normal.Fig. 10. Accuracy and loss curve and confusion matrix of Fine-tuned ResNet50
Inception_ResNet_V2
From the figure bellow, we can observe that from epoch 0 to epoch 18 the train and test accuracy the
accuracy is increasing until the value 95.51%. After epoch 18 the accuracy starts to be stable where is
equal to 99.11% and 96.41% for training data and test data respectively.
For the loss curve, we can see an excellent fit for training and test data where the values are 3.99%
(epoch 24) and 1.17% (epoch 300).
For the Pneumonia class, the Inception_ResNet_V2 model was able to identify 1618 images correctly
as Pneumonia and 111 images as Normal. On other hand, for Normal class, 1705 were correctly
classified as Normal and 24 images as Pneumonia.Fig. 11. Accuracy and loss curve and confusion matrix of Fine-tuned Inception_ResNet_V2
DensNet201
The obtained accuracy curve of train data is speedily increasing until the value 93.49%. After epoch
16 the accuracy starts to be stable where is equal to 97.16% and 94.91% for train data and test data
respectively.
A good fit can be checked, for the loss curve of train and test data. In fact, from epoch 0 to epoch 17
the loss is quickly decreasing where is equal to 3.99% then it starts to be stable until the epoch 300
where is equal to 1.91%.Fig. 12. Accuracy and loss curve and confusion matrix of Fine-tuned DensNet201
The confusion matrix depicts that for the first images class (Normal) the model was able to predict
1712 images correctly in the normal class, but 17 were labelled as Pneumonia. The model also was
able to identify 1527 images correctly, but 202 images were labelled as Normal for the second images
class (Pneumonia).
MobileNet_V2
Fig. 13. Accuracy and loss curve and confusion matrix of Fine-tuned MobileNet_V2
As illustrated by the previous figure, we can observe that from epoch 0 to epoch 16 the train and test
accuracy the accuracy is increasing until the value where the accuracy is equal to 96.38%. After epoch
16 the accuracy starts to be stable where is equal to 98.27% and 96.64% for train data and test data
respectively.
For the loss curve of train data, an excellent fit is observed. Until the epoch 44 the value of loss is
expeditiously decreasing where the value is 1.49% then converges to 0.24%.
Regarding to the confusion matrix above, for the first images class (Normal) the model was able to
identify 1696 images correctly in the normal class, but 33 were classified as Pneumonia. Likewise, in
the Pneumonia class, 1634 images were labelled correctly as Pneumonia and 95 were identified as
Normal. Xception
Fig. 14. Accuracy and loss curve and confusion matrix of Fine-tuned Xception
It is noted that the accuracy of train data is fastly increasing from epoch 0 to epoch 10 where the
accuracy is equal to 93.10% then it starts to be stable until epoch 300 where the accuracy is equal to
95.45%. For the test data, a quick increasing can be observed from epoch 0 to epoch 12 where the
value is 86.87% then it starts to decrease till 69.03% for epoch 300.
For the loss curve of train and test data, the values are rapidly decreasing from epoch 0 to epoch 26
where the value is 1.10%. After epoch 26 the value converges to 0.44% and 0.69% for train and test
data respectively.
When we see this confusion matrix, we can observe that for the first images class (Normal), the model
was able to predict 1656 images correctly in the normal class, but 73 were labelled as Pneumonia. The
model also was able to identify 1219 images correctly, but 510 images were labelled as Normal for
the second images class (Pneumonia).
Discussion
We investigated in this study the binary classification (Normal and pneumonia) based on X-Ray
images using transfer learning of recent deep learning architectures, in order to identify the best
performing architecture based on the several parameters defined in equation2. First, we individually
compare the deep learning architectures by measuring the accuracies. After that, we compare the
accuracy and loss results given by each DL architecture to discern the outperforming architecture (Fig
14, 15). Table 3 illustrates a comparison between our different deep learning models used in our
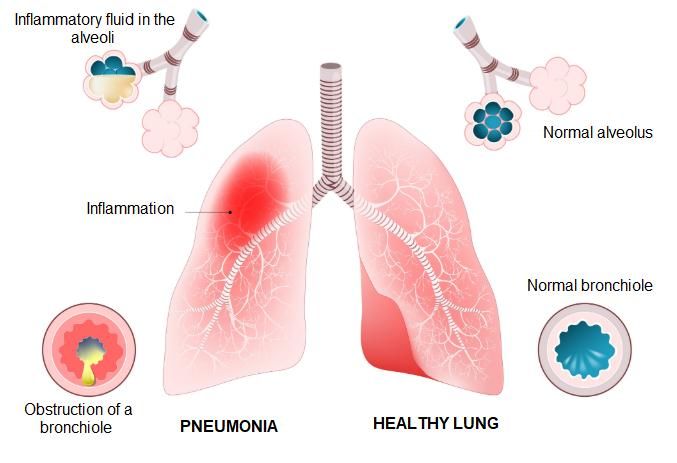
experiment in terms of parameters defined in equation2.For each model in Fig 19 (a) and (b), the plots of training and validation accuracy increase to a point of stability. It is observed that fine-tuned version of Inception_Resnet_V2, Inception_V3, Resnet50, Densnet201 and Mobilenet_V2 show highly satisfactory performance with rate of increase in training and validation accuracy with each epoch. They outperform the baseline CNN, Xception, VGG16 and VGG16 that demonstrate low performance. In fact, from epoch 20, they start to be stable until the end of training where the training and validation accuracy of baseline CNN, VGG16 and VGG16 are equals to 85%. However, Xception reaches 83 % in validation accuracy and 95% in training accuracy. In this case, the predictive model produced by Xception algorithm does not adapt well to the training Set (Overfiting). Besides, the plots of training and validation loss (Fig 20 (a) and (b)) decrease to a point of stability for each proposed model. As it can be seen, fine-tuned version of our models shows highly satisfactory performance with rate of decrease in training and validation loss with each epoch. Results for our multi-experiment classification, based on different fine-tuned versions of recent deep learning architectures, are tabulated in Table 3. The table depicts in detail classification performances across each experiment. From the results, it’s notable that the accuracy when we use baseline CNN, Xception, VGG16 and VGG19 is low compared with other DL architectures, since these last models help to obtain respectively 84.18%, 83.14%, 86.26 % and 85.94 % of accuracy. Unlike, the highest accuracies are reported by Inception_V3, DensNet201, MobileNet_V2, Inception_Resnet_V2, and Resnet50. Therefore, these models attain better classification accuracy since they achieve respectively 94.59 %, 93.66 %, 96.27 %, 96.09 % and 96.61%.
Training and Validation Accuracy of our models
(a)(b) Fig. 14. Accuracy curve for different architectures
Training and Validation Loss of our models
(a) (b)
Fig. 15. Loss curve for different architectures
Table 3: Evaluation metrics
TP TN FN FP Accuracy (%) Sensitivity (%) Specificity (%) Precision (%) F1 score (%)
CNN 1634 1277 452 95 84.18 78.33 93.07 94.05 85.66
VGG16 1517 1466 263 212 86.26 85.22 87.36 87.73 86.46
VGG19 1390 1582 147 339 85.94 90.43 82.35 80.39 85.11
Inception_V3 1621 1650 79 108 94.59 95.35 93.85 93.75 94.54Xception 1656 1219 510 73 83.14 76.45 94.34 95.77 8503 DensNet201 1712 1527 202 17 93.66 89.44 98.89 99.01 93.98 MobileNet_V2 1696 1634 95 33 96.27 94.61 98.02 98.06 96.30 Inception_ Resnet_V2 1705 1618 111 24 96.09 93.88 98.53 98.61 96.19 Resnet50 1703 1638 91 26 96.61 94.92 98.43 98.49 96.67
V. Conclusions & Future works
We presented in this work automated methods used to classify the chest X-Ray into pneumonia and
the normal class using nine Deep Learning architectures (a baseline CNN, VGG16, VGG19,
DenseNet201, Inception_ResNet_V2, Inception_V3, Xception, Resnet50, and MobileNet_V2). The
main goal is to answer to the following research question: Is there any Deep Learning techniques
which distinctly outperforms other DCNN techniques? Toward this end, the experiments were
conducted using chest X-Ray & CT dataset which contains 5856 images (4273 pneumonia and 1583
normal) and performances were evaluated using various performance metrics. Furthermore, the
obtained results show that the Resnet50, MobileNet_V2 and Inception_Resnet_V2 gave highly
performance (accuracy is more than 96%) against other architectures cited in this work (accuracy is
around 84%).
Ongoing work intends to develop a full system for pneumonia via deep learning detection,
segmentation, and classification. In addition, the performance may be improved using more datasets,
more sophisticated feature extraction techniques based on deep learning such as You-Only-Look-
Once (YOLO), and U-Net that was developed for biomedical image segmentation.

References

H. Guo, Y. Zhou, Xi. Liu and J. Tan, The impact of the COVID-19 epidemic on the utilization of emergency
    dental services, Journal of Dental Sciences, 2020, [in press].
World      Health     Organization,     Novel      Coronavirus(2019-nCoV)        Situation   Report     -    28.
    https://www.who.int/docs/default-source/coronaviruse/situation-reports/20200217-sitrep-28-covid-
    19.pdf?sfvrsn=a19cf2ad_2, 2020 (accessed 17 February 2020).
Q. Li, X. Guan, P. Wu, X. Wang, L. Zhou, Y. Tong, R. Ren, K.S.M. Leung, E.H.Y. Lau, J.Y. Wong, X. Xing,
    N. Xiang, Y. Wu, C. Li, Q. Chen, D. Li, D. Li, T. Liu, J. Zhao, M. Liu, W. Tu, C. Chen, L. Jin, R. Yang, Q.
    Wang, S. Zhou, R. Wang, H. Liu, Y. Luo, Y. Liu, g. Shao, H. Li, H. Li, Z. Tao, Y. Yang, Z. Deng, B. Liu,
    Z. Ma, Y. Zhang, G. Shi, T.T.Y. Lam, J.T. Wu, G.F. Gao, B.J. Cowling, B. Yang, G.M. Leung, Z. Feng,
    Early transmission dynamics in Wuhan, China, of novel coronavirus-infected pneumonia, New England
    Journal of Medicine. Vol. 382, No. 13, pp. 1399-1207, 2020. [in press].
K. Roosa, Y. Lee, R. Luo, A. Kirpich, R. Rothenberg, J.M. Hyman, P. Yan and G. Chowell, Real-time forecasts
    of the COVID-19 epidemic in China from February 5th to February 24th, 2020, Infectious Disease
    Modelling. Vol. 5, pp. 256-263, 2020.
Chinese National Health Commission. Reported cases of 2019-nCoV. Retrieved from
    https://ncov.dxy.cn/ncovh5/view/pneumonia?from=groupmessage&isappinstalled=0
Centers for Disease Control and Prevention, Principles of Epidemiology in Public Health Practice (DHHS
    Publication SS1978), (3rd ed.), U.S. Department of Health and Human Services, Atlanta, GA, 2012.
C. Orbanna, L. Sattenspiel, E. Miller and J. Dimka, Defining epidemics in computer simulation models: How do
    definitions influence conclusions? Epidemics, Vol. 19, pp. 24-32, 2017.
The Pneumonia Etiology Research for Child Health (PERCH), Causes of severe pneumonia requiring hospital
    admission in children without HIV infection from Africa and Asia: the PERCH multi-country case-control
    study, Lancet, Vol. 394, Issue. 10200, pp. 757-779, 31 August - 6 September, 2019.
L. Liu, S. Oza, D. Hogan, Y. Chu, J. Perin, J. Zhu, J.E. Lawn, S. Cousens, C. Mathers and R.E. Black, Global,
    regional, and national causes of under-5 mortality in 2000–15: an updated systematic analysis with
    implications for the Sustainable Development Goals, Lancet, Vol. 388, pp. 3027-3035, 2016.
Y. Tian, Y. Wu, H. Liu, Y. Si, Y. Wu, X. Wang, M. Wang, J. Wu, L. Chen, C. Wei, T. Wu, P. Gao and Y. Hu,
    The impact of ambient ozone pollution on pneumonia: A nationwide time-series analysis, Environment
    International, Vol. 136, March, 2020.
E. Prina, O.T. Ranzani and A. Torres, Community-acquired pneumonia, Lancet, Vol. 386, pp. 1097-1108, 2015.
T. Welte, A. Torres, and D. Nathwani, Clinical and economic burden of community-acquired pneumonia among
    adults in Europe, Thorax, Vol. 67, pp. 71-79, 2012.
K. Kondo, K. Suzuk, M. Washio, S. Ohfuji, W. Fukushima, A. Maeda and Y. Hirota, Effectiveness of 23-valent
    pneumococcal polysaccharide vaccine and seasonal influenza vaccine for pneumonia among the elderly –
    Selection of controls in a case-control study, Vaccine, Vol. 25, No. 36, pp. 4806-4810, 24 August, 2017.
V.P. Hespanhol and C. Bárbara, Pneumonia mortality, comorbidities matter? Pulmonology, 29 November, 2019,
    [In Press].
C. Drosten, S. Günther, W. Preiser, S. Van der Werf, H.R. Brodt, S. Becker, H. Rabenau, M. Panning, L.
Kolesnikova, R.A.M. Fouchier, A. Berger, A.M. Burguière, J. Cinatl, M. Eickmann, N. Escriou, K.
Grywna, S. Kramme, J.C. Manuguerra, S. Müller, V. Rickerts, M. Stürmer, S. Vieth, H.D. Klenk, AD.M.E.
Osterhaus, H. Schmitz and H.W. Doerr, Identification of a novel coronavirus in patients with severe acute
respiratory syndrome, New England Journal of Medicine, Vol. 348, No. 20, pp. 1967-1976, 15 May, 2003.
T.G. Ksiazek, D. Erdman, C.S. Goldsmith, S.R. Zaki, T. Peret, S. Emery, S. Tong, C. Urbani, J.A. Comer, W.
Lim, P.E. Rollin, S.F. Dowell, A.E. Ling, C.D. Humphrey, W.J. Shieh, J. Guarner, C.D. Paddock, P. Rota,
B. Fields, J. DeRisi, J.Y, Yang, N. Cox, J.M. Hughes, J.W. LeDuc, W.J. Bellini, L.J. Anderson, and SARS
Working Group, A novel coronavirus associated with severe acute respiratory syndrome, New England
Journal of Medicine, Vol. 348, No. 20, pp. 1953-1966, 15 May, 2003.
A.C. Walls, Y.J. Park, M.A. Tortorici, A. Wall, A.T. McGuire and D. Veesler, Structure, Function, and
Antigenicity of the SARS-CoV-2 Spike Glycoprotein, Cell, 9 Mars, 2020. [In Press]
Y. Roussel, A.G. Gatineau, M.T. Jimeno, J.M. Rolain, C. Zandotti and D. Raoult, SARS-CoV-2: fear versus
data, International Journal of Antimicrobial Agents, 19 March, 2020. [In Press]
Y. Yanga, F. Peng, R. Wang, K. Guana, T. Jiang, G. Xu, J. Suna, and C. Chang, The deadly coronaviruses: The
2003 SARS pandemic and the 2020 novel coronavirus epidemic in China, Journal of Autoimmunity, 3
March, 2020. [In Press]
C. Wu, Y. Liu, Y. Yang, P. Zhang, W. Zhong, Y. Wang, Q. Wang, Y. Xu, M. Li, X. Li, M. Zheng, L. Chen and
H. Li, Analysis of therapeutic targets for SARS-CoV-2 and discovery of potential drugs by computational
methods, Acta Pharmaceutica Sinica B, 27 February, 2020. [In Press]
B. Hu, L.P. Zeng, X.L. Yang, X.Y. Ge, We, Zhang, B. Li, J.Z. Xie, X.R. Shen, Y.Z. Zhang, N. Wang, D.S. Luo,
X.S. Zheng, M.N. Wang, P. Daszak, L.F. Wang, J. Cui and Z.L. Shi, Discovery of a rich gene pool of bat
SARS-related coronaviruses provides new insights into the origin of SARS coronavirus, Plos Pathogens,
Vol. 13, No. 11, November 2017.
World Health Organization, Middle East respiratory syndrome coronavirus (MERS-CoV), Retrieved from
https://www.who.int/emergencies/mers-cov/en/, 2018
S. Van Boheemen, M. de Graaf, C. Lauber, T.M. Bestebroer, V.S. Raj, A.M. Zaki, A.D. Osterhaus, B.L.
Haagmans, A.E. Gorbalenya, E.J. Snijder and R.A. Fouchier, Genomic characterization of a newly
discovered coronavirus associated with acute respiratory distress syndrome in humans, MBio, Vol. 3, 2012.
A.M. Zaki, S. Van Boheemen, T.M. Bestebroer, A.D. Osterhaus and R.A. Fouchier, Isolation of a novel
coronavirus from a man with pneumonia in Saudi Arabia, New England Journal of Medicine, Vol. 367, No.
19, pp. 1814-1820, 2012.
B. Hijawi, M. Abdallat, A. Sayaydeh, S. Alqasrawi, A. Haddadin, N. Jaarour, S. Alsheikh and T. Alsanouri,
Novel coronavirus infections in Jordan: epidemiological findings from a retrospective investigation, Eastern
Mediterranean health journal, Vol. 19, pp. S12-S18, 2013.
H.Z. Farooq, E. Davies, S. Ahmad, N. Machin, L. Hesketh, M. Guiver and A.J. Turner, Middle East respiratory
syndrome coronavirus (MERS-CoV) - Surveillance and testing in North England from 2012 to 2019,
International Journal of Infectious Diseases, Vol. 93, pp. 237-244, 2020.
World Health Organization, Middle East respiratory syndrome coronavirus (MERS-CoV), Retrieved from
https://www.who.int/news-room/fact-sheets/detail/middle-east-respiratory-syndrome-coronavirus-(mers-
cov), 2019.
H.A. Mohd, J.A. Al-Tawfiq and Z.A. Memish, Middle East Respiratory Syndrome Coronavirus (MERS-CoV)
origin and animal reservoir, Virology Journal, Vol. 13, No. 87, 2016.
E.I. Azhar, S.A. El-Kafrawy, S.A. Farraj, A.M. Hassan, M.S. Al-Saeed, A.M. Hashem and T.A. Madani,
Evidence for camel-to-human transmission of MERS coronavirus, New England Journal of Medicine, Vol.
370, pp. 2499-2505, 2014.
M. Ki, 2015 MERS outbreak in Korea: hospital-to-hospital transmission, Epidemiol Health, Vol. 37, 2015.
I.K. Oboho, S.M. Tomczyk, A.M. Al-Asmari, A.A. Banjar, H. Al-Mugti, M.S. Aloraini, K.Z. Alkhaldi, E.L.
Almohammadi, B.M. Alraddadi, S.I. Gerber, L. David, M.D. Swerdlow, T. John M.D. Watson and T.A.
Madani, 2014 MERS-CoV outbreak in Jeddah - a link to health care facilities, New England Journal of
Medicine, Vol. 372, pp. 846-854, 2015.
R. Aguanno, A. El Idrissi, A.A. Elkholy, P. Ben Embarek, E. Gardner, R. Grant, H. Mahrous, M.R. Malik, G.
Pavade, S. VonDobschuetz, L. Wiersma and M D. Van Kerkhove, MERS: Progress on the global response,
remaining challenges and the way forward, Antiviral Research, Vol. 159, pp. 35-44, November, 2018.
N. Wang, O. Rosen, L. Wang, H.L. Turner, L.J. Stevens, K.S. Corbett, C.A. Bowman, J. Pallesen, W. Shi, Y.
Zhang, K. Leung, R.N. Kirchdoerfer, M.M. Becker, M.R. Denison, J.D. Chappell, A.B. Ward, B.S. Graham
and J.S. McLellan, Structural Definition of a Neutralization-Sensitive Epitope on the MERS-CoV S1-NTD,
Cell Reports, Vol. 28, No. 13, pp. 3395-3405, September, 2019.
S. Baharoon and Z.A. Memish, MERS-CoV as an emerging respiratory illness: A review of prevention methods,
Travel Medicine and Infectious Disease, Vol. 32, November–December, 2019.A. Al-Omari, A.A. Rabaan, S. Salih, J.A. Al-Tawfiq and Z.A. Memish, MERS coronavirus outbreak:
Implications for emerging viral infections, Diagnostic Microbiology and Infectious Disease, Vol. 93, No. 3,
pp. 265-285, March, 2019.
G. Lippi, M. Plebani and B.M. Henry, Thrombocytopenia is associated with severe coronavirus disease 2019
(COVID-19) infections: A meta-analysis, Clinica Chimica Acta, 13 March, 2020. [In Press]
S. Amrane, H. Tissot-Dupont, B. Doudier, C. Eldin, M. Hocquart, M. Mailhe, P. Dudouet, E. Ormières, L.
Ailhaud, P. Parola, J.-C. Lagier, P. Brouqui, C. Zandotti, L. Ninove, L. Luciani, C. Boschi, B.La Scola, D.
Raoult, M. Million, P. Colson and P. Gautret, Rapid viral diagnosis and ambulatory management of
suspected COVID-19 cases presenting at the infectious diseases referral hospital in Marseille, France, -
January 31st to March 1st, 2020: A respiratory virus snapshot, Travel Medicine and Infectious Disease, 20
March, 2020. [In Press].
A. Cortegiani, G. Ingoglia, M. Ippolito, A. Giarratano, S. Einav, A systematic review on the efficacy and safety
of chloroquine for the treatment of COVID-19, Journal of Critical Care, 10 March, 2020. [In Press]
S. Tiana, N. Hub, J. Lou, K. Chen, X. Kanga, Z. Xiang, H, Chen, D. Wang, N. Liu, D. Liu, G. Chen, Y. Zhang,
D. Li, J. Li, H, Lian, S. Niu, L. Zhang and J. Zhang, Characteristics of COVID-19 infection in Beijing,
Journal of Infection, Vol. 80, No. 4, pp. 401-406, April, 2020.
B. Tang, S. Li, Y. Xiong, M. Tian, J. Yu, L. Xu, L. Zhang, Z. Li, J. Ma, F. Wen, Z. Feng, X. Liang, W. Shi and
S. Liu, Coronavirus Disease 2019 (COVID-19) Pneumonia in a Hemodialysis Patient, Kidney Medicine, 12
March, 2020. [In Press]
E.G. Favalli, F. Ingegnoli, O. De Lucia, G. Cincinelli, R. Cimaz and R. Caporali, COVID-19 infection and
rheumatoid arthritis: Faraway, so close! Autoimmunity Reviews, 20 March, 2020, [In Press]
A. Wilder-Smith, C.J. Chiew and V.J. Lee, Can we contain the COVID-19 outbreak with the same measures as
for SARS? The Lancet, 5 March, 2020. [In Press]
E. Driggin, M.V. Madhavan, B. Bikdeli, T. Chuich, J. Laracy, G. Bondi-Zoccai, T. S. Brown, C.D.
Nigoghossian, D.A. Zidar, J. Haythe D. Brodie, J.A. Beckman, A.J .Kirtane, G.W. Stone H.M. Krumholz
and S.A. Parikh, Cardiovascular Considerations for Patients, Health Care Workers, and Health Systems
During the Coronavirus Disease 2019 (COVID-19) Pandemic, Journal of the American College of
Cardiology, 19 March, 2020. [In Press]
Y. Cheng, R. Luo, K. Wang, M. Zhang, Z. Wang, Lei, Dong, J. Li, Y. Yao, S. Ge and G. Xu, Kidney disease is
associated with in-hospital death of patients with COVID-19, Kidney International, 20 March, 2020. [In
Press]
R. Pung, C.J. Chiew, B.E. Young, S. Chin, M.I-C. Chen, H.E. Clapham, A.R. Cook, S, Maurer-Stroh, Toh, C.
Poh, M. Low, J. Lum, V.T.J. Koh, T.M. Mak, L. Cui, RV.T. Lin, D. Heng, Y.S. Leo, D.C. Lye and V.J.M.
Lee, Investigation of three clusters of COVID-19 in Singapore: implications for surveillance and response
measures, The Lancet, 17 March, 2020. [In Press]
S. Zhang, M.Y. Diaob, W. Yuc, L. Pei, Z. Lin, D. Chen, Estimation of the reproductive number of novel
coronavirus (COVID-19) and the probable outbreak size on the Diamond Princess cruise ship: A data-
driven analysis, International Journal of Infectious Diseases, Vol. 93, pp. 201-204, April, 2020.
M.E. El Zowalaty, J.D. Järhult, From SARS to COVID-19: A previously unknown SARS- related coronavirus
(SARS-CoV-2) of pandemic potential infecting humans – Call for a One Health approach, One Health, Vol.
9, June, 2020.
J. Sun, W-T. He, L. Wang, A. Lai, X. Ji, X. Zhai, G. Li, M.A. Suchard, J. Tian, J. Zhou, M. Veit, S. Su,
COVID-19: Epidemiology, Evolution, and Cross-Disciplinary Perspectives, Trends in Molecular Medicine,
21 March, 2020. [In Press].
N. Kandel, S. Chungong, A. Omaar and J. Xing, Health security capacities in the context of COVID-19
outbreak: an analysis of International Health Regulations annual report data from 182 countries, The
Lancet, 18 March, 2020. [In Press]
C. Lu, X. Liu and Z. Jia, 2019-nCoV transmission through the ocular surface must not be ignored, The Lancet,
Vol. 395, 22 February, 2020.
R. Liu, H. Hana, F. Liu, Z. Lv, K. Wu, Y. Liu, Y. Feng and C. Zhu, Positive rate of RT-PCR detection of
SARS-CoV-2 infection in 4880 cases from one hospital in Wuhan, China, from Jan to Feb 2020, Clinica
Chimica Acta, Vol. 505, pp. 172-175, June 2020.
R. Simcock, T. V. Thomas, C.E. Mercy, A.R. Filippi, M.A. Katz, I.J. Pereira and H. Saeed, COVID-19: Global
Radiation Oncology’s Targeted Response for Pandemic Preparedness, Clinical and Translational Radiation
Oncology, 24 March, 2020. [In Press]
J. Yang, Y. Zheng, X. Gou, K. Pu, Z. Chen, Q. Guo, R. Ji, H. Wang, Y. Wang and Y. Zhou, Prevalence of
comorbidities in the novel Wuhan coronavirus (COVID-19) infection: a systematic review and meta-
analysis, International Journal of Infectious Diseases, 12 March, 2020. [In Press]You can also read