Mercury: sources, pathways and environmental data October 2019 - Environment Agency
←
→
Page content transcription
If your browser does not render page correctly, please read the page content below

Mercury: sources, pathways and environmental data October 2019
We are the Environment Agency. We protect and improve the environment.
We help people and wildlife adapt to climate change and reduce its impacts,
including flooding, drought, sea level rise and coastal erosion.
We improve the quality of our water, land and air by tackling pollution. We
work with businesses to help them comply with environmental regulations. A
healthy and diverse environment enhances people's lives and contributes to
economic growth.
We can’t do this alone. We work as part of the Defra group (Department for
Environment, Food & Rural Affairs), with the rest of government, local
councils, businesses, civil society groups and local communities to create a
better place for people and wildlife.

Published by:                           © Environment Agency 2019
Environment Agency                      All rights reserved. This document may be
Horizon House, Deanery Road,            reproduced with prior permission of the
Bristol BS1 5AH                         Environment Agency.
www.gov.uk/environment-agency           © Environment Agency copyright and / or
                                        database right 2009. All rights reserved.
                                        Maps in this document include data
                                        supplied under licence from: © Crown
                                        Copyright and database right 2009. All
                                        rights reserved. Ordnance Survey licence
                                        number 100026380.

                                        Further copies of this report are available
                                        from our publications catalogue:
                                        http://www.gov.uk/government/publications
                                        or our National Customer Contact Centre:
                                        03708 506 506
                                        Email: enquiries@environment-
                                        agency.gov.uk

       2 of 38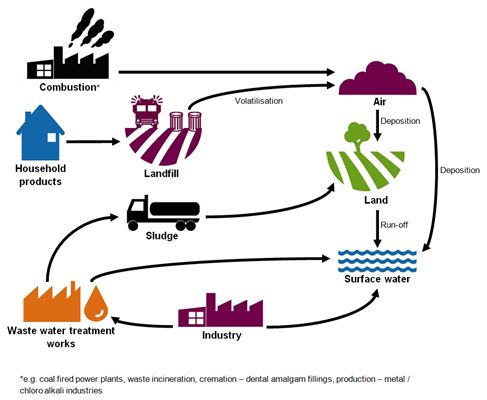
Executive summary
Mercury is a naturally occurring metallic element, but much of the mercury found in the
environment today arises from past industrial activity.
Mercury can occur in various chemical forms which differ in their degree of toxicity and
bioavailability. The change from one form to another occurs in water and sediment through
biological processes. Methylmercury is the most toxic and bioavailable form.
Historically, mercury has had many industrial and domestic uses which are now banned or
severely restricted in favour of safer alternatives. It has been used in electrical equipment
such as thermostats and batteries, cosmetics, wood preservatives, textile treatment
agents and as an antifouling agent on boat hulls. A major use of mercury has been in
mercury amalgam dental fillings, although this is now declining. Liquid mercury has been
used for many years in measuring devices such as thermometers, barometers and blood
pressure monitors.
Mercury and its compounds are classed as Water Framework Directive priority hazardous
substances under the Environmental Quality Standards Directive (EQSD; Directive
2008/105/EC amended by Directive 2013/39/EU) because they readily bioaccumulate, are
highly toxic and persistent.
Mercury is found in measureable concentrations in fish and mussels at all locations we
have sampled in our biota monitoring programme.
At approximately 80% of freshwater sites sampled we measured mercury residues in fish
at concentrations above the relevant environmental quality standard (EQS; 20 µg/kg). In
estuarine and coastal waters fish were only sampled from a small number of locations, but
all had mercury residues above the EQS.
Where levels are above the EQS, there may be an increased risk to those animals taking
and consuming local fish. However, the levels observed in fish are well below the food
regulatory limit for mercury in fish and fisheries products and do not represent a risk to the
human consumer providing advice from the Food Standards Agency is followed.
In recent decades there have been significant efforts to reduce emissions and losses of
mercury to air and water. The UK is signatory to the Minamata convention, a global treaty
ratified in 2017. The treaty seeks to protect human health and the environment from the
adverse effects of mercury. It bans a range of activities and products with the aim of
phasing out emissions of mercury.
Atmospheric releases of mercury are significantly greater than direct emissions to water,
with thermal power plants and combustion installations being the largest industrial source
emitters of mercury to the atmosphere.
Over the past 50 years emissions of mercury to air have declined by 94% as a result of
improved and tighter emission controls and restrictions on mercury use and release.
Aerial deposition originating from outside the UK is now a significant source of mercury.
Further reductions will rely on the success of promoting international action.
A commitment to further reduce land-based emissions of mercury to air and water by 50%
by 2030 is set out in the Government's 25 year environment plan as part of its overarching
commitment to reduce the levels of harmful chemicals entering the environment.
It’s vital that businesses comply with existing measures to limit further releases of mercury
into the environment. It may be a long time though before levels in the environment begin
to decline. Mercury cannot be degraded and can be remobilised to water from soil or
       3 of 38
sediment, so it is difficult to accurately predict environmental trends resulting from reduced
emissions

       4 of 38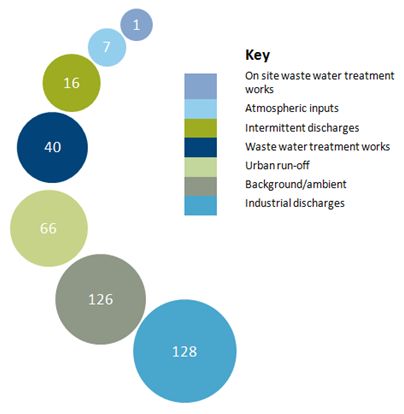
Contents
 Executive summary ..........................................................................................................3
 1. Introduction ................................................................................................................6
 2. Use pattern ................................................................................................................8
 3. Emissions, sources and pathways .............................................................................9
    3.1 Atmospheric emissions - sources ....................................................................................................................... 10
    3.2 Atmospheric emissions - trends over time .......................................................................................................... 11
    3.3 Emissions of mercury to water - sources ............................................................................................................ 11
    3.4 Emissions of mercury to water – trends over time .............................................................................................. 14

 4. Environmental monitoring data ................................................................................16
    4.1 Freshwater data.................................................................................................................................................. 16
    4.2 Estuarine and coastal waters.............................................................................................................................. 18
    4.4 Trends in saline waters ....................................................................................................................................... 20

 5. Restrictions ..............................................................................................................23
 6. Discussion................................................................................................................25
 References .....................................................................................................................27
 List of abbreviations and acronyms ................................................................................35
 Glossary .........................................................................................................................37

          5 of 38
1. Introduction
Mercury is a volatile, metallic element occurring naturally in the environment as elemental
mercury, inorganic mercury or methylmercury compounds. These forms differ in their
degree of toxicity and natural processes can change one form to another (UNEP, 2002).
Historically, mercury has had many uses. In recent years many of these uses have been
phased out, banned or restricted in favour of safer alternatives.
Mercury is released from both industrial processes and consumer products. Releases to
the environment will continue for years to come as products reach their end-of-life and are
disposed of.
The risk to both humans and wildlife from mercury and its compounds, is determined by
the likelihood of exposure and the form of mercury present. Methylmercury is the most
toxic and bioavailable mercury compound. It is formed primarily by microorganisms in soil,
sediment and water converting elemental mercury into methylmercury (RPA, 2002).
Methylmercury can be released from sediments back into the water column, where it
readily bioaccumulates and biomagnifies through the food chain (WHO, 2003). Low levels
of mercury in surface waters can lead to high concentrations in insects, fish and birds. This
results in very toxic contamination in parts of the ecosystem, especially in higher levels in
the food chain (Environment Agency, 2010).
Mercury is highly toxic to humans. Exposure, even to small amounts, may have toxic
effects on the nervous, digestive and immune systems, and on the lungs, kidneys, skin
and eyes (WHO, 2013). Methylmercury is particularly damaging to developing embryos,
which are five to ten times more sensitive than adults (USGS, 2000; WHO, 2013).
Human exposure to methylmercury is almost exclusively through consumption of
contaminated fish and shellfish. Commission Regulation 1881/2006, on setting maximum
levels for certain contaminants in foodstuffs, sets a threshold for the level of mercury in
fish intended for human health consumption.
EU maximum regulatory limits in food are set through a process that takes into account
actual occurrence data, supported by consumption guidance and advice from the
European Food Safety Authority (EFSA). Maximum limits exist for heavy metals such as
mercury in fish and shellfish.
For mercury, the maximum level is 0.5 milligrams per kilogram (mg/kg; wet weight) with a
higher threshold of 1mg/kg being set for specified larger fish such as tuna, pike and eel.
Current advice on safe consumption of fish and shellfish from the Food Standards Agency
with regards to mercury can be found in the Committee on toxicity of chemicals in food
consumer products and the environment (COT) statement following release of updated
guidelines in mercury in fish from the World Health Organisation.
The Water Framework Directive (WFD) 2008 Environmental Quality Standards Directive
(EQSD) (2008/105/EU) introduced the biota standard of 20 microgram per kilogram
(µg/kg) for mercury along with water column standards for the protection of wildlife. The
Directive was updated in 2013 (2013/39/EU), retaining the biota standard but clarifying
that it was set on the basis of levels in fish. The water column based annual average was
withdrawn.
Predators like otters and large fish are more sensitive to mercury via the food chain than
humans eating contaminated fish. For this reason the biota EQS for mercury is determined
6 of 38by risks to wildlife rather than risks to human health, and is more stringent than standards
for the human consumption of fish and shellfish.
The Shellfish Waters Directive (2006/113/EC) which previously included standards for
mercury in water was repealed at the end of 2013 by the Water Framework Directive
(WFD; 2000/60/EC). In 2016 the Water Environment (Water Framework Directive)
(England and Wales) Regulations 2003 (SI 2003/3242) were amended to ensure that the
protections provided by the Shellfish Water Directive continued (SI 2016/138). In 2017 this
legislation was repealed and replaced by the Water Environment (Water Framework
Directive) England and Wales Regulations (SI 2017/407).
Mercury and its compounds are classed as WFD priority hazardous substances because
they readily bioaccumulate and are highly toxic and persistent.
In October 2013, the UK became a signatory to the Minamata Convention on mercury.
This is a global treaty, which aims to protect human health and the environment from the
adverse effects of mercury. In May 2017, the Minamata Convention was ratified and
became legally binding for all its Parties (European Commission, 2017a). At the time the
UK signed the Minamata Convention, most of the requirements were met by existing EU
legislation. To address any gaps and enable ratification of the Minamata Convention, the
Mercury Regulation (EU/852/2017) was adopted by EU Member States.
The Government's 25 year environment plan sets out a commitment to reducing land-
based emissions of mercury to air and water by 50% by 2030 as part of its overarching
commitment to reducing the levels of harmful chemicals entering the environment.
The focus of this narrative is on contributing effects to and assessment of the condition of
surface waters in relation to mercury. However, the contribution that groundwater makes
to the surface water status failures is also considered as part of the WFD and the
Groundwater Directive (2006/118/EC as amended by 2014/80/EU). If groundwater
contributes more than 50% of the mercury load in any surface water status failure then the
groundwater body will also go to poor chemical status.
7 of 382. Use pattern
The single largest industrial use of mercury in England has been its use as an electrode in
the production of sodium hydroxide, chlorine and hydrogen by electrolysis, a process
known as chlor-alkali production. The revised EU Mercury Regulation (EU/852/2017)
prohibited the use of mercury in chlor-alkali production from December 2017.
Prior to the introduction of this ban, the single largest industrial use of mercury in England
was at a chlor-alkali plant located in the north west of England. It was used for the
continuous production of chlorine, sodium hydroxide and hydrogen by electrolysis of a
brine solution using ‘mercury cell’ technology. This use was required to cease by
December 2017 and was replaced by a membrane process which does not involve the
use of mercury. The use of mercury for chlor-alkali production has now ceased at this
plant. The mercury from this site has now been converted back to the original form it was
refined from and has been sent for permanent deep, underground storage.
In addition to its industrial uses, mercury has had many product applications. A major use
of metallic mercury has been in dental amalgam fillings. Demand for mercury amalgam in
dental fillings has decreased in recent years because of improvements in oral health, use
of alternative materials, and the adoption of minimally invasive dentistry practices (BDIA,
2015).
The Mercury Regulation (EU/852/2017) places restrictions on the use of dental amalgam
including banning the use of dental amalgam for dental treatment of deciduous teeth, of
children under 15 years and of pregnant or breastfeeding women. Mercury dental
amalgam is now only permitted as pre-dosed capsules and there is an explicit requirement
for dental facilities to fit and maintain amalgam traps if they work with or extract mercury
amalgam.
Waste mercury-based amalgam is classified as hazardous waste and dental practices
must comply with the Hazardous Waste (England and Wales) Regulations (2011) under
which there is a duty of care to dispose of mercury contaminated waste via licensed
carriers and brokers. Further details are provided in Section 5.
Liquid mercury was used for many years in measuring devices such as thermometers,
barometers and blood pressure monitors, although these uses are now restricted.
Mercury has been used in electrical control and switching equipment such as thermostats
and tilt switches, and electrical and electronic equipment such as fluorescent lamps,
although its use is now prohibited, with a few exemptions.
Other uses have included batteries, cosmetics, wood preservatives, textile treatment
agents and anti-fouling agents for boat hulls, although the EU now prohibits or restricts
these.
A range of actions are being taken to reduce mercury levels in products or to phase out
mercury-containing products. These are mostly co-ordinated under the EU Mercury
Strategy and the Minamata Convention on mercury, with measures implemented in the EU
by the Mercury Regulation (EU/852/2017) (European Commission, 2016; European
Commission, 2017a, European Commission, 2018).
8 of 383. Emissions, sources and pathways
Mercury is released from natural reservoirs in the earth’s crust to the atmosphere through
volcanic and geological activity. There is a natural biogeochemical cycle of atmospheric
transport, deposition to land and water, and volatilization to the atmosphere. Emitted to the
atmosphere in its elemental form, atmospheric mercury travels worldwide before
deposition to land and water. Mercury continues to circulate between the atmosphere,
oceans and terrestrial system for centuries to millennia before it returns to deep-ocean
sediments (Selin, 2009).
Human activity has significantly increased the amount of mercury in the global cycle
principally through combustion of fossil fuels for power and heating, releasing mercury to
the atmosphere, and mining activities; artisanal and small scale gold mining and metal
production (Lambert et al, 2012). Figure 1 shows the main anthropogenic sources and
pathways of release of mercury and its compounds to surface waters. Figure 1.
Anthropogenic sources and pathways of mercury into the environment (Environment
Agency, 2015)
9 of 383.1 Atmospheric emissions - sources
The UK reports emissions information to meet various international and EU commitments.
Such data help provide a picture of important sources and trends over time. Further
information on the purpose of the emissions inventories mentioned in this section, as well
as the methodologies used to build them, can be found within the corresponding
references.
Data reported to the UK-Pollutant Release and Transfer register (UK-PRTR) show that
atmospheric releases of mercury are significantly greater than direct emissions to water.
The UK-PRTR reports that in 2016, the most recently reported year, almost twice as much
mercury was released to air (2703 kg) compared with reported releases to water (1266 kg)
from regulated industries. No releases of mercury to soil are reported by the UK-PRTR.
This is most probably a consequence of the UK-PRTR only reporting releases from
specified activities and installations which meet or exceed stated pollutant thresholds.
Thermal power plants and combustion installations are identified as the largest industrial
source emitters of mercury to the atmosphere. Other industrial processes with significant
atmospheric releases include cement production, nonferrous metal production, iron and
steel production, the chemical industry, and waste disposal through the incineration of
non-hazardous waste and hazardous waste.
The UK’s National Atmospheric Emissions Inventory (NAEI) provides further detail on
sources of mercury emissions to air and includes some emissions not captured by the UK-
PRTR.
Emissions of mercury to air by sector, as reported by the NAEI are illustrated in Figure 2.
Power stations are identified as contributing approximately 45% of the reported total load
(846 kg) from fuel combustion activities.
Figure 2. Emissions of mercury to air reported by sector in 2016. Numeric values in
brackets are load in kg. National Atmospheric Emissions Inventory (Environment Agency,
2019)
10 of 38Significant releases from waste incineration are also reported, with crematoria comprising
almost all the reported releases of mercury (593 kg) from this sector to air.
Metal production is the third most significant sector for atmospheric releases of mercury,
with foundries contributing slightly more than sinter production and electric arc furnaces.
3.2 Atmospheric emissions - trends over time
Over the past 50 years emissions of mercury to air have declined by 94% (NAEI, 2016;
Figure 3). This is a direct result of tighter regulatory controls and restrictions on mercury
use and releases. For example, improved controls on mercury cells and their replacement
by diaphragm or membrane cells, the decline in the use of coal, and tighter abatement
controls on waste incineration.
Figure 3. Mercury emissions to air, 1970 - 2016, National Atmospheric Emissions data
3.3 Emissions of mercury to water - sources
The UK-PRTR identifies thermal power plants and urban waste water treatment works as
the most significant industrial source emitters (106kg) of mercury to controlled waters in
England in 2016.
The inventory of emissions, discharges and losses of priority and priority hazardous
substances to surface waters is a formal requirement of the WFD under the 2008 EQSD
(2008/105/EC). The inventory was reported as part of the 2015 river basin management
plans. It will be updated in 2020 for publication as part of the river basin management
plans in December 2021.
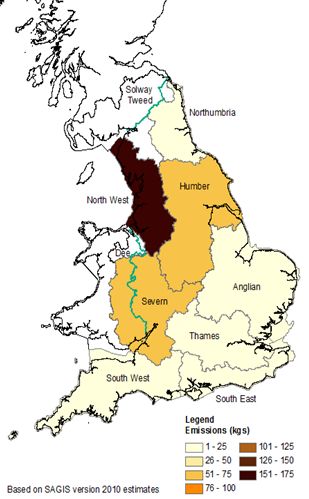
The inventory provides an estimate of emissions of mercury from both point and diffuse
sources to surface waters for the baseline reporting year (2010). Total emissions of
mercury to water per river basin district as reported in the baseline are shown in Figure 4.
Results for the Solway Tweed river basin district are reported by the Scottish
11 of 38Environmental Protection Agency and the Dee river basin district by Natural Resources
Wales.
Figure 4. Baseline year total emissions, discharges and losses to water for mercury for
each river basin district. Results for Solway Tweed are reported by the Scottish
Environmental Protection Agency and the Dee by Natural Resources Wales
12 of 38Estimates have been determined using SAGIS (Source Apportionment Geographic
Information System, v2010); a GIS based source apportionment tool and surface water
model (Comber et al., 2012) combined with estimates of releases to sea from long sewer
outfalls from the Pollution Inventory. The Pollution Inventory reports annual emissions of
certain substances to air, controlled waters and land, and off-site transfers from regulated
industries.
We estimate that approximately 385.4kg of mercury was released to surface waters in
England in 2010; 184.3kg from point sources and 201.1kg from diffuse sources.
Estimates of these emissions of mercury to water vary across river basin districts, ranging
from 11kg/yr in Northumbria to 156kg/yr in the North West.
Point source and diffuse emissions within each river basin district also vary. Point source
emissions range from approximately 5kg/yr in Northumbria to 126kg/yr in the North West.
Diffuse inputs range from 7kg/yr (Northumbria) to 54kg/yr (Humber).
Figure 5 shows modelled source apportionment of mercury emissions from different
sectors to water using modelled outputs from SAGIS (v2010).
Figure 5. Sectoral analysis of mercury emissions (kg/yr) as modelled by SAGIS v2010
(Environment Agency, 2015).
13 of 38Of the total mercury load released to water, the modelled results suggest industrial
discharges contribute the largest proportion of the load (128kg/yr), closely followed by
background/ambient discharges (126kg/yr), and then urban run-off (66kg/yr) and waste
water treatment works (WwTWs) (40kg/yr).
WwTWs are a direct pathway, but not the primary source, of the mercury they release to
the aqueous environment. We anticipate that the gradual abrasion of dental amalgam and
the fraction of waste amalgam that escapes recovery at dental surgeries may also
contribute to the diffuse mercury load in waste water received by WwTWs (WRC, 2009).
Monitoring of WwTW influent and final treated effluent as part of the first Chemical
Investigations Programme (CIP) (UKWIR, 2014a, 2014b) suggests that mercury is not
readily removed during waste water treatment processes. Removal rates of less than 50%
were reported (Gardener et al., 2013).
Monitoring of WwTW final treated effluent as part of the CIP demonstrated that mercury is
generally found at low levels, suggesting that inputs to sewers are generally low. At two
sites, higher concentrations of mercury were detected in the WwTW effluent although in
these instances the source was considered to be associated with a specific local point
source (UKWIR, 2014a, 2014b).
At a local scale, the significance of different sources as contributors to the total mercury
load will vary according to land use, local industry, population density and degree of
historical contamination. For example, in contrast to the sectoral source apportionment
described above (Figure 5), which identified background and ambient, as well as industrial
inputs as the most significant sources at a national scale, Chon et al. (2012a) identified
urban run-off as the most significant source of mercury runoff (47% of total load) in a study
to assess the relative contribution of WwTWs to levels of metals in receiving waters in the
Yorkshire Aire-Calder catchment.
Discrepancies between the SAGIS sectoral breakdown and sectoral emissions reported by
the Pollution Inventory reflect differences in estimating and reporting emissions. The
Pollution Inventory provides information about releases and transfers of substances from
regulated industrial activities. SAGIS is a modelled estimate capturing a wider range of
emissions such as atmospheric deposition. Both sources contain estimated values.
3.4 Emissions of mercury to water – trends over time
With only one year of data in the inventory of emissions we cannot yet describe any
temporal trends in emissions to water using this modelled data. The inventory of
emissions will be updated and published again as part of the 2021 river basin
management plans. However, mercury releases to controlled waters, as reported to the
Pollution Inventory – a subset of the UK-PRTR dataset - have been compiled at a river
basin district scale. We have used data from 2010 to 2017 as an interim emissions data
source to supplement the emissions inventory data described above in Section 3.3.
Mercury emissions to controlled waters from regulated industries have fluctuated year on
year between 2010 and 2017, but overall remained relatively constant, as illustrated below
in Figure 6.
14 of 38Figure 6. Total quantity of mercury released to controlled waters as reported by industry to
the Pollution Inventory.
15 of 384. Environmental monitoring data
As part of a programme of work to enable us to assess risks from persistent,
bioaccumulative and toxic (PBT) substances in England we have gathered data on
mercury residues in freshwater and saline biota from a surveillance network around
England.
Sampling for this programme began in 2014, with the saline monitoring building on an
existing OSPAR monitoring programme, established in 1999.
Monitoring of biota presents a number of challenges that are not encountered when we
sample water. These include animal welfare concerns, costs and problems accessing sites
with sufficient animals for analysis. This constrains the extent of the biota surveillance
programme compared with our water column monitoring programme.
The number of sites and their locations has varied year on year, although a subset of sites
have been consistently sampled for at least four years and can be used to start to explore
trends in concentrations over time (see Section 4.3).
We have compared our data against the biota Environmental Quality Standard (EQS) to
get an understanding of risk. The 2008 EQSD (2008/105/EU) introduced the biota
standard of 20µg/kg wet weight for mercury along with water column standards for the
protection of wildlife. The Directive was updated in 2013 (2013/39/EU) retaining the biota
standard but, where this could be monitored in any biota before, this has now been
clarified as applicable only in fish. The annual average water column standard is omitted
from the new Directive.
Sampling locations and mean measured mercury concentrations in freshwater and saline
fish are shown in Figure 7.
The mean measured concentration is based on the most recent three years of data where
available. Some sites have means generated from only 1 or 2 years' data.
We have compared this data against the biota based EQS for mercury (20µg/kg) as an
assessment of risk.
Mercury is found in measureable concentrations in biota at all locations. Concentrations
are variable between years and sites, but at several sites they are close to, either just
above or below, the EQS threshold and appear to fluctuate around this threshold over the
past 4 years.
4.1 Freshwater data
Between 2014 and 2018 we have sampled 70 freshwater sites for fish (roach 'Rutilus
rutilus' and chubb 'Squalius cephalus').
Concentrations of mercury reported here are those measured in whole fish. Values are
reported as wet weight for comparison with the EQS but have been normalised to a
standard dry weight of 26%. Normalisation of measured concentrations is a useful
approach in biota for allowing comparison of concentrations in samples from different
locations. The EC guidance document advises normalisation of measured concentrations
of mercury using a default dry weight factor of 26% for fish.
In freshwater fish, mean measured concentrations of mercury range from 13.7 to
237.5µg/kg.
Measured concentrations of mercury in fish are below the EQS at 14 out of 70 freshwater
sites (20%), although the concentrations below the EQS are close to the threshold in biota
16 of 38of 20 µg/kg. The biota EQS value is close to background environmental concentrations
and this fluctuation probably reflects influences such as re-release of mercury from
historically contaminated sediment. The results are summarised in Table 1.
Table 1. A summary of mercury concentrations in freshwater and saline fish and mussels
(‘Mytilus edulis’) from saline waters. Fish data are reported as wet weight, normalised
values; mussel data are reported as wet weight, no normalisation
No. of sites No. of sites Concentration
mercury mercury range
Sample type
concentration is concentration is (µg/kg)
below EQS biota above EQS biota
Freshwater, fish 14 56 13.7 - 237.5
Estuarine and 0 16 28.5 - 260
coastal waters, fish
Estuarine and 7 23 12.4 - 89
coastal waters,
mussels
The fish sampled are typically smaller than those likely to be consumed by humans, but
we report concentrations in those fish at “face value”. The European Commission (EC)
suggest transforming this data to estimate the concentrations that would occur in larger
fish representing a higher trophic level (EC, 2014). This transformation of the data allows a
harmonised view across the EU about levels observed in the different types and sizes of
fish but is subject to uncertainty because of uncertainties and variations in possible trophic
magnification factors. By reporting concentrations at ‘face value’ and not adjusting
concentrations to larger higher trophic level fish it is possible that concentrations of
chemicals that biomagnify in fish at a higher trophic status may be under estimated.
Residues of mercury in fish that we are measuring are comparable with data reported by
other monitoring programmes. For example, Rose et al. (2014) reported a similar
concentration range of 27 to 402µg/kg for mercury in whole fish sampled from UK
freshwaters; exceeding the EQS at all sites.
17 of 38Figure 7. Concentrations of mercury measured in freshwater fish (2014–2018) and saline
fish (2018) expressed as a wet weight normalised 3-year mean compared against the biota
EQS
4.2 Estuarine and coastal waters
18 of 38Although the biota standard is applicable in fish, Member States have the flexibility to
apply an EQS for an alternative matrix or biota taxon, for example the blue mussel 'Mytilus
edulis'. On this basis, and recognising the importance of the trend information that we
have been collecting since 1999, we have continued to sample mussels as part of our
saline waters sampling programme.
We have sampled both blue mussels ('Mytilus edulis' (30 sites)) from 2014 to 2018 and
fish (dab 'Limanda limanda' and flounder 'Platichthys flesus' (16 sites in 2018 only)) in
estuarine and coastal waters around England.
Concentrations measured in fish are not directly comparable with those measured in
mussels. Fish and bivalves represent different trophic levels in the food chain and an
adjustment factor is required to directly compare concentrations for an assessment of risk.
Unfortunately, despite ongoing investigation, no reliable trophic level adjustment factor is
currently available, so the data must be interpreted with this in mind. The concentrations
measured in mussels will be lower than the concentrations in fish because concentrations
of mercury will be greater in biota at higher trophic levels because of bioaccumulation.
All fish sampled had concentrations of mercury above the EQS threshold of 20µg/kg wet
weight.
Mean concentrations of mercury in whole fish ranged from 28.5µg/kg - 260µg/kg (wet
weight normalised. The highest concentrations measured in this small sampling
programme were found in fish from the Mersey estuary, Morecambe Bay and the Thames
estuary as shown in Figure 7.
Mean measured concentrations in the flesh of mussels ranged from 12.4µg/kg - 89µg/kg.
The highest mercury concentrations reported in mussel flesh are at a site on the north east
coast (Longhoughton) and two sites in the north west - Morecambe Bay and the Wyre
estuary. In the latter locations, residues of mercury in fish are also amongst the highest
we have observed.
Although there are currently few whole fish analyses carried out under our sampling
programme (2018 only) wider marine monitoring data collected as part of the UK Clean
Seas Environmental Monitoring Programme (CSEMP) under OSPAR reports a
comparable picture.
Elevated concentrations of mercury in fish flesh and mussels are reported in industrialised
estuaries, in particular the Thames and the Mersey estuaries. Elevated concentrations of
mercury in sediments sampled from industrialised estuaries such as the Tyne, Tees,
Thames, Severn and Mersey are also reported (HM Government, 2012).
CEFAS (2012) reported mercury concentrations in dab ('Limanda limanda') muscle tissue
ranging from 52 to 305µg/kg wet weight between 2006 and 2010 in coastal areas of
England and Wales. For England, elevated concentrations were recorded in the Tyne and
Humber areas and slightly less elevated values were given for the Eastern and Western
Channel. Concentrations were found to be more elevated in some waters adjacent to
industrialised estuaries.
There is no obvious association between the location of current industrial emissions
(Figure 6) and the results from our biota monitoring programme (Figure 7). This supports
the view that historical mercury contamination is likely to be an influence on environmental
trends and concentrations.
There is a growing body of evidence (OSPAR, 2017) to suggest that atmospheric sources
from non-OSPAR assessment countries contribute significantly to the total load of mercury
entering surface waters, together with re-suspension and release of mercury from
historically contaminated sediment.
19 of 38Further investigation is required to understand whether processes that lead to sediment
disturbance, such as an increased frequency of storm events as a consequence of climate
change or human activity such as dredging operations, are likely to lead to re-mobilisation
and release of mercury from historically contaminated sediments.4.2 Trends in freshwaters
We have limited monitoring data to assess and report on trends in mercury residues in the
freshwater environment.
Previously we have reported monitoring data on mercury concentrations in water (as
opposed to biota) for a large number of water bodies. The method used to assess values
reported below the limit of detection has changed over time as have sampling locations.
Because of this we have not been able to use this water column data to assess true
temporal trends.
We have analysed our historic freshwater sediment data for mercury (1991 to 2012) to
identify any trends in concentrations. It was not possible to discern any statistically
significant trends (Environment Agency, 2015).
As described in the previous section, we have been measuring mercury residues in biota
since 2014. Although sampling locations have changed over time, there are a number of
sites which we have consistently sampled. We have data on residues of mercury in fish
sampled from the same site for consecutive years from 2014 to 2018. Although these
data are limited, we can start to visually examine them for trends in residue levels.
We have 13 freshwater sites where we have collected four or more year's data on mercury
residues in fish. We have visually examined the data for trends rather than applying any
statistical analysis to the data because we do not yet have sufficient data. We will
continue to collect data on trends to enable further analysis in the future. Overall there is
no consistent and observable trend across sites. For the majority of sites there is no trend
or a flat trend. At two sites there is a possible increasing trend and at three sites a possible
decreasing trend.
4.4 Trends in saline waters
Under OSPAR, the Clean Seas Environment Monitoring Programme (CSEMP) has
collected data on concentrations of mercury in fish, sediment and mussel ('Mytilus edulis')
in saline waters since 1999. Data collected under this programme is collated for the
International Council for the Exploration of the Sea (ICES) and can be viewed using the
Database on Oceanography and Marine Ecosystems (DOME) web portal.
An overview of monitoring data for mercury assessed for trends through this programme,
within English territorial waters (within 12 nautical miles) for which the EQSD applies, is
given in Figure 8. The analysis as performed for the ICES show that data are very variable
with only a few sites exhibiting a statistically significant trend over the period 1999 to 2017.
Under the CSEMP fish ('Limanda limanda' and ‘Platichthys flesus’) muscle tissue has been
analysed for mercury from 17 sites around England. At 3 sites concentrations of mercury
in muscle tissue show a downward trend in concentrations over the reported period. These
are sites where historically we have observed elevated concentrations because of legacy
pressures.
20 of 38Figure 8. Monitoring and trends in concentrations of mercury in biota and sediment in
English coastal waters over the period from 1999 to 2017. Data accessed from ICES
Environmental database (DOME) ‘2018 OSPAR rollover assessment’. Downloaded May
2019; Chemical data for the OSPAR CSEMP, Reporting laboratory(s) via British
Oceanographic Data Centre (UK). ICES, Copenhagen
21 of 38There is an upward trend in mercury concentrations in fish sampled from 3 sites;
Morecambe Bay, Liverpool Bay and Inner Wash (Figure 8).
The strongest evidence base for a declining trend in mercury residues comes from
sampled mussels. Of the 13 sites assessed for trends, 5 sites in the North West,
Northumbria, Anglian and Thames river basin districts show a downward trend in mercury
residues over time. For 7 sites, there are no trends observed and at one site in Thames
there is a possible increasing trend in mercury residues in mussels. (Figure 8).
Interpretation of the data requires care as these site specific trends appear to be
substantially influenced by local, short-term conditions. For example, winter storms and
floods appear to have triggered elevated concentrations in the Tyne and Tees in 2014,
possibly because of resuspension of contaminated sediment, which can mask longer term
trends, although concentrations since 2014 have declined. At sites where there are limited
legacy pressures such as in the south west of England, no trend is detected. Levels at
these sites reflect current background concentrations seen across the North East Atlantic.
Data for mercury in sediment are also available under the same programme. Of the 6 sites
assessed for trend, one has declining mercury concentrations. For the remaining sites,
there are no trends observed (Figure 8).
22 of 385. Restrictions
There are numerous control measures for mercury emissions and restrictions for the use
of mercury in products.
The UK is a signatory to the Minamata Convention on mercury. This is a global treaty,
ratified in 2017, that aims to protect human health and the environment from the adverse
effects of mercury (United Nations, 2017 European Commission, 2017a). It bans a range
of activities and products with the aim of phasing out emissions of mercury.
The Convention entered into force on 16 August 2017. It limits and prohibits the use
mercury in industrial processes and in products from 2020. It requires phase out and
phase down of the use of mercury in several products and processes, control measures
on emissions to air and releases to land and water, and regulates the informal sector of
artisanal and small-scale gold mining.
The Convention introduced a ban on new mercury mines, the phase out of existing
mercury mines and control measures on air emissions. Amongst other obligations the
Convention also requires control of mercury emissions from industrial sources such as
coal fired power stations, phasing out of mercury use in products such as batteries and
measuring devices, phasing out the use of mercury in manufacturing processes such as
chlor-alkali manufacture, and controls over the supply and trade in mercury
The EU Mercury Regulation (EU/852/2017), implemented in the UK by the Control of
Mercury (Enforcement) Regulations 2017, bans the import into the EU and the export from
the EU of mercury, mercury compounds, mixtures of mercury and mercury added
products. The use of mercury or mercury compounds is prohibited in a number of
manufacturing processes from specified dates, including from 11 December 2017 for
chlor-alkali production in which mercury was used as an electrode.
The Regulation also sets requirements for the usage and storage of mercury, mercury
compounds and mixtures of mercury, as well as the management of mercury waste to
ensure protection of human health and the environment.
Since 2005 waste dental amalgam containing mercury has been classified as hazardous
waste under the Hazardous Waste Regulations (2008/98/EC), implemented in England by
the Waste (England & Wales) Regulations 2011. It requires disposal without endangering
human health and the environment. This means that waste dental amalgam cannot be
flushed down the drain and must be separated using an amalgam separator.
The EU Mercury Regulation (EU/852/2017) sets out stricter measures to reduce this
source. The use of dental amalgam in children under 15 years of age, and pregnant or
breastfeeding women, was restricted from July 2018. High performance filters, known as
amalgam separators, prevent water contamination by dental clinics became compulsory in
January 2019.
Amalgam wastes need to be handled by an authorised waste management establishment,
and dental practitioners must not to release mercury to the environment under any
circumstances. This regulation revoked and replaced the Mercury Export Ban (Regulation
EC/1102/2008) implemented in the UK by the Mercury Export and Data (Enforcement)
Regulations 2010.
The Battery Directive (2006/66/EC), implemented in the UK by The Batteries and
Accumulators (Placing on the Market) Regulations 2008, Waste Batteries and
Accumulators Regulations 2009, prohibits batteries and accumulators (rechargeable
batteries) being placed on the market if they contain more than 0.0005% of mercury by
weight. Military and space applications are exempt. The Directive also seeks to improve
23 of 38the environmental performance of batteries and accumulators and promotes the safe
production, use and disposal of batteries and accumulators by manufacturers, distributors,
end users and those involved in the treatment and recycling of waste batteries and
accumulators.
Annex XVII of the REACH Regulation (EC/1907/2006), implemented in the UK by the
REACH Enforcement Regulations 2008, has several entries relating to mercury
restrictions:
– Entry 18 – prohibits the placing on the market or use of mercury compounds for
antifouling of boats, as a wood preservative, impregnation of industrial textiles and
treatment of industrial waters (EC/552/2009)
– Entry 18a – since 2009 the placing on the market of measuring devices (thermometers,
sphygmomanometers, barometers) containing mercury intended for sale to the general
public has been prohibited, with few exceptions. After 10 April 2014 this ban was
extended to cover measuring devices containing mercury intended for industrial and
professional uses, with few exceptions (EC/847/2012).
– Entry 62 – prohibits the placing on the market or use of five phenylmercury compounds
from 10 October 2017 (EU 848/2012).
The Restriction of the use of certain Hazardous Substances (RoHS) in Electrical and
Electronic Equipment (EEE) Directive (2011/65/EU), implemented in the UK by the
Restriction of the Use of Certain Hazardous Substances in Electrical and Electronic
Equipment Regulations 2012, prohibits new electrical and electronic equipment containing
mercury at levels above 0.1 % from being placed on the market with the exception of
some fluorescent lamps.
The Industrial Emissions Directive (IED) (2010/75/EU), implemented in England by the
Environmental Permitting (England and Wales) (Amendment) Regulations 2013, aims to
minimise emissions of mercury and other substances from major industrial sources and
replaced a number of older directives. These sites require permits which place limits on
emissions. Emissions to air are addressed by the specific inclusion of mercury in the IED
as a substance requiring application of ‘best available techniques’ to minimise emissions.
Mercury is not approved for use in biocidal products under the Biocides Regulations
(EU/528/2012), implemented in the UK by the Biocidal Products and Chemicals
(Appointment of Authorities and Enforcement) Regulations 2013. Use of mercury in
cosmetic products is also prohibited under the Cosmetics Regulations (EC/1223/2009),
implemented in the UK by the Cosmetic Products Enforcement Regulations 2013, and for
many years prior to this under the preceding legislation.
24 of 386. Discussion
Mercury is a naturally occurring metallic element but concentrations in the environment
have increased because of anthropogenic activity. Mercury has the potential for global,
long range transport. Emissions, atmospheric transport and deposition of mercury are
therefore a global environmental issue.
In recent decades there have been significant efforts to reduce emissions and losses of
mercury to air and water. The UK is signatory to the Minamata Convention - a global
treaty, ratified in 2017. The Convention seeks to protect human health and the
environment from the adverse effects of mercury (United Nations, 2017 European
Commission, 2017a). It bans a range of activities and products containing mercury with
the aim of phasing out emissions of mercury.
A commitment to further reduce land-based emissions of mercury to air and water by 50%
by 2030 is set out in the Government's 25 year environment plan as part of its overarching
commitment to reducing the levels of harmful chemicals entering the environment.
We are already taking action to reduce emissions to land and water. The phase out of coal
in the UK energy mix is an important component of this, with an intent to move away from
coal fired power stations by 2027.
Atmospheric mercury inputs from background sources and from outside the OSPAR
Maritime Area are now greater than the combined waterborne and atmospheric emissions
of OSPAR countries around the Greater North Sea (OSPAR, 2017).
After coal fired power stations, the most significant source of mercury to air in England is
crematoria where progress has already been made to reduce emissions. Further progress
may be problematic because of technical and ethical considerations.
Further reductions in atmospheric emissions will primarily rely on the success of promoting
international action. Significant progress has been made towards achieving the OSPAR
objectives of reducing discharges, emissions and losses of hazardous substances in the
OSPAR maritime area to near background concentrations (OSPAR, 2017).
The major industrial use of mercury in chlor-alkali plant has now ceased and liquid
mercury has been converted to solid waste prior to export to Germany for secure disposal
in deep mines.
The British Dental Association's good practice quality assurance programme requires
dentists to have mercury separators to prevent releases of mercury to sewers.
The Environment Agency will continue to take enforcement action on illegal use. This will
help to disrupt the international market in mercury products.
Mercury emissions also arise from re-suspended material such as from historically
contaminated sediment and exposed soils. Knowledge gaps remain concerning the
retention and export of mercury in estuaries, limiting the knowledge of the proportion of
metals that reach the marine environment (OSPAR, 2017).
In previous river basin planning cycles, assessment of environmental concentrations
against the water column based annual average EQS, demonstrated a high degree of
compliance with the 2008 Environmental Quality Standards Directive (2008/105/EC) in
England. This water column based annual average standard was withdrawn in the
updated EQSD (2013/39/EU).
25 of 38In the 2021 River Basin Management Plans we will adopt a new approach, based on
robust evidence, to report compliance for substances that accumulate in animals and food
chains.
Whilst the majority of these substances are not a concern, mercury is ubiquitous in the
environment as a result of historic use and accumulates in sediment and biota. Our biota
monitoring programme shows mercury concentrations in fish and mussels are greater than
the relevant EQS threshold.
However, the levels observed in fish are well below the food regulatory limit for mercury in
fish and fisheries products and do not represent a risk to the human consumer providing
advice from the Food Standards Agency is followed.
Biota EQSs are set at levels intended to protect both aquatic wildlife and human health by
basing the EQS on the most sensitive receptor. EU maximum regulatory limits in food are
set through a separate process that takes into account actual occurrence data, supported
by consumption guidance and advice from the European Food Safety Authority (EFSA).
Maximum limits exist for heavy metals such as mercury in fish and shellfish.
For mercury, the most sensitive receptors used to derive the EQS are fish-eating wildlife
such as otters and birds, which consume a much greater proportion of fish as part of their
diet than humans. The levels observed in fish in English rivers and estuarine and coastal
waters are not exceptional compared to the rest of Europe or worldwide. Where levels are
above the EQS, there may be an increased risk to those animals taking and consuming
local fish. Despite this risk, otter populations are recovering.
Ensuring compliance with existing measures to reduce further emissions are important
elements in managing the issue of environmental mercury, but the success of this strategy
is likely to become apparent only over an extended period of time. Mercury cannot be
degraded over time. Local concentrations may even increase due to remobilisation from
land or sediment. Therefore it is difficult to accurately predict environmental trends
resulting from reductions in emissions.
26 of 38References
British Dental Industry Association (BDIA) (2015) Personal communication.
Brown, R. J. C.; Goddard, S. L.; Butterfield, D. M.; Brown, A. S.; Robins, C.; Mustoe, C. L.;
McGhee, E. A. (2015) Ten years of mercury measurement at urban and industrial air
quality monitoring stations in the UK. Atmospheric environment, 109: pp. 1-8.
Bundesamt für Umwelt, BAFU (2017) Substance flows in Swiss e-waste (Summary).
Federal Office for the Environment (FOEN), Bern, 2017 [online]. Available at:
https://www.bafu.admin.ch/bafu/en/home/topics/chemicals/publications-
studies/publications/stofffluesse-im-schweizer-elektronikschrott.html [Accessed 12
September 2018].
CEFAS 2012 Monitoring of the quality of the marine environment, 2008–2010. Sci. Ser.
Aquat. Environ. Monit. Rep., CEFAS Lowestoft, 63: 111pp Available at:
https://www.cefas.co.uk/publications/aquatic/aemr63.pdf
Centre for Environment, Fisheries and Aquaculture Science (CEFAS) (2012) Monitoring of
the quality of the marine environment, 2008–2010. Sci. Ser. Aquat. Environ. Monit. Rep.,
CEFAS Lowestoft, 63: pp 111.
Chon, H. S., Ohandja, D. G. and Voulvoulis, N. (2012a) Assessing the relative contribution
of wastewater treatment plants to levels of metals in receiving waters for catchment
management. Water, air, and soil pollution, 223(7): pp.3987-4006.
Chon, H. S., Ohandja, D. G. and Voulvoulis, N. (2012b). The role of sediments as a source
of metals in river catchments. Chemosphere, 88(10): pp.1250-1256.
Clean Air Act, 1968 (c.62) Great Britain. London: HMSO. Available at:
http://www.legislation.gov.uk/ukpga/1968/62/contents
Comber, S., Daldorph P., Gardner, M., Murrell, K., Smith R., Constantino, C., Buchanan,
L., Hasthorpe, J. and Mills, D. (2012) Chemical source apportionment under the WFD.
UKWIR WW02.
Commission Directive 2014/80/EU of 20 June 2014 amending Annex II to Directive
2006/118/EC of the European Parliament and of the Council on the protection of
groundwater against pollution and deterioration. Official Journal of the European Union pp.
L182/52. Available at https://eur-lex.europa.eu/legal-
content/EN/TXT/PDF/?uri=CELEX:32014L0080&from=EN [Accessed 20 August 2019].
Committee on toxicity of chemicals in food consumer products and the environment (COT)
2004. Statement following release of updated guidelines in mercury in fish from the World
Health Organisation [online]. Available at
http://cot.food.gov.uk/cotstatements/cotstatementsyrs/cotstatements2004/cotstatements20
04mercury [Accessed 16/7/2015]
Common Implementation Strategy for the Water Framework Directive (2000/60/EC)
Guidance Document No. 28 Technical Guidance on the Preparation of an Inventory of
Emissions, Discharges and Losses of Priority and Priority Hazardous Substances ISBN :
978-92-79-23823-9 doi : 10.2779/2764 Available at:
https://circabc.europa.eu/sd/a/6a3fb5a0-4dec-4fde-a69d-
5ac93dfbbadd/Guidance%20document%20n28.pdf
Department for Environment, Food & Rural Affairs (Defra) (2013) UK’s Pollutant Release
and Transfer Register [online]. Available at: http://prtr.defra.gov.uk/pollutant-releases-
details?type=2&view=summary&q=6881 [Accessed 18 May 2015].
27 of 38Directive 2000/60/EC of the European Parliament and of the Council of 23 October 2000
establishing a framework for Community action in the field of water policy [2000] Official
Journal of the European Communities [online] pp.L327/1-L327/72. Available at: http://eur-
lex.europa.eu/legal-content/EN/TXT/?uri=CELEX:32000L0060
Directive 2006/66/EC of the European Parliament and of the Council of 6 September 2006
on batteries and accumulators and waste batteries and accumulators and repealing
Directive 91/157/EEC [2006] Official Journal of the European Union [online] pp.L266/1-
L266/14. Available at: http://eur-lex.europa.eu/legal-
content/EN/TXT/PDF/?uri=CELEX:32006L0066&from=EN
Directive 2006/113/EC of the European Parliament and of the Council of
12 December 2006 on the quality required of shellfish waters [2006] Official Journal of the
European Union [online] pp.L376/14. Available at: http://eur-
lex.europa.eu/LexUriServ/LexUriServ.do?uri=CELEX:32006L0113:EN:HTML
Directive 2006/118/EC of the European Parliament and of the Council of 12 December
2006 on the protection of groundwater against pollution and deterioration. Official Journal
of the European Union pp. L372/19. Available at: https://eur-lex.europa.eu/legal-
content/EN/TXT/PDF/?uri=CELEX:02006L0118-20140711&from=EN [Accessed 20
August 2019].
Directive 2008/98/EC of the European Parliament and of the Council of 19 November
2008 on waste and repealing certain Directives [2008] Official Journal of the European
Union [online] pp.L312/3-L312/30. Available at: http://eur-
lex.europa.eu/LexUriServ/LexUriServ.do?uri=OJ:L:2008:312:0003:0030:en:PDF
Directive 2008/105/EC of the European Parliament and of the Council of 16 December
2008 on environmental quality standards in the field of water policy, amending and
subsequently repealing Council Directives 82/176/EEC, 83/513/EEC, 84/156/EEC,
84/491/EEC, 86/280/EEC and amending Directive 2000/60/EC of the European
Parliament and of the Council [2008] Official Journal of the European Union [online]
pp.L348/84-L348/97. Available at: http://ec.europa.eu/environment/water/water-
dangersub/pri_substances.htm#dir_prior
Directive 2010/75/EU of the European Parliament and of the Council of 24 November
2010 on industrial emissions (integrated pollution prevention and control) (Recast) [2010]
Official Journal of the European Union [online] pp.L334/17-L334/119. Available at:
http://eur-lex.europa.eu/legal-content/EN/TXT/PDF/?uri=CELEX:32010L0075&from=EN
Directive 2011/65/EU of the European Parliament and of the Council of 8 June 2011 on
the restriction of the use of certain hazardous substances in electrical and electronic
equipment (recast) [2011] Official Journal of the European Union [online] pp.L174/88-
LL174/110. Available at: http://eur-lex.europa.eu/legal-
content/EN/TXT/PDF/?uri=CELEX:32011L0065&from=EN
Directive 2013/39/EU of the European Parliament and of the Council of 12 August 2013
amending Directives 2000/60/EC and 2008/105/EC as regards priority substances in the
field of water policy [2013] Official Journal of the European Union [online] pp.L226/1-
L226/17. Available at http://eur-lex.europa.eu/legal-
content/EN/TXT/PDF/?uri=CELEX:32013L0039&from=EN
Durnford, D., Dastoor, A., Figueras-Nieto, D. and Ryjkov, A. (2010) Long range transport
of mercury to the Arctic and across Canada. Atmospheric Chemistry and Physics [online]
10, pp. 6063–6086. Available at: http://www.atmos-chem-phys.net/10/6063/2010/acp-10-
6063-2010.pdf [Accessed 2 September 2015].
28 of 38You can also read