Disinfection of fresh recycled water with ultrasound at Dow Benelux B.V.
←
→
Page content transcription
If your browser does not render page correctly, please read the page content below
Disinfection of fresh recycled water with
          ultrasound at Dow Benelux B.V.

                              Final Thesis Report

                                               Bachelor of Water Management

                               Delta Academy, HZ University of Applied Sciences

Author
Daniel Ivanov

Supervisors
Guliz Talay
Niels Groot
Hans Cappon

25th April 2013
Vlissingen, The Netherlands
Version: 1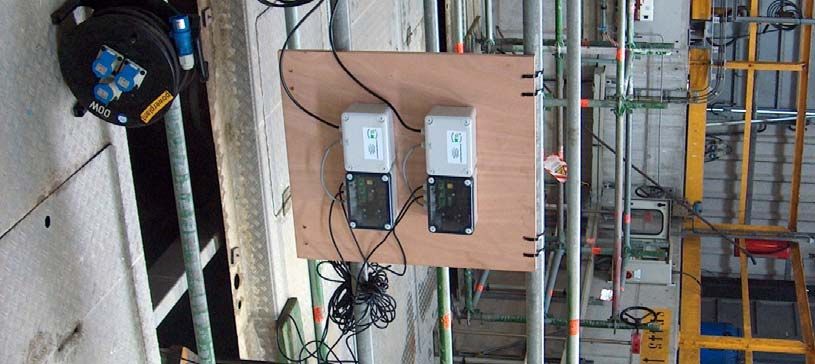
Disinfection of fresh recycled water with
             ultrasound at Dow Benelux B.V.

An ultrasound pilot test and evaluation of other possible techniques

                               Final Thesis Report
                                                            Graduation internship project
                                                          Bachelor of Water Management
                                                                           Delta Academy
                                                         HZ University of Applied Sciences

Author:      Daniel Ivanov, student (last/4th year)
             ivan0003@hz.nl / divanov@dow.com
             (+31) 0115673341; (+31) 0684034532
Supervisors: Guliz Talay, Process Engineer
             (Dow Benelux B.V., The Netherlands)
             gtalay@dow.com; (+31) 0115672046
             Niels Groot, Water Specialist
             (Dow Benelux B.V., The Netherlands)
             ckgroot@dow.com; (+31) 0115672759
             Hans Cappon, Researcher and Lecturer
             (HZ University of Applied Sciences, The Netherlands)
             hans.cappon@hz.nl; (+31) 0118489216
Duration:    28th Sep 2012 – 28th Feb 2013 (5 months)
Date:        25th April 2013
Location:    Vlissingen, The Netherlands
Version:     1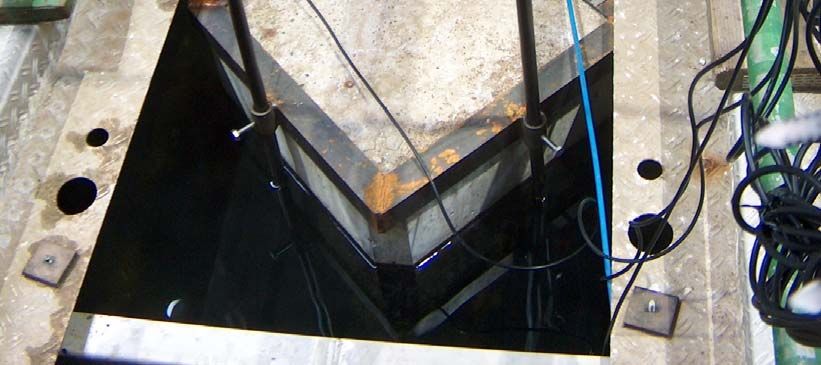
Final thesis internship report |Dow Benelux B.V.

Table of Contents
ABSTRACT                                                                  1
ACKNOWLEDGEMENTS                                                          2
NOMENCLATURE                                                              2
1.    INTRODUCTION                                                        3
2.    BACKGROUND                                                          5
     2.1.   LEGIONELLA BACTERIA AND LEGIONNAIRES’ DISEASE                 5
     2.2.   ULTRASOUND                                                    7
     2.3.   ULTRASOUND FOR LEGIONELLA DISINFECTION                        8
3.    MATERIALS AND METHODS                                               10
   3.1. MATERIALS                                                         10
   3.2. METHODS                                                           11
3.2.1. STAGE 0: INDUSTRIAL HYGIENE PROCEDURE                              11
3.2.2. STAGE 1: INSTALLATION OF THE ULTRASOUND EQUIPMENT                  11
3.2.3. STAGE 2: FREE RUNNING OF ULTRASOUND (CONDITIONING OF THE SYSTEM)   12
3.2.4. STAGE 3: TESTS AND SAMPLING                                        12
3.2.5. STAGE 4: ANALYSIS OF THE SAMPLES                                   15
4.    RESULTS                                                             16
   4.1. CONTINUOUS MODE                                                   16
4.1.1. LEGIONELLA CONCENTRATION                                           16
4.1.2. TOTAL BACTERIAL COUNT                                              17
4.1.3. ATP                                                                19
4.1.4. TURBIDITY                                                          20
   4.2. BURST MODE                                                        21
4.2.1. LEGIONELLA CONCENTRATION                                           21
4.2.2. TOTAL BACTERIA COUNT                                               22
4.2.3. ATP                                                                23
4.2.4. TURBIDITY                                                          24
   4.3. LEGIONELLA IN THE SAND FILTERS BIOFILM                            25
5.    DISCUSSION                                                          27
6.    CONCLUSION                                                          30
LITERATURE                                                                33
APPENDICES                                                                34
     APPENDIX A: CTS LINE                                                 34
     APPENDIX B: RESEARCH PLAN                                            36
     APPENDIX C: WORK SAFETY PROCEDURE                                    45
     APPENDIX D: SOUND PRESSURE LEVEL – MEASUREMENTS AND CALCULATIONS     48
     APPENDIX E: ULTRASOUND PILOT TEST INSTALLATION                       52
     APPENDIX F: BIOX SCHEMATIC DRAWING                                   55
     APPENDIX G: BIOX INFLUENT/EFFLUENT PARAMETERS DATA                   58
     APPENDIX G: CONTENTS OF THE CD‐ROM ATTACHMENT                        59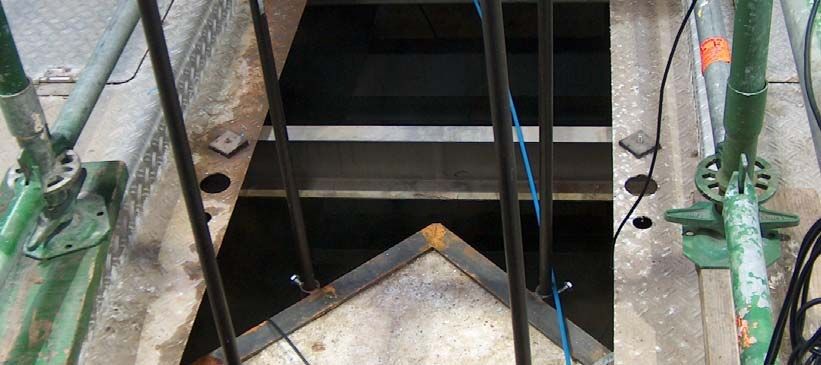
Final thesis internship report |Dow Benelux B.V.

TABLE OF FIGURES

TABLE 1: TYPICAL LEGIONELLA AND TOTAL BACTERIA CONCENTRATIONS IN THE BIOX EFFLUENT (AUG‐SEP’12) 4
TABLE 2: TESTS, NUMBER OF SAMPLES PER PARAMETER AND IN TOTAL .......................................................... 14
TABLE 3: SAMPLING SCHEDULE ......................................................................................................................... 14
TABLE 4: TYPICAL BACTERIAL CONCENTRATIONS FOR LEGIONELLA AND TOTAL BACTERIA ............................... 38
TABLE 5: TESTS, NUMBER OF SAMPLES PER PARAMETER AND IN TOTAL .......................................................... 41
TABLE 6: SAMPLING SCHEDULE ......................................................................................................................... 42
TABLE 7: TIME PLANNING OF THE PILOT TEST ................................................................................................... 44

FIGURE 1: LEGIONELLA PNEUMOPHILLA [1] ........................................................................................................ 5
FIGURE 2: FREQUENCY RANGES OF SOUND ABOVE HUMAN HEARING [2] .......................................................... 7
FIGURE 3: EXPLANATION FOR ACOUSTIC CAVITATION [2] ................................................................................... 7
FIGURE 4: ULTRASOUND EQUIPMENT “VAMSONIC” (TYPE VA‐2‐A+‐C2) ........................................................... 10
FIGURE 5: ORIENTATION OF THE US PROBES IN THE SAND FILTER PIT (VIEW FROM ABOVE) ............................ 11
FIGURE 6: ORIENTATION OF THE US PROBES IN THE SAND FILTER PIT (TOP‐VIEW) ........................................... 12
FIGURE 7: LEGIONELLA CONCENTRATION RESULTS ‐ ULTRASOUND IRRADIATION EFFECT IN CONTINUOUS
     MODE ...................................................................................................................................................... 16
FIGURE 8: TBC (TOTAL BACTERIAL COUNT) RESULTS ‐ ULTRASOUND IRRADIATION EFFECT IN CONTINUOUS
     MODE ...................................................................................................................................................... 18
FIGURE 9: ATP (ADENOSINE TRIPHOSPHATE) RESULTS ‐ ULTRASOUND IRRADIATION EFFECT IN CONTINUOUS
     MODE ...................................................................................................................................................... 19
FIGURE 10: TURBIDITY RESULTS ‐ ULTRASOUND IRRADIATION EFFECT IN CONTINUOUS MODE ....................... 20
FIGURE 11: LEGIONELLA CONCENTRATION RESULTS ‐ ULTRASOUND IRRADIATION EFFECT IN BURST MODE ... 21
FIGURE 12: TBC (TOTAL BACTERIAL COUNT) RESULTS ‐ ULTRASOUND IRRADIATION EFFECT IN BURST MODE . 22
FIGURE 13: ATP (ADENOSINE TRIPHOSPHATE) RESULTS ‐ ULTRASOUND IRRADIATION EFFECT IN BURST MODE
     ................................................................................................................................................................ 23
FIGURE 14: TURBIDITY RESULTS ‐ ULTRASOUND IRRADIATION EFFECT IN BURST MODE .................................. 24
FIGURE 15: A COMPARATIVE OVERVIEW OF THE LEGIONELLA CONCENTRATION DURING ALL DAYS OF
     EXPERIMENTS .......................................................................................................................................... 25
FIGURE 16: SUGGESTED PROGRESS SCHEME .................................................................................................... 31
FIGURE 17: CTS LINE.......................................................................................................................................... 35
FIGURE 18: ULTRASOUND EQUIPMENT ............................................................................................................. 39
FIGURE 19: ORIENTATION OF THE PROBES IN THE SAND FILTER PIT (VIEW FROM ABOVE) ............................... 40
FIGURE 20: VOLTAGE VS. TIME.......................................................................................................................... 51
FIGURE 21: ULTRASOUND PILOT TEST INSTALLATION (PROJECT ARCHIVE), PHOTO 1 ....................................... 52
FIGURE 22: ULTRASOUND PILOT TEST INSTALLATION (PROJECT ARCHIVE), PHOTO 2 ....................................... 53
FIGURE 23: ULTRASOUND PILOT TEST INSTALLATION (PROJECT ARCHIVE), PHOTO 3 ....................................... 54
FIGURE 24: BIOX SCHEMATIC DRAWING ........................................................................................................... 56
FIGURE 25: TEMPERATURE OF BIOX FRESH WATER EFFLUENT .......................................................................... 58
FIGURE 26: TOC OF BIOX FRESH WATER EFFLUENT ........................................................................................... 58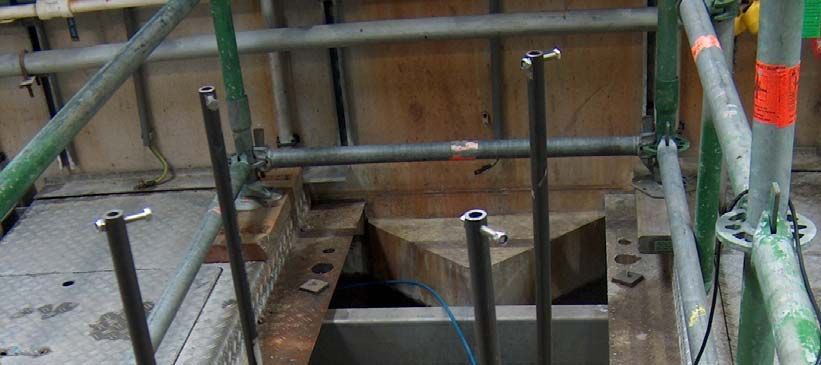
Final thesis internship report |Dow Benelux B.V.

Abstract
The vapour phase of industrial cooling towers is a potential site for the residence and spread
of Legionella bacteria, whose control and related legislation are a result of a growing
concern. In relation to sustainability goals for water reuse, an effluent fresh wastewater
stream at Dow Benelux B.V. in Terneuzen is recycled on site as cooling tower supply. Its
disinfection is the aim of this research and for that purpose pilot test was run with low‐
frequency ultrasound in the sand filters pit (final polishing step of the BIOX plant – WWTP
on site) treatment process. The study employed two electric powers – of 20 W and 250 W
(time‐averaged energy consumptions) converted into acoustic cavitation at 53 kHz in
continuous and burst mode, respectively, in a flow‐through system with an exposure time of
12‐15 min. Ultrasound did not show effectiveness against free‐flowing Legionella, but has
not been tested for its potential to kill intracellular Legionella in the biofilm, where it was
concluded the bacterial culture resides. Suggestions were given for future progress,
involving variations of system setup and lab/pilot tests for the rest of the disinfection
techniques in case ultrasound does not prove effective for Legionella at all.

Keywords: industrial wastewater recycling, Legionella disinfection, ultrasound, pilot test,
biofilm

                                               1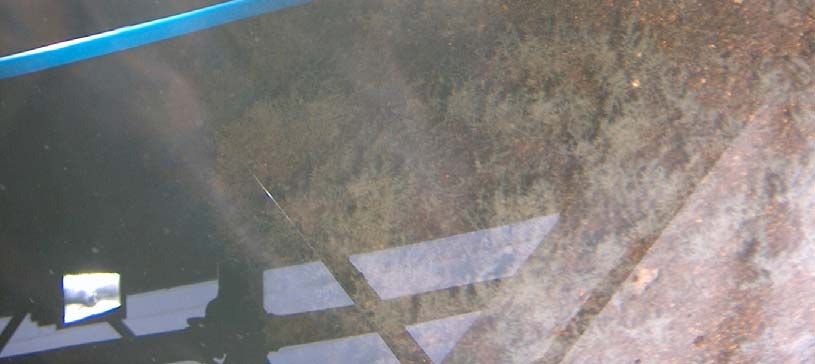
Final thesis internship report |Dow Benelux B.V.

Acknowledgements
During the 5‐month final thesis internship, the author gratefully appreciates the support and
feedback from the supervisory parties – Mr. Niels Groot at Dow Benelux B.V. and Mr. Hans
Cappon at HZ University of Applied Sciences, just as well as Mrs. Guliz Talay (in‐company
mentor). The regular meetings with all stakeholders involved (Niels Groot (Water
specialist/supervisor), Guliz Talay (Process Engineer/in‐company mentor), Niek van Belzen
(Analytical Leader), Gitta Zijlma (Improvements team), Leon van Miert (Power plant/BIOX)
and Carmen Huth (Improvements team)) have given rise to fruitful discussions and the
opportunity to hear from the experience and advice of each. I would like to thank my other
colleagues/interns who contributed to the pleasant time during the stay in Terneuzen.

Nomenclature
ADD           analytical department on site
BIOX          a conventional WWTP plant on site
cfu/l         colony‐forming units per liter
Conc.         concentration
CTS           cooling tower supply
dB            decibel value
DECO          a plant off‐site (Evides): adds surface water to the BIOX effluent and provides
              final polishing before it is sent back to Dow as CTS
kHz           kilohertz
LHC           light hydrocarbons, plants on site
SF US         sand filter where ultrasound is applied
SF ref        sand filter which is used as reference
SPL           sound pressure level
TBC           total bacterial count
US            ultrasound
UV            ultraviolet light
W             Watt

                                              2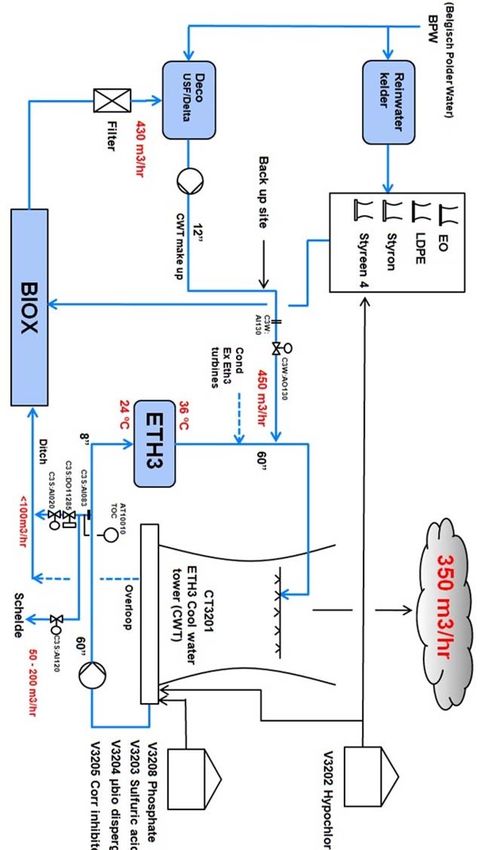
Final thesis internship report |Dow Benelux B.V.

1. Introduction
Organisation: The Dow Chemical Company is devoted to the production of a wide range of
products with a market focus on agriculture, consumer & lifestyle, energy and infrastructure
& transportation. Dow Benelux B.V. in Terneuzen (The Netherlands) is the company’s
second largest production site worldwide. Its industrial terrain has 18 plants busy mainly
with the production of ethylene, polyethylene, polyurethane and amines. Water is involved
in various plants’ processes like cooling, rinsing, cleansing and heating but is also used for
sanitary and household purposes. In total 60 000 m3 of water are used daily, while reusing
as much as possible. A biological water treatment plant (called BIOX) is present on site –
fresh and salt water are treated similarly but separately, where the fresh water effluent is
reused and the salt water effluent is discharged back into the Western Scheldt Estuary. In
2005 half of the purified fresh water was reused, and the expectations for 2015 are 95%
reuse (more than 2.5m m3). The fresh water effluent from the BIOX is recycled as cooling
tower supply (CTS) on site (see Appendix A: CTS line). Currently, there is only one cooling
tower (LHC‐3) using CTS water but in the future there will be more cooling towers
connected to the CTS line.
Legionella: In the design of the BIOX, no biocide treatment is applied for bacterial
disinfection on the fresh water effluent, more specifically for Legionella. Cooling towers
have their dedicated biocide treatment to control bio‐fouling and biological growth.
Although it has been successful over the past years, in 2011 there was a Legionella outbreak
on the LHC‐3 cooling tower. The root cause of the outbreak was concluded to be the high
concentration of Legionella bacteria in the BIOX effluent. It is not yet clear whether the
highly concentrated in Legionella bacteria wastewater was received at the BIOX from the
plants on site, or the Legionella bacteria has been brought and grown within the BIOX. Since
more than one cooling tower is planned to receive fresh treated wastewater for recycling in
the future, it is more convenient to apply disinfection treatment as a last step of the BIOX
ensuring low bacterial levels downstream.
Monitoring: Since 2011, the Legionella concentration has been measured weekly in both
BIOX influent and effluent. From experience, it was discovered that a concentration lower
than 30 000 cfu/L in the BIOX effluent can be accepted in the LHC‐3 cooling tower feed with
its current biocide treatment used. Based on internal observations (2011), maximum BIOX
effluent Legionella count is 100 000 cfu/L and minimum is 15 000 cfu/L, where the average
varies between 30 000 – 40 000 cfu/L. The desired Legionella count after disinfection
treatment is 3 000‐4 000 cfu/L, which implies a reduction rate of 1‐2 log would be sufficient.
Prospects: If, however, more cooling towers are connected to the CTS line in the future, it
will be more difficult to manage the Legionella concentration. Legionella control is required
for the BIOX effluent, the location of which could be either the effluent pit or the effluent
pipeline to DECO (a plant which adds treated surface water from the region to the BIOX
effluent and provides final polishing before transportation to the cooling tower for reuse).

                                              3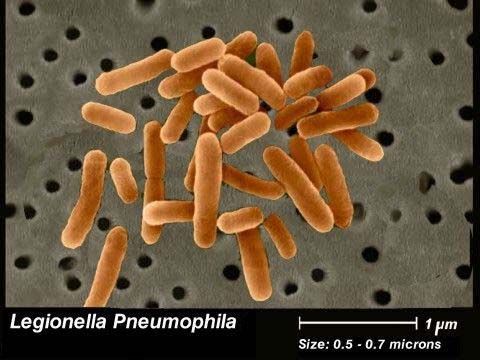
Final thesis internship report |Dow Benelux B.V.

Current progress: A preliminary study for possible treatment options has selected five
options to be considered in the current project – two physical treatments (ultrasound and
ultraviolet irradiation) and three chemical treatments (bleach, 2, 2‐dibromo‐3‐
nitrilopropionamide [DBNPA], ozone). Vendors have been contacted and proposals have
been received back for ultrasound, ultraviolet irradiation and ozone treatment. The goal of
the project is to run a pilot test for ultrasound, as a first step in the search for a suitable
Legionella treatment for the BIOX effluent based on cost, effectiveness and safety.
Project scope: The current final thesis internship project is part of the larger project
“Control of Legionella on the CTS line”. It includes: supporting the communication with
vendors who have given proposals about ultrasound pilot tests, settling on pilot test system
design and parameters, planning the installation of the system (at the sand filter pits in the
BIOX plant), performing the pilot test, scheduling samples, running analysis at ADD or
externally and communicating the results.
Aim/Hypothesis: “Decrease the Legionella concentration in the BIOX wastewater plant
effluent to less than 3000 – 4000 cfu/l by applying low frequency ultrasound in one of the
four sand filter pits. The typical bacterial concentrations of Legionella and Total bacteria are
given in Table 1 below.”
Table 1: Typical Legionella and Total bacteria concentrations in the BIOX effluent (Aug‐Sep’12)

                                     Low bact. period           High bact. period
               Min                                              15 000 cfu/l
Legionella     Avg (typical) 5 000 ‐ 10 000 cfu/l               30 000 ‐ 40 000 cfu/l
               Max                                              100 000 cfu/l
               Avg (typical) 500 cfu/ml
Total Bacteria
               Max           2000 cfu/ml

                                                            4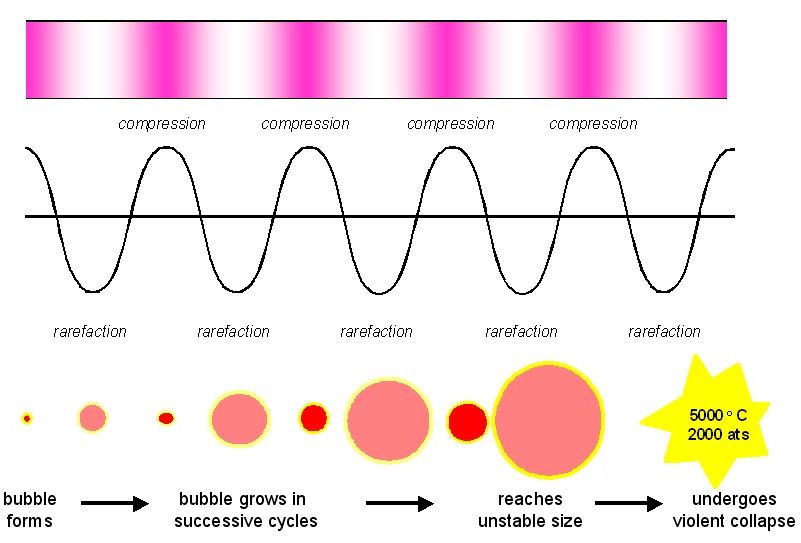
Final thesis internship report |Dow Benelux B.V.

2. Background
 2.1. Legionella bacteria and Legionnaires’ disease
L. pneumophila (Figure 1) is an inhabitant of
natural and man‐made aquatic environments,
surviving free, in biofilms, and as an
intracellular parasite of protozoa. This gram‐
negative bacterium is most notable as the
causative agent of Legionnaires’ disease, a
potentially fatal pneumonia. Thus, L.
Pneumophila represents the best‐understood
member of Legionella, a genus that contains
46 species (Cianciotto, 2001).                     Figure 1: Legionella Pneumophilla [1]

Legionnaires’ disease is a potentially fatal form of pneumonia which can affect anybody, but
which principally affects those who are susceptible because of age, illness,
immunosuppression, smoking etc. It is caused by the bacterium Legionella pneumophila and
related bacteria. Legionella bacteria can also cause less serious illnesses which are not fatal
or permanently debilitating. The collective term used to cover the group of diseases caused
by legionella bacteria is legionellosis (Health and Safety Commission UK, 2000).
The first major outbreak was in 1976 among participants of the American Legion Convention
in Philadelphia. The disease can be caught by inhaling small water droplets carrying the
bacteria which then travel to the lungs. Common symptoms are usually respiratory
difficulties, chest pain and fever, but if left untreated, it could result in death. Legionella
bacteria grow in aquatic environment with temperature of 25–45 °C and in nature they are
found in low concentrations in rivers and lakes. However, when in high concentration in a
water system they become a threat (World Health Organization, 2007). The maximum
temperature of the BIOX effluent is 35 °C which favours the growth of Legionella. The
effluent water is currently being reused on site as CTS for LHC‐3 cooling tower. If an
outbreak occurs at the BIOX, the contaminated water will be sent to the cooling tower
where the bacteria could get entrapped in the vapour.
Cooling towers can give rise to large outbreaks, because of their capacity to disperse
contaminated aerosols over long distances. A community‐wide outbreak of Legionnaires
disease occurred in Pas‐de‐Calais, France, in Nov’03–Jan’04 causing eighteen (21 %) fatal of
86 laboratory‐confirmed cases. A study showed that the dispersion extended over a
distance of at least 6 km from the aerosols‐producing plant (Nguyen et al., 2006).
During the last decade the percentage of elderly and immune compromised persons
significantly increased, leading to a higher number of people particularly susceptible to
Legionella infection (Declerck et al., 2010).

                                               5
Final thesis internship report |Dow Benelux B.V.
Nutrient rich water is the optimal environment for L. pneumophila to proliferate. Other
microorganisms allow Legionella to amplify and it grows better where nutrients are already
available in the water. The nutrients may be supplied, directly or indirectly, by other species
of bacteria or other associated microorganisms. Studies show that amino acids are the main
nutrient requirement for L. pneumophila growth (World Health Organization, 2007). The
Dow wastewater is highly nutrient rich, and apparently, provides the best living
environment for the bacteria in terms of “food” and temperature.
Because chlorine is easy to use and cost‐effective, chlorination is most frequently used as
biocide treatment for man‐made aquatic installations. However, a major drawback of
chlorine disinfection is the production of organic by‐products like trihalomethanes, which
are toxic, carcinogenic and mutagenic for mankind as well as the environment.
Environmental concern has led to the awareness that the use of toxic biocides, like chlorine,
should be replaced or reduced (Hulsmans et al., 2010).
6Final thesis internship report |Dow Benelux B.V.
2.2. Ultrasound
About a century ago was the first time when physical, chemical and biological effects of US
were observed and reported. US is the name for sound above the frequency the human ear
can detect – from 18 kHz up to 10MHz (Figure 2).
US can be divided into low
frequency power US (20 – 40
kHz) that is capable of
generating violent cavitation
bubbles (physical effect),
medium frequency US (300 kHz
– 1000 kHz) which provides less
violent cavitation but generates
greater amounts of hydroxyl
radicals •OH (chemical effect),
Figure 2: Frequency ranges of sound above human hearing [2] and high frequency US (2 MHz –
10 MHz) which is not powerful
enough to create neither violent bubble collapse, nor enough •OH and is thus used for
diagnostic and imaging purposes. Ultrasound produces its chemical effects through several
different physical mechanisms and the most important for sonochemistry is cavitation.
Cavitation is the formation of gas‐filled micro‐bubbles or cavities (small liquid‐free voids) in
a liquid, their growth and, under proper conditions, implosive collapse (Vajnhandl, 2005).
How does it work? (Figure 3)
1. US moves in a liquid,
forming cycles of
compression and expansion
of the molecules
2. the liquid is pulled apart
and cavities are formed
3. cavitation is a source of
high temperatures and
pressures which are released
into the bulk liquid when
they collapse (Ma, 2006).
Figure 3: Explanation for acoustic cavitation [2]
7Final thesis internship report |Dow Benelux B.V. 2.3. Ultrasound for Legionella disinfection Investigations by 1975 have shown that brief exposure to ultrasound caused a thinning of cell walls attributed to the freeing of the cytoplasmic membrane from the cell wall. The pressures produced on the cell membrane disrupt its structure and causes the cell wall to break down. Different species of microorganisms may be more susceptible to ultrasound treatment than others. It has been shown that in general, larger cells are more sensitive to ultrasound. The ultrasound devices used during the research project have been successfully used for algae control. Algae have a significantly larger cell size (starting from 1 μm: [3]) than Legionella cells (
Final thesis internship report |Dow Benelux B.V.

sufficiently protected by host cysts and that the intracellular replication of Legionella in
amoeba trophozoites has a significant positive effect on bacterial resistance towards
ultrasonic irradiation. It was suggested that further research is done so that ultrasound can
be used as a possible and valuable pretreatment in the chlorine disinfection process.
A false assumption is believed to be the reason for the lack of effective industrial scale‐up
for ultrasonics for large volumes treatments, namely that high power equipment, along with
long residence times were required. The vendor Ashland has obtained synergy by the
injection of air micro‐bubbles in the high‐frequency ultrasonic field of a new approach
allowed for large volume treatment capabilities and low residence time requirements, as
well as other industrial application opportunities. Models are available with continuous
water flow processing capability of up to 70 m3/h (Broekman et al., 2010).
Specifically low‐power ultrasound treatment does not provoke a direct cell lysis of the
bacteria. Instead, it is a delayed process that takes some time to reduce the microbial load
within the entire system. Existing biofilms are reduced and new biofilm development is
prevented. The reduction of highly troublesome biofilms, which can also harbor potential
pathogens like Legionella pneumophila, or can cause serious biocorrosion, is another
advantage of the ultrasonic water treatment technology. The Sonoxide ultrasonic treatment
technology (by Ashland) enables control of bacterial, algae and biofilms throughout an
entire industrial system – something not common with many other non‐chemical
microbiological control technologies. The Sonoxide technology is widely available and can
be found in over 600 applications worldwide (Broekman et al., 2010).

                                              9
Final thesis internship report |Dow Benelux B.V.
3. Materials and methods
The selection of several possible disinfection options has set ultrasound highest on the list
and it will be tested with a pilot. The vendor of ultrasound equipment VAM B.V. (Van
Antwerpen Milieutechniek B.V.) offered a proposal for a pilot. It was accepted after a
meeting with the vendor where specialists from various departments at Dow examined the
aspects of the equipment and the test, details about the installation and operation of the
equipment.
A research plan has been implemented to serve as guidance for the activities and actions
during the test, people involved and their tasks, and supported by methods and time
planning (see Appendix B: Research Plan).
3.1. Materials
One of the sand filter pits will be equipped
with two of the devices (total):
2 ultrasound generator boxes
4 ultrasound transducers.
The equipment (Figure 4) employs 230V in
the generator (control) box, but the
transducers work on 24 V, which comply with
general safety for electrical connections in
Figure 4: Ultrasound equipment “VAMsonic”
(type VA‐2‐A+‐C2)
relation to moist/water.
A test conducted in the beginning of the project to measure the frequency of the irradiated
ultrasonic signal showed 53 kHz as operating frequency. With a jumper located in the
control box it can be switched on either continuous or burst mode. The electrical power
converted into acoustic cavitation in continuous mode is around 20 W, while burst mode
creates peaks of about 250 W.
A BactiQUANT® was used to observe the total bacterial count (TBC) levels. The instrument is
certified by the US‐EPA and provides a rapid method for the measurement of TBC in water.
For the turbidity measurements, an instant “2100P Turbiditimeter, HACH” was used.
10Final thesis internship report |Dow Benelux B.V.
3.2. Methods
The research comprised of the several stages which are described in detail below.
3.2.1. Stage 0: Industrial Hygiene procedure
Before the official order of the equipment, an “Industrial Hygiene” procedure (investigating
the potential health and safety risks and hazards) was required.
A condition from the Industrial Hygiene department before the equipment enters in use is
to perform a measurement for the sound pressure level (dB). This safety precaution will
secure safety and exclude the risk of human hearing loss/health damage during the pilot
test. The two instruments used were a hydrophone Reson TC 4013 and an oscilloscope
Voltcraft DSO‐2090, both borrowed externally (Hogeschool Zeeland) for measurements
after installation and prior to the test. A hydrophone converts a mechanical sound wave
underwater into an electrical signal, the voltage of which is later measured and analyzed by
an oscilloscope.
The vendor assures there is no chance the system would cause health problems or that the
device would reach RSL (received signal levels) of 80 dB in relation to the human threshold
over 8 hours. However, due to lack of data about the performance of the instrument from
the vendor, measurements for the sound pressure levels were performed after installation.
During the preparation of the pilot test a work safety procedure was prepared on request of
the Improvements team on site. Please find the document attached as Appendix C: Work
Safety Procedure.
The detailed explanation for the sound pressure level measurements was prepared for the
Industrial Hygiene department. It includes the method of taking measurements and the
calculation path leading to the SPL in air. Please find the Appendix D: Sound Pressure Level –
measurements and calculations.
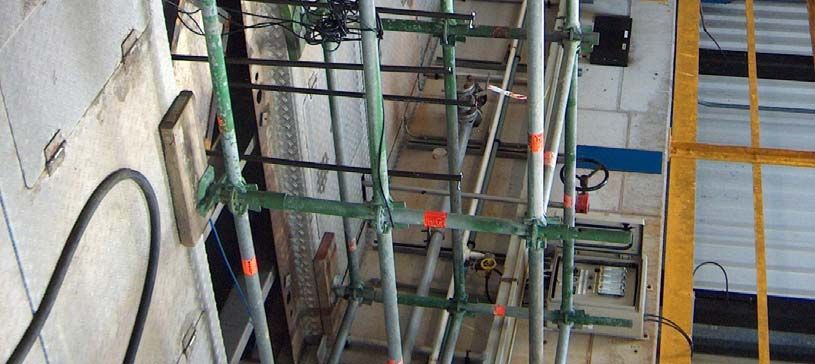
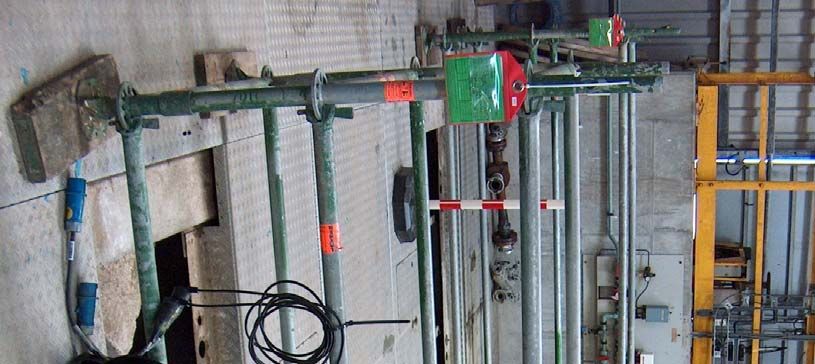
3.2.2. Stage 1: Installation of the
ultrasound equipment
The setup was checked by VAM B.V. to
confirm the correct installation of the
equipment, in order to eliminate mistakes in
the system and to secure its proper
placement according to the vendor’s
guidance. The generator (control) boxes
were attached to the scaffolding around the
pit. From there, water‐proof cables and
connections lead to the transducers
underwater in the pit. Figure 5: Orientation of the US probes in the sand filter pit
(view from above)
11Final thesis internship report |Dow Benelux B.V.
The sand filter pit where the ultrasound devices
were installed has dimensions of (l x w x h) 4 m x
4 m x 2 m. Figure 5 is a simplified schematic top‐
view of the system, where SF = sand filter unit,
US = ultrasound devices and column is the
central pillar. Figure 6 provides a schematic side‐
view of the sand filters pit with the ultrasound
devices installed. Metal poles were fixed to the
column and the probes were clamped in rubber
and hung down on them along the four walls of
the column at the middle depth – approximately
1 m from the bottom and 1 m from the surface. Figure 6: Orientation of the US probes in the sand filter
That way a maximum volume of water will be pit (top‐view)
irradiated by ultrasound without the
disturbance of obstacles on its way.
Photos of the installation in the sand filter pit are included in Appendix E: Ultrasound pilot
test installation.
3.2.3. Stage 2: Free running of ultrasound (conditioning of the system)
Explanation of this step is available in Appendix B: Research Plan.
The sand filtration step of the treatment process consists of 4 identical pits, one of which
was chosen for a test location (where the ultrasound transducers were installed) and one
was used for a reference. Before running the pilot test, a set of measurements were taken
to learn more about the relation between the two. It turned out that their different
efficiency is caused by the fact that the flow‐rates through the two are not always identical
and it often happens that one receives slightly higher volumes/loads than the other.
3.2.4. Stage 3: Tests and sampling
The ultrasound pilot test proves whether the resonance of acoustic cavitation is efficient for
the disinfection of Legionella by following the change in four parameters of the stream,
critical for drawing a conclusion. Those are:
Legionella concentration: the most important parameter as the final aim of the project
is to find an efficient Legionella bacteria disinfection method
Total Bacteria Count: the acoustic irradiation is supposed to break and destruct not
only Legionella’s cell membrane but those of other bacteria too
ATP: an indicator of cell material being released in the bulk liquid due to the broken
cell membranes of the bacterial cells
12Final thesis internship report |Dow Benelux B.V.
Turbidity: it shows whether the thick biofilm layer is affected by the ultrasound
(whether it detaches from the sand filter pit’s walls/pipes)
The ultrasound devices have two power modes:
Continuous: It transforms 20 W of electrical power into acoustic cavitation
Burst: It irradiates discontinuous ultrasonic signal with single peaks of up to 250 W of
electrical power transformed into acoustic cavitation
A scheme of the BIOX is available and is added as Appendix F: BIOX Schematic Drawing.
There are the three sampling points marked on it:
Inflow: Clarifier effluent (overflow) = sand filter pits influent (referred to as Clarifier)
Outflow: Sand filter effluent (overflow) = sand filter trough (referred to as SF US)
Reference: Sand filter (2) effluent (overflow) = sand filter trough (referred to as SF ref)
The inflow and outflow of the sand filter pit where ultrasound is applied were selected as
their difference will show its disinfection efficiency. The reference sand filter pit is identical
and parallel to the test pit.
The stream fluctuations were eliminated by taking samples on three different days. By doing
that, a more reliable picture for the ultrasound disinfection efficiency can be achieved. In
addition to that, all measurements are performed in triplicate except Legionella and ATP
which are in duplicate (too high costs due to external analysis of the samples).
Three dates of the experiments (below) for each power mode were selected to check what
the variance of the wastewater parameters is. Later that could be taken into account when
drawing conclusions from the collected data as a passing stream with high fluctuations
might be misleading. On each date a triplicate is performed, so the dates are independent
and the fact that they alternate is insignificant. During the days in between, the system was
left in place and working in the mode that would follow to be sampled. It is a flow‐through
system with a short retention time and if there is an effect of ultrasound it would be
achieved for that short time.
Continuous mode: 24th, 25th Jan and 4th Feb
Burst mode: 28th, 29th Jan and 5th Feb
Ordinary plastic sample bottles (3 L and 0.5 L) were used for samples collection. After that,
the volumes were transferred for the analysis of the 4 parameters separately, where
Legionella and ATP used external bottles (Aqualab). A check for the availability of the ADD
labs (facilities, reagents, instruments) and reservation were done in advance for the samples
analyzed externally, where Niek van Belzen (Business Analytical Leader) was contact person.
The number of samples goes as follows (Table 2):
13Final thesis internship report |Dow Benelux B.V.
Table 2: Tests, number of samples per parameter and in total
Modes Number of
Duplicate/ Total No.
Analysis Parameter (continuous tests Locations
Triplicate of samples
and burst) (reps)
External Legionella 2 3 3 x2 36
(Aqualab) ATP 2 3 3 x2 36
Internal TBC 2 3 3 x3 54
(at ADD) Turbidity 2 3 3 x3 54
The number of TBC and turbidity samples for analysis was not limited, but the Legionella
and ATP, which went external, cost a lot. Due to that fact, their total number was decreased
by doing duplicate analysis instead of triplicate (then total no. = 36).
Table 3: Sampling schedule
Sample Sample bottles
Date & Time Mode Locations
volume needed
8am 24 Jan Continuous 3 3.5L 3 x 1 L + 0.5 L
8am 25 Jan Burst 3 3.5L 3 x 1 L + 0.5 L
8am 28 Jan Continuous 3 3.5L 3 x 1 L + 0.5 L
8am 29 Jan Burst 3 3.5L 3 x 1 L + 0.5 L
8am 4 Feb Continuous 3 3.5L 3 x 1 L + 0.5 L
8am 5 Feb Burst 3 3.5L 3 x 1 L + 0.5 L
Explanation of Table 3:
‐ 3 times (different days) measurements for each radiation mode (continuous and burst);
‐ 3 locations (clarifier effluent overflow = sand filter influent, the sand filter effluent
overflow and the second sand filter = blank/reference)
‐ Sample volume = 3.5 L. The same volume was used for the analysis of all parameters.
After collection, the homogenized samples were divided for the different parameters
analysis.
‐ External lab bottles from Aqualab for Legionella (3 locations, in duplicate = 6 samples for
Legionella per day) and ATP (also 6 samples per day) were used.
The samples were collected in weeks 4 and 5 of Jan–Feb’13, where analysis for all 4
parameters (Legionella count, TBC, ATP and turbidity) followed right after. The extra 0.5 L
bottles contain samples from each day of experiments from each location, so that extra
analysis of physical parameters can be performed later, if necessary.
A diode light on the control box of the devices allowed easy monitoring of the ultrasound
equipment. The effect of ultrasound in the water was observed by an oscilloscope, this way
a check was made about whether there are points where little ultrasonic irradiation reaches
(corners/behind obstacles like sand filter columns and pipes).
14Final thesis internship report |Dow Benelux B.V.
3.2.5. Stage 4: Analysis of the samples
Training for the use of BactiQUANT® was given to the intern. The instrument provides a
rapid method for determination of the Total Bacteria Count in water. The Bactiquant®
method is based on a patented methodology that combines the benefits of concentrating
bacteria from a large volume of water on a filter, with the use of a highly sensitive
fluorescence technology. For turbidity measurements, a “2100P Turbidimeter, HACH” was
used.
Research planning overview is available in Appendix B: Research Plan.
15Final thesis internship report |Dow Benelux B.V.
4. Results
All results represent an average of a duplicate (for Legionella and ATP) or triplicate (for TBC
and turbidity) and are graphed by date. The value bars follow the sequence: Clarifier
(Clarifier) sand filter with ultrasound (SF US) and sand filter as reference (SF ref). The
error/deviation bars specify the highest and lowest values for the particular measurement.
The scale of the axes in the graphs is kept the same for both continuous and burst mode,
where the larger of the two has defined the y‐axis size for both.
4.1. Continuous mode
4.1.1. Legionella concentration
Legionella bacteria concentration is detected and quantified according to the culture
method in the Dutch standard NEN6265 (2007). Results were obtained in a week (culturing
time), living bacteria is measured only and the detection limit is 100 cfu/l [4].
Legionella (cfu/L)
3500
Clarifier
3000
SF US
2500
SF ref
2000
Conc.
(cfu/L)
1500
1000
500
0
24‐jan‐'13 25‐jan‐'13 4‐feb‐'13
Date
Figure 7: Legionella concentration results ‐ ultrasound irradiation effect in continuous mode
The first what attracts attention on the graph (Figure 7) are the consistent extremely low
concentrations of Legionella in the Clarifier (clarifier effluent = sand filters influent). During
all days of experiments, its concentration has been below the quantifiable limit 100 cfu/l.
From that can be clearly excluded that the current source of Legionella is a plant on site that
possibly discharges infected water, neither is it the clarifier, nor another treatment step
upstream. The sand filters location is thus where Legionella is grown and cultured. In
addition to that, the low retention time of 15 min is an indicator that the bacteria are not
present as free‐flowing, but rather cultured in the biofilm present on walls, pipes and all
other submerged surfaces not covered by sand.
16Final thesis internship report |Dow Benelux B.V.
If it is true that Legionella bacteria grow and are cultured only in the sand filters without its
source being upstream, it would imply that the BIOX and its influent stream are Legionella‐
free. That makes the controlling and maintaining of low Legionella concentrations an
smaller problem. The correct mixture of bacteria in the biological wastewater treatment
process is crucial for its efficiency and the presence of external bacteria could endanger the
performance of the whole BIOX.
The SF US shows significantly lower Legionella concentrations than the SF ref (Figure 7). Due
to the low bacterial period (seasonal drop in bacterial concentrations), it cannot be explicitly
concluded that it is an effect of the ultrasound irradiation. That could be a variation in the
system or between the two sand filters alone. The performance of the four identical sand
filters in the BIOX fluctuates constantly in relation to the performance and efficiency of the
whole wastewater treatment process at the BIOX plant.
It is often the case that Legionella bacteria grow inside other biofilm micro‐organisms,
where it is less susceptible to disinfection treatments (Declerk, et al., 2010).
The Legionella concentration was observed to gradually drop over the duration of
experiments. That suggests a possible longer‐term effect of ultrasound on the environment
and biofilm of the sand filters.
4.1.2. Total Bacterial Count
A BactiQUANT® was used to observe the total bacterial count (TBC) levels. The instrument is
certified by the US‐EPA and provides a rapid method for the measurement of TBC in water.
Samples results were obtained in less than 2 h time after their collection. The concentration
of TBC is expressed in dimensionless values, which are relative to the real concentration of
living total bacteria, usually expressed in cfu/ml. That allows a reliable comparison for the
TBC levels at the three sampling points.
17Final thesis internship report |Dow Benelux B.V.
TBC (rel.)
70000
Clarifier
60000
SF US
50000 SF ref
40000
Conc.
30000
20000
10000
0
24‐jan‐'13 25‐jan‐'13 4‐feb‐'13
Date
Figure 8: TBC (Total bacterial count) results ‐ ultrasound irradiation effect in continuous mode
The temperature influences the bacterial growth rates significantly, which makes the
performance of the BIOX weather‐dependent. On the dates 25th and 26th Jan the
temperatures outside were as low as ‐10°C. Therefore it is logical that the total bacterial
levels during those days are lower than the other days (Figure 8). Particularly on the 4th Feb
the results showed extremely high levels, due to a peak load in the influent water quality
from the plants on site.
The expectations for ultrasound were to affect all types of bacteria, not only Legionella, but
the SF US did not show any lower total bacterial levels than SF ref.
On the other hand, the results from the clarifier effluent show many times higher TBC levels
than the sand filter effluent which can be attributed to the floating flocs of bacteria (not
sunk to the bottom) in the clarifier that have been successfully removed by the sand filters
as suspended solids.
Apparently, the Legionella concentration and the TBC levels do not show a relationship.
There are two possible explanations. The first possibility is that Legionella resides in the
biofilm and other bacteria (TBC) do not. Analysis of the composition of the biofilm could
show whether that is the case or not. The second one is the low temperature outside – most
of the reaction vessels in the BIOX are located outdoors where they are under the influence
of weather conditions, while the sand filters area is covered and sheltered. Following the
logic, the rate of all wastewater treatment processes involving bacteria for the degradation
of biomass has dropped down significantly due to the low temperature. Moreover, there
has been more “food” left for Legionella because of the lower efficiency, which respectively
results in its temporary growth and increase in concentration in the sand filters (biofilm).
Although the temperature in the sand filters section was not measured during the
18Final thesis internship report |Dow Benelux B.V.
experiments, it varies mostly in the range 15 – 25 °C. To conclude, when there is lower total
bacterial activity/growth rate in the treatment process, Legionella concentrations increase,
implying a possible inverse relationship between the two. A similar event could be expected
from a larger volume of wastewater passing through the BIOX and making the existing
bacterial culture unable to degrade all organics leaving a remaining load forwarded via the
clarifier to the sand filters. The Legionella bacteria would be then provided with abundant
amounts of “food” too on which its culture can easily grow.
4.1.3. ATP
ATP (Adenosine triphosphate, coenzyme used as an energy carrier in the cells of all known
organisms) is an indicator of cell material being let out in the bulk liquid due to the broken
cell membranes of the bacterial cells. Samples results were obtained within 8 h after their
collection. The concentration of ATP is expressed in ng/l.
ATP (ng/L)
3500
Clarifier
3000
SF US
2500
SF ref
2000
Conc.
(ng/L)
1500
1000
500
0
24‐jan‐'13 25‐jan‐'13 4‐feb‐'13
Date
Figure 9: ATP (Adenosine triphosphate) results ‐ ultrasound irradiation effect in continuous mode
The ATP concentration in the SF US and SF ref remains the same for all days of experiments
(Figure 9). That suggests an even bacterial load to both sand filters and a similar efficiency
levels regarding suspended solids removal.
In the previous chapter (TBC) it was mentioned that on 4th Feb a larger discharge has been
recorded leading to lower retention times in all stages of treatment in the BIOX and
eventually causing lower efficiency of the whole treatment process (see TOC values on 4th
Feb: Appendix G: BIOX influent/effluent parameters data). That event can be noticed in the
ATP levels on the same day as well. Respectively, the sand filtration step has experienced
lower efficiency (percentage of suspended solids removed), which is shown in Figure 9 as
the ATP level of the SF US/SF ref effluent being closer to the Clarifier effluent.
19Final thesis internship report |Dow Benelux B.V.
The idea for ATP analysis was based on observing the destruction of cells by measuring the
ATP levels in the bulk liquid. In contrast with the intention, it seems like the measured ATP is
the extracellular (in the bulk liquid) ATP plus the intracellular (in the cells of the
microorganisms) ATP. The significantly higher levels of ATP in the clarifier in comparison
with those from the sand filters have two possible causes. The first is that high TBC levels in
a stream influence the ATP greatly by constantly dying bacteria which then releases ATP.
The second possibility is that TBC (carrying high intracellular ATP, which composites the ATP
together with the extracellular ATP) decreases after sand filtration where high
concentration of suspended solids (the not sunk flocs of bacteria from the clarifier) is
decreased. In either case, the ATP measurement loses its initial intention of observing the
destruction of bacterial cells.
4.1.4. Turbidity
The turbidity is a measurement used to observe possible effect of the ultrasound irradiation
on the thick (often up to 2‐3 cm) biofilm layer. As a result from the ultrasonic irradiation, the
biofilm could detach from the underwater surfaces in the sand filter pit, leading to an
increase in turbidity (suspended solids/material). Before the experiments, it was unknown if
that would ever happen and on what time scale but since the system was left running for
about 2‐3 weeks it was decided to measure turbidity as a possible indicator if biofilm falling
off. Samples results were obtained immediately after their collection and turbidity is
expressed in NTU (Nephelometric Turbidity Units). “2100P Turbidimeter, HACH” was the
mobile device that was used for the turbidity measurements during the experiments.
Turbidity (NTU)
4.00
Clarifier
3.50
SF US
3.00
SF ref
2.50
Conc.
2.00
(NTU)
1.50
1.00
0.50
0.00
24‐jan‐'13 25‐jan‐'13 4‐feb‐'13
Date
Figure 10: Turbidity results ‐ ultrasound irradiation effect in continuous mode
As an indicator of the availability of suspended solids in the water, the turbidity
measurements in Figure 10 are significantly higher for the clarifier effluent than those after
20Final thesis internship report |Dow Benelux B.V.
the sand filtration in SF US and SF ref. That is a logical observation when taking into account
that the sand filters remove a significant amount of the suspended solids.
The turbidity has similar values on the different days in both SF US and SF ref, suggesting no
effect of ultrasound on detachment of biofilm. In the previous sections, the 4th Feb was
associated with a significantly higher discharge through the entire BIOX plant. Therefore, the
more “averaged” values from all sampling points on that day could be attributed to the
lower efficiency of the sand filters and the more diluted main stream.
4.2. Burst mode
4.2.1. Legionella concentration
Legionella (cfu/L)
3500
Clarifier
3000
SF US
2500
SF ref
2000
Conc.
(cfu/L)
1500
1000
500
0
28‐jan‐'13 29‐jan‐'13 5‐feb‐'13
Date
Figure 11: Legionella concentration results ‐ ultrasound irradiation effect in burst mode
In accordance with the first set of experiments where ultrasound was applied in continuous
mode, the inflow Legionella concentration from the clarifier during all burst mode
experiments again does not exceed the minimum detection limit of 100 cfu/l. Figure 11
shows that during the whole set of tests, the Legionella concentration was very low, for
which there are two possible explanations. The first says the low temperature outside is the
reason for the unusually low bacterial period. The second suggests a more interesting
reason – the ultrasonic irradiation might have a longer‐term (in the matter of days, not the
retention time of 15 min in the sand filter) effect on the Legionella culture in the biofilm,
where it most probably resides. At those dates of experiments the ultrasonic transducers
have been working on both modes for more than a week already. However, it cannot be
concluded that ultrasound is effective for the control of Legionella, since this might be just
an extreme seasonal drop of bacterial concentration. In order to confirm that, a new set of
extra experiments must be run. Then if observations show the same low levels of Legionella
that would certainly speak for an effect of ultrasound on Legionella bacteria in the biofilm.
21Final thesis internship report |Dow Benelux B.V.
4.2.2. Total Bacteria Count
TBC (rel.)
70000
Clarifier
60000
SF US
50000
SF ref
40000
Conc.
30000
20000
10000
0
28‐jan‐'13 29‐jan‐'13 5‐feb‐'13
Date
Figure 12: TBC (Total bacterial count) results ‐ ultrasound irradiation effect in burst mode
The results for TBC from the experiments where ultrasound was applied in burst mode
(Figure 12) follow the same pattern as for continuous mode. Again, the clarifier effluent
contains not sunk bacterial flocs that cause the high TBC values measured at that sampling
point. The next step of the treatment (the sand filtration) is where those flocs are removed,
which is proven by the lower TBC measurements for SF US and SF ref, standing for the sand
filtration effluent.
Same as in continuous irradiation mode, no difference in TBC levels in favour of SF US was
observed, which concludes that burst mode has no better effect on TBC in comparison with
continuous mode. Besides that, similar suspended solids (consisting of flocs of bacteria
mainly) removal efficiency is achieved with the sand filters.
22Final thesis internship report |Dow Benelux B.V.
4.2.3. ATP
ATP (ng/L)
4000
Clarifier
3500
SF US
3000
SF ref
2500
Conc.
2000
(ng/L)
1500
1000
500
0
28‐jan‐'13 29‐jan‐'13 5‐feb‐'13
Date
Figure 13: ATP (Adenosine triphosphate) results ‐ ultrasound irradiation effect in burst mode
Slightly higher ATP concentrations have been observed in the SF US in comparison with SF
ref for the burst mode irradiation (Figure 13). It is true that burst mode has created higher
power peaks. However, the results are not consistent and thus not sufficient to draw the
conclusion that burst mode has a better effect on cell destruction (measured by ATP) than
continuous mode.
The higher ATP levels from the clarifier are caused by the same as in continuous mode.
Apparently the ATP analysis included intracellular and extracellular ATP, instead of
extracellular alone, causing flocs of bacteria from the clarifier to contribute for the high ATP
levels.
The BIOX plant overall efficiency influences the efficiency of the sand filters step
tremendously. On the 5th Feb, a higher discharge rate and/or heavier load have been the
reason for the closer to the influent values from the sand filters and the significantly higher
ATP levels than the rest of the days.
23Final thesis internship report |Dow Benelux B.V.
4.2.4. Turbidity
Turbidity (NTU)
3.50
3.00 Clarifier
SF US
2.50
SF ref
2.00
Conc.
(NTU)
1.50
1.00
0.50
0.00
28‐jan‐'13 29‐jan‐'13 5‐feb‐'13
Date
Figure 14: Turbidity results ‐ ultrasound irradiation effect in burst mode
The turbidity levels for all sampling points from the continuous mode of ultrasonic
irradiation are in conformity with the turbidity levels from burst mode (Figure 14 and Figure
10). Both sand filters show identical efficiency ratios with the clarifier, meaning that there is
analogical suspended solids removal efficiency.
Besides that, a higher turbidity in favour of the SF US has not been observed, which
concludes ultrasound is not effective for biofilm removal with the current powers applied,
volumes and system setup. The measurements made on 4th and 5th of February both show
higher turbidity that is related to the higher discharge during those days (other parameters
were influenced respectively as well). Although, it does not refute that ultrasound has an
effect on the biofilm. A possible explanation is that ultrasound is not able to detach the
biofilm from the underwater surfaces in the sand filters pits, but it has a longer term effect
on cultures of intracellular Legionella bacteria.
24Final thesis internship report |Dow Benelux B.V.
4.3. Legionella in the sand filters biofilm
Legionella (cfu/L)
3000
Clarifier
2500
SF US
2000
SF ref
Conc.
1500
(cfu/l)
1000
500
0
24‐jan‐'13 25‐jan‐'13 28‐jan‐'13 29‐jan‐'13 4‐feb‐'13 5‐feb‐'13
Date
Figure 15: A comparative overview of the Legionella concentration during all days of experiments
Along the course of experiments in this research, the Legionella concentration has been
measured on 6 different days and at 3 sampling locations (Figure 15). In the previous results
sections for continuous mode, it was mentioned that all Legionella samples taken from the
clarifier effluent have shown concentrations lower than the detectable limit (Final thesis internship report |Dow Benelux B.V.
measurements and a downscale of the setup size to clearly prove US as efficient or not, and
the application of other disinfection techniques on lab/pilot scale.
26Final thesis internship report |Dow Benelux B.V.
5. Discussion
This final thesis research assignment is a part of the larger project “Control of Legionella on
CTS line”. The purchase, installation and running pilot test ultrasonic equipment were
included in the assignment. Ultrasound irradiation was applied in both continuous and burst
mode in the sand filtration pits of the BIOX plant for the disinfection of Legionella bacteria.
The sand filtration step of the treatment process consists of 4 identical pits, one of which
was chosen for a test location (where the ultrasound transducers were installed) and one
was used for a reference. Before running the pilot test, a set of measurements were taken
to learn more about the relation between the two. It turned out that their different
efficiency is caused by the fact that the flow‐rates through the two are not always identical
and it often happens that one receives slightly higher volumes/loads than the other. After
all, the retention time of about 15min is correct but is not absolute, and it is mostly around
that value depending on the discharge inflow. That suggests that a comparison for the
results from the two would not be truly reliable, but rather relative. Although, the ranges of
the results are often the same, it allows referring to each other to explain strange events or
weird values.
The ultrasonic irradiation as it is in the current setup has shown little or no effect. There are
a number of possible reasons for that (followed by explanation below):
Insufficient power/volume ratio
Too short exposure time / retention time (flow‐rate)
Cell destruction occurs at a certain frequency only
Low temperatures causing low bacterial activity and low BIOX aeration tank
(carousel) performance
Longer term irradiation effect on biofilm
Wrong principle / setup, incomplete analysis, other key parameters not measured
The pilot test system setup was built on a full‐scale real size as it would be applied for a
complete disinfection solution. After little or no effect was observed, it raised the question
whether the problem is in the power/volume ratio. Four transducers used an electric power
converted into acoustic cavitation of 20 W / 250 W (continuous mode/burst mode) for a
volume of 32 m3 water. A possible explanation is that sound deadening of the ultrasonic
irradiation occurs by obstacles underwater like the sand filter columns, pipes, and the lack
of sound reflection, leading to a smaller volume of water receiving the destructive sound
waves. In the next chapter, a downscale is suggested, where a smaller reaction vessel is
employed (see chapter 6.Conclusion) where the volume is significantly decreased resulting
in a higher percentage of water irradiated with the intended power. Literature also suggests
that the sonication of smaller volumes produces more rapid kills (Mahvi, 2009).
The retention time of the sand filter pits is not longer than 15 min. A large volume of water
passing for a too short time to allow the ultrasound to destruct the bacterial cell membrane
is the second possible reason for the achieved results. As mentioned in the previous
27Final thesis internship report |Dow Benelux B.V.
paragraph, a recommendation is made for a “bucket test” will be planned where the flow‐
rate can be adjusted. Besides frequency and power, irradiation time is a major factor that
affects the disinfection efficiency of ultrasound (Antoniadis et al., 2007; Hulsmans et al.,
2010), so a “bucket test” will create an environment with different exposure time /
retention time.
The ultrasound employed during the pilot test is at a frequency of 53 kHz double‐checked by
oscilloscope measurements (Appendix D: Sound Pressure Level – measurements and
calculations). Under ultrasonic irradiation, the readiness to break a microorganism’s cell
membrane depends on the size of its cell (Earnshaw et al., 1995). Therefore, the next
possible explanation for little or low effect is based on the ultrasonic frequency applied. A
different frequency might be more appropriate particularly for the fatigue and destruction
of the Legionella cell membrane. It must be noted that the best frequency lies in the range
of 20 kHz to 100 kHz, where the most violent collapses occur.
The low temperatures outside have an influence on the performance of the whole BIOX
plant because its efficiency is based on bacterial activity. Therefore, the concentrations of
Legionella in the system were also measured to be lower than usual. When running tests for
the disinfection of bacteria whose concentration is low then it is not possible to draw
objective conclusions. The effect of the irradiation might be easier to detect and more
noticeable while a higher concentration of the bacteria is under irradiation. Therefore, more
tests during higher bacterial periods are suggested in the next chapter 6.Conclusion in order
to confirm or reject the effect of ultrasound for the disinfection of Legionella.
In the section 4.Results, an interesting phenomenon was discussed – a longer‐term effect (in
days, not 15 min flow‐through only) of ultrasound on the Legionella culture in the biofilm,
which is its most probable location of residence. The bacteria is famous for its preference to
stay in biofilms in water systems, but the gradually lower concentrations in the sand filters
might simply attributed to a seasonal extremely low bacterial period. Therefore, from the
current results it cannot be concluded that ultrasound is effective for the control of
Legionella in biofilm. Extra measurements would allow proving whether it is a reliable
technique to keep the Legionella concentrations low in water systems. Literature says that
ultrasound from the low‐to‐middle frequency range 20 kHz – 350 kHz with power of 35–40
W has been used to tackle biofilms, although these systems were limited to small areas and
have not found their way to application in practise (Meyer, 2003).
In literature (see chapter 2.3.Ultrasound for Legionella disinfection), records for the
application of ultrasound for Legionella disinfection show results from lab‐scale experiments
only. In most of those cases, the chemical effect of ultrasound (the production of hydroxyl
and hydrogen radicals – highly oxidative species from the splitting of the water molecule)
has been employed. Even though ultrasound has shown indications to be effective for
bacterial disinfection, it must be further investigated whether its principle is correct and
then to be developed and optimized starting from small scale up to large scale installations.
28You can also read


