NATIONAL HURRICANE CENTER TROPICAL CYCLONE REPORT
←
→
Page content transcription
If your browser does not render page correctly, please read the page content below
NATIONAL HURRICANE CENTER
                             TROPICAL CYCLONE REPORT

                                                       HURRICANE SALLY
                                                                    (AL192020)
                                                          11–17 September 2020

                                          Robbie Berg and Brad J. Reinhart
                                                 National Hurricane Center
                                                             14 April 2021

   GOES-EAST GEOCOLOR IMAGE OF HURRICANE SALLY AT 0930 UTC 16 SEPTEMBER 2020, JUST BEFORE IT MADE
              LANDFALL ON THE COAST OF ALABAMA (IMAGE COURTESY OF NOAA/NESDIS/STAR)

        Sally was an erratic hurricane, both in its track and intensity, that made landfall along
the coast of Alabama at category 2 intensity (on the Saffir-Simpson Hurricane Wind Scale).
Sally produced hurricane-force winds along the coasts of Alabama and the western Florida
Panhandle, a complex pattern of storm surge flooding along much of the central and
northeastern U.S. Gulf coast, and record river flooding resulting from heavy rainfall. Sally
is responsible for four direct fatalities in Florida, Alabama, and Georgia and caused 7.3
billion USD in damage in the United States.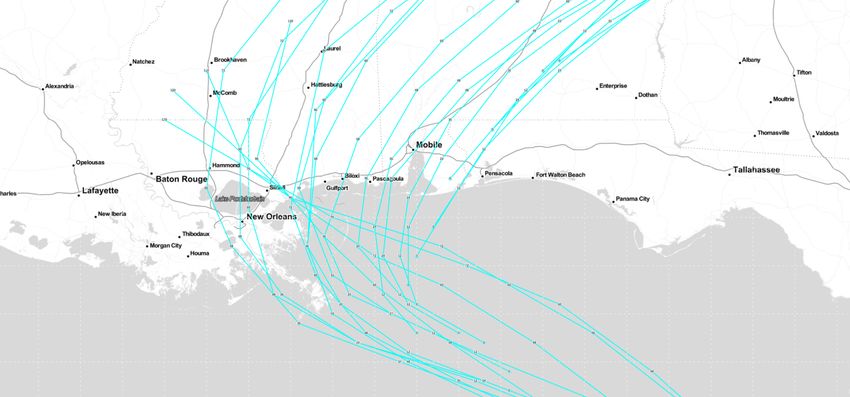
Hurricane Sally    2

Table of Contents

SYNOPTIC HISTORY .......................................................................................... 3
METEOROLOGICAL STATISTICS ...................................................................... 4
 Winds and Pressure ........................................................................................... 5
 Storm Surge ....................................................................................................... 7
 Rainfall and Flooding ......................................................................................... 8
 Tornadoes .......................................................................................................... 9
CASUALTY AND DAMAGE STATISTICS ........................................................... 9
 Alabama ........................................................................................................... 10
 Florida ............................................................................................................... 11
 Georgia ............................................................................................................. 11
 Mississippi ........................................................................................................ 12
 Louisiana .......................................................................................................... 12
FORECAST AND WARNING CRITIQUE........................................................... 12
 Genesis ............................................................................................................ 12
 Track ................................................................................................................ 12
 Intensity ............................................................................................................ 14
 Storm Surge ..................................................................................................... 14
 Watches and Warnings .................................................................................... 15
IMPACT-BASED DECISION SUPPORT SERVICES (IDSS) AND
PUBLIC COMMUNICATION .............................................................................. 16
ACKNOWLEDGMENTS .................................................................................... 17

TABLES ............................................................................................................. 17

FIGURES ........................................................................................................... 53
Hurricane Sally        3

Hurricane Sally
11–17 SEPTEMBER 2020

SYNOPTIC HISTORY

         At the beginning of September, Tropical Storm Omar1 formed off the coast of North
Carolina and moved eastward over the subtropical waters of the western Atlantic. Omar became
embedded within an amplifying mid-level trough by 4 September, and a pronounced surface
trough developed to the south and southwest of the tropical storm, extending just south of
Bermuda. Omar dissipated on 5 September, and its remnants moved toward the north Atlantic,
leaving the southern portion of the trough to begin moving slowly west-southwestward over the
western Atlantic. For several days, the trough continued on this slow west-southwestward
trajectory and produced a disorganized cluster of showers and thunderstorms which first reached
the Bahamas on 10 September. This area of disturbed weather lacked both convective
organization and a well-defined center of circulation during that entire period, but those two criteria
for genesis were met by 1800 UTC 11 September, marking the formation of a tropical depression
between Andros Island and Bimini in the Bahamas, roughly 100 n mi east-southeast of Miami,
Florida. The “best track” chart of the tropical cyclone’s path is given in Fig. 1, with the wind and
pressure histories shown in Figs. 2 and 3, respectively. The best track positions and intensities
are listed in Table 12.

         The depression turned westward, reaching the coast of southeastern Florida near Cutler
Bay just after 0600 UTC 12 September. Multiple reporting sites near the coasts of Miami-Dade
and Broward Counties began reporting sustained tropical-storm-force winds later that morning,
and it is estimated that the depression had become a tropical storm by 1200 UTC while the center
was located over the Everglades about 25 n mi west of Homestead. Tropical Storm Sally then
continued westward, its center emerging over the southeastern Gulf of Mexico around 1500 UTC.

         After moving offshore, Sally turned to the northwest, but moderate northwesterly shear
prevented steady strengthening. Sally’s winds increased to 50 kt by 1200 UTC 13 September,
but its intensity then held steady the rest of the day. A burst of deep convection developed near
and to the east of center early the next day, and with the shear relaxing a bit and turning out of
the west, Sally went through a relatively short period of rapid intensification (RI) and became a
hurricane around 1200 UTC 14 September while centered about 125 n mi south of Pensacola,
Florida. During the RI event, Sally’s intensity increased by 25 kt over an 18-h period, reaching a
relative peak of 75 kt by 1800 UTC that day. A resumption of moderate-to-strong vertical shear
likely halted the RI episode, however, with NOAA Tail Doppler Radar (TDR) data showing that

1 Stewart, Stacy. “Tropical Cyclone Report: Tropical Storm Omar.” National Oceanic and Atmospheric Administration
/ National Weather Service / National Hurricane Center, 31 Jan. 2021,
www.nhc.noaa.gov/data/tcr/AL152020_Omar.pdf.
2 A digital record of the complete best track, including wind radii, can be found on line at ftp://ftp.nhc.noaa.gov/atcf.

Data for the current year’s storms are located in the btk directory, while previous years’ data are located in the archive
directory.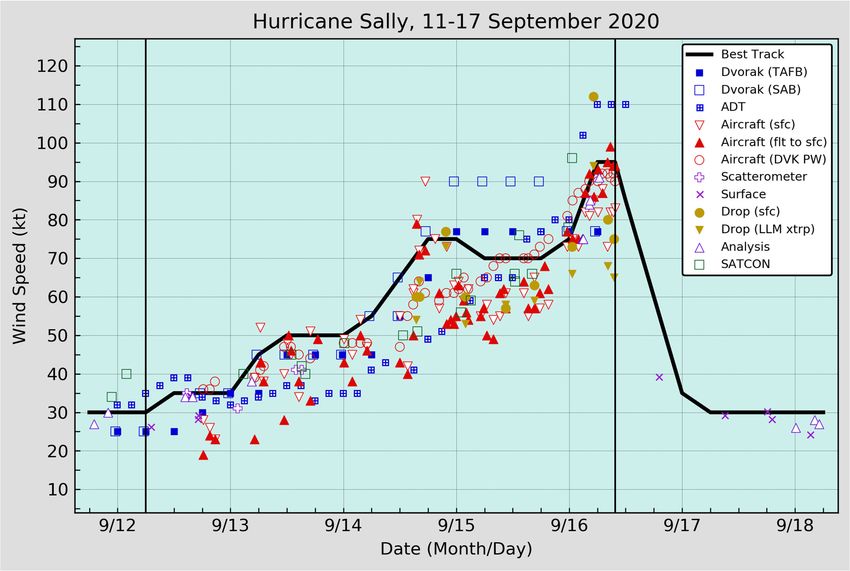
Hurricane Sally   4

Sally had a sheared and asymmetric structure midday on 14 September (Fig. 4). The shear
caused Sally to weaken back to an intensity of 70 kt by 0600 UTC 15 September and maintain
that intensity for much of the day. At the same time, steering currents had nearly collapsed, and
Sally slowed to a crawl while beginning a northward motion toward the northern Gulf coast.

        Late on 15 September, Sally began a second short period of RI, with its intensity
increasing from 70 kt at 1800 UTC 15 September to 95 kt by 0600 UTC 16 September. While the
deep-layer vertical shear near the hurricane did not abate during that period, model diagnostics
indicate that upper-level divergence increased by twofold on 15 September, which could have
offset the magnitude of the shear and aided in intensification. Sally’s northern eyewall began
moving onshore Baldwin County, Alabama, between 0500–0600 UTC and affected coastal areas
for the next 3 h, with some of the most violent gusts occurring near mesovortices that were
observed along the inner edge of the eyewall via radar imagery and storm chaser pressure
observations. Sally ultimately made landfall at Gulf Shores around 0945 UTC with maximum
sustained winds of 95 kt (Fig. 5).

        The hurricane continued northeastward across extreme southern Alabama and the
extreme western part of the Florida Panhandle during the morning, and it weakened to a tropical
storm by 1800 UTC that day just as the center crossed back into southern Alabama. The storm
continued to weaken quickly as it moved farther inland, becoming a tropical depression by
0600 UTC 17 September when centered about 20 n mi south-southeast of Montgomery, Alabama.
The depression then merged with a frontal boundary and became extratropical later that morning
just before crossing the border into Georgia. The post-tropical cyclone moved faster toward the
northeast across Georgia and South Carolina, and it dissipated between Columbia and Florence,
South Carolina, soon after 0600 UTC 18 September, when a new, more dominant area of low
pressure formed along the front farther north over eastern North Carolina.

METEOROLOGICAL STATISTICS
        Observations in Sally (Figs. 2 and 3) include subjective satellite-based Dvorak technique
intensity estimates from the Tropical Analysis and Forecast Branch (TAFB) and Satellite Analysis
Branch (SAB), and objective Advanced Dvorak Technique (ADT) estimates and Satellite
Consensus (SATCON) estimates from the Cooperative Institute for Meteorological Satellite
Studies/University of Wisconsin-Madison. Observations also include flight-level, stepped
frequency microwave radiometer (SFMR), and dropsonde observations from nine flights of the
53rd Weather Reconnaissance Squadron of the U.S. Air Force Reserve Command and four flights
of the NOAA Aircraft Operations Center (AOC) WP-3D aircraft. The NOAA AOC G-IV aircraft
also flew three synoptic surveillance flights around Sally. Data and imagery from NOAA polar-
orbiting satellites including the Advanced Microwave Sounding Unit (AMSU), the NASA Global
Precipitation Mission (GPM), the European Space Agency’s Advanced Scatterometer (ASCAT),
and Defense Meteorological Satellite Program (DMSP) satellites, among others, as well as the
National Weather Service WSR-88D and the NOAA WP-3D tail Doppler radar, were also useful
in constructing the best track of Sally.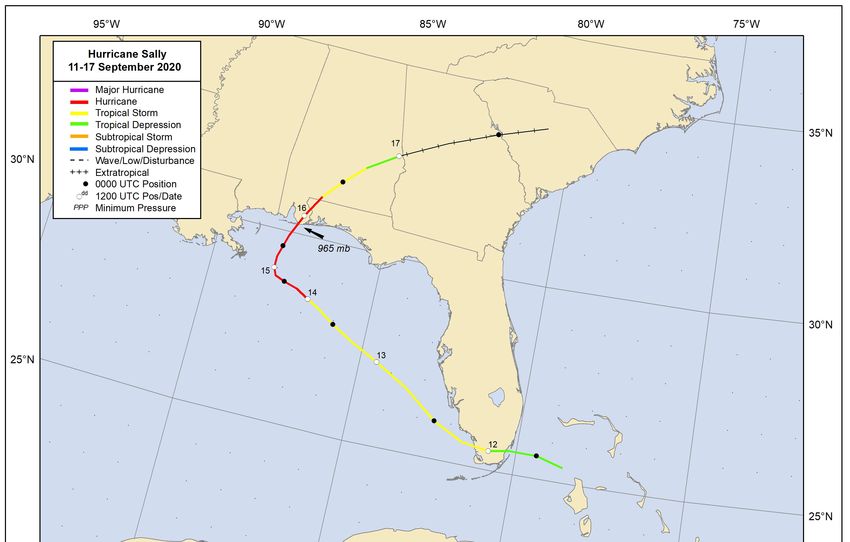
Hurricane Sally    5

       Ship reports of winds of tropical storm force associated with Sally are given in
Table 2, and selected surface observations from land stations and data buoys are given in
Table 3.

Winds and Pressure
      Sally’s estimated peak and Alabama landfall intensities of 95 kt from 0600 UTC to 0945
UTC 16 September are a blend of several pieces of data:

       (1) an Air Force Reserve Hurricane Hunter aircraft measured a peak 700-mb flight-level
wind of 110 kt at 0845 UTC 16 September, which adjusts to a surface intensity estimate of just
below 100 kt;

       (2) the same aircraft measured a peak SFMR wind of 88 kt at 0707 UTC. Recent research
suggests that for a hurricane of Sally’s intensity and structure, SFMR undersampling of the peak
winds could have been as much as 8%3. Applying that adjustment yields estimated peak surface
winds of 95 kt;

      (3) a dropsonde from the same flight recorded an average wind of 113 kt in the lowest
150 m of the sounding at 0509 UTC, which equates to an intensity around 95 kt;

        (4) an unofficial measurement of 98-kt sustained winds at the top of an 18-m mast was
received (unknown time) from Ingram Bayou, Alabama, reducing to 90–95 kt at a standard 10-m
elevation; and

       (5) A storm chaser measured a pressure gradient of 6.4 mb / n mi within Sally’s northern
eyewall in Gulf Shores, Alabama. The magnitude of this pressure gradient was similar to
gradients measured by the storm chaser in category 4 Hurricanes Harvey and Maria and thus is
more than supportive of a 95-kt intensity.

       Sally’s estimated minimum pressure of 965 mb, occurring at landfall, is based on a
pressure reading of 965 mb from a second storm chaser near the coast in Gulf Shores, Alabama,
at 0917 UTC 16 September. A near-simultaneous pressure of 966.4 mb was measured by a
WeatherFlow instrument located 7–8 n mi farther inland near Foley, Alabama, at 0910 UTC.
Surface observations and radar data suggest that Sally’s pressure minimum preceded its wind
center by more than an hour or two in some locations.

        Sally reached an initial peak intensity, estimated to be 75 kt, from 1800 UTC 14 September
to 0000 UTC 15 September. Several observing platforms from that day indicated that Sally’s
circulation was tilted to the north with height, and there were multiple mesovortices with significant
updrafts at flight level embedded along the inner edge of the eyewall. Because of this structure,
scientists at the NOAA Atlantic Oceanographic and Meteorological Laboratory (AOML) /
Hurricane Research Division (HRD) have advised that the highest winds measured by
reconnaissance aircraft and dropsondes were likely affected by transient eyewall features and
thus would not be representative of the hurricane’s circulation. An analysis of NOAA P-3 TDR
data (Fig. 4), which tends to smooth out some of these transient features, showed an expansive

3 Klotz, Bradley W., and David S. Nolan. "SFMR Surface Wind Undersampling over the Tropical Cyclone Life

Cycle". Monthly Weather Review 147.1 (2019): 247-268. https://doi.org/10.1175/MWR-D-18-0296.1.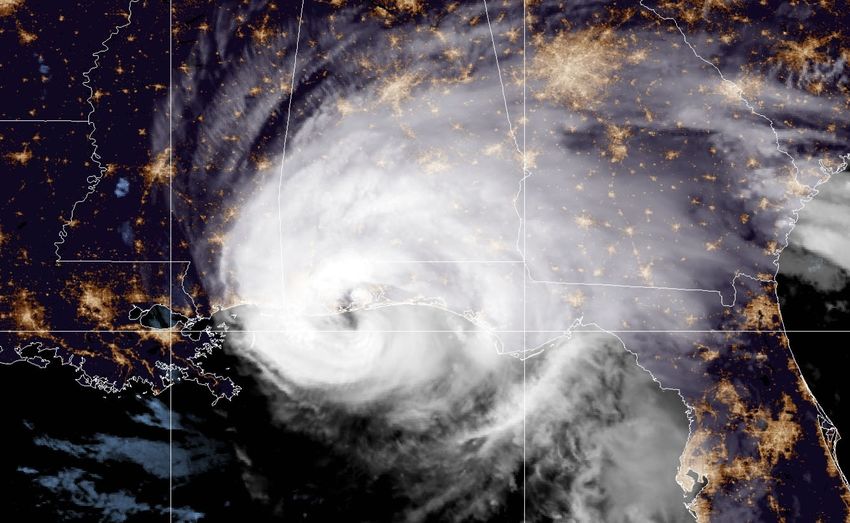
Hurricane Sally   6

area of 90–95 kt winds at an altitude of 0.5 km (about 1600 ft). These winds reduce to maximum
surface winds of about 75 kt. Additionally, Sally’s minimum central pressure of 986 mb at the
time would not generally be supportive of an intensity higher than 75 kt.

         Sally was close to becoming a tropical storm before it made landfall near Cutler Bay,
Florida, around 0600 UTC 12 September. The C-MAN station at Fowey Rocks, just offshore from
Miami, measured a brief increase in winds near Sally’s center around the time of landfall, with a
peak sustained wind of 37 kt (equating to 32 kt at 10 m) occurring at 0620 UTC. Winds increased
to tropical storm force later that morning around 1500 UTC at several sites along the southeastern
Florida coast, including Fowey Rocks, near convection to the east of the center. In addition, an
ASCAT-C scatterometer pass from 1445 UTC indicated that tropical-storm-force winds were
occurring over the Straits of Florida just south of the Florida Keys. These data suggest that Sally
had become a tropical storm earlier that morning, by 1200 UTC 12 September, when its center
was located over the Everglades of southern Florida.

        Sally produced sustained hurricane-force winds across portions of extreme southern
Alabama and the extreme western part of the Florida Panhandle near where it made landfall (Fig.
6). The strongest winds measured from a land or marine observation site were sustained winds
of 98 kt and a gust to 119 kt at the top of an 18-m meter mast at Ingram Bayou, Alabama. Other
hurricane-force measurements in Alabama include sustained winds of 87 kt and a gust to 105 kt
at Fort Morgan (at an elevation of 38 m), sustained winds of 81 kt and a gust to 103 kt at Perdido
Pass, and sustained winds of 76 kt with a gust to 90 kt at Dauphin Island. In Florida, a sustained
wind of 64 kt with a gust to 80 kt was reported at the Pensacola Naval Air Station. NOAA buoy
42012 just south of Orange Beach, Alabama, also reported sustained winds of 70 kt and a gust
to 95 kt within Sally’s northeastern eyewall.

        Sustained tropical-storm-force winds occurred across other areas of the northern Gulf
coast from extreme southeastern Louisiana eastward to the Big Bend of Florida on 15 and
16 September. In Louisiana, the National Ocean Service (NOS) station at Pilot’s Station East
measured an elevated sustained wind of 43 kt and a gust to 52 kt, while the NOS site at Petit Bois
Island at the Port of Pascagoula, Mississippi, reported a sustained wind of 50 kt and a gust to 65
kt. Along the coast of the Florida Panhandle, several sites between Pensacola and Panama City
reported sustained winds of 50 kt or higher. Tropical-storm-force winds also occurred well east
of Panama City, with sustained winds of 34 kt occurring as far east at St. Marks, Florida. Only a
few reports of sustained tropical-storm-force winds were received inland from the immediate
coast.

        Sustained tropical-storm-force winds also occurred in a few areas of southern Florida on
12 September. The C-MAN station at Fowey Rocks reported sustained winds of 40 kt and a gust
to 48 kt at an elevation of 44 m. Closer to standard heights, WeatherFlow sites at Biscayne Bay
Light and Dania Pier both reported sustained winds of 34 kt and gusts to 42 kt. Near the Florida
Keys, the C-MAN station at Sand Key Light measured a sustained wind of 37 kt and a gust to 40
kt.
Hurricane Sally       7

Storm Surge4
         Sally’s erratic track near the complex shoreline of the northern Gulf coast produced a
multifaceted storm surge event, with some areas experiencing flooding followed by a period of
abnormally low water due to offshore winds on the backside of the hurricane. The combination
of the surge and tides produced maximum inundation levels of 5 to 7 ft above ground level along
the coasts of Baldwin County, Alabama, and Escambia and Santa Rosa Counties, Florida. The
highest water level measured in the area was from the NOS tide gauge in Pensacola, which
recorded a peak water level of 5.6 ft above Mean Higher High Water (MHHW). A team from the
NWS Weather Forecast Office in Mobile conducted a post-storm survey of high water marks, and
the highest stillwater mark found was 4.2 ft above ground level (AGL) in Orange Beach, Alabama.
The team found many exposed debris lines several feet higher which likely included the effects
of waves on top of the surge. A post-storm model simulation of storm surge inundation conducted
by the NHC Storm Surge Unit (not shown) indicates that a few vulnerable areas where
observations did not exist, including in the upper reaches of Escambia and Blackwater Bays, likely
experienced storm surge flooding of 6 to 7 ft AGL. Figure 7 shows maximum water levels directly
measured or observed from Florida to southeastern Louisiana during or after Sally.

        Storm surge flooding of 3 to 5 ft above ground level occurred to the west of Sally’s landfall
location along the Alabama coast, the Mississippi coast, and in southeastern Louisiana. Easterly
and then northerly winds on the back side of Sally pushed water into portions of southeastern
Louisiana, where the NOS tide gauge at Shell Beach measured a peak water level of 5.4 ft
MHHW. Similarly, a United States Geological Survey (USGS) gauge at Black Bay near Pointe-
a-la-Hache recorded a peak water level of 5.2 ft MHHW, and a U.S. Army Corps of Engineers
(USACE) gauge at the Bayou Dupre Flood Gate measured a water level of 4.7 ft MHHW. Several
stations on the south side of Lake Pontchartrain registered water levels as high as 3.8 ft MHHW.
In Mississippi, the highest measured water level was 3.7 ft MHHW by the NOS gauge at the Bay
Waveland Yacht Club. In Alabama, the NOS gauge at Dauphin Island measured a peak water
level of 3.1 ft MHHW. Other stations around Mobile Bay generally had peak water levels of 1 to
2 ft MHHW.

        Probably more noteworthy around Mobile Bay was the reverse surge event that occurred
on the backside of Sally’s circulation once the winds turned out of the north. As shown in Fig. 8,
nearly all NOS tide gauges around the bay recorded minimum water levels below the Mean Lower
Low Water (MLLW) line, the tidal datum that is used as the reference for water depths on nautical
charts and allows vessel pilots to ascertain if the bottom of their vessel will hit the seafloor during

4 Several terms are used to describe water levels due to a storm. Storm surge is defined as the abnormal rise of water
generated by a storm, over and above the predicted astronomical tide, and is expressed in terms of height above
normal tide levels. Because storm surge represents the deviation from normal water levels, it is not referenced to a
vertical datum. Storm tide is defined as the water level due to the combination of storm surge and the astronomical
tide, and is expressed in terms of height above a vertical datum, i.e. the North American Vertical Datum of 1988
(NAVD88) or Mean Lower Low Water (MLLW). Inundation is the total water level that occurs on normally dry ground
as a result of the storm tide, and is expressed in terms of height above ground level. At the coast, normally dry land is
roughly defined as areas higher than the normal high tide line, or Mean Higher High Water (MHHW).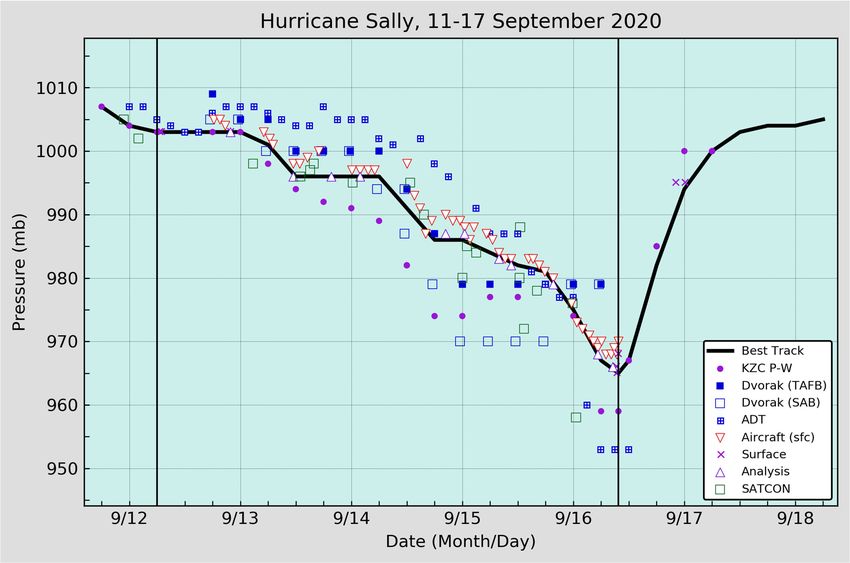
Hurricane Sally      8

the lowest tides.5 The NOS gauge at Coast Guard Sector Mobile, for example, measured a
minimum water level of 7.0 ft below MLLW. At this site, high water levels produced minor coastal
flooding on 15 September and then dropped by about 10.6 ft over roughly 20 h (an average of
half a foot per hour), exposing parts of the bay floor on 16 September. Water levels at some of
the tide gauges were so low that they exceeded the physical limits of the instruments, and actual
minimum water levels could not be recorded.

        Storm surge inundation of 2 to 4 ft above ground level occurred along the coast of the
Florida Panhandle east of Pensacola to the Big Bend, although some areas near Apalachee Bay
experienced even higher water levels. In particular, a USGS gauge on the Aucilla River at Nutall
Rise, nearly 200 n mi east of Sally’s landfall, recorded a peak water level of 5.8 ft MHHW on
16 September. Data from the gauge indicate that water levels first began rising above normal
levels on 13 September when Sally was over the eastern Gulf of Mexico, and the peripheral winds
of the meandering hurricane caused these water levels to increase further over the ensuing three
days. It is likely, however, that the coastal flooding in this area was isolated in nature, as no other
gauge in the region recorded a water level any higher than 3.4 ft MHHW. Farther west, the NOS
gauge at Panama City Beach measured a peak water level of 3.8 ft MHHW.

        No significant coastal flooding occurred along the western or southeastern coast of
Florida, nor in the Florida Keys, when Sally moved across the area as a tropical storm. Some of
the highest water levels recorded in the region were 1.8 ft MHHW at Ft. Myers and 1.4 ft MHHW
at Virginia Key.

Rainfall and Flooding
        Sally’s slow motion while approaching and moving across the northern Gulf coast resulted
in high rainfall totals (Fig. 9), which caused significant flooding across portions of southern
Alabama and the Florida Panhandle. At least two feet of rain was measured at a few locations in
Baldwin County, Alabama, and Escambia County, Florida, and a wider swath of at least 1 foot of
rain extended around that area across southern Alabama and the Florida Panhandle. The highest
reported rainfall total from the entire event was 29.99 inches at Orange Beach, Alabama. A storm-
total amount of 29.30 inches was also reported slightly west of that location near Fort Morgan,
Alabama. Across the border in Florida, a maximum total of 24.88 inches was measured just west
of Naval Air Station Pensacola. A secondary maximum occurred over the Florida Keys, with some
areas receiving a foot or more of rain. A total of 12.88 inches of rain was measured in Islamorada
on Lower Matecumbe Key. Maximum rainfall totals by state include:

        Alabama:                  29.99 inches at Orange Beach
        Florida:                  24.88 inches just west of Naval Air Station Pensacola
        Georgia:                  10.81 inches at Sterling
        Mississippi:              3.27 at Moss Point
        Louisiana:                6.94 inches near Pearl River

5 Tidal Datums and Their Applications.      U.S. Department of Commerce, National Oceanic and Atmospheric
Administration, National Ocean Service, Center for Operational Oceanographic Products and Services. NOAA Special
Publication NOS CO-OPS 1.
https://www.tidesandcurrents.noaa.gov/publications/tidal_datums_and_their_applications.pdf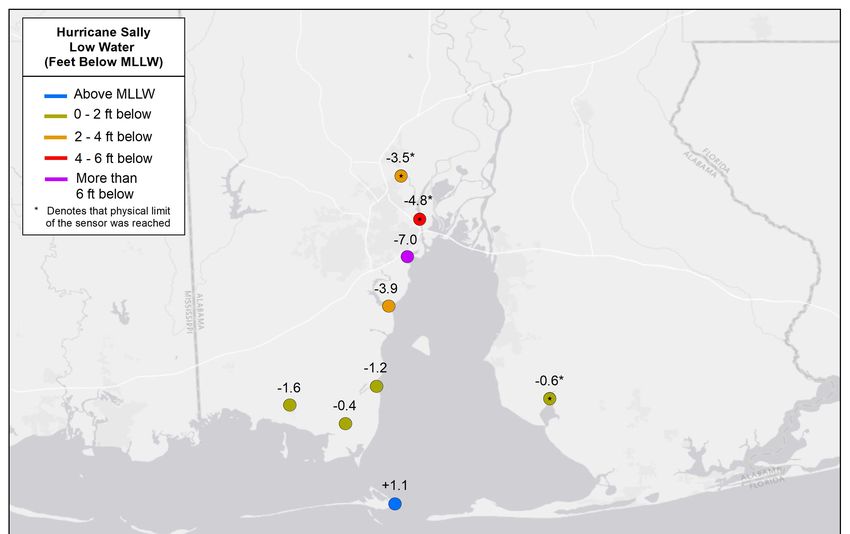
Hurricane Sally        9

         South Carolina:             8.58 inches west of Landrum
         North Carolina:             11.13 inches near Brevard

        Freshwater flooding across southern Alabama and the western Florida Panhandle was
exacerbated by storm surge, which prevented rainwater from draining into adjacent tidal rivers,
bays, or the Gulf of Mexico. Major-to-moderate flooding occurred along many rivers, with several
river gauges measuring their highest level on record. In Baldwin County, Alabama, major flooding
occurred on the Styx River near Elsanor and on the Fish River near Silverhill. In Walton County,
Florida, several rivers and creeks, including the Shoal River near Mossy Head, Alaqua Creek
near Pleasant Ridge, and Bruce Creek near Redbay, reached record levels, producing major to
moderate flooding. Record flooding also occurred on Holmes Creek at Vernon in Washington
County, Florida, and Wrights Creek near Bonifay in Holmes County, Florida.

Tornadoes
       There were 16 tornadoes reported while Sally was a tropical cyclone: one in Florida, six
in Georgia, and nine in South Carolina (Table 4, Fig. 10). All were rated EF0 or EF1 (on the
Enhanced Fujita Scale), were generally short lived, and caused a total of about $41,000 in
damage. The most significant tornado, an EF1, occurred just west of Waycross, Georgia, in Ware
County, and damaged the roof of a church and the gravestones in a nearby cemetery, accounting
for $40,000 of the total tornado damage. The tornado with the longest path was an EF0 in
northern Florida that was on the ground for nearly 10 miles, crossing from Calhoun County into
Jackson County.

        Seven additional tornadoes occurred in South Carolina (3) and North Carolina (4) after
Sally had become an extratropical low, causing an estimated total of $86,000 in damage. The
costliest was an EF0 just southwest of Florence, South Carolina, that damaged a couple of mobile
homes. The strongest was a short-lived EF1 that occurred near Merrimon in Carteret County,
North Carolina.

CASUALTY AND DAMAGE STATISTICS

       Sally is responsible for four direct fatalities6 in the United States: two as a result of
hazardous marine conditions, one from storm surge, and one from gusty winds toppling a tree
onto a home. In Florida, a 27-year-old man drowned after he left his Riola Place neighborhood
of Pensacola on Perdido Bay in a 12-ft jon boat, seeking his mother’s pontoon boat that had
become untethered in the hurricane.7 His body was found washed ashore near Blue Angel

6 Deaths occurring as a direct result of the forces of the tropical cyclone are referred to as “direct” deaths. These would
include those persons who drowned in storm surge, rough seas, rip currents, and freshwater floods. Direct deaths also
include casualties resulting from lightning and wind-related events (e.g., collapsing structures). Deaths occurring from
such factors as heart attacks, house fires, electrocutions from downed power lines, vehicle accidents on wet roads,
etc., are considered “indirect” deaths.
7 Body of missing boater lost during Hurricane Sally found Wednesday afternoon. Pensacola News Journal. 23

September 2020. https://www.pnj.com/story/news/2020/09/23/body-missing-boater-lost-during-hurricane-sally-
found-wednesday-afternoon/3510760001/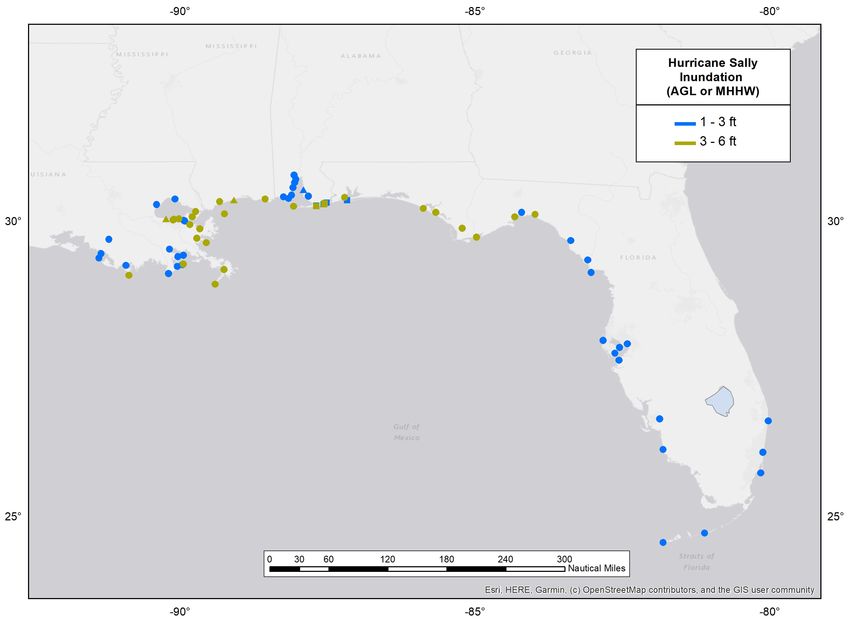
Hurricane Sally      10

Recreation Park. Media reports and the medical examiner indicate that a 45-year-old woman
drowned near Innerarity Point, Florida, after her vehicle was overtaken by rising storm
surge.8 She abandoned the vehicle and was last seen in a kayak on Innerarity Point Road before
she went missing. Her body was found several days later. In Alabama, the Baldwin County
coroner reported that a 72-year-old man on a large boat in Wolf Bay drowned during the storm,
his body found floating behind an Orange Beach residence. In Georgia, a 30-year-old man was
killed on 16 September when gusty winds and heavy rains caused a portion of a large oak tree to
fall on a home in southwest Atlanta.9

        Various reports also indicate there were at least five deaths that were indirectly attributed
to Sally, or that occurred when Sally was no longer a tropical cyclone. A person in Pensacola
and an 82-year-old man in Baldwin County, Alabama, each died from carbon monoxide poisoning
due to improper generator use, and a 33-year-old man died in Foley, Alabama, when a tree fell
on him while he was attempting to cut tree limbs. In Georgia, a man at a Cobb County bus stop
was killed when a driver lost control of his car on wet roads, and a 71-year-old woman died near
Snellville in Gwinnett County when a tree fell on her while she was walking her dog.

      The NOAA National Centers for Environmental Information (NCEI) estimates that Sally
caused $7.3 billion (USD) in damage in the United States, mainly across Alabama and the Florida
Panhandle.

Alabama
         Hurricane-force winds associated with Sally’s slow-moving eyewall produced widespread
damage to trees, power lines, and buildings across Mobile and Baldwin Counties. A few older
homes were destroyed, and many structures were damaged by fallen trees or suffered significant
roof, siding, and fence damage. In downtown Mobile, numerous oak trees suffered major damage
at Bienville Square, and there was minor damage to some businesses. Over 1,000 pecan trees
were downed on farms in Baldwin County, and the Alabama Forestry Commission estimates that
over $1.5 million (USD) of timber was destroyed. Wind damage extended well inland across
southwest and south-central Alabama, with numerous downed trees and power lines across the
region. Media reports indicate that at least 275,000 customers lost power in Alabama during the
event, including almost all of Baldwin County and 85% of Escambia County.

       Widespread storm surge inundation and significant flood damage occurred across coastal
Alabama. The greatest damage occurred along the back bays and sounds, especially east of
Gulf Shores to the Florida state line and northward into Perdido Bay. The surge moved several
large boats onto land. Many docks and piers were destroyed, and a section of the Gulf State
Park Pier in Gulf Shores was lost. Several marinas, including the Dauphin Island Marina, were
seriously damaged as well.

      In addition to the rising storm surge, the extreme rainfall associated with Sally produced
widespread flash flooding and river flooding across southern Alabama. Numerous water rescues

8  Friend: Woman last seen on kayak during Hurricane Sally was trying to save her life. WEAR-TV. 24 September
2020. https://weartv.com/news/local/friend-woman-last-seen-on-kayak-during-hurricane-sally-was-trying-to-save-her-
life
9 Hurricane Sally’s remnants blamed for 3 metro Atlanta deaths. Atlanta Journal-Constitution. 18 September 2020.

https://www.ajc.com/news/hurricane-sallys-remnants-blamed-for-3-metro-atlanta-
deaths/SXLK2GZNTFG75HKI36CDN6R2VM/
Hurricane Sally 11
were conducted during the event. In Escambia County, ten roads became impassible by
floodwaters, and some roads and bridges were washed out. In Coffee County, all roads in the
northern half of the county were declared impassible for approximately 16 h until floodwaters
receded. A swift water rescue occurred near Dry Creek just north of Brantley in Crenshaw
County, where several roads were damaged by flooding.
Florida
Sally’s winds, storm surge, and excessive rainfall caused extensive damage across the
Florida Panhandle. Thousands of structures were damaged in Escambia and Santa Rosa
Counties by strong wind and storm surge, and around 50 structures were destroyed. Many
homes suffered roof and siding damage, and media reports indicate that at least 240,000
customers lost power due to widespread downed trees and power lines. A study from the
University of Florida estimates that Sally caused $55–100 million (USD) in agricultural losses in
the western Florida Panhandle. The largest storm surge impacts occurred in the Perdido Key
area and along parts of Pensacola and Escambia Bays, where numerous structures were
significantly damaged. The storm surge moved numerous large boats and barges onto land, and
a section of the U.S. Highway 98 Three Mile Bridge over Pensacola Bay collapsed when a
construction barge struck the bridge. The surge and rough waves covered Johnson Beach Road
along the Gulf Islands National Seashore with 4 to 5 ft of sand, and NOAA National Geodetic
Survey aerial imagery indicates that three new cuts were created on the east side of Johnson
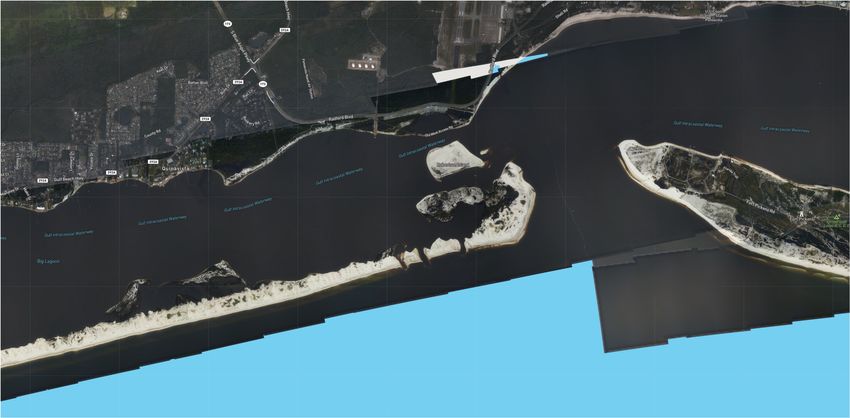
Beach (Fig. 11).
Due to the incoming storm surge, extreme rainfall produced by Sally had nowhere to drain,
which resulted in widespread flash and river flooding as well. Significant flooding occurred in
many homes and structures across the region, and thousands of water rescues were
performed. Numerous roads were made impassable, and some roads and small bridges were
washed out. Freshwater and storm surge flooding produced 2 to 4 ft of inundation in parts of
Downtown Pensacola. In Walton County, Alaqua Creek rapidly rose above record flood stage
and inundated homes along SR-20 west of Freeport with up to 4 ft of water. Record flooding also
occurred along other creeks in the Florida Panhandle, which resulted in numerous road closures
and some nearby homes being inundated with 2 to 4 ft of water. The Shoal and Blackwater Rivers
both reached major flood stage, and the I-10 bridge over the Shoal River in Okaloosa County was
closed.
Sally produced heavy rainfall that caused areas of street flooding in Miami-Dade, Broward,
and Monroe Counties. Widespread street flooding in Key West inundated some homes and
businesses with up to six inches of water, and numerous roads were made impassable by
floodwaters and stalled vehicles. In Collier County, widespread street flooding occurred in the
Naples-Marco Island area. Minor wind damage to trees and power lines occurred across portions
of South Florida, and over 10,000 customers lost power.
Georgia
Sally and its remnants produced gusty winds and heavy rainfall across much of western
and central Georgia on 16–17 September. The saturated ground resulted in some downed trees,
which led to scattered power outages that affected over 30,000 customers during theHurricane Sally 12
event. Significant flash flood damage was reported in Washington County, where SR-24 suffered
multiple washouts and collapses of the roadway, and Williamson Swamp Creek inundated SR-
231 near Davisboro and surrounded some homes with water. Elsewhere, widespread flooding in
Augusta and Waynesboro led to numerous road closures and some flooded vehicles.
Mississippi
Sally’s impacts were limited to portions of coastal Mississippi, mainly the result of storm
surge as well as some gusty winds. In Jackson County, over 60 roads primarily near the coast
were inundated with water. Storm surge and rough waves damaged the fishing pier in Moss Point
on the Escatawpa River. Tropical-storm-force wind gusts in the eastern portion of Jackson
County downed dozens of trees, which blocked some roadways and damaged a couple of
homes. In Hancock County, around 100 low-lying roads were flooded with approximately ten
roadways deemed impassible. No fatalities or injuries were reported in the state.
Louisiana
Storm surge impacts in southeastern Louisiana were limited to areas outside the
Hurricane and Storm Damage Risk Reduction System (HSDRRS). In Lafourche Parish, 2 to 3 ft
of water covered portions of LA Highway 1 south of the Golden Meadow flood gate at peak
inundation, which resulted in a road closure that cut off areas to the south including Grand
Isle. One to two feet of inundation affected low-lying portions of Jefferson, Orleans, Plaquemines,
St. Bernard, and St. Tammany Parishes, which made some roadways impassible. Some tropical-
storm-force wind gusts were measured in the southern portion of Plaquemines Parish, but no
significant damage occurred. No fatalities or injuries were reported in the state.
FORECAST AND WARNING CRITIQUE
Genesis
Sally’s formation was not well forecast. The precursor disturbance was first mentioned in
the NHC Tropical Weather Outlook (TWO) and given a low (60%)
category only about 2.5 h before formation, in a Special TWO issued at 1525 UTC 11 September.
The disturbance was first given a low chance of formation during the ensuing two-day period
24 h before it became a tropical depression, and a medium chance 6 h before formation. The
2-day probability only reached the high category at the time that Sally is estimated to have formed.
Track
A verification of NHC official track forecasts for Sally is given in Table 6a. Official forecast
track errors were lower than the mean official errors for the previous 5-yr period at all forecast
times except for 36 and 120 h. Despite Sally’s seemingly erratic track near the northern Gulf
coast, the climatology and persistence OCD5 errors were lower than their respective 5-yearHurricane Sally 13
means at all forecast times, indicating that Sally’s overall track was easier to forecast than that of
a typical Atlantic tropical cyclone. A homogeneous comparison of the official track errors with
selected guidance models is given in Table 6b and Fig. 12.10 On the whole, two individual
deterministic models had lower errors than the NHC official forecasts: the Hurricane Multi-Scale
Ocean-Coupled Non-Hydrostatic Model (HMNI) and the Naval Research Laboratory COAMPS-
TC Model (CTCI). In addition, the HFIP Corrected Consensus aid (HCCA) and the TVCA, TVCX,
and TVDG multi-model consensus aids also had lower errors than the official forecasts.
Conversely, some of the typically better-performing models, including the Global Forecast System
(GFSI), the European Centre for Medium-Range Weather Forecasts model (EMXI), and the
Hurricane Weather and Research Forecast System (HWFI), did not perform particularly well and
generally had higher errors than the official forecast.
Sally’s track forecasts were more challenging, and possibly less accurate at times, near
the northern Gulf coast, despite the overall NHC official forecasts having relatively low errors and
superior performance compared to some of the typically best-performing models. There are a
few possible explanations:
(1) The official forecasts and many of the models suffered from a noticeable left-of-track
(west) bias near the northern Gulf coast. As shown in Fig. 13, many of NHC’s track
forecasts depicted a potential landfall in southeastern Louisiana or Mississippi, even
as late as 36 h before the eventual landfall in Alabama. But this bias was not limited
to the official forecasts: several of the typically better-performing global models, GFSI
and EMXI, as well as the TVCA model consensus, also depicted tracks over
southeastern Louisiana or Mississippi for many model cycles. The GEFS ensemble
mean (AEMI) had one of the worst west biases, at one point showing a 5-day forecast
off the Texas coast near Galveston.
(2) The bulk track verification statistics wash out nuances in the forecasts that occurred
about 3 days before Sally’s landfall. A verification of forecasts valid at the synoptic
time closest to Sally’s landfall in Alabama (1200 UTC 16 September) indicates that the
official forecasts made within 2 days of landfall, and 4 days before landfall (Fig. 14a),
had lower-than-average errors compared to the previous 5-year period. However, the
forecasts made about 3 days before landfall (at 60 and 72 h) (Fig. 14b) had higher-
than-average errors compared to the previous 5-year period. Since critical decisions
and preparations, as well as the issuance of watches and warnings, are often made
about 3 days before a hurricane makes landfall, the poorer-than-usual forecasts at this
particular time range may have caused a false sense of security to those in the most-
impacted areas of Alabama and Florida. Sally’s first few forecasts may have also
prompted what cognitive psychologists call the “anchoring effect,” the human tendency
to rely too heavily, or “anchor,” on one piece of information (in this case, those first few
forecasts) when making decisions, and not adjust those decisions as new information
arrives11.
10 The UK Met Office Global Model (EGRI) and the Florida State Superensemble (FSSE) did not have enough forecasts
to meet NHC’s homogeneity requirement and thus were not included in the track model verification.
11 Kahneman, Daniel. Thinking, Fast and Slow. 1st ed., Farrar, Straus and Giroux, 2011.Hurricane Sally 14
(3) It is often difficult to forecast the precise motion of storms that meander or become
nearly stationary when embedded in weak steering environments, particularly when
the track is dependent on the storm’s intensity. While overall track errors are typically
low in these situations, small changes in the heading of slow-moving storms near land
have significant implications for which part of a coastline will be most impacted by a
storm. This makes forecasts in such situations more prone to being seen as erroneous
even if overall position errors are low. Sally’s expected turn from west-northwest to
north-northeast during the two days before landfall ended up being much sharper than
originally anticipated, possibly because the hurricane strengthened more than
expected, which shifted the area of highest impact from southeastern Louisiana and
Mississippi eastward to Alabama and the western Florida Panhandle.
Intensity
A verification of NHC official intensity forecasts for Sally is given in Table 7a. Official
forecast intensity errors were higher than the mean official errors for the previous 5-yr period at
all forecast times except 36 and 48 h. Climatology and persistence OCD5 errors were much
higher than their respective 5-yr means, suggesting that Sally’s intensity was more difficult to
forecast than for a typical Atlantic tropical cyclone, likely due to land interaction and the two
episodes of RI the cyclone experienced. A homogeneous comparison of the official intensity
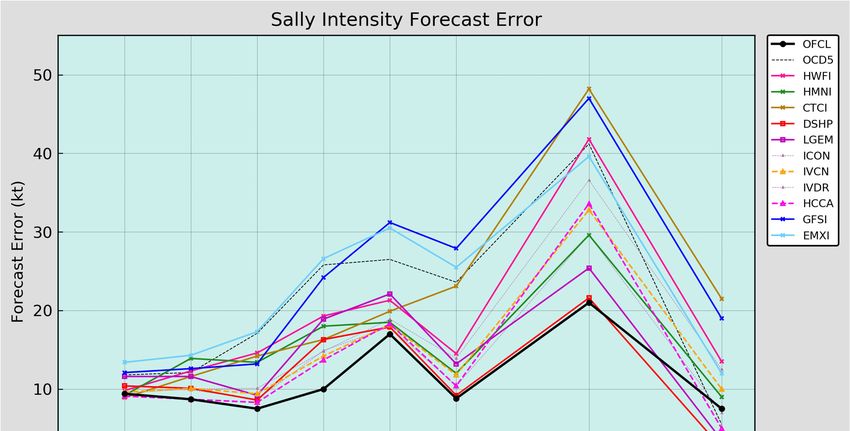
errors with selected guidance models is given in Table 7b and Fig. 15. Despite the relatively
challenging forecasts and large errors compared to the past five years, NHC’s official intensity
forecasts overwhelmingly beat the intensity guidance. A few models beat the official forecasts at
12 and 120 h, but otherwise no model had lower errors than the official forecasts between 24 and
96 h.
Sally’s intensity forecasts had the complication of a large degree of land interaction. Since
most intensity models employ their own forecast track and not the NHC official track forecast (e.g.,
HWFI, HMNI, HCCA, etc.), Sally’s potential amount of time over land and associated weakening
varied from model to model and from forecast cycle to forecast cycle. Overall model-to-model
comparisons, and comparisons to the official forecasts, are therefore probably not very instructive
for this storm. That said, inspection of the two periods of RI showed some patterns. For the first
RI episode, the models and the official forecast for the 1800 UTC 13 September forecast cycle
correctly indicated that strengthening would occur, but they all showed a peak intensity occurring
12 h too late (Fig. 16a). For the second RI episode, the official forecast and the models for the
0600 UTC 15 September forecast cycle all showed Sally’s intensity remaining steady or
decreasing slightly over the next 24 h (Fig. 16b), even though they all still had the center offshore
during that time. In the end, Sally strengthened by 25 kt during the 12-h period ending at 0600
UTC 16 September.
Storm Surge
For areas that received the highest storm surge inundation from Sally, the initial peak
storm surge inundation forecast issued at 2100 UTC 12 September was 2 to 4 ft above normally
dry ground for the Alabama coast and 1 to 3 ft for the Florida Panhandle coast. Because of Sally’s
eastward shift in track from Louisiana to Alabama, these forecasts were gradually raised over
time. For Alabama, the inundation forecast settled on 4 to 7 ft above normally dry ground by 1500Hurricane Sally 15
UTC 14 September. For the extreme western Florida Panhandle, the inundation forecast
increased to 3 to 5 ft above normally dry ground at 1500 UTC 15 September but did not increase
fully to 4 to 7 ft until just before landfall, at 0630 UTC 16 September.
For southeastern Louisiana and Mississippi, the initial peak storm surge inundation
forecast issued at 2100 UTC 12 September was 6 to 9 ft above normally dry ground, and that
forecast was increased to 7 to 11 ft at 0900 UTC 13 September. The forecast for this area began
to gradually decrease at 0300 UTC 15 September when it became clearer that Sally would instead
more directly threaten areas farther east.
Watches and Warnings
Coastal wind watches and warnings associated with Sally are given in Table 8a. For areas
that experienced sustained hurricane-force winds, a Hurricane Watch was first issued for the
Alabama coast at 2100 UTC 12 September, and a Tropical Storm Watch was issued at the same
time for portions of the Florida Panhandle coast. A Tropical Storm Warning was issued for both
Alabama and portions of the Florida Panhandle coast at 0900 UTC 13 September (with the
Hurricane Watch still in effect for Alabama). Sustained tropical-storm-force winds began brushing
the coast in these areas around 2100 UTC 14 September, indicating that the watches provided a
lead time of 48 h and the warnings provided a lead time of 36 h.
The Tropical Storm Warnings were upgraded to Hurricane Warnings for Alabama and the
western Florida Panhandle at 1500 UTC and 2100 UTC 14 September, respectively. Sustained
hurricane-force winds first reached the coast of Alabama around 0300 UTC 16 September,
indicating that the long-duration hurricane watch was issued 78 h before hurricane-force winds
began, and the hurricane warning was issued 36 h beforehand. Sustained hurricane-force winds
first reached the coast of the western Florida Panhandle around 0900 UTC 16 September,
indicating that the hurricane warning there was also issued 36 h before hurricane-force winds
began. A Hurricane Watch was never issued for the Florida Panhandle.
Hurricane warnings were issued for portions of the coast of Louisiana and Mississippi at
0900 UTC 13 September. These warnings did not verify, as only sustained tropical-storm-force
winds affected a portion of those states’ coasts.
A Tropical Storm Watch was issued for the southeastern coast of Florida at 2100 UTC 11
September, and that watch was subsequently discontinued at 0900 UTC 12 September.
Sustained tropical-storm-force winds occurred along the coasts of Miami-Dade and Broward
Counties on the morning of 12 September, after the tropical storm watch had been discontinued.
Storm surge watches and warnings associated with Sally area given in Table 8b. A Storm
Surge Watch was first issued for the northern Gulf coast from the mouth of the Mississippi River
to the Alabama/Florida border, including Lake Pontchartrain, Lake Maurepas, Lake Borgne, and
Mobile Bay at 2100 UTC 12 September. A Storm Surge Warning was issued at 0900 UTC 13
September from Port Fourchon, Louisiana, to the Mississippi/Alabama border, including the
intervening lakes, and was extended eastward to the Alabama/Florida border and Mobile Bay at
0300 UTC 14 September. Storm surge warnings were again extended eastward along the Florida
Panhandle coast to the Okaloosa/Walton County line at 2100 UTC 14 September, and then to
the Walton/Bay County line at 0300 UTC 16 September. Since sustained tropical-storm-forceHurricane Sally 16
winds began along the coast around 2100 UTC 14 September, the initial Storm Surge Watch and
Warning provided lead times of 48 h and 36 h, respectively.
Ultimately, storm surge warnings extended along the coast from Port Fourchon, Louisiana,
to the Walton/Bay County line in Florida. Storm surge inundation of 3 feet or greater above
normally dry ground (which NHC uses as a first-cut threshold for the storm surge watch/warning)
occurred within most parts of the Storm Surge Warning area, except within Mobile Bay (Fig. 17).
Several tide stations and stream gauges east of the warning area along the Florida Panhandle
and Apalachee Bay reported slightly above 3 ft MHHW, and the National Weather Service office
in Tallahassee had those areas covered under a Coastal Flood Advisory for expected minor
coastal flooding as early as the early morning of 13 September. A Coastal Flood Warning was
issued for coastal Jefferson and Taylor Counties in Florida on the afternoon of 16 September to
warn of significant coastal flooding in the isolated area near the mouth of the Aucilla River (where
5.8 ft MHHW was measured).
IMPACT-BASED DECISION SUPPORT SERVICES (IDSS) AND
PUBLIC COMMUNICATION
The NHC began communication with emergency managers on 12 September as Sally
emerged over the western Gulf of Mexico. This communication included briefings and Federal
video-teleconferences with FEMA Headquarters and FEMA Regions 4 and 6, along with Gulf
states. These decision support briefings were coordinated through the FEMA Hurricane Liaison
Team, embedded at the NHC. The NHC director maintained direct communications with senior
state emergency management officials to discuss the evolving threat to the Gulf coast. In addition,
the Tropical Analysis and Forecast Branch of NHC provided 7 live briefings on Sally to U.S. Coast
Guard District 7 in support of their life-saving mission. In addition to NHC’s IDSS described above,
there was a large-scale collaborative IDSS effort across the NWS, including Weather Forecast
Offices, River Forecast Offices, and National Centers, in response to the multiple life-threatening
hazards produced by Sally.
NHC opened a media pool on 14 September to the network broadcast and cable
news/weather outlets and those local TV stations along the northern Gulf coast and inland from
Lake Charles, Louisiana, to Tallahassee, Florida. During the four-day pool operation, 108
broadcasts were provided. Audio recordings of the top-of-the-hour generic pool broadcasts were
made available on the NHC website.
On social media, the @NHC_Atlantic Twitter account had 36 million Twitter impressions
beginning when Sally’s precursor disturbance was first highlighted in the Tropical Weather
Outlook at 0000 UTC 10 September. NHC provided 12 Facebook Live broadcasts via its
Facebook page with 850,000 views during the four-day period. Postings of the latest NHC
advisories were made onto the NHC Facebook page at a minimum of once every three hours.
The post reach during this event was 4.76 million, and the post engagement was 2.68 million.Hurricane Sally 17
ACKNOWLEDGMENTS
Data in Table 3 were compiled in part from Post Tropical Cyclone Reports issued by NWS
Forecast Offices (WFOs) in Miami, Key West, and Tallahassee, Florida; Mobile, Alabama; and
New Orleans and Lake Charles, Louisiana, as well as Public Information Statements issued by
inland WFOs. Data and reports from the Weather Prediction Center (WPC), National Data Buoy
Center, NOS Center for Operational Oceanographic Products and Services, U.S. Geological
Survey, and U.S. Army Corps of Engineers were also used in the creation of this report. Laura
Alaka and William Booth from the NHC Storm Surge Unit provided storm surge data and a storm
surge hindcast for the analysis, Hurricane Specialist John Cangialosi created the best track map
(Fig. 1), and Zack Taylor from WPC created the rainfall map (Fig. 7). Dr. Paul Reasor and Dr.
Sim Aberson from the NOAA Atlantic Oceanographic and Meteorological Laboratory / Hurricane
Research Division, as well as James Franklin, are thanked for their assistance in interpreting
aircraft flight-level, dropsonde, and P-3 Tail Doppler Radar data. Josh Morgerman of iCyclone
and Mike Theiss of Ultimate Chase are thanked for the data they collected in the core of Sally
along the Alabama coast.Hurricane Sally 18
Table 1. Best track for Hurricane Sally, 11–17 September 2020.
Date/Time Latitude Longitude Pressure Wind
Stage
(UTC) (°N) (°W) (mb) Speed (kt)
11 / 1800 25.4 78.6 1007 30 tropical depression
12 / 0000 25.6 79.4 1004 30 "
12 / 0600 25.6 80.2 1003 30 "
12 / 1200 25.5 80.8 1003 35 tropical storm
12 / 1800 25.6 81.6 1003 35 "
13 / 0000 26.0 82.5 1003 35 "
13 / 0600 26.7 83.5 1001 45 "
13 / 1200 27.2 84.5 996 50 "
13 / 1800 27.6 85.4 996 50 "
14 / 0000 27.9 86.0 996 50 "
14 / 0600 28.2 86.5 996 55 "
14 / 1200 28.4 86.9 991 65 hurricane
14 / 1800 28.6 87.3 986 75 "
15 / 0000 28.7 87.7 986 75 "
15 / 0600 28.8 88.0 984 70 "
15 / 1200 29.0 88.1 982 70 "
15 / 1800 29.3 88.1 981 70 "
16 / 0000 29.6 88.0 975 75 "
16 / 0600 29.9 87.9 967 95 "
16 / 0945 30.3 87.7 965 95 "
16 / 1200 30.5 87.6 967 85 "
16 / 1800 31.1 87.2 982 60 tropical storm
17 / 0000 31.6 86.7 994 35 "
17 / 0600 32.1 86.1 1000 30 tropical depression
17 / 1200 32.6 85.2 1003 30 extratropical
17 / 1800 33.2 83.8 1004 30 "
18 / 0000 33.7 82.3 1004 30 "
18 / 0600 34.1 80.8 1005 30 "
18 / 1200 dissipated
16 / 0600 29.9 87.9 967 95 maximum winds
16 / 0945 30.3 87.7 965 95 minimum pressure
landfall near Cutler Bay,
12 / 0600 25.6 80.2 1003 30
Florida
landfall near Gulf Shores,
16 / 0945 30.3 87.7 965 95
AlabamaHurricane Sally 19
Table 2. Selected ship reports with winds of at least 34 kt for Hurricane Sally, 11–17
September 2020.
Ship call
Date/Time Latitude Longitude Wind Pressure
sign
(UTC) (N) (W) dir/speed (kt) (mb)
11 / 2200 9HA366 25.7 78.3 160 / 35 1018.4
12 / 0900 9HA366 25.7 78.3 160 / 35 1019.4
12 / 1600 C6XS7 25.9 78.4 170 / 36 1011.7
12 / 1700 C6SA3 25.8 78.0 170 / 38 1013.0
14 / 1200 LAHR7 26.6 85.5 180 / 35 1015.1
14 / 2100 WLIY 27.0 87.2 230 / 35 1005.4
14 / 2200 C6ED5 27.1 86.7 230 / 35 1010.0
15 / 2000 WLOZ 27.6 88.3 270 / 35 1005.0Hurricane Sally 20
Table 3. Selected surface observations for Hurricane Sally, 11–17 September 2020.
Minimum Sea Level Maximum Surface
Pressure Wind Speed
Storm Storm Estimated Total
Location surge tide Inundation rain
Date/ Date/ (ft)c (ft)d (ft)e (in)
Press. Sustained Gust
time time
(mb) (kt)b (kt)
(UTC) (UTC)a
Florida
International Civil Aviation Organization (ICAO) Sites
Pensacola Naval Air
Station (KNPA) 16/1056 984.4 16/1119 64 80
(30.35N 87.32W)
Hurlburt Field (KHRT)
16/1556 999.1 16/1456 39 57 15.88
(30.43N 86.68W)
Milton – NAS Whiting
Field North (KNSE) 16/1656 990.4 16/1656 39 57
(30.72N 87.02W)
Valparaiso – Eglin Air
Force Base (KVPS) 16/1952 999.9 16/1809 28 49 16.32
(30.48N 86.53W)
Tyndall Air Force Base
(KPAM) 16/2140 1004.0 16/1609 33 47 13.55
(30.07N 85.59W)
Apalachicola Regional
Airport (KAAF) 16/2153 1006.1 16/1620 27 47 9.28I
(29.73N 85.02W)
Panama City – NW
Florida Beaches Intl.
16/2253 1003.8 16/1420 29 44 12.52
Airport (KECP)
(30.36N 85.79W)
Ft. Lauderdale –
Hollywood Intl. Airport 12/1053 1006.8 12/1453 26 41 3.00
(KFLL)
(26.07N 80.15W)
Destin – Ft. Walton
Beach Airport (KDTS) 16/1953 1000.4 16/0353 23 40 8.61I
(30.40N 86.47W)
Homestead Air
Reserve Base (KHST) 12/0648 1003.3 12/0702 26 38 4.32
(25.48N 80.38W)
Pompano Beach Air
Park (KPMP) 12/1053 1007.3 12/1625 25 38 2.08
(26.25N 80.12W)
Ft. Lauderdale
Executive Airport 12/1053 1007.3 12/1555 25 37 2.55
(KFXE)
(26.20N 80.17W)
West Palm Beach Intl.
Airport (KPBI) 12/1053 1008.3 12/1705 29 37 1.81
(26.68N 80.09W)Hurricane Sally 21
Minimum Sea Level Maximum Surface
Pressure Wind Speed
Storm Storm Estimated Total
Location surge tide Inundation rain
Date/ Date/ (ft)c (ft)d (ft)e (in)
Press. Sustained Gust
time time
(mb) (kt)b (kt)
(UTC) (UTC)a
Miami Intl. Airport
(KMIA) 12/1045 1006.4 12/1535 26 36 3.35
(25.80N 80.29W)
Naples Municipal
Airport (KAPF) 12/2145 1002.9 13/0240 24 36 5.24
(26.15N 81.77W)
Crestview – Bob Sikes
Airport (KCEW) 16/1453 1002.1 16/0746 21 36 11.52
(30.79N 86.52W)
Hollywood North Perry
Airport (KHWO) 12/1044 1007.1 12/1540 24 35
(26.00N 80.24W)
Opa Locka Airport
(KOPF) 12/0853 1006.9 12/1700 28 35
(25.91N 80.28W)
Marco Island Airport
(KMKY) 12/2020 1002.9 12/2256 27 35 10.23
(26.00N 81.67W)
Key West Naval Air
Station (KNQX) 12/1953 1006.4 13/0229 29 35 7.10
(24.58N 81.68W)
Tallahassee Intl.
Airport (KTLH) 16/2153 1006.9 16/1926 23 35 5.98
(30.40N 84.35W)
Key West Intl. Airport 12/1953 1006.5 13/0211 27 34 9.71
(KEYW) (24.56N 81.76W)
Duke Field/Eglin Air
Force Base (KEGI) 16/0010 1007.7 16/0101 19 34 5.25I
(30.65N 86.52W)
DeFuniak Springs
Airport (K54J) 16/0135 21 31 10.63
(30.73N 86.15W)
Florida Keys/Marathon
Intl. Airport (KMTH) 12/1153 1005.7 12/1330 17 26 8.39
(24.73N 81.05W)
Coastal-Marine Automated Network (C-MAN) Sites
Tyndall AFB Tower C 42
(SGOF1) 16/2100 1006.6 16/1600 (35.1 m, 53
(29.41N 84.86W) 10 min)
Fowey Rocks (FWYF1) 40
12/0600 1005.5 12/1520 (44 m, 48
(25.59N 80.10W) 10 min)
Sand Key Light 37
12/2020 1006.3 13/0157 (15.6 m, 40
(SANF1) (24.56N 81.88W) 1 min)
Keaton Beach (KTNF1) 26
17/1000 1007.6 17/0700 40
(29.82N 83.59W) (10 m)
Venice (VENF1) 25
12/2200 1006.5 13/1650 (12 m, 33
(27.07N 82.45W) 10 min)Hurricane Sally 22
Minimum Sea Level Maximum Surface
Pressure Wind Speed
Storm Storm Estimated Total
Location surge tide Inundation rain
Date/ Date/ (ft)c (ft)d (ft)e (in)
Press. Sustained Gust
time time
(mb) (kt)b (kt)
(UTC) (UTC)a
National Ocean Service (NOS) Sites
Pensacola (PCLF1) 50
16/1224 986.1 16/1354 66 5.54 6.53 5.6
(30.40N 87.21W) (10 m)
Panama City Beach
(PCBF1) 16/2142 1003.4 16/1130 46 52 3.41 4.66 3.8
(17 m)
(30.21N 85.88W)
Panama City (PACF1) 28
16/1524 47 3.02 4.13 3.4
(30.15N 85.67W) (10 m)
Apalachicola (APCF1) 33
16/2106 1006.6 16/1224 40 3.26 3.96 3.1
(29.73N 84.98W) (9 m)
Lake Worth Pier
(LKWF1) 12/0806 1007.2 13/0148 32 39 1.18 1.81 1.3
(12 m)
(26.61N 80.03W)
Virginia Key (VAKF1) 26
13/2036 1011.9 12/1642 36 1.19 1.63 1.4
(25.73N 80.16W) (12 m)
Cedar Key (CKYF1) 25
12/2000 1009.2 12/1848 32 2.32 3.51 2.0
(29.13N 83.03W) (12 m)
Key West (KYWF1) 22
12/2006 1006.2 12/2036 32 0.78 1.31 1.3
(24.55N 81.81W) (17 m)
Naples (NPSF1) 24
12/2148 1003.8 14/1018 32 1.45 2.22 1.6
(26.13N 81.81W) (10 m)
Old Port Tampa
(OPTF1) 13/0000 1008.4 16/1754 18 29 1.25 2.39 1.6
(18 m)
(27.86N 82.55W)
Clearwater Beach
(CWBF1) 13/0912 1008.0 16/2012 22 29 1.81 2.52 1.6
(8 m)
(27.98N 82.83W)
St. Petersburg (SAPF1) 21
12/2124 1008.4 12/2206 27 1.39 2.25 1.5
(27.76N 82.63W) (9 m)
Vaca Key (VCAF1) 21
12/1224 1005.7 12/1424 26 0.70 0.64 1.0
(24.71N 81.11W) (10 m)
Fort Myers (FMRF1) 15
12/2136 1005.9 13/0748 24 1.48 2.07 1.8
(26.65N 81.87W) (8 m)
South Port Everglades
(PEGF1) 12/0806 1007.2 0.85 1.86 1.3
(26.08N 80.12W)
Port Manatee (PMAF1)
12/2112 1007.7 1.22 2.06 1.5
(27.64N 82.56W)
Tampa - East Bay
(EBEF1) 12/2148 1008.4 1.36 2.56 1.7
(27.92N 82.42W)
WeatherFlow Sites
Fair Point Light 2
(XFPL) 16/1221 987.5 16/1131 53 71
(4.6 m, 5 min)
(30.37N 87.21W)
Gulf Breeze (XGBZ) 46
16/1239 988.1 16/1354 66
(30.36N 87.16W) (15 m, 1 min)You can also read