Irrigation return flow causing a nitrate hotspot and denitrification imprints in groundwater at Tinwald, New Zealand - HESS
←
→
Page content transcription
If your browser does not render page correctly, please read the page content below
Hydrol. Earth Syst. Sci., 24, 3583–3601, 2020
https://doi.org/10.5194/hess-24-3583-2020
© Author(s) 2020. This work is distributed under
the Creative Commons Attribution 4.0 License.

Irrigation return flow causing a nitrate hotspot and denitrification
imprints in groundwater at Tinwald, New Zealand
Michael Kilgour Stewart1,2 and Philippa Lauren Aitchison-Earl3
1 AquiferDynamics, 20B Willoughby St., Lower Hutt, 5010, New Zealand
2 GNS  Science, P.O. Box 30 368, Lower Hutt, 5040, New Zealand
3 Environment Canterbury, P.O. Box 345, Christchurch, 8011, New Zealand

Correspondence: Michael Kilgour Stewart (m.stewart@gns.cri.nz)

Received: 9 February 2020 – Discussion started: 17 March 2020
Revised: 5 June 2020 – Accepted: 20 June 2020 – Published: 16 July 2020

Abstract. Nitrate concentrations in groundwater have been           solved oxygen (DO) concentration. This denitrification im-
historically high (N ≥ 11.3 mg L−1 ) in an area surrounding         print is attributed to localised denitrification in fine pores or
Tinwald, Ashburton, since at least the mid-1980s. The local         small-scale physical heterogeneity where conditions are re-
community is interested in methods to remediate the high ni-        ducing. The implication is that denitrification could be occur-
trate in groundwater. To do this, they need to know where           ring where it is not expected because groundwater DO con-
the nitrate is coming from. Tinwald groundwater exhibits            centrations are not low.
two features stemming from irrigation with local groundwa-
ter (i.e. irrigation return flow). The first feature is increased
concentrations of nitrate (and other chemicals and stable iso-
topes) in a “hotspot” around Tinwald. The chemical concen-          1   Introduction
trations of the groundwater are increased by recirculation of
water already relatively high in chemicals. The irrigation re-      Excessive nitrate concentrations in groundwater are of great
turn flow coefficient C (irrigation return flow divided by ir-      concern for human health and for the environment. New
rigation flow) is found to be consistent with the chemical          Zealand drinking-water standards set a maximum accept-
enrichments. The stable isotopes of the groundwater show            able value (MAV) for nitrate at 50 mg L−1 (equivalent to ni-
a similar pattern of enrichment by irrigation return flow of        trate nitrogen of 11.3 mg L−1 ), based on the risk to bottle-
up to 40 % and are also enriched by evaporation (causing a          fed babies (Ministry of Health, 2008), in line with the WHO
loss of about 5 % of the original water mass). Management           (World Health Organization) guidelines (WHO, 2016, 2017).
implications are that irrigation return flow needs to be taken      Hereafter in this paper “nitrate” is quantified as concentra-
into account in modelling of nitrate transport through soil–        tions of nitrate N in milligrams per litre. Concerning health,
groundwater systems and in avoiding overuse of nitrate fer-         the Canterbury Plains in New Zealand (Fig. 1a) has sev-
tiliser leading to greater leaching of nitrate to the ground-       eral “high-risk” areas where nitrate concentrations in shal-
water and unnecessary economic cost. The second feature is          low groundwater are above MAV most or all of the time
the presence of “denitrification imprints” (shown by enrich-        (Scott et al., 2020). Regarding the environment, eutrophi-
ment of the δ 15 N and δ 18 ONO3 values of nitrate) in even rel-    cation causing hypoxia and algal blooms, due primarily to
atively oxic groundwaters. The denitrification imprints can         agricultural runoff of excess nutrients, is considered the most
be clearly seen because (apart from denitrification) the ni-        prevalent water quality problem globally (OECD, 2017). In
trate has a blended isotopic composition due to irrigation          New Zealand the N balance worsened (i.e. became more pos-
return flow and N being retained in the soil–plant system           itive) more than in any other OECD (Organisation for Eco-
as organic N. The nitrate concentration and isotopic com-           nomic Co-operation and Development) member country be-
positions of nitrate are found to be correlated with the dis-       tween 1998 and 2009, almost entirely because of expansion
                                                                    and intensification of farming (OECD, 2013). The N balance

Published by Copernicus Publications on behalf of the European Geosciences Union.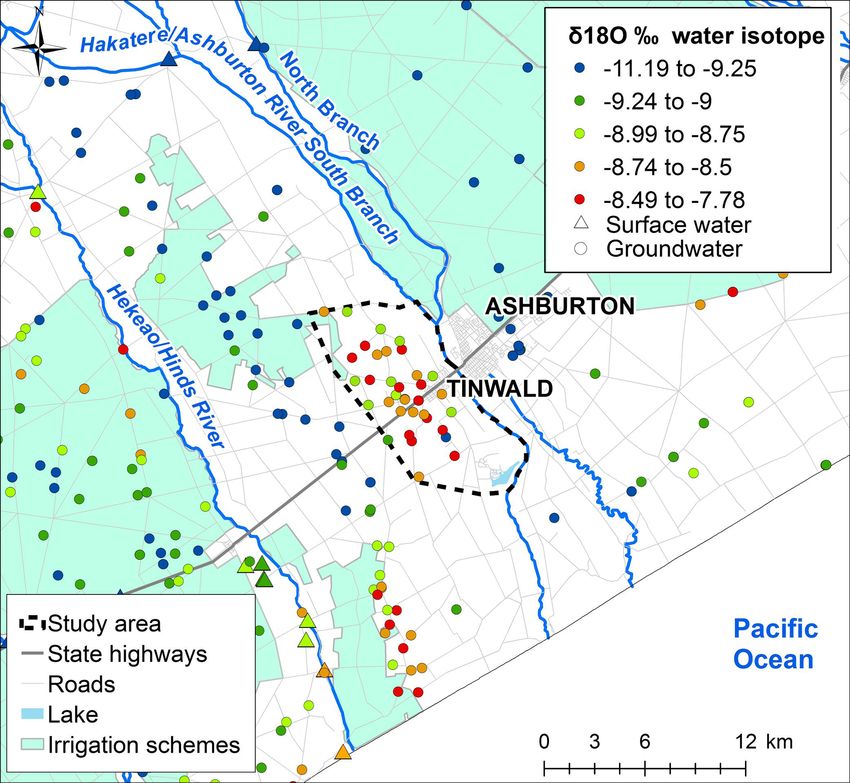
3584 M. K. Stewart and P. L. Aitchison-Earl: Irrigation return flow and nitrate in groundwater
is the difference between N inputs to farming systems (fer- sources of the nitrate and its natural attenuation via deni-
tiliser and livestock manure) and N outputs (crop and pasture trification (i.e. microbial reduction of nitrate) (e.g. Kendall,
production); a positive N balance indicates a build-up of N 1998; Wexler et al., 2014; Park et al., 2018; Spalding et
and increased potential for N pollution of soil, water, and air. al., 2019). Understanding the sources of nitrate is impor-
Pastoral farming has increased rapidly in recent years world- tant for remediation of excessive nitrate concentrations as
wide and especially in New Zealand. For example, dairy- at Tinwald (Aitchison-Earl, 2019). Natural attenuation of ni-
farming acreage on the Canterbury Plains (Fig. 1a) increased trate via denitrification is a vital eco-service to the environ-
from 20 000 to 190 000 ha between 1990 and 2009 (Pang- ment, and comparison of estimates of nitrate loss by leaching
born and Woodford, 2011). Because nitrate can be toxic for from the bottom of the root zone in catchments compared
aquatic life at lower levels than MAV, the New Zealand Gov- with the outflow of nitrate from streams shows that con-
ernment set a maximum median for nitrate N of 6.9 mg L−1 siderable attenuation of nitrate occurs in the vadose-zone–
for river systems. groundwater continuum. However, little is known about the
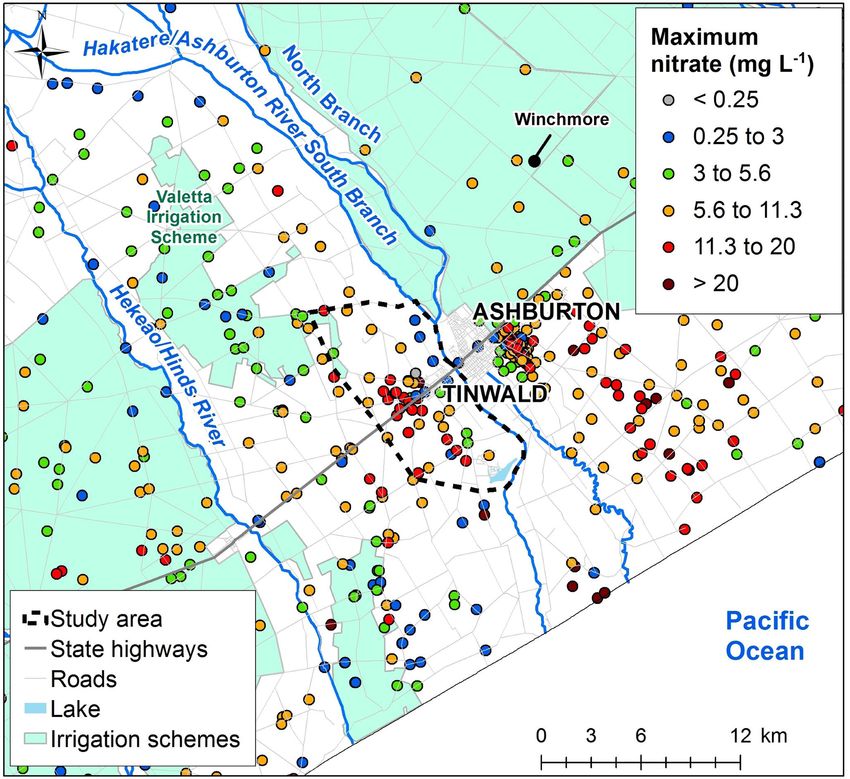
Nitrate concentrations in groundwater in the Tinwald detailed processes affecting nitrate transport and fate in this
area have historically been high, commonly greater than region (Clague et al., 2015; Wells et al., 2016; Stenger et al.,
11.3 mg L−1 within an area approximately 3 km wide and 2018; Burbery, 2018). In summary, the objectives of this pa-
11 km long (Fig. 1b). The high values are due to the history per are to investigate the role of irrigation return flow in
of land use in the area, but the Tinwald values are accen-
tuated because the area is irrigated with local groundwater 1. accentuating the nitrate hotspot at Tinwald and
which has relatively high nitrate concentrations (N can have
2. producing denitrification imprints in relatively oxic
concentrations > 11.3 mg L−1 ), whereas surrounding areas
groundwaters.
are irrigated with alpine-river water with low nitrate concen-
trations (N < 1 mg L−1 ). The terms “irrigation return flow”
(e.g. Chakraborty et al., 2015) and “groundwater recircu- 2 Background
lation” (Brown et al., 2011) are often applied to situations
where irrigation is from water that has been pumped from 2.1 Geohydrologic setting
the underlying aquifer. This situation is common around
the world, sometimes with unrecognised effects on chemi- The study area centres around the small town of Tin-
cal concentrations (Sánchez Pérez et al., 2003; Park et al., wald (population 3000) situated on the south bank of the
2018). An important and well-recognised example of the ef- Hakatere/Ashburton River and located on the large coa-
fects of irrigation return flow is non-point-sourced arsenic lescing alluvial plain known as the “Canterbury Plains”
pollution in the groundwater of the Bengal basin, regarded (Fig. 1a). The Canterbury Plains were built up by rivers
as one of the largest public-health concerns in human history fed by glaciers over several million years. Deposition in the
(Edmunds et al., 2015). Tinwald area (Fig. 1b) was mainly by the South Branch
Irrigation return flow has important implications for wa- Hakatere/Ashburton River and its ancestors (Barrell et al.,
ter resource management as regards understanding and mod- 1996). The alluvial deposits are poorly stratified greywacke
elling of nitrate transport in groundwater systems. Much ef- gravel dominated with silts and sands which become finer
fort is being expended to model the effects of nitrate pro- towards the coast. Oil well exploration drilling and seismic
duced by farming practices in order to substantiate the intro- surveys of the Ashburton–Hinds areas indicate thicknesses of
duction of appropriate controls on farming to protect the wa- over 1000 m of alluvial gravels overlying marine sediments
ter supplies of downstream communities (e.g. Environmental (Jongens et al., 2012).
Canterbury, 2020). Irrigation return flow can seriously distort Existing wells in the Tinwald study area are almost all
such modelling by extending the timescale of nitrate trans- less than 100 m, and over half are less than 40 m deep
port by abstracting water from groundwater downstream and (Aitchison-Earl, 2019). Wells are generally screened within
applying it upstream and also by adding nitrate on a second post-glacial (Holocene) or last-glacial (late Quaternary) de-
pass through the soil. This work examines the chemical and posits. Shallow wells and springs are common close to the
isotopic compositions of Tinwald groundwater to look for river, within the Holocene age deposits. There is little ge-
signatures attributable to irrigation return flow and how it ological impedance for movement of groundwater between
contributes to the nitrate hotspot at Tinwald. Similar effects shallower and deeper screened wells.
are expected to be important for many other locations in agri- The regional groundwater flow direction is parallel to the
cultural areas throughout the world. Hakatere/Ashburton River. State Highway 1 runs through the
Irrigation return flow also appears to contribute to an en- study area (Fig. 1b) and was originally built to take advan-
hanced denitrification imprint in groundwater at Tinwald, tage of drier conditions at the inland point of the old “Hinds
where denitrification imprints are discernible in even reason- swamp”. The swamp has been largely drained but influences
ably oxic groundwaters. The stable isotopes of nitrate (15 N soil types, with deeper, poorly drained organic soils with less
and 18 ONO3 ) have often been used to investigate both the leaching and greater denitrification potential located coast-
Hydrol. Earth Syst. Sci., 24, 3583–3601, 2020 https://doi.org/10.5194/hess-24-3583-2020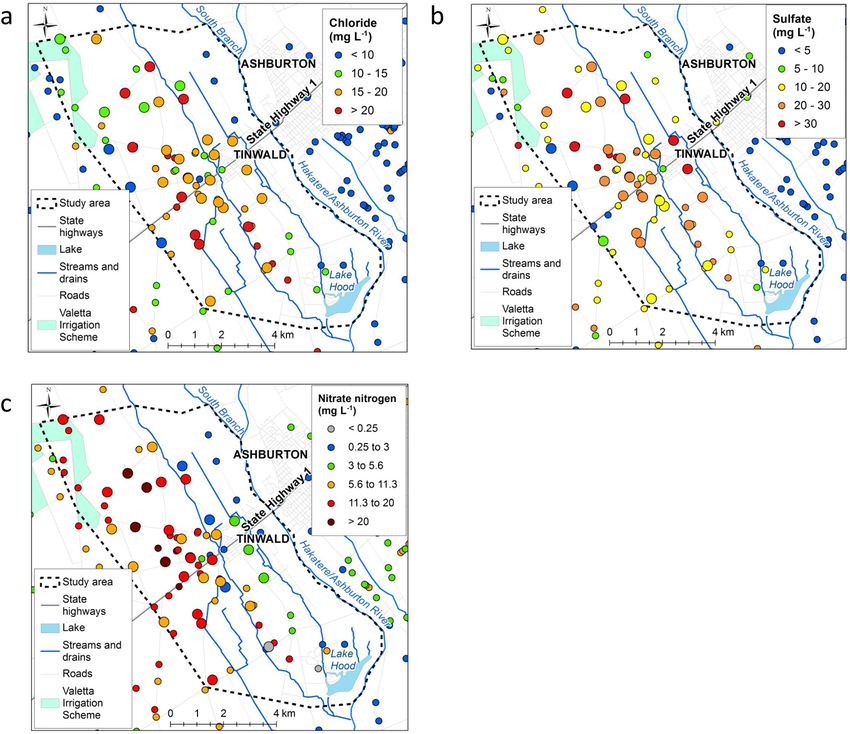
M. K. Stewart and P. L. Aitchison-Earl: Irrigation return flow and nitrate in groundwater                                         3585

Figure 1. (a) New Zealand map showing locations of Tinwald and other areas mentioned in the text. (b) Tinwald study area with simplified
land usage (Agribase, 2016). Base map containing road and stream information © LINZ (2019). PET: potential evapotranspiration.

wards of the highway. Soils are lighter and more freely drain-
ing with greater nitrate leaching risk inland of the highway
and adjacent to the Hakatere/Ashburton River (Landcare Re-
search, 2015).
   In the Tinwald study area, groundwater in two wells with
depths less than 50 m had mean residence times of 12 and
63 years based on CFC (chlorofluorocarbon) and tritium
measurements (Stewart et al., 2002; van der Raaij, 2013).
Groundwater residence times generally increase with depth
in other wells in the greater Ashburton area. A trial site for
managed aquifer recharge (MAR) has been operating since
2016 just outside of the study area (Fig. 1b).

2.2   Hydrology

The closest long-term rainfall site is part of a climate sta-
tion at Ashburton Council (Fig. 1b). Annual average rain-
fall at Ashburton Council is around 730 mm (measured be-
tween 1909 and 2017), ranging from 382 to 1147 mm.
There is little seasonality in rainfall, which averages 61 mm         Figure 2. Maximum nitrate concentrations in the greater Ashburton
a month. Groundwater recharge was reported by Thorpe                  area from 1990 to 2017. Base map © LINZ (2019).
and Scott (1999) based on lysimeter measurements of soil
drainage at Winchmore (10 km north of Ashburton; Fig. 2).
In the 10-year period (1961–1971), average recharge was               interacts with local groundwater, losing and gaining water
293.5 mm yr−1 with average rainfall of 730 mm yr−1 and po-            along its length. Flow is lost to groundwater from the South
tential evapotranspiration (PET) of 765 mm yr−1 . Average             Branch and gains towards the confluence with the North
monthly recharge was much higher in winter months (April              Branch.
to September). Winchmore soil is described as Lismore stony              Springs and wetlands indicate areas where the water
silt loam characteristic of that at Tinwald west of Highway 1         table is naturally close to the surface and groundwater
and much of the Canterbury Plains.                                    discharge is occurring. Many springs are found in the
   The Hakatere/Ashburton River has a north and south                 Hakatere/Ashburton River catchment and often occur in
branch sourced from the Canterbury ranges which converge              relict river channels (Aitchison-Earl, 2000). In the study area,
at the north of the study area. The Hakatere/Ashburton River          Carters Creek and Laghmor Creek are both sourced from

https://doi.org/10.5194/hess-24-3583-2020                                           Hydrol. Earth Syst. Sci., 24, 3583–3601, 2020
3586 M. K. Stewart and P. L. Aitchison-Earl: Irrigation return flow and nitrate in groundwater
springs, and there are springs above Lake Hood that flow into
the lake (Fig. 1b).
2.3 Land and groundwater use
Cropping has been a major land use in the Tinwald area since
at least the early 1940s (Fig. 1b; Engelbrecht, 2005). Most of
the area is not part of any of the major surface water irriga-
tion schemes, so irrigation was developed from groundwater
sources within the area from the 1980s. Cultivation and fer-
tiliser practice in cropping has an impact on the amount of ni-
trate that is leached from the soil to the groundwater. Winter
is the most likely time for leaching to occur due to saturated
soils and less nitrogen being used by crops. Nitrogen-fixing
clover crops have been used less over time with an increase
in commercial fertilisers (predominantly urea). Point sources
of nitrate and other contaminants include septic tanks (hu-
man effluent), dairy and other animal effluent, and storm wa-
ter and contaminated water.
Groundwater use in the Tinwald area is mainly for irriga-
Figure 3. Wells sampled in the Tinwald study area for this study.
tion and for domestic and stock water supply. The Valetta Base map © LINZ (2019).
Irrigation Scheme extends to the edge of the study area in the
northwest and sources water from the braided alpine Rangi-
tata River to the south (Figs. 2 and 4).
3 Methods
2.4 Nitrate concentrations
3.1 Sampling
Consistently high nitrate concentrations (greater than MAV
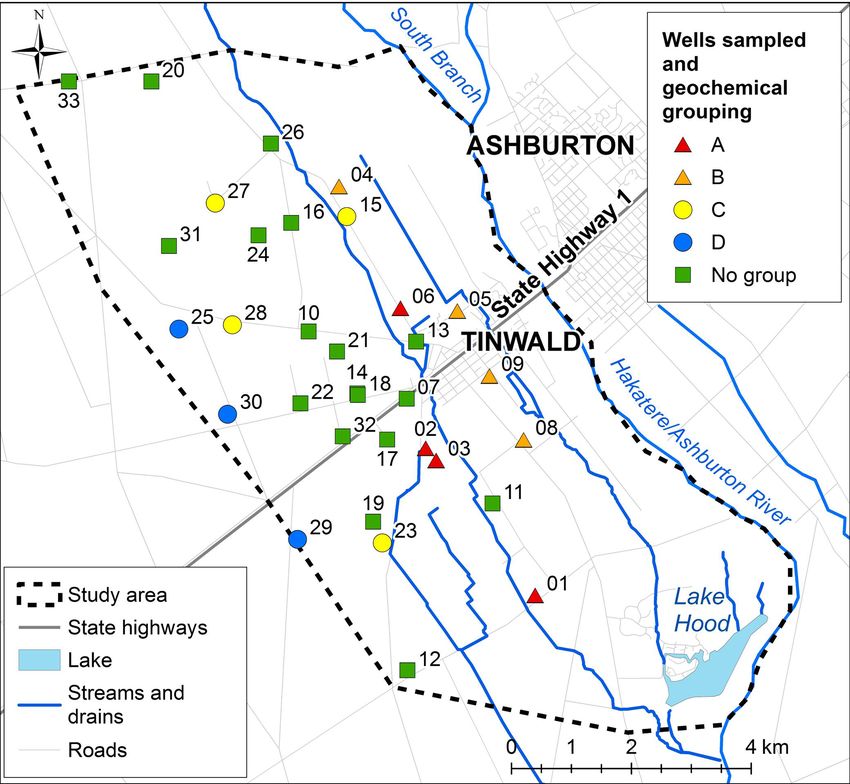
of 11.3 mg L−1 ) in groundwater were first identified in the A total of 33 wells were sampled in the study area between
Tinwald area in 2002 (Hanson, 2002). Maximum recorded 7 February and 14 March 2018 (Fig. 3); 13 of the wells had
nitrate concentrations from all samples between 1990 been sampled in 2004, and others were selected to fill gaps at
and 2017 are shown in Fig. 2. In general, lower nitrate con- a range of well depths. Groundwater levels were regionally
centrations occur close to the rivers and under and downgra- high at the time of sampling following a sustained period
dient of surface water irrigation schemes (less than 1/2 MAV of low levels (Aitchison-Earl, 2019). A large rainfall event
of 5.6 mg L−1 ). This is because of dilution by river-sourced of over 100 mm occurred during the sampling period on 21
water, which is lower in nitrate. Nitrate concentrations are February, leading to an increase in river flow.
higher in areas with local-groundwater recharge such as Tin- Information on the wells is given in Table 1. Screened in-
wald (> 11.3 mg L−1 ). Nitrate concentrations are lower to- tervals and mid-screen depths are given for screened wells;
wards the coast in the old Hinds swamp southeast of State total well depths are given where the wells have no screens.
Highway 1 (SH1) (< 5.6 mg L−1 ), where the lower nitrate A total of 52 % of the wells had short screens (average 2 m
concentrations are driven by reducing conditions which fa- length); 21 % had long screens (average 10 m length); and
cilitate denitrification (Hanson and Abraham, 2010). (Note 27 % had no screens. Field measurements had stabilised for
that there are elevated nitrate levels – > 11.3 mg L−1 – out- all wells before sampling. A total of 25 wells were purged
side the study area from the east side of Ashburton to the of at least three well-casing volumes before sampling, and
coast, which are the result of historic leaching from meat- the 8 remaining wells were sampled by low-flow methods
processing plants and general agricultural land use. These are (pumps were lowered into the wells, and water was sampled
not part of this study.) after the pipes had been purged of three pipe volumes).
Nitrate concentrations have increased over time in the Tin-
wald area, with two long-term monitoring sites (Thews Road 3.2 Chemical measurements
and Saleyards wells; Fig. 1b) having statistically signifi-
cant (p < 0.05) upwards trends of 0.44 and 0.29 mg L−1 yr−1 Samples were analysed for Environment Canterbury’s
since monitoring began in 1995 (Aitchison-Earl, 2019). standard suite of major ions through Hills Laboratories
(Aitchison-Earl, 2019). Field measurements included dis-
solved oxygen (DO), pH, conductivity, temperature, and
depth to groundwater. A selection of the field quantity and
ion concentration results are given in Tables 1 and 2. The
Hydrol. Earth Syst. Sci., 24, 3583–3601, 2020 https://doi.org/10.5194/hess-24-3583-2020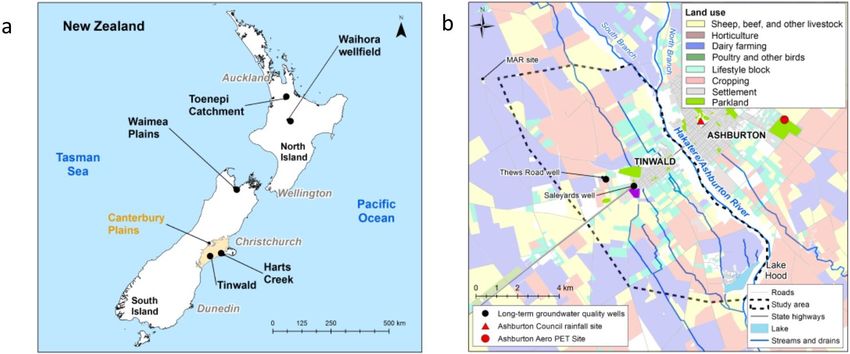
M. K. Stewart and P. L. Aitchison-Earl: Irrigation return flow and nitrate in groundwater                                                         3587

Table 1. Sample and well information, field dissolved oxygen concentration (DO), and isotopes of water and nitrate. The wells are ordered
from lowest to highest DO concentrations, and four groups of samples (A to D) are identified for discussion (below).

         Well no.           ID      Group       Date                 Screen        Mid-         DO       δ 18 O    δ2 H   δ 15 NNO3   δ 18 ONO3
                                                                     length       screen   (mg L−1 )      (‰)      (‰)          (‰)         (‰)
                                                                        (m)        depth
                                                                                     (m)
         K37/0702           01         A        28 Mar 2018              1.5       33.3        0.18      −8.3     −58.6       20.4        11.8
         K37/3114           02         A        15 Mar 2018              1.5       35.3        0.45     −8.59     −61.4       16.6         7.8
         K37/1806           03         A        15 Mar 2018             27.0       42.5        0.67     −8.47     −58.4       15.7         7.8
         K37/2977           04         B        8 Feb 2018               3.0       47.5        1.36     −8.83     −64.2          7         3.1
         K37/1014           05         B        22 Feb 2018              1.5        8.8        1.68     −8.75     −62.9        7.2         3.3
         K37/0819           06         A        22 Feb 2018              1.5       39.3        2.44      −8.5     −60.9         20         6.5
         K37/0147           07                  7 Feb 2018               ns∗        10         2.68     −8.18     −60.2          5         0.7
         K37/1862           08         B        15 Mar 2018              1.5       35.3        2.95     −8.84     −62.1          8         3.9
         K37/0336           09         B        9 Apr 2018                ns          7        3.39     −8.74     −61.6        8.7           4
         K37/3052           10                  22 Feb 2018                ns       15         4.11      −8.8     −63.5         4.2         0.2
         K37/1012           11                  15 Mar 2018               2.0      29.6        6.34     −8.38     −58.7           6         2.8
         BY21/0125          12                  28 Mar 2018               1.0      28.5        6.73     −8.53     −59.8         3.5         0.3
         BY21/0184          13                  7 Feb 2018                6.0       7.5        7.76     −8.18     −59.1         4.5         1.2
         K37/0088           14                  12 Mar 2018               3.6       8.2        8.05     −8.48     −61.4         5.9         1.8
         K37/1972           15         C        7 Feb 2018                ns         20        8.29     −8.35     −59.3         3.7        1.1
         K37/0961           16                  8 Feb 2018               6.0       55.5        8.37     −8.52     −60.6         4.1          1
         K37/0697           17                  14 Mar 2018              1.5       21.3        8.65      −8.6     −60.5         3.3        0.1
         K37/2347           18                  12 Mar 2018              3.0       58.5        8.76     −8.57      −62          2.5       −0.1
         K37/1767           19                  28 Mar 2018              2.0       28.5        9.18     −8.49     −59.6         2.2       −0.4
         K37/2301           20                  9 Apr 2018                ns         25        9.25     −8.76     −61.5         4.8          1
         K37/3049           21                  22 Feb 2018               ns         15        9.36     −7.71     −54.4         1.8       −1.2
         K37/1807           22                  14 Mar 2018              1.5       23.3        9.39     −8.56      −62            3       −0.3
         K37/0968           23         C        10 Apr 2018              5.0        7.5        9.54     −8.19     −60.2         2.6       −0.5
         K37/1479           24                  9 Feb 2018              12.5       66.3         9.6     −8.64     −61.3         2.2       −0.2
         K37/1603           25         D        9 Feb 2018               6.0       59.7         9.6      −8.8     −63.9         2.2       −0.8
         BY21/0306          26                  17 Apr 2018               ns         14        9.68     −8.83     −63.5         3.8        0.8
         BY21/0307          27         C        17 Apr 2018               ns         13        9.85     −8.47      −61          3.3       −0.5
         K37/1661           28         C        8 Feb 2018                ns         11         9.9     −8.36     −59.7         3.7       −0.1
         K37/1939           29         D        9 Apr 2018               1.5       38.4        10.3     −9.17     −64.3         1.7       −1.1
         K37/3146           30         D        14 Mar 2018              3.0       52.5        10.3     −8.94     −64.4         1.8       −0.8
         K37/0502           31                  8 Feb 2018               1.1       21.9        10.4     −8.47     −61.6         4.5          1
         K37/0685           32                  14 Mar 2018              1.0       17.0        11.6     −8.51     −60.2         3.5        0.6
         BY20/0151          33                  9 Apr 2018               6.0       39.0        11.8     −8.66     −61.3         2.2       −0.9
       ∗ ns means no screen. Depths for wells with no screens are total depths.

samples have been ordered from lowest to highest DO con-                               tor Chrome HD elemental analyser for δ 2 H (GNS Science
centrations, and four groups of samples (A to D) are iden-                             Laboratories). Results are reported with respect to VSMOW2
tified to aid discussion. Group A and Group B have low                                 (Vienna Standard Mean Ocean Water). The analytical preci-
DO values (< 4 mg L−1 ), with A having high δ 15 N (> 15 ‰)                            sion for this instrument is 0.2 ‰ for δ 18 O and 2.0 ‰ for δ 2 H.
and B having moderate δ 15 N (7 ‰–9 ‰). Group C and                                    Results are given in Table 1.
Group D have high DO (> 8.2 mg L−1 ), with C having the
highest and D having the lowest Cl and SO4 concentrations.                             3.4   Nitrate isotopes (δ 15 N and δ 18 ONO3 )

3.3   Water isotopes (δ 18 O and δ 2 H)                                                Nitrate samples (NO3 ) were converted to nitrite (NO2 ) us-
                                                                                       ing cadmium and then to nitrous oxide (N2 O) using sodium
Water samples were analysed on an Isoprime mass spectrom-                              azide in an acetic acid buffer. The N2 O was then extracted
eter by water equilibration at 25 ◦ C using an Aquaprep de-                            from the water sample, passed through a series of chemical
vice for δ 18 O and by reduction at 1100 ◦ C using a EuroVec-                          traps to remove H2 O and CO2 , and cryogenically trapped un-

https://doi.org/10.5194/hess-24-3583-2020                                                              Hydrol. Earth Syst. Sci., 24, 3583–3601, 2020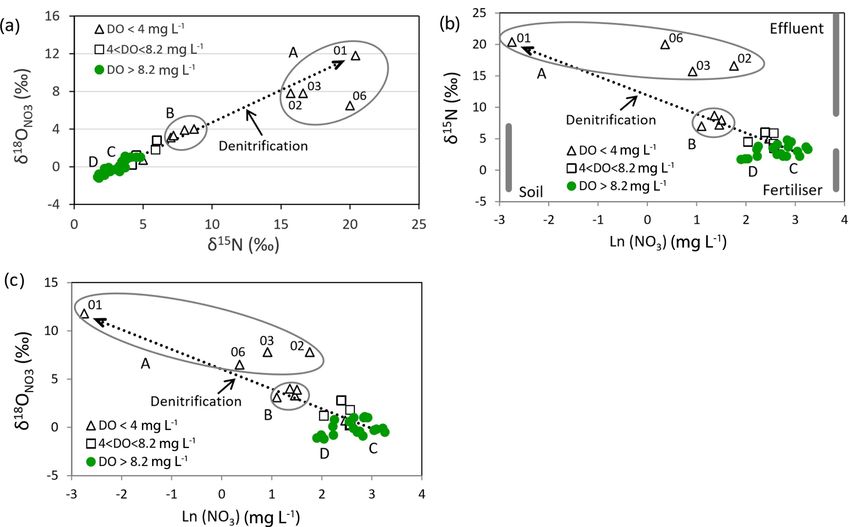
3588                            M. K. Stewart and P. L. Aitchison-Earl: Irrigation return flow and nitrate in groundwater

Table 2. Major ion chemistry of water samples.

     ID   Group          DO          Na            K           Ca         Mg               Cl         SO4      HCO3          NO3
                    (mg L−1 )   (mg L−1 )    (mg L−1 )   (mg L−1 )   (mg L−1 )       (mg L−1 )   (mg L−1 )   (mg L−1 )   (mg L−1 )
     01      A           0.18        11.9        1.02        18.8            6.6           18        11.6          78       0.064
     02      A           0.45        15.5        1.49          27           10.5         18.1        17.5         102          5.8
     03      A           0.67        13.2        1.41          23            8.5         17.6        15.3          92          2.5
     04      B           1.36        11.1        1.02        18.8            7.5         12.1        13.6          76            3
     05      B           1.68        18.5        1.25          29           10.4         17.7          35          97          4.3
     06      A           2.44        12.5        1.08          20            7.6         17.1          19          76        1.43
     07                  2.68        15.2        1.71          35            8.2           20          27          75        11.8
     08      B           2.95        15.7        1.39          24              9           17          25          85          4.5
     09      B           3.39        18.4        1.32          28            9.4         18.1          34         102          3.9
     10                  4.11        16.7        1.74          29            9.3         16.4          27          64        12.9
     11                  6.34        18.1        1.64          27             10           26          26          57        10.9
     12                  6.73        14.8        1.47          29           10.3         17.2        17.1          78        13.1
     13                  7.76        15.9        1.71          24            8.3           20          29          54         7.7
     14                  8.05        17.2        1.71          30            9.7           21          22          64          13
     15      C           8.29        17.7        1.28          35           12.4           26          36          55        17.4
     16                  8.37        14.7        1.59          30            9.4         19.3          22          66          14
     17                  8.65        16.5        1.37          24              8         17.6          24          60         9.2
     18                  8.76          16         1.5          28            9.6         16.3          21          57        13.9
     19                  9.18        17.9        1.63          33           11.2           21          25          71        15.7
     20                  9.25        14.4        1.39          30             10         15.3          22          61        17.1
     21                  9.36        14.9        1.53          29              9         18.5          29          69         7.7
     22                  9.39        17.5        1.77          36             11         19.6          26          60          21
     23      C           9.54        18.4        1.56          31            9.8           23          30          63          15
     24                   9.6        14.5         1.6          32            9.3         14.9        18.4          49          22
     25      D            9.6        10.3        1.19        16.9            5.3          9.2           5          48         9.3
     26                  9.68        15.2        1.52          32            8.8           21          27          82         9.5
     27      C           9.85          21         2.3          43           11.4           23          39          53          26
     28      C            9.9          18        1.72          38           11.9           22          33          53          25
     29      D           10.3         9.2         1.1        14.9            4.1            6         5.8          49         6.7
     30      D           10.3         9.5         1.1          14            4.4          7.1         3.8          49         7.3
     31                  10.4        15.3        1.63          35           10.5         13.2          23          77        18.5
     32                  11.6        17.7        1.77          34           10.5           21          27          77        12.8
     33                  11.8        14.8         1.5          28            7.9         13.4          18          61        16.8

der liquid nitrogen. After being cryofocused in a second trap,       4     Results
the N2 O passed through a GC (gas chromatographic) column
and into an Isoprime IRMS (isotope ratio mass spectrometer)          4.1    Groundwater chemistry
to determine its isotopic signature of nitrogen and oxygen
(GNS Science Laboratories). Our method is modified from              DO concentrations in the Tinwald groundwaters range from
McIlvin and Altabet (2005), following personal communi-              0.18 to 11.8 mg L−1 , although the majority are high and indi-
cation with Mark Altabet. Results are reported with respect          cate relatively oxic groundwater. As noted above, the data in
to atmospheric N2 standard (AIR) for δ 15 N and VSMOW                Tables 1 and 2 are ordered from lowest to highest DO values.
for δ 18 O. The analytical precision for these measurements             Chloride concentrations are useful to distinguish recharge
is 0.3 ‰ for δ 15 N and δ 18 ONO3 , except for samples below         sources. Chloride concentrations are highest in rainfall orig-
0.1 mg L−1 NO3 N which may have lower precisions. Re-                inating over the sea and near the coast and generally de-
sults are given in Table 1.                                          crease with distance inland. In particular, alpine rivers (with
                                                                     chloride values of 0–5 mg L−1 ) and coastal rainfall-derived
                                                                     infiltration (with chloride ranging from 10 to 20 mg L−1 )
                                                                     can be clearly distinguished (Hayward, 2002; Stewart et
                                                                     al., 2002). However, chloride concentrations in the Tinwald
                                                                     area (Fig. 4a) are greater than expected even for coastal

Hydrol. Earth Syst. Sci., 24, 3583–3601, 2020                                            https://doi.org/10.5194/hess-24-3583-2020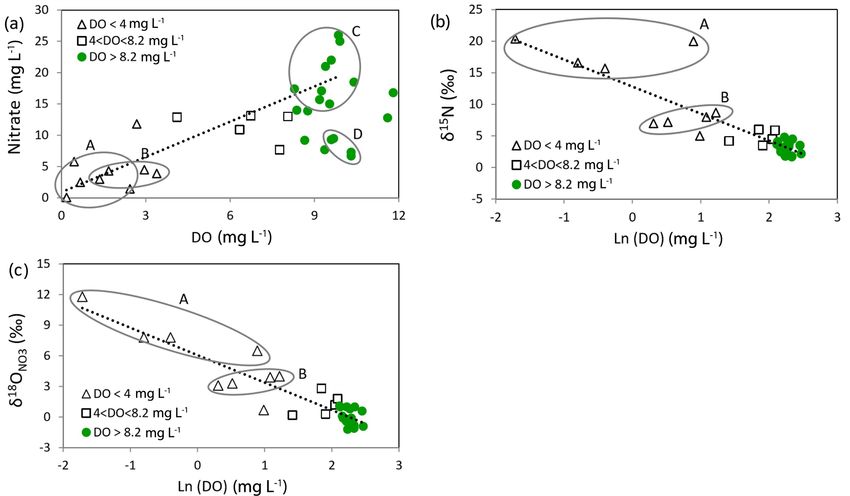
M. K. Stewart and P. L. Aitchison-Earl: Irrigation return flow and nitrate in groundwater                                     3589

rainfall (most are > 15 mg L−1 ). The values are lower (0–          alpine catchments have different isotope ratio signatures.
10 mg L−1 ) to the northeast side of the study area near the        Scott (2014) reviewed δ 18 O data for Canterbury and
Hakatere/Ashburton River and to the southwest.                      identified isotopic signatures in the Ashburton area. The
   Sulfate occurs naturally in groundwater and is present in        Hakatere/Ashburton River has very negative δ 18 O with a
fertilisers and fungicides and so can be an indicator of hu-        mean of −10.1 ‰ for the South Branch and −10.7 ‰ for
man influence when concentrations are in excess of back-            the North Branch. In contrast, rainfall recharge near the coast
ground levels as here (see Fig. 4b). As with chloride, levels       is less negative than −8 ‰, although it becomes more neg-
in alpine rivers and low-altitude rainfall infiltration are very    ative inland and is typically more negative than −8 ‰ on
different, but in the case of sulfate the difference is caused      the upper plains. The Rangitata River, the alpine source of
by the nature of additions to the soils in the respective catch-    Valetta and other irrigation scheme water, has a mean δ 18 O
ments rather than the concentrations in rainfall. Concentra-        of −9.8 ‰ (Taylor et al., 1989).
tions are lower on the northeast and southwest boundaries of           δ 18 O data collected in the greater Ashburton area are
the study area. Nitrate concentrations are shown in Fig. 4c.        shown in Fig. 6. The influence of more negative Rangi-
Nitrate concentration exceeds MAV (11.3 mg L−1 ) in 17 of           tata River-sourced water can be seen under the irrigation
33 wells sampled in the study area and is over 20 mg L−1            schemes. The δ 18 O values are less negative (red and orange
in 4 wells. The highest nitrate concentrations cluster inland       dots) in the Tinwald study area. More negative values (green
of SH1 to the west and northwest of Tinwald and under-              dots) occur on the northeast and southwest boundaries of the
lie an area of dominant cropping land use (Fig. 1b). Nitrate        area, which are related to recharge from the South Branch
is lowest on the northeast boundary of the study area (near         Hakatere/Ashburton River and the Valetta Irrigation Scheme
the Hakatere/Ashburton River), where it is generally below          water. An area south of Tinwald near the coast (Eiffleton Irri-
1/2 MAV, 5.65 mg L−1 , and lower but still over 1/2 MAV on          gation Scheme) has less negative δ 18 O values like those ob-
the southwest boundary.                                             served in the Tinwald study area for probably the same rea-
   To investigate possible irrigation return flow effects, we       sons (irrigation return flow).
compared the concentrations of different solutes and isotopes          We also sampled wells for δ 2 H in 2018. Available evi-
and include the effect of evaporation as indicated by the sta-      dence supports a local meteoric water line (LMWL) for Can-
ble water isotopes (Fig. 5a–c). Figure 5a shows water δ 18 O        terbury with intercept d = +10 ‰ (Stewart and Taylor, 1981;
versus chloride. Higher δ 18 O correlates with higher chloride,     Taylor et al., 1989; Stewart and Morgenstern, 2001; Scott,
but this is not due to evaporation (because the evaporation         2014; Stewart et al., 2018); i.e. the LMWL is
vector is not parallel to the trend). Instead the main influence
                                                                    δ 2 H = 8.0δ 18 O + 10.                                     (1)
is the source of the recharge because both chloride and δ 18 O
are higher in local-groundwater recharge (e.g. Group C sam-         Paired δ 18 O and δ 2 H data for the Tinwald study are plotted
ples) and lower in alpine-river recharge (Group D samples).         in Fig. 7. The Tinwald data plot below the LMWL and have
There is no effect due to DO. Sample 21 shows an extra evap-        a linear best-fit line (excluding sample 21, which has been
oration effect.                                                     affected by extra evaporation) given by
   Figure 5b shows that chloride and sulfate are well corre-
                                                                    δ 2 H = 6.3δ 18 O − 7.2.                                    (2)
lated especially when the low-DO samples are excluded. This
trend is also due to the recharge sources (see Group C and          The slope of less than 8 for this line indicates that the wa-
Group D samples in the figure). Evaporative enrichment is           ters have been affected by evaporation. A ratio of about 5
slight. The low-DO samples conform to the overall trend but         in the 2 H and 18 O enrichments is expected for evaporation at
are more scattered than the other samples.                          ambient temperatures (Stewart, 1975). It is likely that the iso-
   Figure 5c shows that nitrate and chloride are moderately         topic compositions of the water would have been enriched by
correlated due to the recharge sources (see Group C and             evaporation and/or evapotranspiration during the irrigation
Group D samples), but there are other processes affecting the       return flow process. Estimates of the isotopic enrichments
nitrate concentrations. The low-DO waters have low nitrate          required to explain the displacement of the average isotopic
concentrations, indicating that they have been partially deni-      compositions of the group from the LMWL are shown by the
trified. Evaporation has a negligible effect.                       red arrow with a slope of 5 in Fig. 7. The average isotopic
   The clear message from these results is that nitrate, sulfate,   composition of the samples except sample 21 (Table 1) was
and chloride concentrations are increased in areas irrigated        (−8.58, −61.2), where the bracket represents (δ 18 O, δ 2 H).
by local groundwater compared to those irrigated by alpine-         The average initial composition of the samples would then
river water.                                                        have been (−9.43, −65.4), i.e. where the red arrow with a
                                                                    slope of 5 meets the LMWL (marked by the small red cir-
4.2   Water isotopes δ 18 O and δ 2 H                               cle in Fig. 7). This degree of isotopic enrichment is obtained
                                                                    by evaporation of approximately 5 % of the water according
δ 18 O values are useful as tracers of the sources of recharge      to both isotopes (see the calculation in Appendix A). Uncer-
to groundwater, because rainfall recharge and rivers from           tainty in this evaporated fraction is small because the isotopic

https://doi.org/10.5194/hess-24-3583-2020                                        Hydrol. Earth Syst. Sci., 24, 3583–3601, 2020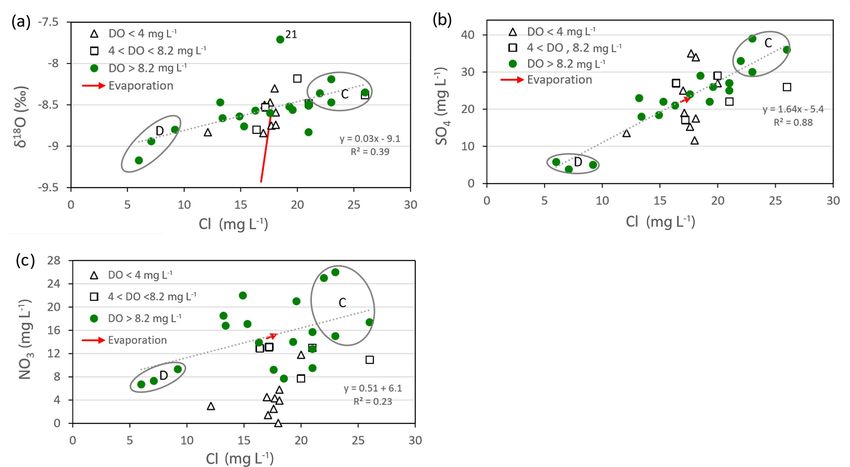
3590                              M. K. Stewart and P. L. Aitchison-Earl: Irrigation return flow and nitrate in groundwater

Figure 4. (a) Chloride, (b) sulfate, and (c) nitrate concentrations in the Tinwald study area (the smaller dots indicate maximum concentrations
measured prior to the 2018 investigation). Base maps © LINZ (2019).

composition of the remaining water changes rapidly with the               4.3   Nitrate isotopes δ 15 N and δ 18 ONO3
degree of evaporation due to the form of the equation, so con-
siderable changes of isotopic composition do not change the               The nitrate isotope results are given in Table 1 and plotted
fraction evaporated much.                                                 in Fig. 8a. The samples have symbols depending on their
   In addition, the difference in the δ 18 O and δ 2 H values of          DO concentrations, as in previous figures. The figure dis-
Group C and Group D is attributed to their different irrigation           plays two important features:
sources (local groundwater or alpine-river water) as observed               1. There is a very good linear relationship between the
for the chemical compositions. Assuming that both groups                       δ 15 N and δ 18 ONO3 values of the nitrate.
are affected by evaporation to the same extent, the difference
between the groups compared to the difference between the                   2. Their positions along the line depend on their DO con-
irrigation sources will give an approximate measure of the                     centrations.
irrigation input. The δ 18 O difference between Group C and
Group D is 0.63 ‰ (Table 4), and that between the sources                 The first feature is the linear relationship between the δ 15 N
is 1.63 ‰, giving an irrigation input of 39 %. For δ 2 H it is            and δ 18 ONO3 values of the nitrate (except sample 06 and to
4.1 ‰ compared to 10.2 ‰, giving a 40 % irrigation input.                 a smaller extent samples 02 and 03). Denitrification causes
These may be slight overestimates because Group C waters                  increased δ values of nitrate, along with a decrease of ni-
may be more affected by evaporation than Group D waters.                  trate concentration. The slope of the isotopic enrichments
(The compositions of the irrigation sources are taken as local            caused by denitrification (i.e. enrichment in δ 18 ONO3 divided
rainfall (−8.17, −58.7) and alpine river (−9.80, −68.9).)                 by the enrichment in δ 15 N) has been reported to be in the
                                                                          range 0.48–0.77 (Kendall, 1998; Burns et al., 2011; Kaushal
                                                                          et al., 2011; Zhang et al., 2019). The line shown in Fig. 8a
                                                                          has a slope of 0.68 and was calculated to simulate the ef-

Hydrol. Earth Syst. Sci., 24, 3583–3601, 2020                                               https://doi.org/10.5194/hess-24-3583-2020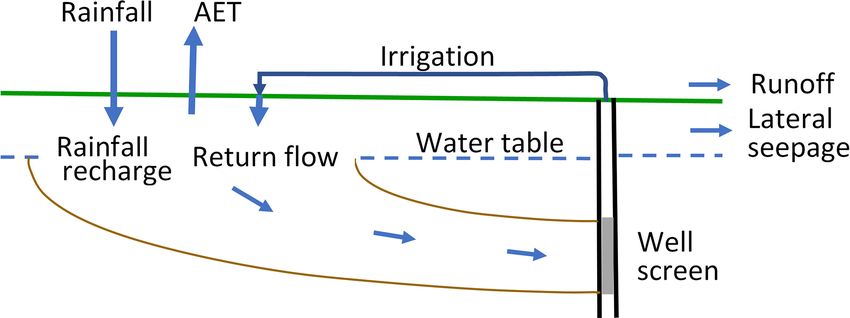
M. K. Stewart and P. L. Aitchison-Earl: Irrigation return flow and nitrate in groundwater                                                3591

Figure 5. Plots of (a) chloride versus water δ 18 O, (b) chloride versus sulfate, and (c) chloride versus nitrate concentrations. Group C (with
land surface irrigation recharge) and Group D (alpine-river recharge) are circled. The red arrow shows the predicted effect of evaporation.

                                                                          Figure 7. Paired δ 2 H and δ 18 O data in the Tinwald study area. The
                                                                          average initial composition of the well waters is indicated by the
                                                                          small red circle. Group C and Group D samples are circled.

                                                                          fication calculations for each of the isotopes are plotted in
                                                                          Fig. 8b and c (see Appendix B and Table 3). The starting
                                                                          point for the denitrification lines was chosen to be the aver-
Figure 6. δ 18 O in the Ashburton area at groundwater and surface         age of the Group C samples. The linear relationship shows
water sites. Data outside of the Tinwald study area are mean δ 18 O       that either the various sources of nitrate all produce nitrate
from all available measurements; inside the study area δ 18 O is the      with the same isotopic δ values (which is contrary to what
single result from the current sampling. Base map © LINZ (2019).          we know), or more probably nitrate leaching from the soil is
                                                                          blended by processes in the soil (Wells et al., 2015) and by
                                                                          irrigation return flow. The exceptions are sample 06 and to a
                                                                          lesser extent samples 02 and 03; their isotopic compositions
fect of denitrification using the Rayleigh formula to repre-
                                                                          (Fig. 8a) suggest that they initially had higher δ 15 N than the
sent the process (Kendall, 1998). Similar denitrification line
                                                                          other samples and therefore a greater proportion of effluent
slopes of 0.73 and 0.75 were observed by Clague et al. (2015)
                                                                          nitrate.
and Stenger et al. (2018) respectively. The individual denitri-

https://doi.org/10.5194/hess-24-3583-2020                                               Hydrol. Earth Syst. Sci., 24, 3583–3601, 2020
3592 M. K. Stewart and P. L. Aitchison-Earl: Irrigation return flow and nitrate in groundwater
Figure 8. (a) Plot of δ 15 N versus δ 18 ONO3 . Group A and Group B are circled, and Group C and Group D are indicated by letters. (b, c) Plots
of δ 15 N and δ 18 ONO3 versus the natural log of the nitrate concentration.
Table 3. Results of calculations of the δ 15 N or δ 18 O values of ni- (with δ 15 N values from 15 ‰ to 20 ‰), Group B waters
trate affected by denitrification. The initial nitrate concentration was with DO from 1.36 to 3.39 mg L−1 and δ 15 N values from
19 mg L−1 , and the δ0 values were δ 15 N = 3.1 ‰ and δ 18 ONO3 = 7 ‰ to 9 ‰, and one other well (07) that in contrast shows
0.0 ‰. The enrichment factors used were ε(15 N) = −3.0 ‰ and only minor denitrification (δ 15 N is 5 ‰) despite its rela-
ε(18 O) = −2.1 ‰. f is the fraction of nitrate remaining after deni- tively low DO (2.68 mg L−1 ). The intermediate-DO group
trification. (4 < DO < 8.2 mg L−1 ) has intermediate nitrate concentra-
tions and shows smaller denitrification effects (δ 15 N val-
f NO3 Ln(NO3 ) δ 15 N δ 18 ONO3 ues from 3.5 ‰ to 6.0 ‰, samples 10–14). The highest-DO
(mg L−1 ) (‰) (‰) group (with DO > 8.2 mg L−1 ) is nearly saturated with oxy-
1.0 19 2.94 3.1 0.0 gen and shows minimal denitrification effects (δ 15 N values
0.7 13.3 2.59 4.2 0.7 from 1.7 ‰ to 4.8 ‰, samples 15–33).
0.5 9.5 2.25 5.2 1.4 Figure 8b shows the natural log of the nitrate concentra-
0.3 6.65 1.89 6.7 2.5 tions versus δ 15 N values; the natural log is used because the
0.2 3.8 1.34 7.9 3.3 denitrification line will be linear on this type of plot accord-
0.1 1.9 0.64 10.0 4.7 ing to the Rayleigh formula (Appendix B). The grey bands
0.04 0.76 −0.27 12.8 6.6 show approximate values of the δ 15 N values of possible ni-
0.02 0.38 −0.97 14.8 8.0
trate sources (i.e. natural soil with δ 15 N of −3 ‰ to 7 ‰, in-
0.01 0.19 −1.66 16.9 9.4
organic fertiliser with −3 ‰ to 3 ‰, and effluent with 9 ‰ to
0.004 0.076 −2.58 19.7 11.3
25 ‰; Fogg et al., 1998; Stewart et al., 2011). The Ln(NO3 )
values they are plotted at are schematic; we normally expect
background nitrate concentrations from natural sources in
soil to be about < 0.7 to 1 mg L−1 (Close et al., 2001; Daugh-
The second feature of the figure is surprising. Denitrifi-
ney and Reeves, 2005). Nitrogen-fixing clover is a possible
cation is only expected to take place where DO levels are
source of nitrate with an isotopic composition like that of
very low (e.g. < 0.5 mg L−1 ; McMahon and Chapelle, 2008).
soil nitrate in pasture in Canterbury (Trevis, 2012), but we
But here denitrification effects are observed even when the
think its contribution is not large because the abundance of
DO concentrations in the groundwaters are much higher.
clover has decreased over the years as fertiliser use (particu-
The lowest DO range in Table 1 (with DO < 4 mg L−1 ,
larly urea) has increased.
samples 01–09) includes Group A waters which have the
lowest DO values and most marked denitrification effects
Hydrol. Earth Syst. Sci., 24, 3583–3601, 2020 https://doi.org/10.5194/hess-24-3583-2020M. K. Stewart and P. L. Aitchison-Earl: Irrigation return flow and nitrate in groundwater 3593
The enrichment factors producing the denitrification lines
in Fig. 8b and c are ε(15 N) = −3.0 ‰ and ε(18 O) =
−2.1 ‰ (Table 3). These are similar to the ranges deter-
mined by Clague et al. (2015) (ε(15 N) = −1.1 ‰ to −9.6 ‰
and ε(18 O) = −1.0 ‰ to −7.2 ‰) and values by Stenger et
al. (2018) (ε(15 N) = −2.0 ‰ and ε(18 O) = −1.3 ‰), while
Mariotti et al. (1988) gave an ε(15 N) range from −5 ‰ to
−8 ‰. Other authors (Kendall, 1998, and references therein) Figure 9. Schematic view of recharge and irrigation return flow in
gave much larger negative values. Mariotti et al. (1988) sug- the Tinwald hotspot.
gested that low values may occur if denitrification occurs in
dead-end pores causing a non-fractionating sink for nitrate
by diffusion. Stenger et al. (2018) considered that small-scale dominated by inorganic fertiliser but has a small proportion
physical heterogeneity, including the localised distribution of of effluent source based on 15 N (it is assumed that the highest
resident electron donors and the effect of lateral flows, was a nitrate concentrations are little affected by denitrification).
more likely cause with their coarse-textured ignimbrite ma-
terials.
Figure 8c shows the natural log of the nitrate concentra- 5 Discussion
tions versus δ 18 ONO3 values. As with Fig. 8a and b, the deni-
trification line through Group C and Group B wells project to 5.1 Irrigation return flow effects on chemical and
sample 01. This well is located south of Tinwald near Lagh- isotopic concentrations
mor Creek in the Hinds swamp denitrification area. Group A
wells show the greatest denitrification effects; the other sam- Fertilisers have been applied to much of the area between
ples in the group (02, 03, and 06) lie to the right of the den- the Ashburton River and Hinds River, not just to the Tinwald
itrification line in Fig. 8b, indicating that they have larger study area, and rainfall applies to the whole area with con-
proportions of effluent than the rest of the samples. Sam- tours of the δ values in rainfall decreasing inland from the
ples 02 and 03 occur downgradient of the old Tinwald Sa- coast (Stewart et al., 2002). Yet the Tinwald area shows ele-
leyards; sample 06 is northwest of SH1 in an area of lifestyle vated nitrate concentrations (and chloride, sulfate, etc.) com-
blocks adjacent to the major cropping area. It is probable that pared to the surrounding areas (see Fig. 2). The difference is
the effluent source is providing a source of dissolved organic that the Tinwald study area is irrigated by groundwater from
carbon to fuel denitrification reactions in Group A wells. shallow local wells with high solute concentrations, whereas
Group B wells (showing moderate denitrification) are lo- much of the rest of the area is irrigated by alpine-river water
cated closest to the Hakatere/Ashburton River. One sam- with low solute concentrations.
ple (04) is in the cropping area, and the others (05, 08, and The irrigation return flow process is illustrated schemati-
09) are in areas with lifestyle blocks, which could contribute cally in Fig. 9. Dewandel et al. (2007) defined an irrigation
both septic tank and animal effluent to assist denitrification. return flow coefficient C equal to the recharge from irriga-
Group C wells (representative of wells irrigated by local tion (i.e. irrigation return flow, IRF, divided by the irrigation
groundwater) are distributed through the central part of the flow itself, I , so that C = IRF/I ). C is also equal to the over-
high-nitrate hotspot. They plot in the upper part of the cluster all recharge rate for rainfall and irrigation in our system (we
of green points in Fig. 8a and to the right in Fig. 8b and c. omit surface runoff and lateral seepage in this treatment be-
Group D wells (representative of wells irrigated more by cause both are expected to be small). (Note that drains in the
alpine-river water) are located on the southwest boundary of area are fed mainly by groundwater.) C is used to quantify
the study area. They plot in the lower part of the green point the effect of irrigation return flow on the water balance.
cluster in Fig. 8a and to the left in Fig. 8b and c. The average chemical concentrations of Group C and
The green points in Fig. 8 have δ 15 N values that are mostly Group D are taken as representative of the Tinwald hotspot
within the soil nitrate or inorganic-fertiliser ranges and show and outside groundwaters respectively (average values and
little evidence of denitrification. Natural soil nitrate alone standard deviations for each chemical are given in Table 4).
does not account for the slightly elevated nitrate concentra- The table also gives the enrichment factors and irrigation re-
tions in these wells, making inorganic fertiliser (or rather turn flow coefficients between Group C and Group D derived
organic N derived from it; see discussion below) the likely from each chemical; the enrichment factor is equal to 1/C
dominant source. assuming that chemicals input via rainfall and irrigation are
A mixing curve between two nitrate source end members concentrated into the recharge fraction, i.e. concentrated by
(soil nitrate and fertiliser plus effluent mixture nitrate) has the loss of actual evapotranspiration (AET). Cl mass bal-
been fitted to the solid green points (Appendix C). The best- ance has often been used to estimate recharge because it
fitting curves give δ 15 N = 4.1 ‰ and δ 18 ONO3 = 0.0 ‰ for is conservative; here the enrichment factor is 3.2, and co-
the blended nitrate source. This indicates that the source is efficient C obtained is 31 %. The SO4 enrichment factor is
https://doi.org/10.5194/hess-24-3583-2020 Hydrol. Earth Syst. Sci., 24, 3583–3601, 20203594 M. K. Stewart and P. L. Aitchison-Earl: Irrigation return flow and nitrate in groundwater
Table 4. Average chemical and isotopic concentrations of Group C and Group D. Enrichment factors and IRF coefficients (C) for the
chemicals and isotopic differences and irrigation inputs for the isotopes are given.
Quantity Group D Group C Enrichment Coefficient
factor C (%)
Cl (mg L−1 ) 7.4 ± 1.1 23.5 ± 1.3 3.2 31
SO4 (mg L−1 ) 4.9 ± 0.7 34.5 ± 3.0 7.0 –
HCO3 (mg L−1 ) 48.7 ± 0.4 56 ± 3.7 1.2 –
NO3 (mg L−1 ) 7.8 ± 1.0 20.9 ± 4.2 2.7 37
Na (mg L−1 ) 9.7 ± 0.4 18.8 ± 1.2 1.9 53
K (mg L−1 ) 1.13 ± 0.04 1.72 ± 0.33 1.5 67
Ca (mg L−1 ) 15.3 ± 1.0 36.8 ± 3.9 2.4 42
Mg (mg L−1 ) 4.6 ± 0.4 11.4 ± 0.9 2.5 40
Mean 2.4 42
Difference Irrigation
input (%)
δ 18 O (‰) −8.97 ± 0.13 −8.34 ± 0.09 0.63 39
δ 2 H (‰) −64.2 ± 0.2 −60.1 ± 0.6 4.1 40
very large (7.0), suggesting greater fertiliser input into the such modelling by lengthening the timescale of nitrate trans-
Group C area soil than into the Group D area soil. The port by abstracting water from groundwater downstream and
HCO3 factor is small (1.2) probably because of chemical re- applying it upstream and by adding nitrate on a second pass
equilibration as water passes through the soil in both areas. through the soil.
The average enrichment factor is 2.4, and coefficient C is Another effect of irrigation return flow is distortion of
42 % for all of the chemicals except SO4 and HCO3 . Val- tracer age dating results. Tritium concentrations will not be
ues of coefficient C can be compared with lysimeter mea- reset by interaction with the atmosphere when irrigation wa-
surements of the recharge fraction from the nearby research ter is applied to the soil, so the tritium residence times of
station of Winchmore (Thorpe and Scott, 1999, Fig. 2); groundwater affected by irrigation return flow will appear to
the recharge fraction is recharge divided by input (i.e. rain- be older than they really are. In contrast, CFC and SF6 resi-
fall plus irrigation). Thorpe and Scott (1999) found that the dence times will be reset to zero in the soil, and groundwater
recharge fraction at Winchmore was about 39 % for the aver- residence times will reflect time since recharge. This appears
age irrigation input of 200 mm yr−1 , in good agreement with to be the case for data in the Tinwald area, although data are
the chemical results above. scarce (Stewart et al., 2002).
The δ 18 O and δ 2 H values of Group C and Group D A practical consideration is that if irrigation water al-
are affected by the different irrigation water sources (local ready contains nitrate then too much fertiliser could be ap-
groundwater or alpine-river water) and by evaporation as de- plied leading to unnecessary economic cost and greater ni-
scribed in Sect. 4.2. An irrigation input of up to 40 % is in- trate leaching potential, if the nitrate in the groundwater is
dicated by the mean isotopic compositions of Group C and not accounted for by nutrient budgeting (e.g. Flintoft, 2015).
Group D. Evaporation is indicated by displacement of the
sample points from the LMWL in Fig. 7. An approximate 5.2 Nitrate dual-isotope concentrations
calculation given in Appendix A shows that evaporation of
about 5 % of the water can explain the average displacement 5.2.1 Nitrate source identification
of the points.
Irrigation return flow has important implications for man- Nitrate isotope results that have not been affected by den-
agement of nitrate in agriculture. An important aspect of wa- itrification (i.e. usually the oxic samples) potentially give
ter resource management is understanding and modelling of information on the nitrate sources and also on the start-
nitrate transport in water systems (in this case groundwater). ing points for denitrification vectors. Numerous studies of
Much effort is being expended to model the effects of nitrate the δ 15 N values produced by different nitrate sources have
produced by farming practices in order to introduce and sub- identified ranges which have differed under local condi-
stantiate appropriate controls on farming to protect the wa- tions (e.g. Kendall, 1998; Fogg et al., 1998; Stewart et al.,
ter supplies of downstream communities (e.g. Environmental 2011, Fig. 8b). Results for oxic samples from recent New
Canterbury, 2020). Irrigation return flow can seriously distort Zealand studies are given in Fig. 10. The rectangles show
source signature fields resulting from urea fertiliser, soil N,
Hydrol. Earth Syst. Sci., 24, 3583–3601, 2020 https://doi.org/10.5194/hess-24-3583-2020M. K. Stewart and P. L. Aitchison-Earl: Irrigation return flow and nitrate in groundwater 3595
2018). The process of mineralisation and re-oxidation resets
δ 18 ONO3 and also changes δ 15 N. The time delays in this pro-
cess can be considerable (as much as several decades; Sebilo
et al., 2013). This means that there will be a legacy of or-
ganic N built up in the Tinwald soil from past applications
of fertiliser in addition to past soil management practices.
This time delay is in addition to the time delay due to the
mean residence time of the groundwater. Others have pre-
viously identified the importance of organic N in the soil –
variously known as soil organic matter (SOM; Somers and
Savard, 2009) or soil organic nitrogen (SON; Wells et al.,
2015) – as the pool of nitrogen within the soil controlling the
rate and timing of nitrate releases to groundwater. The trans-
fer to organic N is most efficient at times of high microbial
activity (spring and summer growth) and much less in low
Figure 10. Plot of the nitrate isotopic source signatures from sev- microbial activity (winter), when increased nitrate leaching
eral New Zealand studies. Red rectangle – 0.4 m suction samples at to the groundwater is likely (Mengis et al., 2001; Somers and
Toenepi Catchment (Clague et al., 2015). Purple rectangle – stream Savard, 2009).
samples from Harts Creek (Wells et al., 2016). Blue rectangle – oxic The nitrate isotopes (Fig. 8a) show an unexpected blending
water samples from Waihora wellfield northwest of Lake Taupo of the isotopic compositions of the nitrate in the groundwa-
(Stenger et al., 2018). Orange double arrows – δ 15 N values only ter (and therefore the soil and vadose zone). This blending is
from groundwater in the Waimea Plains (Stewart et al., 2011) and
considered to be due to irrigation return flow in conjunction
oxic waters (Group C and Group D) from the present investigation.
with the action of organic N in mediating and retaining N
in the soil. This has allowed the denitrification process to be
identified and explored in this study and the enrichment fac-
and/or ruminant excreta at Toenepi Catchment (Clague et al., tors for denitrification to be determined.
2015); urine, urea, and/or soil N at Harts Creek (Wells et al.,
2016); low-intensity animal grazing (soil N and/or manure) 5.2.2 Denitrification imprint in oxic groundwater
at Waihora wellfield (Stenger et al., 2018); two sources (inor-
ganic fertilisers plus manure and piggery effluent) at Waimea The nitrate isotopes show clearly that denitrification is im-
Plains (Stewart, 2011); and inorganic fertiliser, urea, and/or portant in Tinwald groundwater (Fig. 8). Firstly, the nitrate
manure at Tinwald (Group C and Group D; this work). De- isotopes show that the nitrate sources are blended within the
spite the variety of nitrate sources, the δ 15 N values generally soil and that inorganic fertilisers are dominant with minor
show overlapping ranges as illustrated in Fig. 10 (except for effluent input. Secondly, the nitrate concentration and iso-
the Waimea Plains piggery effluent source). topic compositions are correlated with the DO concentra-
Use of δ 18 ONO3 in combination with δ 15 N to identify ni- tions, despite most of the groundwaters having DO concen-
trate sources has not been very successful, as illustrated in trations greater than the levels at which denitrification can
Fig. 10, where the δ 18 ONO3 values overlap each other. On occur (McMahon and Chapelle, 2008; Rivett et al., 2008).
the other hand, the combination has proven to be effective for The correlations are displayed in Fig. 11a–c. The rela-
detecting the occurrence of processes in the nitrogen cycle, tionship between DO and nitrate is approximately linear
such as nitrification and denitrification (Aravena and Robert- (Fig. 11a) with the nitrate concentrations being more scat-
son, 1998). The only distinctive source δ 18 ONO3 values are tered at the high DO end related to the recharge sources
those expected for nitrate fertiliser (see “Nitrate fertilisers” (Group C and Group D; see earlier results). The line fitted to
box in Fig. 10; Xue et al., 2009; Wells et al., 2015). Many samples with DO < 8.2 mg L−1 and Group C samples shows
researchers have looked for such δ 18 ONO3 values and gener- an average trend reflecting denitrification. Figure 11b and c
ally failed to find them (Kloppman et al., 2018). Instead the shows that δ 15 N and δ 18 ONO3 plotted against Ln(DO) also
values observed in groundwaters are usually characteristic of have average linear trends fitted to them related to denitrifi-
soil nitrate or effluent (as illustrated in Fig. 10). cation.
The probable answer to this failure to observe the ex- Stenger et al. (2008) pointed out a similar situation where
pected high δ 18 ONO3 values in groundwater is that inorganic- denitrification was inferred by unexpectedly low nitrate con-
fertiliser-derived nitrate is not directly and rapidly transferred centrations, but DO concentrations although varied were not
to groundwater but is retained in the soil–plant system as or- particularly low. There was, however, an approximate cor-
ganic N and only later mineralised and re-oxidised thereby relation of nitrate and DO, as here. Manganese (Mn) and
becoming available for leaching to the groundwater (Somers Iron (Fe) are other indicators of reducing conditions. Both
and Savard, 2009; Wells et al., 2015; Kloppmann et al., cases (Stenger et al., 2008, and Tinwald) show the expected
https://doi.org/10.5194/hess-24-3583-2020 Hydrol. Earth Syst. Sci., 24, 3583–3601, 20203596 M. K. Stewart and P. L. Aitchison-Earl: Irrigation return flow and nitrate in groundwater
Figure 11. (a) Plot of DO versus nitrate concentration. (b, c) Plots of Ln(DO) versus δ 15 N and δ 18 ONO3 .
patterns of low nitrate concentrations when Mn and Fe are 6 Conclusions
elevated (indicating very reduced conditions) and higher ni-
trate concentrations when Mn and Fe are very low (indicating
oxidising conditions). Chemical measurements at Tinwald corroborated previous
Several factors suggest that the denitrification imprint indications of an area of high nitrate concentration in the
arises from localised denitrification in fine pores where con- groundwater, which is accentuated by irrigation return flow
ditions are reducing. (1) Koba et al. (1997) showed that den- in the area. During the recirculation process by spray irri-
itrification can occur in anaerobic pockets within otherwise gation of local groundwater, the chemical composition of the
oxic sediments or water bodies. (2) The low values of ε(15 N) groundwater is enriched by recirculation of water already rel-
and ε(18 O) observed here indicate that denitrification occurs atively high in chemicals, along with a further gain of chem-
in fine pores or small-scale physical heterogeneity. (3) The icals from the soil. The irrigation return flow coefficient (C)
occurrence of the denitrification imprint in moderately oxic of about 0.4 indicates a chemical enrichment factor of close
waters (in which denitrification could not have occurred) to 2.6, in approximate agreement with the observed chemical
means that the denitrification must have occurred in parts of enrichment factors for different elements. The stable isotopes
the system which were much more reducing. Logically these of the groundwater show enrichment by evaporation, which
are fine pores or inhomogeneities containing electron donors can be accounted for by an average evaporative loss of about
with heterotrophic bacteria. 5 % compared with the rainfall source of the water. Compar-
The Tinwald study area is not in an area where the ground- ison of the isotopic compositions of groundwater in the Tin-
water is generally reducing (Close et al., 2016), but never- wald hotspot and outside it indicate that the irrigation input
theless groundwater from some wells shows the denitrifica- to recharge is about 40 %, in agreement with the chemical
tion imprints. It would appear that denitrification imprints in and recharge measurements. The effects of irrigation return
moderately oxic groundwater should be common, but many flow are not often described but have considerable manage-
more nitrate isotope measurements would be required to ment implications, e.g. modelling of nitrate transport through
show this. soil–groundwater systems could be highly unrealistic if irri-
As a final comment, there appear to be two types of pore gation return flow effects are disregarded. In addition, too
space in the gravels at Tinwald, i.e. larger pores with mobile much fertiliser could be applied, leading to unnecessary eco-
water and finer pores with almost stagnant water, that com- nomic cost and greater leaching of nitrate to groundwater if
municate by diffusion (e.g. Dann et al., 2009). This is likely nitrate in irrigation water is not accounted for.
to cause a slowing of nitrate transport and decrease of nitrate Irrigation return flow also appears to have caused a blend-
within the system as nitrate is transferred to the finer pores ing of the nitrates from different sources in the soil as shown
and denitrified. by their nitrate isotope compositions. The blended source is
dominated by fertiliser which has been transformed by the
Hydrol. Earth Syst. Sci., 24, 3583–3601, 2020 https://doi.org/10.5194/hess-24-3583-2020You can also read


