Water Use In the Eagle Ford Shale
←
→
Page content transcription
If your browser does not render page correctly, please read the page content below
APRIL 2014

Water Use In
  the Eagle
 Ford Shale
An Economic and Policy Analysis
 of Water Supply and Demand

                             Arnett, Benton
                               Healy, Kevin
                           Jiang, Zhongnan
                             LeClere, David
                         McLaughlin, Leslie
                              Roberts, Joey
                        Steadman, Maxwell
            A Report to
    Commissioner Christi Craddick
     Texas Railroad Commission
WATER USE IN THE EAGLE FORD SHALE Page 1 Executive Summary The Eagle Ford Shale is a massive geologic formation located in South Texas spanning 30 Texas counties from Brazos County in the north east to Webb County in the southwest. With the advent of hydraulic fracturing (HF) and horizontal drilling, over 200 operators have been able to tap into previously inaccessible shale reserves to produce abundant amounts of oil and gas. The oil and gas proliferation in the Eagle Ford has seen exponential growth, and production is not anticipated to decline until 2025. In addition, a typical HF well in the Eagle Ford is estimated to consume about 13 acre-feet of water for a standard 5000 foot lateral. Approximately 90% of water for HF comes from fresh groundwater aquifers. This interaction of HF and water consumption is of primary importance from a political and economic perspective. This serves as the focal point of our report. Using the tools of statistics, our research considered the groundwater consumption trends within the Eagle Ford counties using water consumption data of municipal, irrigation, mining (oil and gas) and other categories over a span of four years. This analysis showed that fresh groundwater is being consumed at about 2.5 times the groundwater recharge rates. Furthermore, irrigation is using more water than all other water-consuming categories combined. Thus, the water problem reaches well beyond the use of fresh groundwater for mining. With respect to likely requirements of water for HF, we posited this question: “Will technology bail us out?” Retrofitting learning curves to our data for water uses and the length of the well lateral, we find that after initial improvements in water usage, the technology appears to have stabilized. This, coupled with massive irrigation water consumption suggests that technology will not be a major source of water savings in the long run. Instead, we must look to better public policies. From a policy perspective, the status quo for groundwater use is governed by the Rule of Capture and the oversight of groundwater conservation districts (GCDs). There exists a real conflict as large-scale water users are competing for a diminishing aquifer resource with no market signals of increasing scarcity. In addition, groundwater wells drilled in connection with oil and gas exploration are exempt from GCD permitting requirements and receive a de facto “free pass” to water for HF. Likewise, limitations imposed on irrigation users by the GCDs are rarely binding, so these users usually get a free pass as well. Our analysis leads us to three basic policy recommendations. The first involves mandatory reporting of all groundwater uses by all classes of water users. Currently, government agencies and the public lack basic information on actual water consumption; this policy seeks to relax that knowledge gap and bring transparency. Second, we propose incentivizing oil and gas companies to substitute brackish groundwater for fresh groundwater. Our proposal calls for a severance tax reduction for those companies limiting fresh groundwater use for HF in the Eagle Ford. In addition to a temporary reduction in the severance tax, these companies could be recognized by the RRC and possibly the TCEQ for their environmental stewardship with a “Green Star” designation. Our third, most heterodox and long-term recommendation is to define groundwater property rights on a per-acre ownership basis, which would attach to the surface owner’s real property. Under this system, the owners of the water rights would be able to sell their water as they would any other resource, and the market would adjust the price of water to an economically efficient level. Most importantly, it would remove the incentive to use all you can today, leaving more water for the future at a lower future price. THE BUSH SCHOOL OF GOVERNMENT AND PUBLIC SERVICE 4220 TAMU COLLEGE STATION, TX 77843-4220
WATER USE IN THE EAGLE FORD SHALE                                  Page 2

Acknowledgements
We wish to recognize the organizations that have been extremely helpful to us as we performed our
research. Throughout the process we realized how politically sensitive issues concerning water and
hydraulic fracturing are to both Texas residents and industries operating in the state. Fortunately, there
were many individuals across a wide spectrum of professions who were willing to speak candidly to help
us understand the issues and technical information needed to complete our report. We are very grateful
to these individuals.

First and foremost, Commissioner Craddick’s staff, under Bill Black’s direction, was always quite
responsive in pulling together a wealth of data. Likewise, the staff at the TCEQ and the TWDB was
always quite willing to explain the data issues. We were fortunate to have had a prominent Austin water
attorney, Ed McCarthy, who offered his services pro bono to help us grasp the legal nuances that
complicate this problem. Special thanks are in order to Bruce Smith of IHS, which provided the data on
water consumption and length of laterals for HF wells in the Eagle Ford on a pro bono basis. We also
wish to acknowledge help from Mike Mahoney (former director of the Evergreen Water Conservation
District), Ron Green (Southwest Research Institute), and David Burnett (Professor of Petroleum
Engineering at Texas A&M). In addition to the mentioned individuals above, we receive anonymous
assistance from many individuals; we would like to respect their request of anonymity while extending
our appreciation. Finally, we wish to thank our faculty advisor for this project, Professor James Griffin.
Any errors or omissions in this report are the responsibility of the authors and not the above mentioned
persons.

THE BUSH SCHOOL OF GOVERNMENT AND PUBLIC SERVICE                  4220 TAMU COLLEGE STATION, TX 77843-4220
WATER USE IN THE EAGLE FORD SHALE                                                                    Page 3

Table of Contents
Introduction .................................................................................................................................................. 4
Summary of Groundwater Trends in the Eagle Ford .................................................................................... 6
Will Technology Bail Us Out? ........................................................................................................................ 9
Learning Curves for Hydraulic Fracturing Operations ................................................................................ 10
The Status Quo: The Competing Interests of the Rule of Capture and GCDs ............................................. 13
Overview of Policy Recommendations ....................................................................................................... 15
   Policy Recommendation 1. Mandatory Reporting for all Water Uses................................................. 15
   Policy Recommendation 2. Incentivizing the Substitution of Brackish for Fresh Groundwater.......... 16
   Policy Recommendation 3. Well-defined Property Rights................................................................... 18
Appendices
Appendix A.           Estimating Groundwater Consumption & Recharge Rates ................................................. 20
Appendix B.           Forecasts of Potential HF Water Use .................................................................................. 21
Appendix C.           Evaluation of Severance Tax Reduction .............................................................................. 22
Appendix D.           Statistical Analysis of Water-saving Technological Change ................................................ 23
Appendix E.           Further Understanding the Relationship between GCD and GMA ..................................... 25
Appendix F.           The Evolving Law of Takings................................................................................................ 26
Appendix G.           Sample Reporting Form ...................................................................................................... 29

Figures
Figure 1: Map of the Eagle Ford Shale Oil, Gas and Condensate Play .......................................................... 4
Figure 2: Production Growth within the Eagle Ford Shale ........................................................................... 4
Figure 3: Economic Activity of the Top 7 Producing Counties in the Eagle Ford Shale Area ........................ 5
Figure 4: Total Eagle Ford Groundwater Consumption and Recharge in Acre-feet ..................................... 6
Figure 5: Evergreen GCD Groundwater Consumption and Recharge in Acre-feet ....................................... 7
Figure 6: Most Active Counties' Groundwater Consumption ....................................................................... 8
Figure 7: Fresh Groundwater Used for Mining ............................................................................................. 9
Figure 8: Gas Well Regression Trend Lines (af/ft)....................................................................................... 11
Figure 9: Oil Well Regression Trend Lines (af/ft) ........................................................................................ 12
Tables
Table 1: Gas HF Well Water Volume per Lateral Length per Year .............................................................. 11
Table 2: Oil HF Well Water Volume per Lateral Length per Year ............................................................... 12
Table 3: Water Consumption (acre-ft) at 5000 ft Lateral Length ............................................................... 13
Appendix Tables
Table A 1: Future HF Water Use Assumptions ............................................................................................ 21
Table A 2: One Year Severance Tax Reduction Estimate ............................................................................ 22
Table A 3: Description of Variables Used in Regression Analysis ............................................................... 23
Table A 4: Gas Water Volume Regression Results ...................................................................................... 24
Table A 5: Oil Well Water Volume Regression Results ............................................................................... 24
Table A 6: The Big Seven Counties in the Eagle Ford .................................................................................. 25
Table A 7: Major and Minor Aquifers in the Eagle Ford ............................................................................. 25

THE BUSH SCHOOL OF GOVERNMENT AND PUBLIC SERVICE                                                     4220 TAMU COLLEGE STATION, TX 77843-4220
WATER USE IN THE EAGLE FORD SHALE Page 4
Introduction
The proliferation of hydraulic fracturing (HF) has allowed oil and gas companies to tap into the nation’s
vast and previously inaccessible shale resources. In just a few years, HF of shale resources has
transformed the energy landscape within the United States, placing the country on a path toward
increased energy security. Nowhere has the growth been more profound than in the Eagle Ford Shale.
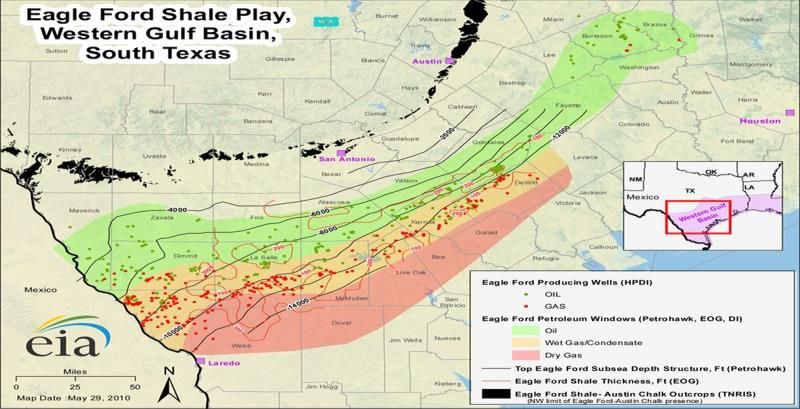
As shown in Figure 1 below, the Eagle Ford Shale formation extends beneath 30 Texas counties,
stretching from Brazos County (Bryan/College Station) to Webb County (Laredo).
1
Figure 1: Map of the Eagle Ford Shale Oil, Gas and Condensate Play
In fact, “the Eagle Ford Shale is considered one of the top producing shale plays in North America,
serving as the second largest tight oil play and ranking fifth in terms of shale gas production” (RRC,
2012). Oil production in the Eagle Ford Shale has increased from 360 bpd in 2008 to 339,000 bpd in
2012, while natural gas production has increased from 8 MMcfpd to 1000 MMcfpd over this same
period.
EAGLE FORD OIL EAGLE FORD SHALE
MILLION CUBIC FEET PER
PRODUCTION GAS PRODUCTION
338,911
400,000 1500 959 964
DAY
BARRELS PER DAY
126,459 1000
200,000 216
358 884 11,986 500 8 47
0 0
2008 2009 2010 2011 2012 2008 2009 2010 2011 2012
YEAR YEAR
Figure 2: Production Growth within the Eagle Ford Shale
What is perhaps most remarkable about oil and gas production in the Eagle Ford Shale is not only the
astronomical rate at which production continues to increase, but also the short period of time in which
1
"Eagle Ford Shale Play." The Eagle Ford Shale Main. http://eaglefordshale.com/
THE BUSH SCHOOL OF GOVERNMENT AND PUBLIC SERVICE 4220 TAMU COLLEGE STATION, TX 77843-4220WATER USE IN THE EAGLE FORD SHALE Page 5
the Eagle Ford has been under development. The area’s first well wasn’t drilled until 2008, but by 2012
there were 1,260 producing oil wells and 875 producing gas wells within the Eagle Ford2.
Oil and gas production in the Eagle Ford has had a substantial impact on the producing counties, as well
as the state as a whole. Although the play is still in early development, an economic analysis of the
region shows that the average economic growth rate for the top 7 producing counties (DeWitt, Dimmit,
Gonzales, Karnes, La Salle, McMullen, and Webb) increased from 12% per year between 2002 and 2008
to 22% per year from 2009 to 20123. As Figure 3 shows, the total gross sales in the top 7 producing
counties increased from about $9 billion in 2009 to over $16.5 billion in 2012.
TOP 7 PRODUCING COUNTIES'
ECONOMIC GROWTH
GROSS SALES (IN BILLIONS OF $)
$14
$12
$10
$8
$6
$4
$2
$-
2002 2003 2004 2005 2006 2007 2008 2009 2010 2011 2012
YEAR
4
Figure 3: Economic Activity of the Top 7 Producing Counties’ in the Eagle Ford Shale Area
The large amount of production growth seen in the Eagle Ford so far only represents a fraction of the
potential production that could occur in the region. If gas prices rise and oil prices remain above $100,
then it can be expected that this rapid growth will continue throughout the play.
However, with this growth, concern arises with the rate at which fresh groundwater is being depleted
within many of these counties. To this point, there has been no study to critically analyze the current
state of water uses for HF operations within the Eagle Ford, nor has there been any assessment of policy
alternatives to the status quo. Using the tools of statistics and economics, this report will consider the
groundwater trends within Eagle Ford counties, analyze evidence of learning curves in HF, and evaluate
2
(RRC, 2013)
3
Average growth rates were found using the equation R=((FV/PV)^(1/T))-1, where R is the growth rate, FV is the future value, PV is the present
value, and T is time. We did not include the time period from 2008 to 2009 in the analysis due to the effects the recession had on growth and
the lack of much drilling activity during that time
4
Economic activity was measured using gross sales data obtained from the Texas Comptroller of Public Accounts database
THE BUSH SCHOOL OF GOVERNMENT AND PUBLIC SERVICE 4220 TAMU COLLEGE STATION, TX 77843-4220WATER USE IN THE EAGLE FORD SHALE Page 6
the regulatory framework of groundwater. From this evaluation, this report will conclude with three
policy recommendations.
Summary of Groundwater Trends in the Eagle Ford
Through our research we identified several potential issues with current groundwater trends in the
Eagle Ford. The following sections show the relationship of water to recharge rates for the entire Eagle
Ford, the Evergreen Groundwater Conservation District (GCD) , and the groundwater usage in the 7
most active HF counties in the play. Since we rely on a variety of published and non-published data
sources, Appendix A describes the methodology underlying the subsequent figures.
More than 500,000 acre-feet per year (af/yr) of fresh groundwater are consumed within the Eagle Ford
annually. This consumption level exceeds the estimated recharge rate for counties in the play by more
than 300,000 af/yr. The aquifers in this area are being drawn down at about 2.5 times their estimated
average recharge rates. As shown in Figure 4, groundwater used for HF operations has been increasing
every year since 2010, and now makes up the third largest use of groundwater in the area (64 af/yr)
Despite the growth in this sector, irrigation still makes up more than half of all groundwater used in the
Eagle Ford. The amount of groundwater being used for irrigation alone exceeds the recharge rate by
more than 50%.
TOTAL EAGLE FORD GROUNDWATER
CONSUMPTION AND RECHARGE
600,000
500,000
WATER VOLUME (AF)
400,000
Other
300,000 Total Municipal
Total Mining
200,000
Total Irrigation
100,000 Recharge
0
2010 2011 2012 2013
YEAR
Figure 4: Total Eagle Ford Groundwater Consumption and Recharge in Acre-feet
The vast Eagle Ford region is home to a wide variety of water consuming activities in areas with varying
recharge rates. For this reason, it is important to take a look at some of the more localized regions in the
THE BUSH SCHOOL OF GOVERNMENT AND PUBLIC SERVICE 4220 TAMU COLLEGE STATION, TX 77843-4220WATER USE IN THE EAGLE FORD SHALE Page 7
area. Figure 5 displays the groundwater activity for the Evergreen GCD in the Eagle Ford, which covers
the following counties: Atascosa, Frio, Karnes and Wilson.
EVERGREEN GCD GROUNDWATER
CONSUMPTION AND RECHARGE
250000
200000
WATER VOLUME (AF)
150000 Other
Municipal
100000 Mining
Irrigation
50000
Recharge Estimate
0
2010 2011 2012 2013
YEAR
5
Figure 5: Evergreen GCD Groundwater Consumption and Recharge in Acre-feet
This district is home to one of the most active counties for HF operations within the play, Karnes County.
Despite the activity seen in this county, the district as a whole looks similar to Figure 4 because other
adjoining counties have not experienced this pace of drilling activity. Irrigation still dominates this
district’s groundwater use, making up over 75% of total consumption. The total groundwater
consumption in the Evergreen exceeds the aquifer recharge rate by more than 120,000 af/yr, with
irrigation alone consuming more than twice the recharge rate. The Evergreen GCD illustrates that even
in the absence of mining, the area faces a long term water problem.
The development of HF activities within the Eagle Ford is still relatively recent and further development
is just a matter of time, prices and technology. Particularly, if natural gas prices rise and oil prices remain
at their current levels (or higher), we can expect HF operations to use an increasing amount of the
region’s groundwater. As an idea of how drilling could increase in the less-developed counties in the
future, Figure 6 shows the groundwater usage by sector for the top 7 counties in terms of drilling activity
in the Eagle Ford: DeWitt, Dimmit, Gonzales, Karnes, La Salle, McMullen and Webb.
5
This figure does not display a recharge estimate due to the complexities of aggregating recharge rates across nonadjacent counties
THE BUSH SCHOOL OF GOVERNMENT AND PUBLIC SERVICE 4220 TAMU COLLEGE STATION, TX 77843-4220WATER USE IN THE EAGLE FORD SHALE Page 8
MOST ACTIVE 7 COUNTIES
GROUNDWATER CONSUMPTION
100,000
90,000
80,000
WATER VOLUME (AF)
70,000
60,000
Other
50,000
Municipal
40,000
Mining
30,000
Irrigation
20,000
10,000
0
2010 2011 2012 2013
YEAR
Figure 6: Most Active Counties' Groundwater Consumption
This aggregation of counties shows the magnitude and speed at which HF has grown in the area. In
2010, HF was a minor user of groundwater, however, in just four years it has become the number one
user and currently makes up 45% of total consumption. The rapid growth in drilling activity in these
counties demonstrates the difficulties of predicting the growth of groundwater use for HF operations,
and the potential to see rapid growth in other Eagle Ford counties under the right conditions.
As mentioned earlier, the Eagle Ford is still relatively young in its development despite the large growth
already seen in the region. Figure 7 below shows the total fresh water used for HF from 2010-2013
compared to the potential water that could ultimately be needed to fully develop the estimated
reserves of the Eagle Ford shale based on 13.6 billion barrels of oil and 119 trillion cubic feet of natural
gas.
THE BUSH SCHOOL OF GOVERNMENT AND PUBLIC SERVICE 4220 TAMU COLLEGE STATION, TX 77843-4220WATER USE IN THE EAGLE FORD SHALE Page 9
Fresh Groundwater Used for Mining
1,600,000
[VALUE]
1,400,000
AF Fresh Groundwater 1,200,000
1,000,000
800,000
600,000
400,000
[VALUE]
200,000
0
Total Used for Mining 2010-2013 Amount Remaining
Figure 7: Fresh Groundwater Used for Mining
Figure 7 is a rough representation of the potential amount of water needed for future development.
Appendix B outlines the assumptions used in generating the total amount remaining numbers. These
numbers should be used as a general reference and not an exact forecast due to the many factors that
affect the development of the Eagle Ford, and the uncertainty as to the time frame of that development.
It is clear within the Eagle Ford that fresh groundwater has been consumed faster than the aquifers
could recharge even prior to the expansion of HF operations within the area. The growth of HF has only
exacerbated the problem and will increase the rate of aquifer depletion as conditions make other areas
economical for oil and gas production. In most areas, the level of groundwater use for irrigation exceeds
the recharge rate regardless of water use for HF. Clearly, HF is just one part of the problem. Therefore,
our policy recommendations will look beyond the oil and gas industry.
Will Technology Bail Us Out?
Much of the analysis on water use for HF within the Eagle Ford Shale, and across the state of Texas has
relied on data from the Oil and Gas Water Use in Texas: Update to the 2011 Mining Water Use Report6.
This report leads one to believe that over time technological improvements would allow the industry to
drastically curtail its use of fresh groundwater for HF operations. For some areas in Texas this may be
true, however our analysis led to the conclusion that, at least in the Eagle Ford, this is not the case. In
studying the rate of water use within the Eagle Ford over a four-year period (2010-2013), it became
apparent that on a per-well basis, water use for HF operations had indeed decreased, particularly in
regards to natural gas wells. This is a positive development; however, it fails to tell the whole story. One
must wonder whether or not the optimism expressed in the Report is warranted. Specifically, is there
6
Jean-Philippe Nicot, P.E., P.G., Robert C. Reedy, P.G., Ruth A. Costley, and Yun Huang, P.E. 2012. Oil and Gas Water Use in Texas: Update to the
2011 Mining Water Use Report. Austin, TX.
THE BUSH SCHOOL OF GOVERNMENT AND PUBLIC SERVICE 4220 TAMU COLLEGE STATION, TX 77843-4220WATER USE IN THE EAGLE FORD SHALE Page 10 any real evidence for the assumption that technological change will allow for a substantial reduction in the use of fresh groundwater for HF, while total water used for HF is at the same time increasing? When examining the data, it became apparent that the year-by-year reduction in water use for HF operations was simply the result of an industry learning curve. We have concluded that the changes measured for water use in HF operations are not the result of major technological advances, but of an industry that is learning to perfect its craft. The change in HF water use that was seen from 2010 to 2011, 2012, and 2013, indicates that the idea of a learning curve is indeed present, thus there is little basis for assuming drastic water savings from technological improvements in the future. Thus, we hypothesize that in the absence of policy changes, HF fresh groundwater use within the Eagle Ford Shale will not decouple from drilling activity as was stated in the Report. Instead, our analysis suggests that fresh groundwater use in the Eagle Ford will likely remain about 90% of total water usage for HF, while surface and brackish water will likely account for the remaining 10%. For the purpose of our report, brackish water will signify water with a Total Disolved Solids (TDS) content of 1,000 parts per million or greater. As the TWDB’s Water for Texas 2012 State Water Plan7 notes, “while total mining water use continues to represent a small portion (less than 1 percent) of statewide water use, percentages can be significantly larger in some localized areas.” This is particularly true in the Eagle Ford Shale. For this reason, identifying the true breadth of water use for HF operations within the Eagle Ford Shale is of great importance. Learning Curves for Hydraulic Fracturing Operations The prevailing question in this analysis is: will technology bail us out? Current projections for future HF operations point to economic and political variables contributing to technological change in the long run8. However, there is no clear evidence or explanation how technology will change from these external factors. Through the “learning-by-doing” effect9, it is understood that as a new technology expands, the efficiency to produce that technology will inevitably increase as well. This demonstrates that there are important internal factors within HF operations to show a learning curve. In Figure 8 and Figure 9, there are regression trend lines per year and per production type (oil or natural gas) of the water volume consumed per HF well versus its lateral length. Appendix D describes the underlying data and regression results for 4849 wells drilled over the period 2010 to 2013 along with the well characteristics. These data were supplied by IHS and cross-referenced with FracFocus. Here, it can be observed that in 2010 there was the greatest amount of variation. From 2011 onward, we find signs of stabilization for the marginal rate of water volume per lateral foot for HF in the Eagle Ford. 7 Texas Water Development Board. 2012. Water for Texas 2012 State Water Plan. Austin, TX. 8 Ibid. 3. 9 Learning as a distinct source of technical change was presented in Wright (1936) and Arrow (1963) and is often termed, “learning-by-doing.” THE BUSH SCHOOL OF GOVERNMENT AND PUBLIC SERVICE 4220 TAMU COLLEGE STATION, TX 77843-4220
WATER USE IN THE EAGLE FORD SHALE                                           Page 11

                                  GAS HF WELL DATA COMPILATION: WATER
                       25
                                        VOLUME PER LATERAL FOOT 2012
                                                                                   2010
                                                                                               2013

                       20

                                                                                            2011
                                                                                                                        Linear (2010)

                                                                                                                        Linear (2011)
   WATER VOLUME (AF)

                       15
                                                                                                                        Linear (2012)

                                                                                                                        Linear (2013)

                       10

                       5

                       0
                            0                                  5000                                      10000
                                                           LATERAL LENGTH (FT)

                                                  Figure 8: Gas Well Regression Trend Lines (af/ft)

                                           Table 1: Gas HF Well Water Volume per Lateral Length per Year
                            Gas HF Well Water Volume                2010      2011      2012      2013!
                            latlength                            0.0029*** 0.0016*** 0.0022*** 0.0020***
                                                                   (0.00)    (0.00)    (0.00)    (0.00)
                            Constant                                1.15    5.44***    2.13*     4.25**
                                                                   (1.74)    (1.03)    (0.88)    (1.51)

                            Observations                              107            478              780        516
                            R-squared                                 0.37           0.10             0.17       0.08
                                                     Robust standard errors in parentheses
                                                       *** p
WATER USE IN THE EAGLE FORD SHALE Page 12
OIL HF WELL DATA COMPILATION: WATER
VOLUME PER LATERAL FOOT
30
2013
25
2012
20 2011
WATER VOLUME (AF)
2010
Linear (Oil 2010)
15
Linear (Oil 2011)
Linear (Oil 2012)
10 Linear (Oil 2013)
5
0
0 5000 10000
LATERAL LENGTH (FT)
Figure 9: Oil Well Regression Trend Lines (af/ft)
Table 2: Oil HF Well Water Volume per Lateral Length per Year
Oil HF Well Water Volume 2010 2011 2012 2013!
Lateral Length 0.0036*** 0.0022*** 0.0025*** 0.0028***
(0.00) (0.00) (0.00) (0.00)
Constant -3.00 2.05** -0.18 -1.41*
(2.14) (0.75) (0.47) (0.56)
Observations 43 541 1196 1188
R-squared 0.54 0.31 0.43 0.46
Robust standard errors in parentheses
*** pWATER USE IN THE EAGLE FORD SHALE Page 13
From the tables, we can approximately calculate how much water is used for a well with a lateral length
of 5000 feet10. The results can be found in Table 3.
Table 3: Water Consumption (acre-ft) at 5000 ft Lateral Length
Water Consumption (acre-ft) at Lateral Length = 5000 ft
Year
Gas Percent Difference Oil Percent Difference
2010 15.60 0% 15.22 0%
2011 14.23 -10% 13.27 -15%
2012 12.95 -10% 12.13 -9%
2013 12.86 -1% 11.85 -2%
In Appendix D we estimated regression models testing for learning over time. These results indicated
that for gas wells the technology stabilized by mid-2011. On the other hand for oil wells, we found
significant learning effects that persisted until September 2013. Jamasb11 (2007) states that emerging
technologies evolve through several stages of development. In this application, the variation in the use
of fresh groundwater for HF is emblematic of this phenomenon. Also, information in this report implies
that operators have learned the desirable ratio of water volume and lateral length, and met the physical
limitations of HF and horizontal drilling. This is an important indicator that in the foreseeable future,
there will not be a substantial decrease of water consumption as a result of technological innovation.
Based on these results, future water saving technological change appears likely to be minimal.
The Status Quo: The Competing Interests of the Rule of Capture and GCDs
Groundwater use in Texas is primarily governed through the oversight of GCDs and application of the
Rule of Capture. The Rule of Capture applies to oil, gas, and most underground water. The principle
behind the Rule of Capture is that title to a moving resource vests in the person who actually captures
the resource under their property. This creates a strong incentive for owners of groundwater to pump as
much as they can, as quickly as they can, lest their neighbor captures the same groundwater.
In many key counties within the Eagle Ford Shale, there exists a real conflict between consumers of
fresh groundwater. Under the status quo, consumers of fresh groundwater place a scarcity value12 on
fresh groundwater that is essentially zero. The only cost is the cost of drilling and pumping the water
well13. With no designated monetary value on the scarcity value of water, there is little incentive to use
less. Whether for livestock, municipal, irrigation or HF, the average user of water consumes as much
water as they would like only to the extent GCDs restrict their use. But this regulation is typically non-
binding since GCDs set the ceiling for irrigation in excess of actual water usage. For oil and gas
companies, there is no ability to restrict water usage since their wells don’t require permits from GCDs14.
10
Per industry sources, 5000 ft lateral length is a desired condition for optimum production.
11
Tooraj Jamasb, and Jonathan Kohler. 2007. Learning Curves for Energy Technology: A Critical Assessment. Cambridgeshire, UK.
12
Scarcity value is defined as the increasing value of a resource as it is depleted.
13
The average water costs on the industry for a section of a HF oil or gas well is approximately $500,000, which is paid to either the landowner
or vendor. In oil and gas production, the water well drilled on a landowner’s property in the process of HF is essentially free to the landowner,
as the well will commonly be left to the landowner afterward pursuant to the terms of the lease for oil or gas development.
14
The GCDs may limit groundwater pumped off the lease to other locations.
THE BUSH SCHOOL OF GOVERNMENT AND PUBLIC SERVICE 4220 TAMU COLLEGE STATION, TX 77843-4220WATER USE IN THE EAGLE FORD SHALE Page 14 Thus, large-scale users of water are competing for a diminishing aquifer resource with no market signals of increasing scarcity, which would otherwise moderate consumption. Even if the oil and gas proliferation was not prevalent in this region, the Eagle Ford aquifers would still be drained by unrestrained use of other purposes. This is because consumers of water resources are not slowed either by a price function or by the existing GCD regulatory structure in Texas15. Simple metering is not required or enforced for either agricultural or oil and gas users so assigning blame to either category of user without adequately addressing the overall problem in Texas misses the crux of the water issue. In principle, GCDs have the power to restrict drilling of wells and pumping of water using a variety of approaches, including spacing rules and limiting proportionality of production to acreage stipulations (unless exempt, as with oil and gas). Through regional water plans known as Groundwater Management Areas (GMAs), GCDs also develop periodically-updated “Desired Future Conditions” (DFCs) and then use and interpret the GCD’s DFC to permit, deny or restrict groundwater use. DFCs are quantitative descriptions of groundwater resources in a management area as of a specific future date. Given the DFC’s generated for the GMA, the GCDs must identify aquifers, identify acceptable change to such aquifers over time, and produce a fifty-year planning horizon in ten-year increments. Details are included in Appendix E. As noted above, wells drilled, and groundwater pumped in connection with oil and gas exploration are exempt from GCD permitting requirements. This exemption ensures that costly permit approval delays are avoided. Irrigation wells that fall under GCDs are also assigned allotments of water that guarantee their maximum usage. Only physical waste is prohibited. Likewise, municipalities are allowed to pump their “required allotments,” which are based on their needs and not the drawdown of the aquifer. Although the GCDs presumably have the power to reduce water use, it is rarely done—at least in the Eagle Ford area. Curiously, GCDs do restrict pumping in a peculiar, perverse manner. Typically, a landowner cannot produce groundwater for sale outside the boundary of the GCD. Yet, with a major city like San Antonio nearby, rationality would tell us that an irrigator growing corn for ethanol should instead be allowed to sell his water to San Antonio. Water for San Antonio is more socially beneficial than irrigating corn production, but selling water outside the GCD is contingent; local control of the GCDs results in electing board members who will restrict water sales outside the GCD. Aquifer preservation is a major matter of importance across the State. The inherent problems in the Texas regulatory scheme for managing underground fresh water use cannot be solved by GCDs themselves. In addition to the political problems, GCDs are limited in power and resources. Some will argue that GCDs, through decades of tepid effectiveness, have contributed to the present magnitude of the problem. Even if GCDs were historically more effective, a new wave of takings cases asserting the primacy of the Rule of Capture and the Fifth Amendment could potentially bankrupt any GCD inclined to try to flex its regulatory muscle. 15 As a general matter, agricultural users usually have exemptions, or an allotment, which is rarely exceeded. Statutorily, GCD may not require a permit for a water well supplying water to a rig activity engaged in drilling or exploration, though the water well must conform to GCD rules on casing, piping and fittings. THE BUSH SCHOOL OF GOVERNMENT AND PUBLIC SERVICE 4220 TAMU COLLEGE STATION, TX 77843-4220
WATER USE IN THE EAGLE FORD SHALE Page 15
Overview of Policy Recommendations
It is now time to turn to our three policy recommendations. We have organized them in order of their
ease of implementation. The first requires mandatory metering of groundwater consumption. This is a
prerequisite to informed policy. Currently, we rely on a mishmash of sources and estimates. Water has
simply become too valuable to treat it as a free resource. Second, we propose a combination of
incentives and public commendation to encourage oil and gas companies active in the Eagle Ford to
substitute brackish groundwater (for which there are abundant supplies) for fresh groundwater. This
proposal will allow the continued development of the Eagle Ford and have the advantage of taking the
oil and gas industry out of the future conflict over fresh groundwater. Our third recommendation is even
more ambitious because its focus is on alleviating the perverse incentives of the Rule of Capture. For
those favoring private property rights and using markets to allocate water supplies inter-temporally, this
is a welcomed and novel approach.
Policy Recommendation 1. Mandatory Reporting for all Water Uses
A prerequisite to any informed water policy is the need for accurate data on water consumption.
Categorically, this means improving the transparency of data reporting by irrigation, municipal use,
mining, and other categories. Below is a summary of the status quo as it pertains to data reporting:
Irrigation: The TWDB estimates the acre-feet of water consumption per observed crop, and
irrigation acreage by aerial and fence-line approximations.
Livestock: Rural landowners and ranchers’ consumption is formula-based in accordance with
livestock and other miscellaneous factors. However, wells used solely for domestic and livestock
purposes require no reporting of production or use.
Municipal Use: Municipalities and non-oil and gas related industries have the most accurate
data, as they measure production and use, including retail customer sales. However, the split
between surface water uses versus fresh groundwater uses is not always clear.
Industrial: Industrial and power plants that are not customers of local municipal utility
companies may or may not have metering and accurate usage data.
Mining: Beginning in February 2012, the RRC required for each well drilled, a report of the
number of barrels of water used for drilling and HF purposes16. However, the RRC reporting
requirement does not require that the respondent provide the type of water—surface water,
fresh groundwater, and brackish groundwater17.
This data is reported to the GCDs, the TWDB and the RRC, but there appears to be little coordination of
data gathering and little ability to monitor the correctness of the data. To alleviate this lack of
transparency, this policy recommendation will make all well depths and water consumption categories
reportable. This data could be reported online and subject to spot checks. Specifically this would cover
the following groups:
16
16 TAC §3.29
17
Without industry assistance to our simple questionnaire (See Appendix G), we were forced to rely on industry experts who estimated 90% of
water used in mining was fresh groundwater. Our policy conclusions will hold even if that percentage were 75%.
THE BUSH SCHOOL OF GOVERNMENT AND PUBLIC SERVICE 4220 TAMU COLLEGE STATION, TX 77843-4220WATER USE IN THE EAGLE FORD SHALE Page 16
Irrigation users should be required to install metering equipment and report usage to the GCDs
or equivalent county reporting agency.
Rural homeowners with a water well would be exempt from metering but not reporting
estimated usage. In an applied system, we recommend the development of a formula to handle
water consumption estimating for users under a certain threshold. This information would be
reported to the resident’s GCD or equivalent county reporting agency.
Other agricultural users such as ranchers and poultry operations would be required to meter
groundwater usage. This information would be reported to the TWDB.
Municipalities should be required to meter groundwater consumption as well as to distinguish
between brackish and fresh groundwater. This includes requiring residential customers within
the municipality’s service areas that drill personal wells to meter and report to the utility. This
information would be reported to the TWDB.
Industrial users served by their own wells should be required to meter and report usage to the
TWDB.
Power plants with their own well should also be required to meter and report usage. This
information would be reported to the TWDB.
Oil and Gas companies would be required to report not only total water uses (which they
currently do), but the type of water—surface, fresh groundwater, brackish groundwater, or
recycled water (as shown in Appendix G) in addition to water well location. This information
would be reported to the RRC.
Mandatory reporting of consumption is fundamental to informed policy and a necessary building block
to our third policy recommendation. If we are to clarify and protect private property rights to water,
knowledge of consumption rates is a prerequisite. But there are two other necessary pieces—recharge
rates and capacity measurements of the underlying aquifer. Existing research offers a starting point for
these last two ingredients, but more work needs to be done.18
Policy Recommendation 2. Incentivizing the Substitution of Brackish for
Fresh Groundwater
Our second policy recommendation is a two-part plan to encourage oil and gas operators to use brackish
groundwater when possible. First, operators would receive recognition from the “Green Star” program
through the RRC (and possibly the TCEQ) if they take the pledge to avoid using fresh groundwater, and
agree to be compliant with all other environmental regulations. This program would consist of a bronze,
silver, and gold tier, depending on the amount of fresh groundwater used. Part two involves a severance
tax reduction for wells drilled by Green Star operators that have qualified for at least bronze level status
in the Green Star program. Together, these two components provide operators a financial and social
incentive to conserve fresh groundwater. The pledge to avoid using fresh groundwater could, in
principle, involve substituting recycled water (flowback and produced water). However, in most
18
George, Peter, Robert Mace and Rima Petrossian. 2011. “Aquifers of Texas.” Texas Water Development Board.
https://www.twdb.texas.gov/publications/reports/numbered_reports/doc/R380_AquifersofTexas.pdf
THE BUSH SCHOOL OF GOVERNMENT AND PUBLIC SERVICE 4220 TAMU COLLEGE STATION, TX 77843-4220WATER USE IN THE EAGLE FORD SHALE Page 17 instances, this option is likely to be far more expensive than simply using brackish water19. For most areas of the Eagle Ford, brackish groundwater supplies are abundant and the least expensive option to fresh groundwater. Thus our proposal is described as substituting brackish for fresh groundwater even though in some instances, a producer may choose another option, such as surface or recycled water. The incentive component consists of granting Green Star operators a reduction in the oil and gas severance tax for the first year of production from each well drilled in the Eagle Ford that does not use fresh groundwater. During the first year of operation the oil severance tax on the working interest of the well would be reduced from 4.6% to 4.0%, and the gas severance tax from 7.5% to 6.5%. Assuming an average well in the Eagle Ford produces oil and gas for $100/bbl and $5/mcf20, respectively, this results in an operator saving about $52,000 on an oil well, and $38,000 on a gas well (See Appendix C for Spreadsheet calculations). This tax break will offset much of the cost of using brackish groundwater. Fresh groundwater typically sells for $0.50/bbl in the Eagle Ford. Thus, a typical operator in the Eagle Ford would expect to spend $50,000 per 100,000 barrels of water on any HF well. A $52,000 severance tax savings would allow the operator to double their investment in water (i.e. pay $100,000 for 200,000 barrels of water), without taking a financial hit. Particularly for an operator drilling 8 or 10 wells in an area, an incentive bundle of $400,000 to $500,000 should be sufficient to offset the added cost of drilling a deeper water well to tap into brackish water, or any additional cost to blend or treat brackish water to a level compatible with an operator’s recipe for frac fluids. The other essential component of this policy is to publically recognize Green Star operators as being environmentally responsible. By recognizing operators who pledge to use less fresh groundwater, while abiding with other TCEQ and RRC environmental regulations, these companies can demonstrate that they are willing to do more than simply talk about being environmentally responsible. In order to qualify for Green Star recognition, an operator may only use fresh groundwater for 30% or less of their wells, and be compliant with all other regulations. This will earn them bronze level status in the program and make the operator eligible for the aforementioned tax incentives. In order to qualify for the silver level, the operator will have to lower this number to 20%. To qualify for the gold level, the operator must be using fresh groundwater for less than 10% of its wells. While the silver and gold levels do not offer any additional tax benefits, they would show the public how much an operator is willing to conserve fresh groundwater. The potential public relations benefits to Green Star operators are many. First, these operators will be drilling and producing oil and gas in the Eagle Ford for many decades to come. By using brackish water for HF, Green Star companies are no longer competitors with farmers and municipalities for increasingly scarce fresh groundwater supplies. Second, the Green Star designation will be something that the industry should welcome. Not only will it be a mechanism to improve the public image of individual companies, but if widely adopted by the 200 odd operators in the Eagle Ford, it could vastly improve the industry’s image. An additional benefit to the Texas Railroad Commission is that this program would 19 James Slutz, Jeffrey Anderson, Richard Broderick, and Patrick Horner. 2012. SPE 157532: Key Shale Gas Water Management Strategies: An Economic Assessment Tool. Perth, Australia. 20 It seems unlikely that there will be any significant development of natural gas below $5/mcf THE BUSH SCHOOL OF GOVERNMENT AND PUBLIC SERVICE 4220 TAMU COLLEGE STATION, TX 77843-4220
WATER USE IN THE EAGLE FORD SHALE                                                       Page 18

evidence the Commission’s forward-looking agenda and demonstrate it’s proactive efforts to solve both
a quantitative and qualitative environmental problem.

The Eagle Ford Shale has provided the state budget with a huge windfall. Using a small portion of this
windfall to incentivize shifting away from using fresh groundwater is a wise long-term investment in
Texas. For oil and gas operators, and the industry as a whole, these incentives should more than tip the
balance in favor of using brackish groundwater and in the process greatly enhance their public image.
Farmers, ranchers, and municipalities in these counties would benefit from the reduced consumption of
freshwater supplies. Finally, it demonstrates Texas’ ability to solve its own problems, and proactively
address an important issue without interference from the Environmental Protection Agency.

Policy Recommendation 3.                                 Well-defined Property Rights
As mentioned earlier in this report, property rights for groundwater in Texas are defined primarily under
the Rule of Capture. This legal precedent creates an incentive to consume water as quickly as possible,
and price water close to the cost of extraction, with little respect to its rising scarcity value. In a low-
water region, such as the Eagle Ford, the end result of this policy is artificially cheap water today, and
much more expensive water in the future. In the past, when water consumption more closely matched
aquifer recharge rates, the Rule of Capture as a means of defining property rights was sensible and
administratively simple— a water user was rarely pumping enough to steal their neighbor’s water.
However, when consumption greatly exceeds the recharge rate, the Rule of Capture allows the
landowner with the fastest pump to pull water from the surrounding area and use it as if it were a free
resource. This incentive structure is similar to early difficulties with Texas oil and gas, where property
owners had little power to control the resources they rightfully owned.

There are a variety of alternative ways to define property rights other than through the Rule of Capture.
In many countries, groundwater is the property of the state, so this eliminates competition between
landowners. Yet another method of defining property rights is to allow private ownership but limit
water consumption to a predetermined quantity each year. In researching these various means, it
became apparent that few free market systems are in place throughout the nation; as a result, we
began to think of how the market could solve our problem. Below are several steps that would shift
water in the Eagle Ford toward a more open market structure that would provide for efficient
consumption and pricing of water.

Our proposed method for better delineating private property rights would work as follows:

             (1) Determine the magnitude of the fresh groundwater geographically: Based on hydrological
                 studies for a county or GCD, determine the acre-feet of fresh groundwater in major aquifers
                 as defined on a per acre basis21.
             (2) Define water as a resource similar to mineral rights: In doing this, landowners could now
                 know the quantity of water in place under their property and have the right to use, sell, or
                 save that water as they see fit.

21
     The acre-feet of water per acre of surface area will vary across the county or GCD because these aquifers are not homogeneous.

THE BUSH SCHOOL OF GOVERNMENT AND PUBLIC SERVICE                                            4220 TAMU COLLEGE STATION, TX 77843-4220
WATER USE IN THE EAGLE FORD SHALE Page 19
(3) Calculate debits and credits to each owners’ water account: Each year, the landowner’s
quantity of water-in-place would be reduced by the number of acre-feet consumed by wells
on their property. Likewise, the landowner would be credited for the recharge rate per acre-
feet that was added to the aquifer.
(4) Allow free trade of water rights. Records of these water rights would be kept by either a
state or local agency. If maintained by the state, a local agency could serve as the reporting
point. Lastly, water rights would be protected by the state in the same way the state
protects other private property.
The benefits of this policy recommendation are primarily economic. The price of water will reflect the
willingness to pay of the consumer and the opportunity costs of the supplier. This will insure that water
is allocated efficiently in the present, and the future, because suppliers will have an incentive to include
the potential for higher future demand and scarcity into the prices they charge today. They do not have
to fear that their water might be taken from them, as they do now under the Rule of Capture. As the
price of water increases as a result of increased demand and resource scarcity, the transition to
alternatives (i.e. desalination, importing water, and others) will become smoother with less drastic price
jumps. By increasing the economic efficiency in the Eagle Ford (and Texas in general), economic growth
and stability can be maximized over time.
Despite the large economic benefits of better defining property rights for groundwater, this policy
would increase administrative costs compared to the status quo and could face political and legal
hurdles. Overhead costs would primarily come from the need to gather and manage information on
water availability, recharge, and consumption. These costs could accrue to the state or local
governments dependent upon on how it is implemented; however, the current authority of local
governments would need to be altered in order to support the change at that level. This policy does not
address any political concerns about the allocation of water, particularly to municipal and agricultural
sectors. As the scarcity of water and the demand for that water increase, the price of water can be
expected to increase, which could harm some municipal and agricultural uses. However, these sectors
will be harmed much more dramatically under the Rule of Capture when sectors are forced to quickly
change to water alternatives. In addition to political issues, the current legal precedents, discussed
further in Appendix F, could prove to be roadblocks to changing the way water is defined in Texas.
THE BUSH SCHOOL OF GOVERNMENT AND PUBLIC SERVICE 4220 TAMU COLLEGE STATION, TX 77843-4220WATER USE IN THE EAGLE FORD SHALE Page 20 Appendix A. Estimating Groundwater Consumption & Recharge Rates Groundwater Consumption Analysis In order to determine water use by industry, we used water consumption data from the TWDB for municipal, irrigation, manufacturing, livestock, and power generation sources. We have combined power, manufacturing, and livestock into one category, listed as other, since these sources are typically minor. TWDB stopped collecting consumption data in 2011 data; therefore, for our analysis we assumed that the numbers stayed the same for 2012 and 2013. We have replaced the TWDB mining consumption numbers with the numbers from our own analysis based on information obtained from the Railroad Commission on well numbers, and water quantities used for HF derived from IHS and FracFocus data. After estimating the total water used for HF in the Eagle Ford over the four year period, we assumed 90% of that water22 came from fresh groundwater23. The following counties were used in this analysis: Atascosa, Bee, Brazos, Burleson, DeWitt, Dimmit, Fayette, Frio, Gonzales, Grimes, Karnes, La Salle, Lavaca, Lee, Live Oak, Madison, Maverick, McMullen, Webb, Wilson, and Zavala. Groundwater Recharge Rate Analysis Each GCD publishes a water management plan which includes annual recharge rates for each aquifer within the GCD. We summed these rates to get the total annual recharge rate for the GCD. This is represented on the graph by the line labeled “recharge estimate”. If the stacked graph is below the recharge rate, groundwater is not being depleted. If the stacked graph is above the recharge rate, then any consumption over the recharge rate is depleting the aquifers in the area. Our estimate of the recharge rate is a very general estimate and it should be noted that there are many factors that can cause variation24. 22 This estimate is based on information we received from a sample of industry experts. 23 "Historical Water Use Estimates." Texas Water Development Board. http://www.twdb.state.tx.us/waterplanning/waterusesurvey/estimates/ 24 GCD Management Plans used in this report came from Bee, Bluebonnet, Brazos Valley, DeWitt, Evergreen, Fayette, Gonzales, Lost Pines, McMullen, Mid East Texas, Pecan Valley, Post Oak Savannah, and Wintergarden districts. The most up-to-date management plans available at the time of this report were used. THE BUSH SCHOOL OF GOVERNMENT AND PUBLIC SERVICE 4220 TAMU COLLEGE STATION, TX 77843-4220
WATER USE IN THE EAGLE FORD SHALE                                    Page 21

Appendix B.            Forecasts of Potential HF Water Use
The chart below shows the assumptions used to calculate the potential future water demand for HF in
the Eagle Ford.

                                  Table A 1: Future HF Water Use Assumptions
                                               Assumptions:
                        Gallons / Well                               4,312,030
                        Gallons / Acre-Ft                             325,851
                        Acre-Ft / Well                                 13.23
                        Fresh Groundwater %                             90%

                        Total TCF (Gas)                                  119
                        BCF/Well                                          2
                        Total Gas Wells                                 59,500

                        Total Billion BBL (Oil)                          13.6
                        BBL/Well                                       220,000
                        Total Oil Wells                                 61,818

                                               Findings:
                        Total AF Remaining for Gas Wells                       787,371
                        Total AF Remaining for Oil Wells                       818,048

                        Total Water (AF) for O&G                           1,605,420

                        Fresh Water (AF) O&G                               1,444,878

                        Total Used for Mining 2010-2013                        97,157
                        Percent of Total                                       6.72%

                        Amount Remaining                                   1,347,721

These figures assume that oil and gas prices will eventually rise to a point where all of the proved
reserve oil and gas in the Eagle Ford are economic to produce. This assumption is made without a time
frame restriction on production.

THE BUSH SCHOOL OF GOVERNMENT AND PUBLIC SERVICE                      4220 TAMU COLLEGE STATION, TX 77843-4220
WATER USE IN THE EAGLE FORD SHALE Page 22
Appendix C. Evaluation of Severance Tax Reduction
The chart below shows the assumptions made for a severance tax reduction under the Green Star
program. This illustration shows the decline rate for an oil and gas well example based on proprietary
industry information we received.
Table A 2: One Year Severance Tax Reduction Estimate
Oil Well Example
Oil Price Per BBL Assumption $ 100.00
Initial Production (B/D) 550
Working Interest Percentage 75%
Severance Tax Rate 4.6%
Green Star Tax Rate Reduction 0.6%
Month 1 2 3 4 5 6 7 8 9 10 11 12
BBL/Month 17,000 14,000 12,000 11,000 9,500 8,500 8,000 7,800 7,400 7,000 6,500 6,400
Revenue $ 1,275,000 $ 1,050,000 $ 900,000 $ 825,000 $ 712,500 $ 637,500 $ 600,000 $ 585,000 $ 555,000 $ 525,000 $ 487,500 $ 480,000
Annual Revenue $ 8,632,500
Severance Tax Revenue $ 397,095
Green Star Severance Tax Reduction $ 51,795
Gas Well Example
Gas Price Per mCF Assumption $ 5.00
Initial Gas Production (Mcf/d) 5,000
Working Interest Percentage 75%
Severance Tax Rate 7.5%
Green Star Tax Rate Reduction 1%
Month 1 2 3 4 5 6 7 8 9 10 11 12
mCF/Month 150,000 123,529 105,882 97,059 83,824 75,000 70,588 68,824 65,294 61,765 57,353 56,471
Revenue $ 562,500 $ 463,235 $ 397,059 $ 363,971 $ 314,338 $ 281,250 $ 264,706 $ 258,088 $ 244,853 $ 231,618 $ 215,074 $ 211,765
Annual Revenue $ 3,808,456
Severance Tax Revenue $ 285,634
Green Star Severance Tax Reduction $ 38,085
THE BUSH SCHOOL OF GOVERNMENT AND PUBLIC SERVICE 4220 TAMU COLLEGE STATION, TX 77843-4220You can also read