Effects of aerosol dynamics and gas-particle conversion on dry deposition of inorganic reactive nitrogen in a temperate forest
←
→
Page content transcription
If your browser does not render page correctly, please read the page content below
Atmos. Chem. Phys., 20, 4933–4949, 2020
https://doi.org/10.5194/acp-20-4933-2020
© Author(s) 2020. This work is distributed under
the Creative Commons Attribution 4.0 License.

Effects of aerosol dynamics and gas–particle conversion on dry
deposition of inorganic reactive nitrogen in a temperate forest
Genki Katata1 , Kazuhide Matsuda2 , Atsuyuki Sorimachi3 , Mizuo Kajino4 , and Kentaro Takagi5
1 Global and Local Environment Co-creation Institute (GLEC), Ibaraki University, Ibaraki, 310-8512, Japan
2 FieldScience Center, Tokyo University of Agriculture and Technology, 3-5-8 Saiwai-cho, Fuchu, Tokyo 183-8509, Japan
3 Department of Radiation Physics and Chemistry, Fukushima Medical University, 1 Hikarigaoka,

Fukushima, Fukushima 960-1295, Japan
4 Meteorological Research Institute, Japan Meteorological Agency, Tsukuba, Ibaraki 305-0052, Japan
5 Teshio Experimental Forest, Field Science Center for Northern Biosphere, Hokkaido University, Toikanbetsu,

Horonobe, Hokkaido 098-2943, Japan

Correspondence: Genki Katata (genki.katata.mirai@vc.ibaraki.ac.jp)

Received: 5 August 2019 – Discussion started: 12 August 2019
Revised: 13 February 2020 – Accepted: 24 March 2020 – Published: 27 April 2020

Abstract. Dry deposition has an impact on nitrogen status in         over the canopy was 15 times higher in the scenario of “gpc”
forest environments. However, the mechanism for the high             than in the scenario of “no gpc”. This increase caused high
dry-deposition rates of fine nitrate particles (NO−3 ) observed      contributions from particle deposition flux (NO−
                                                                                                                    3 and NH4 )
                                                                                                                               +

in forests remains unknown and is thus a potential source of         to total nitrogen flux over the forest ecosystem (∼ 39 %),
error in chemical transport models (CTMs). Here, we mod-             although the contribution of NH3 was still considerable. A
ified and applied a multilayer land surface model coupled            dry-deposition scheme coupled with aerosol dynamics may
with dry-deposition and aerosol dynamic processes for a tem-         be required to improve the predictive accuracy of chemical
perate mixed forest in Japan. This represents the first ap-          transport models for the surface concentration of inorganic
plication of such a model to ammonium nitrate (NH4 NO3 )             reactive nitrogen.
gas–particle conversion (gpc) and the aerosol water uptake
of reactive nitrogen compounds. Thermodynamics, kinetics,
and dry deposition for mixed inorganic particles are mod-
eled by a triple-moment modal method. Data for inorganic             1   Introduction
mass and size-resolved total number concentrations mea-
sured by a filter pack and electrical low-pressure impactor in       The dry deposition of inorganic reactive nitrogen gas (e.g.,
autumn were used for model inputs and subsequent numer-              HNO3 and NH3 ) and particles (e.g., NO−             +
                                                                                                               3 and NH4 ) is one
ical analysis. The model successfully reproduces turbulent           of the major pathways of nitrogen input into forest ecosys-
fluxes observed above the canopy and vertical micrometeo-            tems. In eastern Asia, air pollutant emissions continue to in-
rological profiles noted in our previous studies. The sensi-         crease (EANET, 2016), and, although dry deposition of in-
tivity tests with and without gpc demonstrated clear changes         organic reactive nitrogen has been suggested as an important
in the inorganic mass and size-resolved total number con-            consequence by prior studies using indirect estimates (e.g.,
centrations within the canopy. The results also revealed that        Pan et al., 2012; Li et al., 2013; Xu et al., 2015), direct-
within-canopy evaporation of NH4 NO3 under dry conditions            measurement studies remain limited (Nakahara et al., 2019).
significantly enhances the deposition flux of fine-NO−               Recent observational studies at forests revealed that the dry-
                                                           3 and
fine-NH+    particles, while reducing the deposition  flux  of ni-   deposition flux of inorganic reactive nitrogen in the form
          4
tric acid gas (HNO3 ). As a result of the evaporation of partic-     of fine NO− 3 was markedly higher than that expected from
ulate NH4 NO3 , the calculated daytime mass flux of fine NO−         theory (Takahashi and Wakamatsu, 2004; Yamazaki et al.,
                                                                3
                                                                     2015; Honjo et al., 2016; Sakamoto et al., 2018; Nakahara

Published by Copernicus Publications on behalf of the European Geosciences Union.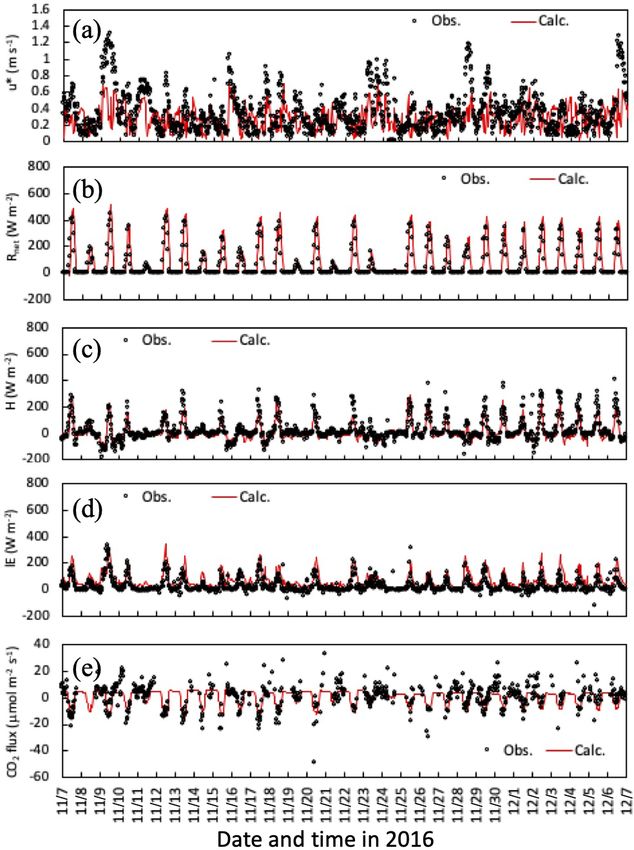
4934                                      G. Katata et al.: Aerosol dynamics and gas–particle conversion in dry deposition

et al., 2019). Provided that physical deposition processes are       We here propose a new multilayer land surface model cou-
dominant, the deposition velocities of SO2−              −
                                             4 and NO3 par-       pled with dry deposition and aerosol dynamics (thermody-
ticles are expected to be similar because both species ex-        namics and kinetics of mixed inorganic aerosols) for for-
ist in the same submicrometer size range (e.g., Wolff et al.,     est environments. In aerosol dynamics modeling, the mo-
2011). However, Sakamoto et al. (2018) observed a deposi-         ment method is used to reduce computational costs and in-
tion velocity of NO− 3 as high as those of HNO3 in temper-        corporates general processes, such as condensation, coagula-
ate mixed forests, when using the relaxed eddy accumula-          tion, below-cloud scavenging (e.g., Binkowski and Shankar,
tion method (Matsuda et al., 2015). Nakahara et al. (2019)        1995), and dry deposition (Bae et al., 2009). These pro-
also observed a higher concentration gradient of fine NO−    3    cesses are implemented into a multilayer atmosphere–SOiL–
than of fine SO2− 4 in cool–temperate forests using a ther-
                                                                  VEGetation model (SOLVEG) including particle and fog
modynamic equilibrium model to explain this difference via        droplet deposition and hygroscopic particle growth processes
the evaporation of NH4 NO3 particles in the NH4 NO3 –NH3 –        (Katata et al., 2014). We apply the model to a Japanese mixed
HNO3 triad within the canopy. Numerical chemical transport        forest for calibration and validation. Finally, we use numeri-
models (CTMs) for eastern Asia have also demonstrated that        cal experiments to examine the impacts of two key processes
models can overestimate the total (gas and particle) nitrate      on dry-deposition flux over the canopy: gas–particle con-
concentrations present in many locations (Kajino et al., 2013;    version of inorganic nitrogen compounds and hygroscopic
Shimadera et al., 2018; Morino et al., 2015; Sakurai et al.,      growth.
2015). Despite many uncertain factors (e.g., emission inven-
tory, grid resolution, chemical and physical dynamics, and
                                                                  2     Model description
deposition modules), Shimadera et al. (2014) demonstrated
that the surface concentration of total nitrate could be repro-   2.1    Model overview
duced by increasing the dry-deposition velocity of HNO3 by
a factor of 20 with respect to previous studies. Hence, the de-   A one-dimensional multilayer SOLVEG model consists of
position velocity of NO− 3 in fine particles and/or HNO3 are      four submodels: atmosphere, soil, vegetation, and radia-
among the major uncertainties in the CTMs.                        tion within the vegetation canopy. A general description of
   Modeling studies for dry deposition have demonstrated the      gas and particle transport and dry deposition is given in
importance of the volatilization of NH4 NO3 during the dry        Katata and Ota (2017). In the atmosphere submodel, one-
deposition of gaseous and particulate nitrates (Brost et al.,     dimensional diffusion equations are solved between atmo-
1988; van Oss et al., 1998; Kramm and Dlugi, 1994), al-           spheric layers for the horizontal wind speed, potential tem-
though the process itself has been known in the atmospheric-      perature, specific (relative) humidity, liquid water content of
chemistry community for some time (Seinfeld and Pan-              fog, turbulent kinetic energy and length scale (Katata, 2009),
dis, 2006). Such modeling studies used the “big-leaf” con-        and gas and particle concentrations (Katata and Ota, 2017).
cept to represent the forest canopy under steady-state and        Observational data are used to determine the upper boundary
thermodynamic-equilibrium assumptions, with chemical re-          conditions. Bulk transfer equations are applied at the lowest
action rates provided by observational data. Nemitz and Sut-      layer using soil surface temperatures and specific humidity
ton (2004) developed a more sophisticated model through the       calculated by the soil submodel.
introduction of chemical timescales for a size-resolved parti-       In the soil submodel, soil temperature, volumetric soil wa-
cle and showed that the thermodynamic gas–particle conver-        ter content, and soil pore specific humidity are predicted
sion of NH4 NO3 (hereafter referred to as gpc) may explain        from heat conduction, mass balance in liquid water, and wa-
the bidirectional fluxes observed above a Dutch heathland.        ter vapor diffusion equations, respectively (Katata, 2009).
However, several uncertainties remained in their modeled          Root water uptake is calculated from the transpiration rate
results, largely due to uncertainties in empirical treatments     in the vegetation submodel. Mass conservation equations for
of particle deposition and thermodynamic processes and the        the liquid and gas phases are solved to determine soil CO2
assumption that gas concentrations are in equilibrium with        (Nagai, 2004). Organic-matter dynamics are also considered
the pure NH4 NO3 particle phase (Nemitz and Sutton, 2004).        (Ota et al., 2013): microbial decomposition and dissolved
Meanwhile, the equilibration of aerosols with surrounding         organic-carbon (DOC) leaching in the above-ground litter
liquid water is also important in determining their thermo-       layer, the below-ground input of carbon from roots (root lit-
dynamic equilibrium (e.g., Fountoukis and Nenes, 2007).           ter), and soil organic-carbon (SOC) turnover and DOC trans-
An accurate evaluation of the impact of NH4 NO3 –NH3 –            port along water flows throughout the soil profile are deter-
HNO3 conversion within the canopy requires a process-             mined for three SOC pools (active, slow, and passive) with
based model that includes the thermodynamics of mixed in-         different turnover times.
organic aerosols linked to gas-phase chemistry, while en-
suring that no equilibrium assumption is required (Nemitz,
2015).

Atmos. Chem. Phys., 20, 4933–4949, 2020                                            www.atmos-chem-phys.net/20/4933/2020/
G. Katata et al.: Aerosol dynamics and gas–particle conversion in dry deposition                                                    4935

   In the vegetation submodel, profiles for leaf temperature,       the approach presented in Katata et al. (2013):
leaf surface water, and vertical liquid water flux are pre-
                                                                                            −1
dicted (Nagai, 2004). The heat budget equation at the leaf          Fgs = a(Dgas /Dw )R 0        [(rb + rd )χs − rb χd − rd χa ],    (1)
surface uses key variables from the atmosphere submodel                                   0 −1
combined with the radiation scheme to predict leaf temper-          Fgd = a(Dgas /Dw )R          [(rb + rs )χd − rb χs − rs χa ],    (2)
ature. At the upper boundary of the submodel, a given pre-
                                                                    where a is the leaf area density (m2 m−3 ), Dgas and Dw are
cipitation intensity is used to calculate the vertical liquid wa-
                                                                    the diffusivities (m2 s−1 ) of trace gas and water vapor, re-
ter flux within the canopy based on the surface water budget
                                                                    spectively, rb , rs , and rd are the resistances (s m−1 ) for the
equation. The CO2 assimilation rate due to photosynthesis
                                                                    leaf boundary layer, stomata, and evaporation (cuticular), χa
is predicted using Farquhar’s formulations (Farquhar et al.,
                                                                    is the ambient gas concentration (nmol m−3 ) in the canopy
1980) together with stomatal resistance. In the radiation sub-
                                                                    layer, and R 0 = (rb rs + rb rd + rs rd ). The total gas exchange
model, direct and diffuse downward and upward fluxes of so-
                                                                    flux over the leaves can be calculated as the sum of Fgs and
lar and longwave radiation are calculated to determine the ra-
                                                                    Fgd for all canopy layers. In accordance with a number of
diation energy input at each canopy layer. Fractions of sunlit
                                                                    observations (e.g., Huebert and Robert, 1985), all χs , rd , and
and shaded leaves at each canopy layer are used to calculate
                                                                    rs values are set to zero for highly reactive and water-soluble
stomatal resistance and the total energy budget.
                                                                    gas species of HNO3 and HCl; i.e., we assume perfect ab-
   A multilayer snow module is unique in its ability to in-
                                                                    sorption by plant canopies. For both species, parameteriza-
clude the gravitational and capillary liquid water flows in the
                                                                    tion specific to a deciduous forest by Meyers et al. (1989)
unsaturated snow layer based on van Genuchten’s concept
                                                                    is used to calculate rb . For NH3 , χs is calculated based on
of water flow in the unsaturated zone (cf. Hirashima et al.,
                                                                    the thermodynamic equilibrium between NH3 in the liquid
2010; Katata et al., 2020). In the soil module, freeze–thaw
                                                                    and gas phases (Nemitz et al., 2000; Sutton et al., 1994) as
processes based on the freezing-point depression equation
                                                                    follows:
are considered in equations of heat conduction and liquid
water flow. Winter-related processes for grassland phenol-                161 500

                                                                                            10 378

ogy, such as leaf development and senescence due to cold            χs =            exp              0s ,                          (3)
                                                                             Tc               Tc
stresses, are also implemented in the vegetation submodel.
Carbon gain, both from photosynthesis and remobilized re-           where Tc is the canopy temperature (◦ C) and 0s is the stom-
serves, is allocated to sinks according to changing sink pri-       atal emission potential (also known as the apoplastic ratio) at
orities and strengths. Sink strengths are calculated based on       1013 hPa (Nemitz et al., 2004). NH3 concentrations in leaf
the dynamics of leaves and stems and their acclimation to           surface water (χd ) are calculated by assuming Henry’s law
low temperatures. The removal of tillers and leaves by cut-         and dissociation equilibria with atmospheric concentrations
ting can also be simulated during the growing season, as can        of NH3 at each canopy layer. To calculate the exchange flux
subsequent regrowth of the sward. The regrowth rate after           of SO2 and NH3 over the wet canopy, an empirical formula
cutting is calculated at each phenological stage. The natu-         for rd is applied (Massad et al., 2010) as follows:
ral turnover of leaves and roots is modeled using typical life
spans in years. Rooting depth and the fraction of roots in soil     rd = 31.5AR−1 exp[b(100 − RH)],                                  (4)
layers are modeled as functions of root biomass. The daily
amount of dead root biomass (root litter) is used as the input      where b is the constant, RH is the relative humidity (%), and
to SOC in SOLVEG’s soil submodel.                                   AR is the ratio of total acid/NH3 , represented as (2[SO2 ]
                                                                    + [HNO3 ] + [HCl]) / [NH3 ] in each atmospheric layer. The
                                                                    value of AR is determined from the gaseous inorganic con-
                                                                    centration. Since the affinity (such as solubility in water) of
2.2   Dry deposition                                                SO2 at the leaf surface is approximately twice that of NH3
                                                                    (van Hove et al., 1989), a half value of rd calculated by
                                                                    Eq. (4) is applied to SO2 deposition. The RH value could be
                                                                    affected by leaf surface water content at each canopy layer
Since full descriptions for the dry-deposition process of gases     as a function of water balance due to the leaf surface water
and particles are available in Katata et al. (2013, 2014) and       evaporation, interception of precipitation by leaves, capture
Katata and Ota (2017), this subsection presents only the key        of fog water by leaves, and drip from leaves (Katata et al.,
equations.                                                          2008, 2013). Since our model is not a dynamic modeling ap-
   Using compensation points for trace gases in the substom-        proach (e.g., Sutton et al., 1998; Flechard et al., 1999), uncer-
atal cavity, χs (nmol m−3 ), and above the leaf water surface,      tainties in Eq. (4) could affect the simulation of the charging
χd (nmol m−3 ), we model bidirectional gas exchange fluxes          and discharging of NH3 in the cuticle due to the wet canopy
with stomata, Fgs (nmol m−2 s−1 ), and with leaf water sur-         being in equilibrium with non-zero leaf surface concentra-
faces, Fgd (nmol m−2 s−1 ), for each canopy layer following         tions of NH3 .

www.atmos-chem-phys.net/20/4933/2020/                                                Atmos. Chem. Phys., 20, 4933–4949, 2020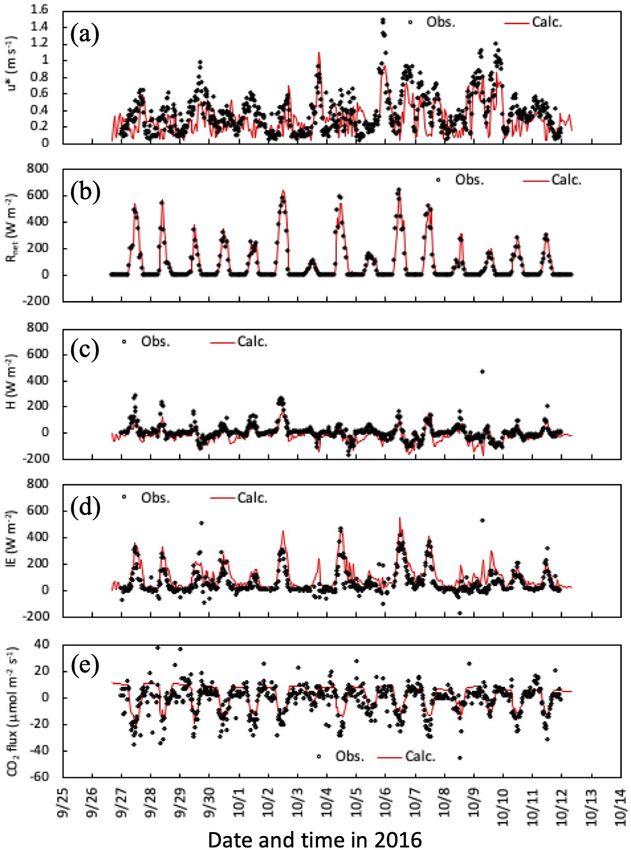
4936 G. Katata et al.: Aerosol dynamics and gas–particle conversion in dry deposition
The gas exchange flux over the ground Fg0 moments for each atmospheric layer are as follows:
(nmol m−2 s−1 ) was described with compensation points at 2
the ground χg (nmol m−3 ) as follows: k k 2
Mk = N Dg0 exp ln σg , (9)
2
3 3 2
M3 − 2 2 M M3 − 3
M2 2
Fg0 = (Dgas /Dw )cH 0 |ur |(χa0 − χg ), (5) Dg0 = , ln σg = − ln 2 . (10)
( M0 M0 M0 M0
161 500 10 378
Ts0 exp Ts0 0g (for NH3 )
χg = , (6)
0 (for other gases) Particle growth is dynamically solved following the method
of Kajino et al. (2012). Gas-to-particle mass transfer is driven
by the difference between the current state and the thermody-
where cH 0 is the surface exchange coefficient for heat, |ur | namic equilibrium state, as simulated by the ISORROPIA2
and χa0 are the horizontal wind speed (m s−1 ) and gas con- model (Fountoukis and Nenes, 2007) for semivolatile inor-
centration at the bottom of the atmospheric layer (nmol m−3 ), ganic components such as NO− + −
3 , NH4 , Cl , and liquid water
respectively, Ts0 is the soil surface temperature (◦ C), and 0g (H2 O). The gas-phase chemical production of HNO3 could
is the ground level emission potential for NH3 at 1013 hPa. further affect simulated HNO3 concentration and flux, and
As explained in Katata et al. (2014), the particle deposi- this parameter should therefore be implemented to this model
tion rate of each inorganic species in each canopy layer, Fp in the future. In the present, the gas–particle conversion of or-
(µg m−2 s−1 or no. m−2 s−1 ), is represented as follows: ganics is not considered because the required observational
speciation data were not available. Thus, both organics and
other components of the total mass were assumed to be hy-
Fp = aEp (Dp ), (7) drophobic aerosols in the present simulation. Since the cur-
Ep = ε(Dp )Ff |u|cp (Dp ), (8) rent study focuses on mass gain or loss specific to accumu-
lation mode aerosols, coagulation processes are also not in-
cluded. Brownian coagulation, while critically important for
where Ep is the particle capture by leaves (µg m−3 s−1 or predicting the number concentration of Aitken mode parti-
no. m−3 s−1 ) and ε is the total particle capture efficiency cles, is not important in the prediction of accumulation mode
by leaves as a result of inertial impaction (Peters and Eiden, particle mass (e.g., Kajino et al., 2013).
1992), gravitational settling, Brownian diffusion (Kirsch and
Fuchs, 1968), and interception (Fuchs, 1964; Petroff et al.,
2009). Ff is the shielding coefficient for particles in the hor- 3 Simulation setup
izontal direction, |u| is the horizontal wind speed (m s−1 ) at
each canopy layer, and cp is the particle mass or number con- 3.1 Study site and observational data
centration (µg m−3 or no. m−3 ). Ep , ε, and cp are integration
values of given size bins with particle diameters (Dp ; µm). We used measurements from an observation tower in a mixed
forest, namely the Field Museum Tamakyuryo (FM Tama) of
the Tokyo University of Agriculture and Technology, located
2.3 Aerosol dynamics in a western suburb of Tokyo, Japan (35◦ 380 N, 139◦ 230 E).
Deciduous trees (Quercus spp.) are dominant around the me-
In order to simulate changes in particle size due to condensa- teorological tower together with Japanese cedar trees (Cryp-
tion, evaporation, and water uptake, a triple-moment modal tomeria japonica). The canopy height around the tower is
method (Kajino et al., 2012) is employed at each atmospheric approximately 20 m. The growth period of deciduous trees is
layer in SOLVEG. Particles are grouped into fine (accumula- typically from April to December. Further detailed descrip-
tion) and Aitken modes with size distributions prescribed by tions of this site are provided by Matsuda et al. (2015) and
a lognormal function; the coarse mode is not considered in Yamazaki et al. (2015).
the simulation. The lognormal function is identified by three Simulations were carried out over two experimental pe-
parameters: number concentration (N; no. m−3 ), geomet- riods: the first in early autumn (26 September to 11 Oc-
ric mean diameter (Dg ; µm), and geometric standard devia- tober 2016) and the second in late autumn (7 November
tion (σg ). The triple-moment method predicts spatiotemporal to 7 December 2016). In the early-autumn period, daytime
changes in three moments (k) in order to identify changes in (08:00–17:00 local time) and nighttime (17:00–08:00 local
the shape of the lognormal size distribution of each mode. time) mean concentrations of inorganic gases were available
The selected three moments are 0th, 2nd, and 3rd (M0 , M2 , at five heights (1, 8, 16, 23, and 30 m), with fine-particle mass
and M3 ), which are respectively number (N), surface area concentrations observed using a four-stage filter-pack sam-
(m2 m−3 ), and volume concentrations (m3 m−3 ). Dg values pling system. System specifications were identical to those
for each moment are named Dg0 , Dg2 , and Dg3 . The rela- used in Nakahara et al. (2019), except for the particle fil-
tionships of the above lognormal parameters with the three ter material. This study used a glass fiber filter coated with
Atmos. Chem. Phys., 20, 4933–4949, 2020 www.atmos-chem-phys.net/20/4933/2020/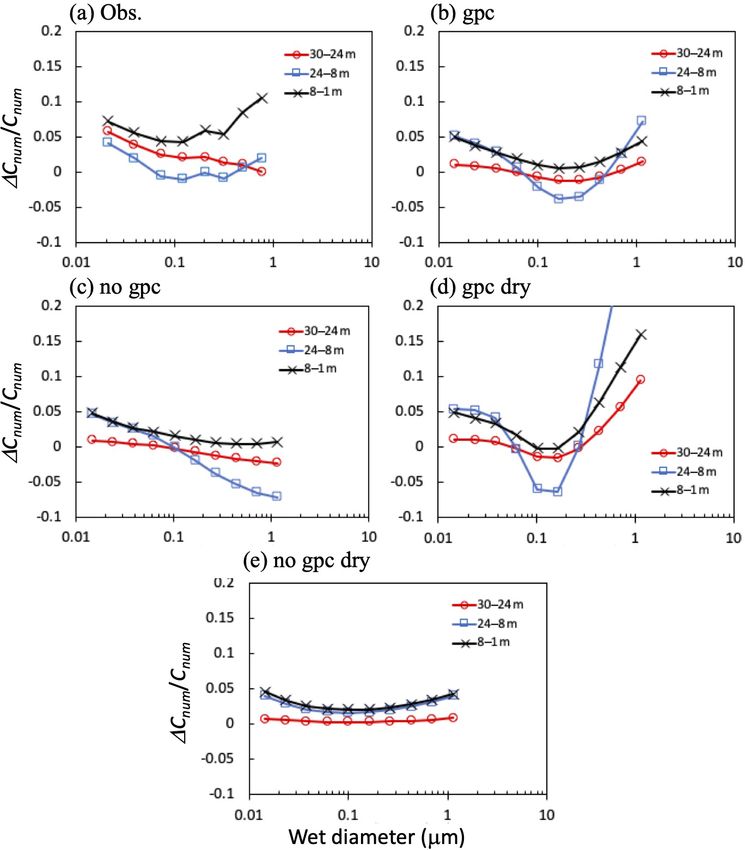
G. Katata et al.: Aerosol dynamics and gas–particle conversion in dry deposition                                             4937

Teflon for collecting fine and coarse particles. For the early-     put and validation. Incoming shortwave and longwave radi-
autumn period, filter-pack sampling was continuously per-           ation values at 30 m were used for the model input, while
formed during the day and night except during periods of            incoming longwave radiation was estimated by the parame-
rain. As a result, five daytime reading datasets and six night-     terization method of Duarte et al. (2006). Net radiation was
time reading datasets were collected. The gaps between data         measured using a net radiometer (Q7, REBS) and stored
in rain days of the early-autumn period were linearly interpo-      as half-hourly means by a data logger (CR10X, Campbell
lated for simulations. Since this interpolation could cause un-     Scientific). A sonic anemometer (81000, Young) was used
realistic effects on the results, we used only the calculations     to measure three-dimensional wind velocities and air tem-
and measurements in the periods of no rain for comparisons          peratures, and an enclosed infrared CO2 /H2 O gas analyzer
of inorganic mass concentration. For the late-autumn period,        (LI-7200, LI-COR) was used to measure the molar fraction
the time resolution was relatively low, as weekly continuous        of CO2 and H2 O. These data were sampled at a frequency
measurements were used. After the samples were collected,           of 10 Hz using an interface unit (LI-7550, LI-COR). Half-
inorganic ions in each filter were extracted into deionized         hourly CO2 , heat, and momentum fluxes were calculated us-
water by ultrasonic extraction and then analyzed using ion          ing Eddy Pro software (version 4.2.0, LI-COR), where dou-
chromatography (Dionex ICS-1100, Thermo Scientific).                ble rotation (Kaimal and Finnigan, 1994) and block averag-
   In the late-autumn period, measurements of particle num-         ing were applied to fluctuation data in order to calculate co-
ber concentrations were taken during the daytime (10:00–            variance. We then corrected the effect of air density fluctu-
16:00) for 7 d without rainfall. Airborne particle number con-      ations on the flux values (Burba et al., 2012). Corrections
centrations were measured by an electrical low-pressure im-         were made for low-frequency losses (Moncrieff et al., 2004)
pactor (ELPI+, Dekati Ltd.). This involves sampled particles        and high-frequency losses for low-pass filtering (Ibrom et al.,
being charged by corona discharge and later separated by            2007) and sensor separation (Horst and Lenschow, 2009). All
size using the principle of inertial classification through a       raw flux data were checked following the quality control pro-
13-stage cascade low-pressure (40 hPa) impactor combined            gram of Vickers and Mahrt (1997). Finally, we applied the
with a backup filter stage. During collection, charged parti-       quality check system proposed by Mauder and Foken (2006)
cles produce a current proportional to their respective num-        and excluded data judged to be low quality (quality control
ber concentrations. The broad particle size distribution mea-       flag of 2).
sured by the ELPI+ ranges from 6 nm to 10 µm. More de-                 The total (one-sided) leaf area index (LAI) measured
tails on the ELPI+ system used are provided in Järvinen et          with a plant canopy analyzer (LAI-2200, LI-COR) was 4.3
al. (2014). The ELPI+ particle sample inlets were placed at         and 3.6 m2 m−2 for October and November 2016, respec-
heights of 30, 23, 17, 8, and 1 m at the tower through Ty-          tively. Vertical profiles of leaf area density (LAD) were pro-
gon intake tubing with an inner diameter of 7.94 mm and re-         vided in order to obtain the above values of total LAI after
spective lengths of 6, 5, 10, 20, and 25 m. Each sampling           gamma function interpolation, with a maximum at a height
line for the five measuring heights was manually switched           of 15 m following Katata et al. (2013). LAI of the under-
every 2 min. The transit times for particle samples in the          story vegetation with 0.5 m height was given a typical value
tubing at each height ranged between 2 and 12 s. Results of         of 2.0 m2 m−2 in a Japanese forest (e.g., Sakai et al., 2006)
the first minute of concentration measurement were rejected         due to a lack of observational data.
in order to avoid the mixing of air samples from different
heights. Data were stored at a sampling rate of 1 s−1 . Raw         3.2   Boundary and initial conditions
data were averaged over intervals of 60 s and were later used
for calculating 600 s mean vertical profiles. Particle penetra-     The boundaries of each vegetation layer were set at heights
tion efficiencies were estimated using the indoor particles         of 0.05, 0.1, 0.2, 0.3, and 0.5 m (understory vegetation) and
in the laboratory by changing the lengths of the sampling           from 1 to 20 m (forest canopy) with an increment of 1 m.
tubes accordingly (30, 20, 15, 10, and 5 m). Based on these         Atmospheric layers were extended from the 20 m canopy to
results, raw concentrations were corrected prior to postpro-        30 m with an increment of 1 m. Half-hourly data for precipi-
cessing. Furthermore, the data were further screened out ac-        tation, atmospheric pressure, horizontal wind speed, air tem-
cording to several selection criteria to ensure their credibility   perature and humidity, and incoming longwave and short-
with respect to three uncertainties: uncertainty in the number      wave radiation were applied to the top atmospheric layer.
concentration measurements, signal-to-noise ratio (Deventer         Inorganic mass concentrations of gases (SO2 , NH3 , HNO3 ,
et al., 2015), and variation in background current (the sig-        and HCl) and PM2.5 particles (SO2−        −     +     +    −
                                                                                                       4 , NO3 , NH4 , Na , Cl ,
                                                                       2+    +          2+
nal obtained from particle-free air through a HEPA – high-          Ca , K , and Mg ) measured by a filter pack were linearly
efficiency particulate air – filter for each particle stage) be-    interpolated at half-hourly timescales. For the Aitken mode,
fore and after the measurements.                                    inorganic mass concentrations were assumed to be one tenth
   Half-hourly meteorological data for horizontal wind              of those of the fine mode, based on size-resolved number
speed, air temperature, and humidity at heights of 30, 25,          concentrations from ELPI+ observations (not shown). The
20, 10, 6, and 1 m at the tower were used for model in-             boundaries of the soil layers were at depths of 0.02, 0.05,

www.atmos-chem-phys.net/20/4933/2020/                                                Atmos. Chem. Phys., 20, 4933–4949, 2020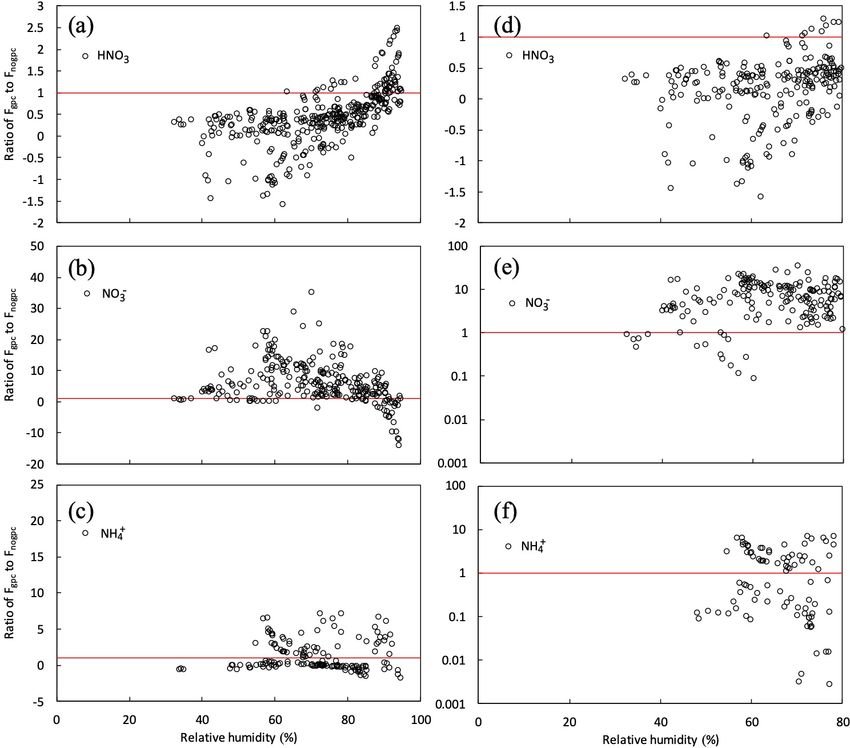
4938                                          G. Katata et al.: Aerosol dynamics and gas–particle conversion in dry deposition

                                                                         trogen compounds. The uncertainties associated with input
                                                                         data described above, such as number concentration and par-
                                                                         ticle size distribution, should be improved in the future.

                                                                         3.3    Simulation scenarios

                                                                         To reveal the impacts of NH4 NO3 gas–particle conversion
                                                                         and hygroscopic growth, the following four simulation sce-
                                                                         narios were adopted: (1) NH4 NO3 gas–particle conversion
                                                                         and aerosol water uptake (“gpc” scenario); (2) aerosol wa-
                                                                         ter uptake but no NH4 NO3 gas–particle conversion (“no
                                                                         gpc” scenario); (3) NH4 NO3 gas–particle conversion but
                                                                         no aerosol water uptake (“gpc dry” scenario); and (4) no
                                                                         NH4 NO3 gas–particle conversion and no aerosol water up-
                                                                         take (“no gpc dry” scenario). Calculations in all scenarios
Figure 1. (a) Modeled and observed number-based size distribution        were compared with observations of vertical profiles of the
of particles at 10:00 on 7 November 2016. (b) Temporal changes           total number and inorganic mass concentrations within and
in the volume fraction of inorganic compounds (fio ) for the early-      above the canopy.
autumn period. Please note that the date is given on the x axis in the
month/day format.
                                                                         4     Results

                                                                         4.1    Micrometeorology during autumn 2016
0.1, 0.2, 0.5, 1.0, and 2.0 m. Constant values for soil temper-
ature (15 ◦ C) and saturated volumetric water content for typ-           Temporal changes in friction velocity (u∗ ), net radiation
ical loam soil texture (0.43 m3 m−3 ) were used. The model               (Rnet ), and sensible (H ) and latent heat (LE), and CO2 fluxes
setup and parameters are given in Supplement Table S1.                   over the canopy for the early-autumn and the late-autumn
   The boundary conditions and input data used in the setup              periods are shown in Figs. 2 and 3, respectively. Overall,
of the simulation are summarized in Table 1. Lognormal pa-               the modeled momentum and heat fluxes agreed with ob-
rameter sets of (Dg3 , σg ) for fine and Aitken modes at the             served values, although observed high friction velocities in
upper boundary condition were respectively set at (0.089 µm,             November and December 2016 were slightly underestimated
2.1) and (0.26 µm, 2.0) based on manual fitting of ELPI+                 (Fig. 3a). Water vapor and CO2 exchange processes deter-
measurements at a height of 30 m (Fig. 1a). These param-                 mining the level of stomatal uptake of gases were also repro-
eter sets were applied to the early- and late-autumn peri-               duced well by the model (Figs. 2c, e and 3c, e).
ods. In order to simulate the vertical profiles of the total                Figures 4 and 5 illustrate time series of horizontal wind
number concentration within the canopy, the volume frac-                 speed, air temperature, and relative humidity under the
tion of inorganic compounds, fio , was given by the data                 canopy in both simulation periods. Wind speed was under-
of total inorganic mass and total number concentration. For              estimated within the forest, as was friction velocity (Fig. 3a
the late-autumn period, temporal changes in weekly fio val-              and d), probably due to horizontal advection over hilly terrain
ues in both the fine and Aitken modes was shown by data                  (Matsuda et al., 2015). For calculated air temperature and
from filter-pack and ELPI+ measurements. However, for the                humidity, the primary determinants of ambient conditions
early-autumn period, ELPI+ measurements were unavailable                 of gas–particle conversion and aerosol hygroscopic growth,
as described above. Consequently, temporal changes in fio                calculated temporal changes were similar to observations
(Fig. 1b) were set based on both filter-pack data at the study           within the canopy (Figs. 3b, c and 4b, c). These features were
site and total PM2.5 mass concentrations observed at the                 also noted in mean vertical profiles during both daytime and
nearest air quality monitoring station at Hachioji (3 km west-           nighttime in the early-autumn period (Fig. S1).
northwest of the study site). For both periods, fio values for
the Aitken mode were assumed to be equal to the fine mode,               4.2    Inorganic mass concentration and flux in early
since no observational data were available.                                     autumn 2016
   Since no data were available at the study site for emis-
sion potentials of NH3 at the ground surface (χg ) and stom-             Figure 6a and b shows time series for observed and cal-
ata (χs ), we used typical values of 0g = 300 (Massad et al.,            culated major inorganic nitrogen compounds (HNO3 and
2010) and 0s = 2000 (Neirynck and Ceulemans, 2008).                      NH3 gases and NO−             +
                                                                                             3 and NH4 fine particles) under the
   Our simulation used basic and less time-resolved datasets             canopy in the early-autumn period. Substantial differences
for a first application of the model to the NH4 NO3 gas–                 were observed between the scenarios of gpc and no gpc for
particle conversion and aerosol water uptake of reactive ni-             HNO3 and fine-NO−  3 concentrations during the daytime on

Atmos. Chem. Phys., 20, 4933–4949, 2020                                                   www.atmos-chem-phys.net/20/4933/2020/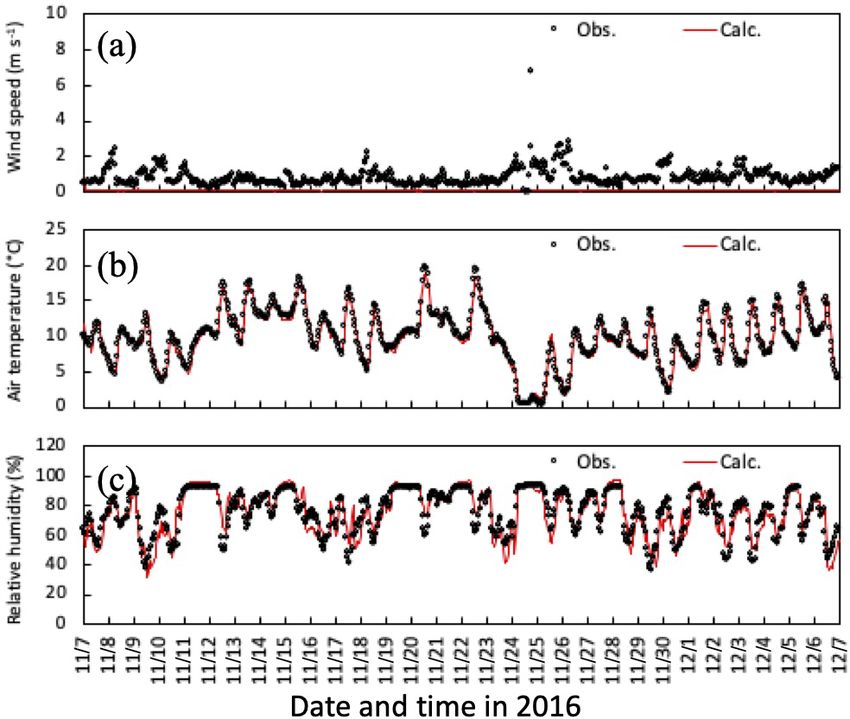
G. Katata et al.: Aerosol dynamics and gas–particle conversion in dry deposition 4939
Table 1. Summary of input data, initial conditions, and boundary conditions for the SOLVEG simulation setup. FP: filter-pack measurements;
ELPI+: ELPI+ measurements; fio : volume fraction of inorganic compounds. It should be noted that the gaps between FP in rain days of the
early-autumn period were linearly interpolated for simulations.
Early autumn Late autumn
Period 26 September–11 October 2016 7 November–7 December 2016
Target of simulation Fine inorganic mass concentration and flux Total number concentration and flux
Upper boundary condition
Inorganic mass concentration FP day and night (without rain days) FP weekly (continuous)
Particle size distribution Fitting of ELPI+ (Fig. 1a)
fio FP and Hachioji station FP and ELPI+
Figure 2. Temporal changes in observed and simulated (a) fric-
tion velocity, (b) net radiation, (c) sensible and (d) latent heat, and
(e) CO2 fluxes from 27 September to 11 October 2016. Please note
that the date is given on the x axis in the month/day format.
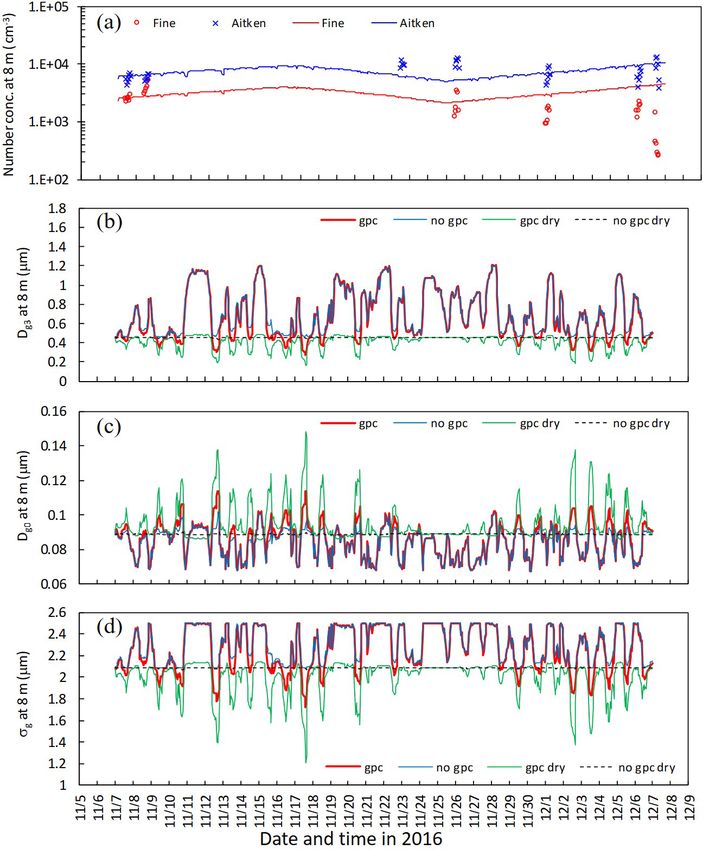
Figure 3. Temporal changes in observed and simulated (a) friction
velocity, (b) net radiation, and (c) sensible and (d) latent heat, and
28 September. In the gpc scenario, HNO3 concentrations (e) CO2 fluxes from 7 November to 6 December 2016. Please note
were increased due to the evaporation of NH4 NO3 during the that the date is given on the x axis in the month/day format.
daytime, whereas NO− 3 concentrations were decreased. Con-
sequently, strong variations in NO−
3 mass concentration were
reproduced in the gpc scenario. A lesser impact of evapora-
tion due to NH4 NO3 on both NH3 and fine-NH+ 4 concentra-
tions was observed.
www.atmos-chem-phys.net/20/4933/2020/ Atmos. Chem. Phys., 20, 4933–4949, 2020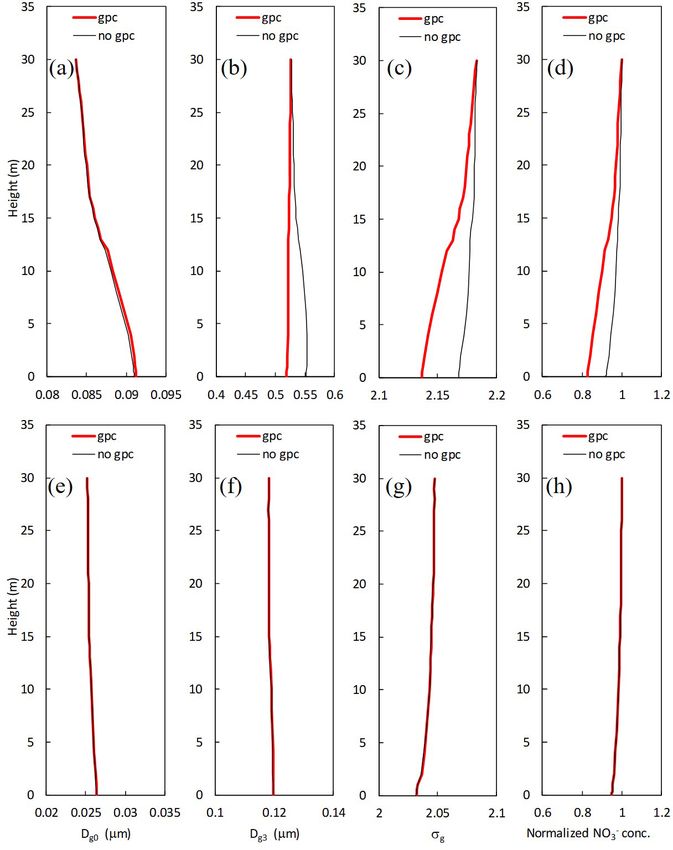
4940                                          G. Katata et al.: Aerosol dynamics and gas–particle conversion in dry deposition

Figure 4. Temporal changes in observed and simulated (a) horizon-
tal wind speed, (b) air temperature, and (c) relative humidity at 6 m   Figure 5. Temporal changes in observed and simulated (a) horizon-
height from 27 September to 11 October 2016. Please note that the       tal wind speed, (b) air temperature, and (c) relative humidity at 6 m
date is given on the x axis in the month/day format.                    height from 7 November to 6 December 2016. Please note that the
                                                                        date is given on the x axis in the month/day format.

   The calculated fine-mode mass-based wet diameter (Dg3 )
and RH are shown in Fig. 6c. Hygroscopic growth has a sig-
nificant impact, reflecting in particle size distribution differ-
ences between the scenarios of no gpc and no gpc dry; e.g.,
Dg3 values in the latter were 1.4 µm higher than those in the
former at 0.4 µm during the nighttime on 29 September 2016.
Although this process also influences size distribution during
the daytime, a competing shrinkage mechanism, NH4 NO3
evaporation, appeared in the gpc scenario. As a result, the
difference in daytime Dg3 between the scenarios of gpc and
no gpc was up to 0.12 µm on 28 September.
   Figure 7 depicts vertical profiles of normalized gaseous
and particulate mass concentrations in the early-autumn pe-
riod. The profiles averaged for the sampling periods were
compared with observed profiles. In the scenario of no
gpc (Fig. 7b), vertical gradients in fine-particle compounds
(SO2−       −           +
     4 , NO3 , and NH4 ) were similar, since the same equa-
tion for collection efficiency (Eq. 8) was used for all inor-
ganic particle compounds. In contrast, vertical gradients of
NO−            +
    3 and NH4 concentrations drastically increased due to
NH4 NO3 evaporation in the gpc scenario (Fig. 7c and f), pro-
ducing gradients similar to those observed (Fig. 7a and d).             Figure 6. Temporal changes in observed and calculated mass con-
This feature was also visible in vertical profiles of mass flux         centrations of (a) HNO3 and NH3 gases and (b) NO−               +
                                                                                                                             3 and NH4 fine
                                                                        particles and mass-equivalent geometric mean wet diameter (Dg3 )
for all inorganic nitrogen components during the daytime
                                                                        at 8 m height from 27 September to 11 October 2016. Calculations
(Fig. S2). The impact of NH4 NO3 evaporation was smaller
                                                                        for three scenarios (gpc, no gpc, and no gpc dry; see main text for
during nighttime (Fig. 7c) than daytime (Fig. 7f), which also           details) are plotted in the figure. The relative humidity (RH) cal-
aligns with observed diurnal patterns (Fig. 7a and d). High             culated at 6 m height in Fig. 3c also appears in (c). Grey-shaded
values of observed fine-SO2− 4 concentration were calculated            areas represent periods of rainfalls during which no filter-pack data
in both scenarios (Fig. 7a–c).                                          are available. Please note that the date is given on the x axis in the
   Figure 8 shows the time series for the calculated apparent           month/day format.
mass flux of HNO3 , NH3 , and fine NO−                +
                                          3 and NH4 over the

Atmos. Chem. Phys., 20, 4933–4949, 2020                                                    www.atmos-chem-phys.net/20/4933/2020/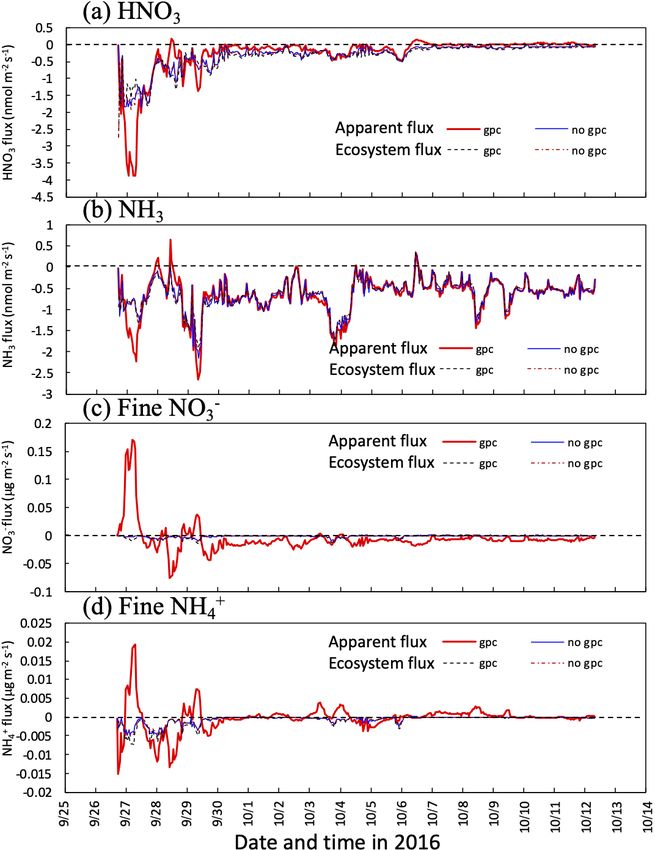
G. Katata et al.: Aerosol dynamics and gas–particle conversion in dry deposition                                                 4941

Figure 7. Mean vertical profiles in (a) observed and (b) calculated normalized mass concentration in the scenario of no gpc and (c) the
scenario of gpc for HNO3 and NH3 gases and SO2−          −          +
                                                 4 , NO3 , and NH4 fine particles (a–c) during the daytime and (d–f) nighttime between
27 September and 11 October 2016.

canopy in both the scenarios of gpc and no gpc. The actual            evaporation (Fig. 9b and d), whereas below-canopy Dg0 was
deposition flux of each component (ecosystem flux) is shown           larger in gpc dry than in no gpc dry (Fig. 9c). For the sce-
for comparison with apparent flux. The impact of NH4 NO3              narios of gpc and no gpc in which aerosol water was consid-
evaporation on fluxes was the highest from 26 to 29 Septem-           ered, Dg3 increased due to hygroscopic growth, although the
ber. The calculated NO−   3 flux above the canopy was positive        influence of NH4 NO3 gas–particle conversion on Dg3 was
during the nighttime for several days (Fig. 8c) due to the con-       still apparent (Fig. 9b). Some discrepancies between obser-
densation of HNO3 (Fig. 8a). As for in-canopy NH3 concen-             vations and calculations were found after 25 November 2016
trations (Figs. 6 and 7), NH4 NO3 evaporation has less impact         with respect to temporal changes in number concentration
on NH3 flux than on other species (Fig. 8b).                          (Fig. 9a).
                                                                         Figure 10 shows vertical profiles of parameters for the log-
4.3   Particle size distribution in late autumn 2016                  normal size distribution and normalized NO−    3 mass concen-
                                                                      tration in the scenarios of no gpc and gpc. For fine particles,
Figure 9 shows the time series for number concentration               the values of Dg3 and normalized NO−   3 concentrations at 8 m
within the canopy in the late-autumn period, together with            were respectively 5.1 % and 8.9 % smaller in the scenario of
parameters for the lognormal size distribution of the fine            gpc than in the scenario of no gpc due to the evaporation of
mode. Initial number concentration values on 7 November               NH4 NO3 (Fig. 10b and d), and the calculated σg was also
(Fig. 9a) were tuned via adjustments of the ratio of inorganic        1.2 % smaller (Fig. 10c). In contrast, calculated Dg0 slightly
compounds (fio ) for each mode. Below-canopy Dg3 and σg               increased by 0.3 % at the same height (Fig. 10a). Almost no
were smaller in gpc dry than in no gpc dry due to NH4 NO3

www.atmos-chem-phys.net/20/4933/2020/                                                  Atmos. Chem. Phys., 20, 4933–4949, 2020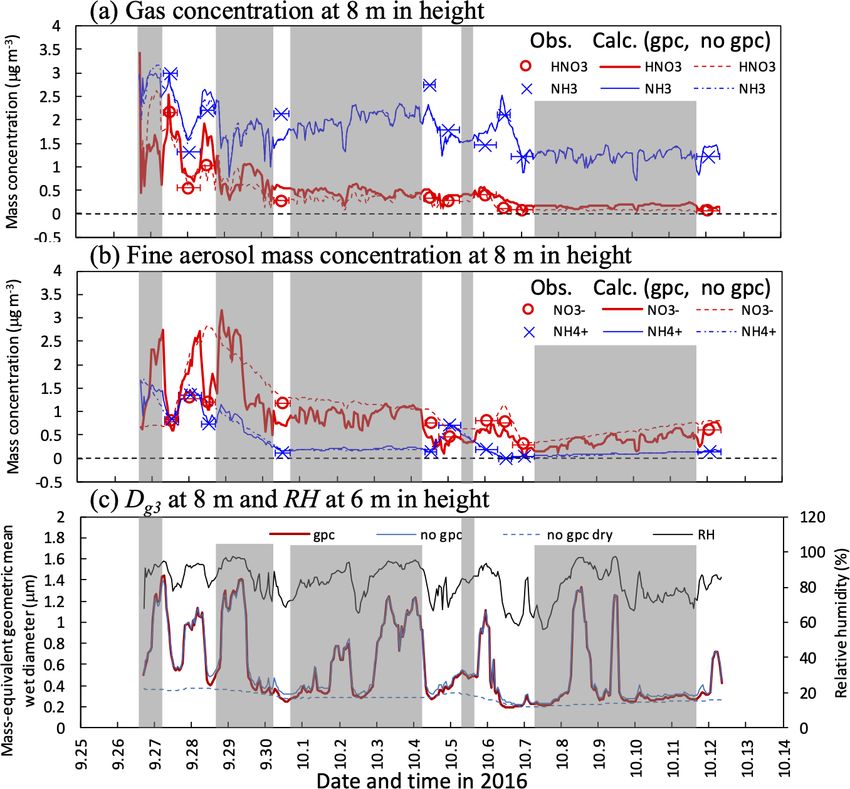
4942                                          G. Katata et al.: Aerosol dynamics and gas–particle conversion in dry deposition

                                                                         Figure 9. Temporal changes in (a) observed and calculated num-
                                                                         ber concentration of fine and Aitken modes, (b) calculated mass-
Figure 8. Temporal changes in calculated apparent mass flux of           equivalent (Dg3 ), (c) number-equivalent geometric mean wet di-
(a) HNO3 gas and (b) NO−             +
                           3 and NH4 fine particles at 30 m height in    ameter (Dg0 ), and (d) standard deviation (σg ) of fine particles at
two scenarios (gpc and no gpc) between 27 September and 11 Octo-         8 m height from 7 November to 7 December 2016. Calculations for
ber 2016. Fluxes captured by forest (ecosystem flux) are also plotted    four scenarios (gpc, no gpc, gpc dry, and no gpc dry) are plotted
in the figure. Please note that the date is given on the x axis in the   in the figure. Please note that the date is given on the x axis in the
month/day format.                                                        month/day format.

effect of NH4 NO3 gas–particle conversion was found in the               leave to the next smaller size bin, whereas more particles
Aitken mode (Fig. 10e–h).                                                shrink out of a given size bin than shrink into it from the next
   Figure 11 shows differences in the total number concen-               larger size bin, resulting in apparent fast deposition (Ryder,
tration for the regions above, within, and below the canopy              2010). In the gpc scenario (Fig. 11a–d), particles in the fine
during the daytime in the late-autumn period, with particular            mode shrunk in this size range due to in-canopy NH4 NO3
reference to the differences among these concentrations. In              evaporation, resulting in an apparent tendency to emit from
the submicrometer size range (0.1–0.4 µm), differences be-               the canopy to the air above (Fig. 11d). Meanwhile, differ-
tween height pairs were strongest between 8 and 1 m (be-                 ences in number concentrations between 24 and 8 m (within
low), between 30 and 24 m (above), and between 24 and 8 m                the canopy) for large particles (> 0.3 µm) were excessively
(within the canopy). In the scenario of no gpc dry, the differ-          high in the gpc scenario compared to observational data. In
ence in number concentration between height pairs was min-               the scenario of no gpc, in which only aerosol water uptake
imal in the submicrometer size range, as determined by mod-              was considered (Fig. 11c), fine-particle sizes increased due
eled size-resolved dry-deposition velocity (Fig. 11e). Similar           to hygroscopic growth (Fig. 10), and the concentration dif-
results have been demonstrated by past numerical studies of              ferences between height pairs always remained positive in
size-resolved particle number flux (Ryder, 2010); for a parti-           this range. Finally, in the gpc scenario where both NH4 NO3
cle diameter around 0.15 µm, the apparent flux switches from             evaporation and hygroscopic growth processes are consid-
deposition to emission within the canopy and approximately               ered (Fig. 11b), calculated negative gradients of number con-
reflects the peak in number size distribution. Furthermore,              centration appeared between 24 and 8 m (within the canopy)
apparent emission fluxes were represented as more particles              for the submicrometer range of 0.1–0.4 µm, again similar to
shrink into a given size bin from the next larger size bin than          observed patterns (Fig. 11a).

Atmos. Chem. Phys., 20, 4933–4949, 2020                                                     www.atmos-chem-phys.net/20/4933/2020/
G. Katata et al.: Aerosol dynamics and gas–particle conversion in dry deposition 4943
Figure 10. Mean vertical profiles for calculated (a, e) number-equivalent (Dg0 ) and (b, f) mass-equivalent geometric mean wet diameter
(Dg3 ), (c, g) standard deviation (σg ), and (d, h) normalized mass concentration of NO−3 for (a–d) fine and (e–h) Aitken modes in two
scenarios (gpc and no gpc) from 7 November to 7 December 2016.
5 Discussion derestimations in calculated wind speed (Figs. 3a and 4a)
and overestimations in total number concentration within the
5.1 Uncertainties in observation and model results canopy after 25 November 2016 (Fig. 9a). In Fig. 8, the con-
ditions for NH4 NO3 condensation were calculated for the
SOLVEG reproduced the general features of gas concentra- studied forest, although these conditions are normally found
tion, fine-particle mass, and fine-particle number concentra- over strong sources of NH3 (e.g., Nemitz et al., 2009). Thus,
tion observed within the canopy. Several uncertainties (e.g., the results of this study should be considered a first test of the
low time resolution of weekly filter-pack data in the late- model to the NH4 NO3 gas–particle conversion and aerosol
autumn period, initialization of measurement uncertainty, water uptake of reactive nitrogen compounds, rather than a
and complex topography of the study site) may cause un- conclusive assessment of its capability.
www.atmos-chem-phys.net/20/4933/2020/ Atmos. Chem. Phys., 20, 4933–4949, 20204944 G. Katata et al.: Aerosol dynamics and gas–particle conversion in dry deposition
Figure 11. Differences (1Cnum ) in (a) observed and (b–e) calculated mean total number concentrations (Cnum ) between height pairs for
11:00–17:00 on 7, 8, 25, and 30 November 2016. Four calculation scenarios are presented in the figure: (b) gpc, (c) no gpc, (d) gpc dry, and
(e) no gpc dry.
Another uncertainty in the results could be associated with dry-deposition and evaporation processes that formed the
the assumption of the same composition in size at the initial main focus of this study, this effect certainly influences par-
and boundary conditions. Variations of chemical composi- ticle mass flux in the forest itself. Nevertheless, the order
tion in size cause variations in equilibrium vapor pressure at of the magnitude of observed normalized inorganic mass
the particle surface due to Kelvin and Raoult effects, due to concentration within the canopy during the daytime, i.e.,
uncertainty in the simulation of the swelling and shrinking of SO2− + −
4 > NH3 > NH4 > NO3 > HNO3 (Fig. 7a), was well re-
particles. Since we used a modal aerosol dynamics method, produced by the gpc scenario of the model (Fig. 7c). For the
the differences of these effects within each mode cannot be late-autumn period, while there is no direct measurement of
resolved. It is necessary to revisit this issue in the future using aerosol water content, the ambient RH profile to determine
size-resolved composition measurements and size-resolved hygroscopic aerosol growth was reproduced (Figs. 4c and
aerosol models, as done by Ryder (2010), to assess this un- 5c). As a result, the observed in-canopy negative gradient in
certainty. number concentration (i.e., apparent emission of particles) in
Concerning potential shortcomings in the modeling as- the 0.1–0.4 µm size range was simulated in the gpc scenario
pect, particle growth due to biogenic secondary organics was (Fig. 11a and b). These results indicate that the model devel-
not considered and might increase uncertainty in model re- oped can be effectively used to address the impact of aerosol
sults. Although this effect might not be important for the dynamics on dry-deposition processes.
Atmos. Chem. Phys., 20, 4933–4949, 2020 www.atmos-chem-phys.net/20/4933/2020/G. Katata et al.: Aerosol dynamics and gas–particle conversion in dry deposition 4945
5.2 Formation mechanisms of particle size Calculated HNO3 fluxes decreased with decreasing RH,
distributions due to the evaporation of NH4 NO3 (Fig. 12a). Most val-
ues of the Fgpc /Fnogpc ratio for HNO3 under dry conditions
The complex form of the particle size distributions can (RH < 80 %) were below 0.5 and even tended to be negative,
mainly be explained by a combination of the (1) effects reflecting emission from the forest to the atmosphere. Prior
of in-canopy NH4 NO3 evaporation of small particles and studies have found the same flux difference; the deposition
(2) fine-mode hygroscopic growth of large particles. Ob- velocity of HNO3 varies from 4 to 7 cm s−1 (Huebert and
served vertical gradients of size-resolved number concentra- Robert, 1985; Meyers et al., 1989; Sievering et al., 1994).
tions within the canopy were reproduced only in the gpc sce- These velocities are often lower than theoretical maximum
nario (Fig. 11b). Other scenarios showed different tendencies values or even negative values, i.e., emission from the canopy
as follows (Fig. 11c–e). When only dry-deposition processes (Pryor et al. 2002; Nemitz et al., 2004). High HNO3 concen-
were considered (Fig. 11e), number concentrations above the trations were observed within the canopy, indicated by the
canopy were always larger than those within the canopy. Al- appearance of upward HNO3 fluxes over the canopy (Pryor
though the sharp negative gradient of number concentration et al., 2002). This suggests the possibility of flux divergence
between height pairs was computed for the 0.1–0.4 µm size due to NH4 NO3 evaporation in the HNO3 –NH3 –NH4 NO3
range, the addition of gas–particle conversion processes to triad within the forest. This explanation has previously been
the model (Fig. 11d) caused positive gradients for large par- suggested for other localities (Harrison et al., 1989; Sutton et
ticles (> 0.2 µm) to take on excessively high values com- al., 1993; Kramm and Dlugi, 1994; Müller et al., 1993).
pared to observational data. The number concentration of NH+ 4 flux over the forest was less influenced by gas-
such large particles increased within the canopy due to hy- to-particle conversion than NO− 3 (Figs. 7c, f, 8d) because
groscopic growth (Fig. 11d and e), resulting in a negative the dry-deposition rates of NH3 were substantially lower
gradient from the air above the canopy to the air within the than those of HNO3 , such that the differences in deposi-
canopy. tion rates between NH3 and NH+ 4 were much smaller than
those between HNO3 and NO3 . Indeed, the observed deposi-
5.3 Impacts of gas–particle conversion and aerosol tion trends for NH3 and NH+ 4 were considerably weaker than
dynamics on dry deposition those of HNO3 and NO− 3 . Furthermore, although the major
counter-ion of NO− + +
3 was NH4 , that of NH4 was not NO3
−
To quantify the impact of gas–particle conversion of
NH4 NO3 on fine-NO− but rather SO2−4 . Even though the same count of molecules of
3 flux above the canopy, we plotted the
respective ratios of HNO3 , NO− + NH3 and HNO3 was evaporated, the gross deposition rate of
3 , and NH4 fluxes over the
canopy in the scenario of gpc (Fgpc ) to those in the scenario NH+ 4 appears to have been influenced mainly by (NH4 )2 SO4
of no gpc (Fnogpc ), plotting each such ratio against RH at the and/or NH4 HSO4 as previously suggested by Nemitz (2015).
top of the canopy in the early-autumn period (Fig. 12). In The effect of NH4 NO3 gas–particle conversion on NH3 flux
this study, since the water uptake of aerosols, typically rep- was even lower than on fine NH+ 4 (Fig. 6a) because the mass
resented as the hygroscopic growth factor defined as the ra- concentration of NH3 was much higher.
tio between humidified and dry particle diameters, is almost
negligible under RH < approximately 80 % and increases at 5.4 Influencing the chemical transport modeling
values over RH > 80 % (e.g., Fig. 6 in Katata et al., 2014),
Considering the gpc process, particle deposition could repre-
we defined a threshold of 80 % for high- and low-RH con-
sent a very important nitrogen flux over the forest ecosystem.
ditions. As shown in Fig. 12b, the gas–particle conversion
Comparing calculated daytime mass fluxes at 30 m height be-
of HNO3 and NO− 3 shifted toward the particle phase under tween the scenarios of no gpc and gpc in the early-autumn
high-RH conditions. Conversely, under low-RH conditions
period (Fig. S2), the deposition fluxes of fine NO−3 and NH4
+
(< 80 %), most Fgpc /Fnogpc ratios were higher than unity
were 15 and 4 times higher in the gpc scenario, respectively.
for fine-NO− 3 concentrations (Fig. 12b and e). The impact of Since there was almost no change in SO2− 4 flux between the
NH4 NO3 evaporation on the fine-NO− 3 flux was very strong, two scenarios, this change is found to result only from gpc.
i.e., just below the deliquescence relative humidity (DRH) of
For gas species, both HNO3 and NH3 slightly decreased to
pure NH4 NO3 (61.8 %). The value of the Fgpc /Fnogpc ratio
0.6 and 0.8 times due to the evaporation of NH4 NO3 parti-
also reached ∼ 40 around RH = 50 % (Fig. 12b). Notably,
cles. This change in flux could be applied to that in the depo-
the thermodynamic equilibrium model in SOLVEG calcu-
sition velocity of each species. Furthermore, although parti-
lates the mutual DRH, which should not be pure NH4 NO3
cle deposition flux contributes only 5 % of the total nitrogen
particles. Such high values of (apparent) NO− 3 flux have also flux above the canopy in the scenario of no gpc, this impact
been observed in various forest types in Europe (Nemitz,
was increased to ∼ 39 % (NO− +
3 : 27.5 %, NH4 : 11.4 %) in the
2015). These cases may be also affected by NH4 NO3 evapo-
scenario of gpc. It should be noted that contributions of NH3
ration near the surface.
were still as large as 37 % of the total nitrogen flux, even in
the gpc scenario. These results indicate that the increase of
www.atmos-chem-phys.net/20/4933/2020/ Atmos. Chem. Phys., 20, 4933–4949, 20204946 G. Katata et al.: Aerosol dynamics and gas–particle conversion in dry deposition
Figure 12. Relationship between relative humidity (RH) at 30 m height and ratios of gpc to no gpc of calculated half-hourly fluxes
(Fgpc /Fnogpc ) for (a, d) HNO3 gas and (b, e) NO− +
3 and (c, f) NH4 fine particles over the canopy from 27 September to 11 October 2016.
Red lines represent the situation in which Fgpc = Fnogpc . Panels (d–f) plot the same variables as panels (a–c) but under dry conditions
(RH < 80 %).
(apparent) particle deposition due to NH4 NO3 evaporation humid conditions may play an important role in the dry de-
may be important in chemical transport modeling. position of submicrometer particles.
Theoretical values of deposition velocity for submicrome-
ter particles, typically ranging from 0.1–1 cm s−1 , may have
no substantial impact on surface concentrations in CTMs. 6 Conclusions
However, as discussed above, a high deposition velocity of
fine NO− 3 due to evaporation in the forest (up to 40 times the A new multilayer land surface model fully coupled with dry
above values) may effectively remove nitrate particles from deposition and aerosol dynamics was developed to evaluate
the atmosphere over the forest and leeward. If aerosol dy- the impact of NH4 NO3 –NH3 –HNO3 conversion in temper-
namics and gas–particle conversion processes can be incor- ate forests. The model was applied to field studies of mass
porated into the dry-deposition scheme of CTMs, we may and number concentration profiles in a Japanese mixed forest
improve upon or even eliminate prior studies’ overestimates during autumn 2016. Four model scenarios with and without
of the surface concentration of fine NO−3 (Kajino et al., 2013; NH4 NO3 gas–particle conversion and/or aerosol water up-
Shimadera et al., 2014, 2018; Morino et al., 2015; Sakurai take were tested to quantify the impact of these parameters
et al., 2015). Hicks et al. (2016) found that, when modeling on processes of dry deposition. Overall, the model success-
particle deposition velocities, the greatest uncertainty mani- fully reproduced micrometeorological conditions (in partic-
fested in the range 0.1–1.0 µm. The cause of this uncertainty ular, relative humidity) within and above the canopy. When
has not yet been convincingly established, although differing NH4 NO3 gas–particle conversion processes were included
treatments of key particle deposition processes (e.g., turbu- in the simulation, the vertical gradients of normalized mass
lent diffusion) have been suggested by prior studies (Petroff concentrations of nitrogen gases (HNO3 and NH3 ) and fine
and Zhang, 2010; Zhang and Shao, 2014). As demonstrated particles (NO− +
3 and NH4 ) within the canopy were clearly
in Fig. 12b and c, the evaporation of NH4 NO3 under less 2−
higher than those of SO4 . For particle size distribution, the
observed emission tendency of total number concentration
Atmos. Chem. Phys., 20, 4933–4949, 2020 www.atmos-chem-phys.net/20/4933/2020/G. Katata et al.: Aerosol dynamics and gas–particle conversion in dry deposition 4947
from the canopy to the atmosphere was explained by a larger Review statement. This paper was edited by Leiming Zhang and
effect of within-canopy evaporation of NH4 NO3 than due to reviewed by three anonymous referees.
hygroscopic growth. As a result, the removal flux of calcu-
lated fine NO−3 from the air above the forest to the forest can
increase by up to 40 times under the DRH of pure NH4 NO3 .
Similarly, the removal flux of calculated fine NH+ 4 can in- References
crease up to ∼ 10 times, although calculations for fine NH+ 4
fluctuate strongly with RH. Conversely, HNO3 flux over the Bae, S. Y., Jung, C. H., and Kim, Y. P.: Development of an aerosol
forest can decrease by 50 % or more due to NH4 NO3 evapo- dynamics model for dry deposition process using the moment
ration, supporting the findings of previous studies. Processes method, Aerosol. Sci. Tech., 43, 570–580, 2009.
of aerosol dynamics and NH4 NO3 –NH3 –HNO3 conversion Binkowski, F. S. and Shankar, U.: The regional particulate model
play a crucial role in the dry deposition of inorganic ni- 1. Model description and preliminary results, J. Geophys. Res.,
trogen particles in temperate forests. These processes can 100, 26191–26209, 1995.
and should be incorporated into chemical transport models Brost, R. A., Delany, A. C., and Huebert, B. J.: Numerical modeling
(CTMs) in order to improve the accuracy of total nitrate of concentrations and fluxes of HNO3 , NH3 , and NH4 NO3 near
the surface, J. Geophys. Res., 93, 7137–7152, 1988.
surface concentrations. An aerosol-dynamics–dry-deposition
Burba, G., Schmidt, A., Scott, R. L., Nakai, T., Kathilankal, J.,
scheme simplified from that present in this study could there- Fratini, G., Hanson, C., Law, B., McDermitt, D. K., Eckles, R.,
fore be implemented in CTMs. Furtaw, M., and Velgersdyk, M.: Calculating CO2 and H2 O eddy
covariance fluxes from an enclosed gas analyzer using an instan-
taneous mixing ratio, Glob. Change Biol., 18, 385–399, 2012.
Data availability. The output data in this study are publicly acces- Deventer, M. J., Held, A., El-Madany, T. S., and Klemm, O.: Size-
sible via contacting the authors. resolved eddy covariance fluxes of nuclear to accumulation mode
aerosol particles over a coniferous forest, Agr. Forest Meteorol.,
214–215, 328–340, 2015.
Supplement. The supplement related to this article is available on- Duarte, H. F., Dias, N. L., and Maggiotto, S. R.: Assessing daytime
line at: https://doi.org/10.5194/acp-20-4933-2020-supplement. downward longwave radiation estimates for clear and cloudy
skies in southern Brazil, Agr. Forest Meteorol., 139, 171–181,
2006.
Author contributions. GK developed the model with support from EANET (Acid Deposition Monitoring Network in East Asia): The
MK and performed the simulations using the data collected by KM, Third Periodic Report on the State of Acid Deposition in East
AS, and KT. GK prepared the paper with contributions from all Asia Part III: Executive Summary, 2–5, available at: https://
coauthors. www.eanet.asia/wp-content/uploads/2019/03/3_ex.pdf (last ac-
cess: 23 April 2020), 2016.
Farquhar, G. D., Firth, P. M., Wetselaar, R., and Weir, B.: On the
Competing interests. The authors declare that they have no conflict gaseous exchange of ammonia between leaves and the environ-
of interest. ment: determination of the ammonia compensation point, Plant
Physiol., 66, 710–714, 1980.
Flechard, C., Fowler, D., Sutton, M. A., and Cape, J. N.: A dynamic
chemical model of bi-directional ammonia exchange between
Acknowledgements. We gratefully acknowledge the helpful com-
semi-natural vegetation and the atmosphere, Q. J. Roy. Meteo-
ments and suggestions from Kentaro Hayashi at the National In-
rol. Soc., 125, 2611–2641, 1999.
stitute for Agro-Environmental Sciences, Tatsuya Sakurai at Meisei
Fountoukis, C. and Nenes, A.: ISORROPIA II: a computa-
University, Takeshi Izuta at the Tokyo University of Agriculture and
tionally efficient thermodynamic equilibrium model for K+ –
Technology, Satoru Miura at the Forestry and Forest Products Re- 2−
Ca2+ –Mg2+ –NH+ + − −
4 –Na –SO4 –NO3 –Cl –H2 O aerosols, At-
search Institute, and Makoto Tamura and Tetsuji Ito at Ibaraki Uni-
mos. Chem. Phys., 7, 4639–4659, https://doi.org/10.5194/acp-7-
versity, Japan. Our thanks are also extended to Mao Xu at the Tokyo
4639-2007, 2007.
University of Agriculture and Technology, Japan, for his contribu-
Fuchs, N. A.: The Mechanics of Aerosols, Pergamon Press, Oxford,
tion to the filter-pack measurements.
408, 1964.
Harrison, R. M., Rapsomanikis, S., and Turnbull, A.: Land Surface
Exchange in a Chemically-Reactive System – Surface Fluxes of
Financial support. This research has been supported by Grants-in- HNO3 , HCl and NH3 , Atmos. Environ., 23, 1795-1800, 1989.
Aid for Scientific Research (nos. 17H01868 and 16H02933) and Hicks, B. B., Saylor, R. D., and Baker, B. D.: Dry de-
the Leading Initiative for Excellent Young Researchers, provided position of particles to canopies – A look back and the
by the Japan Society for the Promotion of Science and the Ministry road forward, J. Geophys. Res.-Atmos., 121, 14691–14707,
of Education, Culture, Sports, Science and Technology. https://doi.org/10.1002/2015JD024742, 2016.
Hirashima, H., Yamaguchi, S., Sati, A., and Lehning, M.:
Numerical modeling of liquid water movement through
layered snow based on new measurements of the wa-
www.atmos-chem-phys.net/20/4933/2020/ Atmos. Chem. Phys., 20, 4933–4949, 2020You can also read