Microwave-optical coupling via Rydberg excitons in cuprous oxide
←
→
Page content transcription
If your browser does not render page correctly, please read the page content below
Microwave-optical coupling via Rydberg excitons in cuprous oxide

                                                                             Liam A. P. Gallagher, Joshua P. Rogers, Jon D. Pritchett, Rajan A.
                                                                              Mistry, Danielle Pizzey, Charles S. Adams, Matthew P. A. Jones∗
                                                                           Department of Physics, Durham University, Durham DH1 3LE, United Kingdom

                                                                                                          Peter Grünwald
                                                                           Center for Complex Quantum Systems, Department of Physics and Astronomy,
                                                                                 Aarhus University, Ny Munkegade 120, 8000 Aarhus C, Denmark

                                                                                                         Valentin Walther
arXiv:2109.09614v2 [cond-mat.mes-hall] 7 Oct 2021

                                                                  ITAMP, Harvard-Smithsonian Center for Astrophysics, Cambridge, Massachusetts 02138, USA

                                                                                     Chris Hodges, Wolfgang Langbein, Stephen A. Lynch
                                                                    School of Physics and Astronomy, Cardiff University, Cardiff CF24 3AA, United Kingdom
                                                                                                   (Dated: October 8, 2021)
                                                                    We report exciton-mediated coupling between microwave and optical fields in cuprous oxide
                                                                 (Cu2 O) at low temperatures. Rydberg excitonic states with principal quantum number up to n = 12
                                                                 were observed at 4 K using both one-photon (absorption) and two-photon (second harmonic gen-
                                                                 eration) spectroscopy. Near resonance with an excitonic state, the addition of a microwave field
                                                                 significantly changed the absorption lineshape, and added sidebands at the microwave frequency
                                                                 to the coherent second harmonic. Both effects showed a complex dependence on n and angular
                                                                 momentum, l. All of these features are in semi-quantitative agreement with a model based on intra-
                                                                 band electric dipole transitions between Rydberg exciton states. With a simple microwave antenna
                                                                 we already reach a regime where the microwave coupling (Rabi frequency) is comparable to the
                                                                 nonradiatively broadened linewidth of the Rydberg excitons. The results provide a new way to ma-
                                                                 nipulate excitonic states, and open up the possibility of a cryogenic microwave to optical transducer
                                                                 based on Rydberg excitons.

                                                                      I.    INTRODUCTION                             dberg states of opposite parity, which scales with princi-
                                                                                                                     pal quantum number, n, as n2 . However compatibility
                                                       Improved coupling between microwave and optical               between the laser cooling technology required for Ryd-
                                                    frequencies would enhance classical telecommunications           berg atoms and the millikelvin dilution refrigerator en-
                                                    as well as finding applications in distributed quan-             vironment of superconducting qubits is an ongoing chal-
                                                    tum networks and quantum communication. Solid-state              lenge [20–23]. An alternative Rydberg platform which
                                                    quantum bits (qubits) that operate at microwave fre-             is more compatible with other solid state devices is of-
                                                    quencies have been demonstrated using superconduct-              fered by excitonic states in semiconductors. Excitons in
                                                    ing circuits [1–3] and quantum dots [4]. These archi-            Cu2 O are a solid state analogue of hydrogen atoms [24–
                                                    tectures offer a high degree of control over quantum             28]. Rydberg exciton states with principal quantum
                                                    states and qubit coupling. However, the effects of ther-         number n > 25 have been observed [29, 30] with the
                                                    mal noise present problems for transporting the mi-              advantage over Rydberg atoms that these states exist
                                                    crowave quantum information over large distances [5, 6].         in the solid state and are straightforward to observe in
                                                    Conversely, optical quantum communication has been               a dilution refrigerator environment required for super-
                                                    demonstrated over global length scales [7–9]. To con-            conducting qubits [30–32].
                                                    nect these two regimes, a hybrid quantum system allow-              Electric dipole transitions between excitonic states
                                                    ing efficient conversion between optical and microwave           with low principal quantum number have been
                                                    frequencies is required [10, 11]. Microwave to optical           widely studied using far infra-red and terahertz spec-
                                                    conversion has been demonstrated to varying degrees              troscopy [33–46]. The energy separations in a Rydberg
                                                    using mechanical oscillators [12, 13], nonlinear crys-           series scale with n as n−3 . Combined with the reduced
                                                    tals [14] and Rydberg atoms [15–19].                             Rydberg constant of excitonic states, this scaling means
                                                       Rydberg atoms show promise due to the large electric          that for the “yellow” series in Cu2 O, electric dipole tran-
                                                    dipole moment associated with transitions between Ry-            sitions accessible to microwave frequencies on the or-
                                                                                                                     der of a few tens of GHz occur for states as low as
                                                                                                                     n = 8. These strong electric dipole transitions are re-
                                                                                                                     sponsible for the long-range van der Waals interactions
                                                    ∗   Correspondence email address: m.p.a.jones@durham.ac.uk       and Rydberg blockade observed in Cu2 O [29, 47, 48],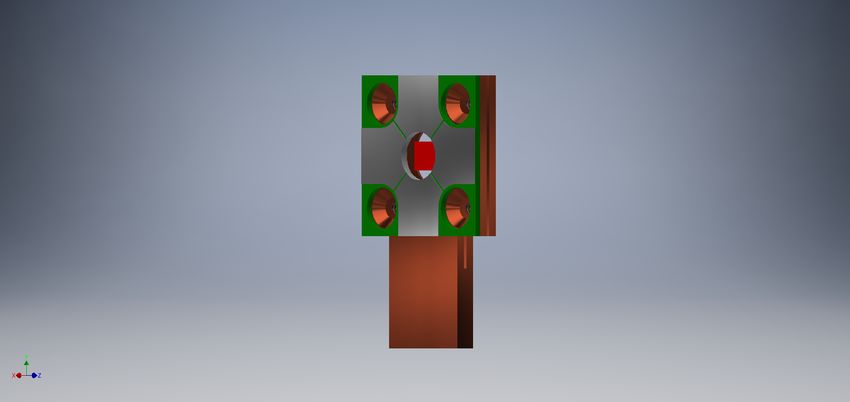
2
with potential applications in creating quantum states (a) (c) even parity odd parity
of light [49–51]. A novel tuneable maser has also been n+1 D S { fMW
P
{
proposed based on these transitions [52]. D
In this paper, we observe a coupling between the elec- n P
S
{
tric field produced by a simple planar microwave circuit
and the optical properties of cuprous oxide. The effect n 1 D P
(b) S
of the microwave field is studied using both one-photon
D
LE
absorption spectroscopy and second harmonic genera-
tion (SHG) spectroscopy [53–59]. In contrast to atomic VB
Rydberg states [60, 61], non-radiative broadening of the E (eV)
excitonic energy levels gives rise to a continuous mi- 2.1685 2.1695 2.1705 2.1715
(d)
crowave spectrum. Our observations are in good agree-
ment with a model based on intraband electric dipole 0.08 fMW = 15.0 GHz
Toff
0.06 Ton
transitions between excitonic states of opposite parity. 11P
0.04
T
These results provide a new tool for manipulating Ry-
dberg states of excitons, and the first step to building 0.02 6P 8P 9P 10P
5P 7P
a microwave to optical transducer based on Rydberg 0.00
excitons. (e)
0.05 9P 10P
5P 6P 7P 8P 12P
ΔT/Toff
0.00
II. EXPERIMENT -0.05 11P
-0.10
ΔT/Toff
Cuprous oxide is a direct band gap semiconductor 20
(f)
(bandgap energy of 2.172 eV). Spin-orbit coupling leads 0.05
to a splitting of the valence band. In this paper we 15
0.00
fMW (GHz)
study optical transitions between the upper level of the
valence band (Γ+ 7 symmetry) and excitonic states asso- 10 -0.05
ciated with the lowest level of the conduction band (Γ+6
symmetry), referred to as the yellow exciton series (570 5 -0.10
– 610 nm). Both energy levels have the same parity, and
so excitonic states with odd parity (P, F orbital sym- -0.15
2.1685 2.1695 2.1705 2.1715
metry) are accessible by single photon electric dipole E (eV)
transitions, while even parity states (S, D) are accessi-
ble via two-photon excitation (and electric quadrupole Figure 1. Effect of a microwave field on the one-photon
processes). Here we provide details of both one- and absorption spectrum of Cu2 O. (a) Antenna A1 and (b) An-
two- photon spectroscopy in the presence of microwave tenna A2 used to deliver microwave fields to the sample. (c)
fields. Energy level diagram for the one-photon experiment. LED
The experiments were performed on a naturally light probes odd parity (P) states. A microwave field of fre-
formed Cu2 O gemstone from the Tsumeb mine in quency fMW introduces coupling between the even and odd
Namibia. The crystal was oriented such that the (111) parity states. (d) Broadband transmission spectrum with
crystal plane was parallel with the surface and mechan- (blue) and without (purple) a microwave field at frequency
ically polished on both sides to a thickness of ∼ 50 µm. fMW = 15.0 GHz using antenna A2. Exciton states from 5P
to 11P are visible. The effect of the microwave field is more
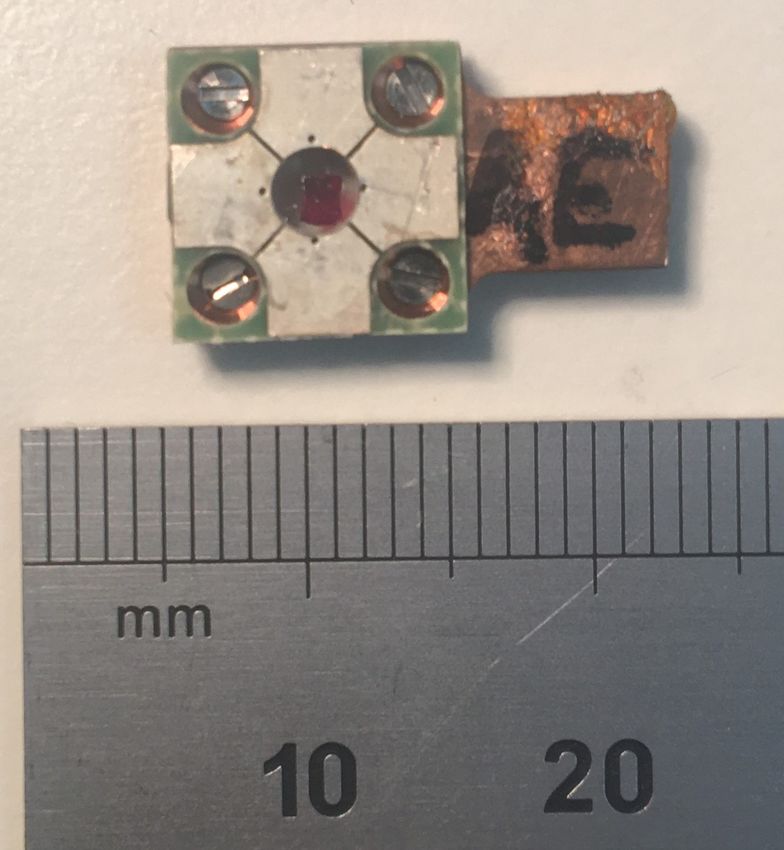
A 2 × 3 mm rectangle of this slice was mounted on a
prominent at higher n. (e) Relative change in transmission,
Ø 5 mm CaF2 window in a copper mount, shown in ∆T /Toff , due to the microwave field at fMW = 15.0 GHz us-
Figure 1 (a) and (b). A small quantity of glue was ap- ing antenna A2. The intensity is increased at P resonances
plied to one corner of the sample in order to maintain and decreased at the energies of the even parity states, in-
adequate thermal contact with the CaF2 window and dicating a mixing between the even and odd parity states.
copper mount. Details of sample mounting and prepa- (f) Heatmap of ∆T /Toff as a function of excitation energy,
ration are available in [62]. The sample was cooled in a E, and microwave frequency, fMW . Note that (e) is a cross
low-vibration closed-cycle helium refrigerator to ∼ 4 K. section of this heatmap at fMW = 15 GHz. Fine structure
Microwave fields were applied using one of the two in fMW dimension is attributed to the frequency response of
antennae shown in Fig. 1(a) and (b). Antenna A1 the antenna (see Appendix A).
(Fig. 1(a)) is a simple printed circuit board with four
pads. Two adjacent pads were connected to the mi-
crowave generator and two were grounded. Antenna
A2 (Fig. 1(b)) is a stripline design with an input and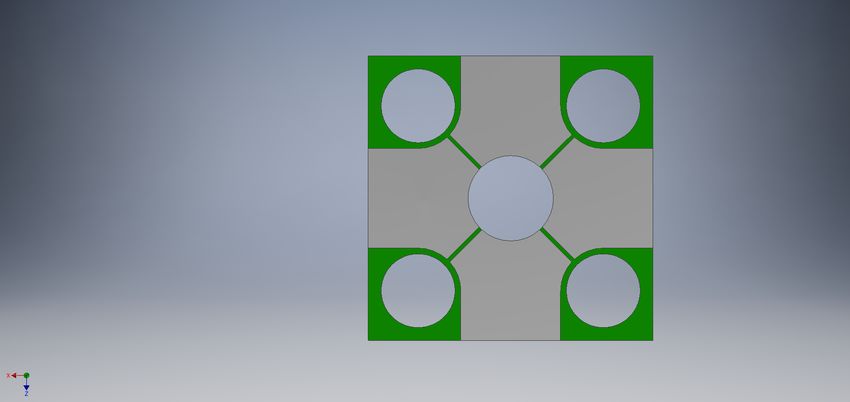
3

output port, with the latter terminated externally at        tribute to the antenna response (see Appendix A).
50 Ω. The relevant antenna was connected to a com-              The changes to the transmission spectrum seen in
mercial microwave synthesizer delivering frequencies of      Fig. 1 can be understood in terms of the mixing of op-
up to fMW = 20 GHz and powers PMW up to 25 mW. In            posite parity states (Fig. 1(c)). State mixing leads to
both cases the sample was placed in the near field of the    an increase in absorption on the S and D states (which
antenna, at the centre of the pads for A1 and between        acquire some P character) and a decrease in absorp-
the conductors for the stripline design. The frequency       tion on the P states. As the exciton states are broad
response of each antenna was found to be strongly af-        (full width half maximum of 14 GHz at 8P) relative to
fected by the presence of metallic components such as        their separation (8P to 8S is 23 GHz) the microwave re-
the sample mount and lens holders. Using electromag-         sponse is broadband, with many transitions contribut-
netic design software, A1 was found to only create an        ing at each value of the microwave frequency fMW .
appreciable electric field at the sample within bands of     This is in contrast to atomic Rydberg states where
microwave frequencies, fMW , around 16 and 19 GHz,           the atomic linewidth is considerably smaller than the
while the response of A2 was more broadband with su-         separation between states, leading to sharp resonances
perimposed narrow resonances. The maximum achieved           at discrete microwave frequencies. This alteration in
screened electric field inside the sample in the simula-     the microwave response is a consequence of the crys-
tions at PIN = 25 mW was calculated to be 360 V m−1          talline environment, since the increased width of the
and 1200 V m−1 for antennae A1 and A2 respectively           excitonic Rydberg states is due to non-radiative decay
using a dielectric constant of r = 7.5 for Cu2 O. Details   via phonons.
of these calculations are provided in Appendix A.

                                                                 B.   Microwave modulated second harmonic
  A.    Microwave control of optical transmission                               generation

   One-photon absorption spectroscopy was performed             To probe these effects in more detail, we switch to sec-
using a broadband LED as a light source. An energy           ond harmonic generation (SHG) spectroscopy. Second
level diagram of the one-photon experiment is shown in       harmonic generation in Cu2 O has been studied by sev-
Fig. 1(c). Broadband LED light (width of 14 nm cen-          eral authors, with a comprehensive discussion of the se-
tred at 580 nm) excites odd parity P states in the yellow    lection rules provided in [56–59]. SHG spectroscopy of-
series of excitonic energy levels. The spectrum of the       fers several advantages. The second harmonic is coher-
light transmitted by the sample was measured using a         ently generated with an emission spectrum determined
grating monochromator with a resolution of 70 µeV. The       by the excitation laser, and is easily separated from the
resulting transmission spectrum is shown in Fig. 1(d).       excitation light. In addition, the second harmonic gen-
In this energy range, the absorption is dominated by         eration spectrum does not exhibit the large phonon-
the background associated with phonon-assisted transi-       assisted background observed in one-photon transmis-
tions involving the lowest-lying 1S exciton [63, 64], with   sion spectroscopy [29, 63, 64]. Together these advan-
superimposed resonances associated with nP excitonic         tages enable us to observe the modulation of an optical
states. Our data shows excitons from n = 5 to n = 11,        carrier by the microwave field.
with the observation of higher n states limited by the          An energy level diagram of the SHG experiment is
spectral resolution of the monochromator.                    shown in Fig. 2(a). A two-photon excitation of fre-
   The effect of the application of a microwave elec-        quency fIN excites an even parity exciton through two
tric field at fMW = 15.0 GHz using antenna A2 is             dipole processes. The even parity exciton coherently
shown in Fig. 1(d). While there is no discernible change     emits light at twice the input frequency, 2fIN . Note
for the lowest excitonic states, the region with n > 7       that the emission from an even parity state is dipole-
is substantially modified. These changes are high-           forbidden due to parity, and so can only occur as an
lighted by plotting the fractional change in transmission    electric quadrupole process. The microwave field in-
(∆T /Toff = (Ton − Toff )/Toff ) as shown in Fig. 1(e).      troduces a coupling between the even and odd parity
Here, we can see that the microwave field changes the        exciton states through electric dipole transitions. This
transmitted intensity by more than 10% at certain en-        leads to the possibility of a four-wave mixing process oc-
ergies. The microwave frequency dependence is illus-         curring and the appearance of two additional frequency
trated in Fig. 1(f), which shows the change in transmis-     components appearing in the spectrum of the emitted
sion as a function of the microwave frequency fMW and        light, at a frequency 2fIN ± fMW .
excitation energy. A strong response is observed over a         The experimental setup is shown in Figure 2 (b).
broad range of microwave frequencies from 1 − 20 GHz,        The excitation light was generated by an external cav-
modulated by a complex structure of resonances that          ity diode laser that is tunable from 1140 to 1150 nm
are independent of the excitation energy that we at-         (linewidth of ∼ 10 neV). The frequency of the seed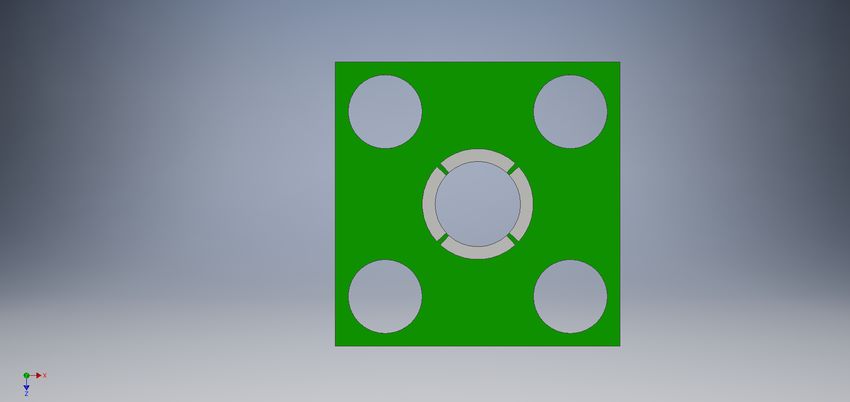
4

(a)                                        (b)                                                                    (c) (i)                                        E (eV)
                                                                                          aspheric   microwave
                                                           wavemeter                        lens      antenna                  2.1700              2.1705              2.1710               2.1715
even parity                  odd parity                                                                                      10
                                                                                                                                          7S     Ioff                  2.5
                                                                                                                                                                                   10D
                 D                                                                      dichroic                                                 Ion                                      11S
                                                                                                                                 8             fMW = 19.5 GHz         1.5                   11D
                     fMW                                            EOM       RFA                                                                                            10P                  12D
fIN D                                                                                                                                           7D     8S

                                                                                                                      I (kcps)
                                                                                                                                 6                                    0.5
                                                   seed laser                                                                                                    8D
                 Q 2fIR D 2fIN±fMW               1140 - 1150 nm        bandpass         SHG                                                                            2.1711        2.1713       2.1715
                                                                         filter                                                            7P                      9S
                                                                                                                                 4                          8P          9D
fIN D                                            photon                                                  sample                                                                     10S
                                                 counter                                       microwave at 4 K
                                                                                                                                 2
                                                               etalon                          generator                                                               9P
                                                             (optional)
                                                                                                                                 0
(d)              0.6                                                                                             (ii)
                               Ioff                                                fMW = 19.5 GHz
                               Ion                                                  E = E8S
                 0.4
      I (kcps)

                                                                                                                 ΔI/Ioff
                               ppLN
                                                                                  fMW
                 0.2
                                                    fMW
                 0.0
                       -30           -20           -10            0           10              20         30                      2.1700            2.1705              2.1710               2.1715
                                                              fE (GHz)                                                                                           E (eV)

Figure 2. Second harmonic generation spectroscopy of Cu2 O with a microwave field. (a) Energy level diagram of the
SHG experiment. Labels D and Q indicate whether the step occurs through a dipole or quadrupole process. Two-photon
excitation at frequency fIN excites an even parity (S or D) exciton. Emission can occur from this state through a quadrupole
process at frequency 2fIN . The addition of a microwave field of frequency fMW couples the even and odd parity exciton states
through electric dipole transitions leading to a four-wave mixing type process and new emission pathways at 2fIN ± fMW .
(b) Experiment block diagram. The seed laser light is sliced into pulses by an electro-optic modulator (EOM) and amplified
by a Raman fiber amplifer (RFA), before being focussed onto the sample. Backscattered light is collected and detected
using a photon counter. A scanning etalon may be inserted to provide additional filtering. (c)(i) Emitted second harmonic
intensity, I, as a function of two-photon excitation energy, E, with (Ion ; blue) and without (Ioff ; purple) a microwave field at
19.5 GHz. Resonance from n = 7 to n = 12 are visible. Solid purple line shows fit to Ioff . (ii) Fractional change in intensity,
∆I/Ioff , of the excitation spectrum with fMW = 19.5 GHz. The microwave field alters the SHG spectrum throughout the
range of two-photon excitation spectrum. (d) Spectrally resolved emitted second harmonic intensity, I, at E = E8S , with
(blue) and without (purple) a microwave field at fMW = 19.5 GHz as function of etalon detuning, fE . Red shaded area
shows light doubled through a ppLN crystal for comparison. The microwave field causes the appearance of sidebands on
the second harmonic.

laser was stabilized to a precision wavemeter (±60 MHz)                                               followed by two 1000 nm short-pass filters were used to
using a computer-controlled servo loop. The continu-                                                  remove residual excitation light. In addition, a band-
ous wave (CW) seed laser was amplitude modulated by                                                   pass filter centred at 580 nm was used to separate the
a fiber-coupled electro-optic modulator (EOM) to cre-                                                 coherently generated second harmonic from photolumi-
ate square pulses with duration τ = 50 ns and period                                                  nescence (PL) at the energy (wavelength) of the 1S exci-
T = 200 ns. The light was amplified by a commer-                                                      ton state at 610 nm [65]. The backscattered second har-
cial Raman fiber amplifier (RFA). The average power                                                   monic was coupled into a multimode optical fibre and
reaching the sample was monitored by a pickoff adja-                                                  sent to a photon counter for detection. For some ex-
cent to the cryostat window and was typically set to be                                               periments, a planar fused silica Fabry-Pérot etalon was
50 mW. An acousto-optic modulator after the ampli-                                                    inserted in the beam path before the detection fiber.
fier was used to stabilize average power to within 1%.                                                The etalon was tuned by varying its temperature. The
The excitation light was subsequently focused onto the                                                spectral response of the etalon was calibrated by using
sample using an aspheric lens with numerical aperture                                                 a periodically poled lithium niobate (ppLN) crystal to
0.6 to give a 1/e2 waist of approximately 0.5 µm inside                                               coherently generate the second harmonic of the laser
the sample.                                                                                           light, yielding a finesse of 44.5 ± 0.7 and a free spectral
                                                                                                      range (FSR) of 60.1 ± 0.2 GHz.
  The same aspheric lens was used to collect the light
emitted by the sample in a backscattering geometry (in                                                   An excitation spectrum was taken by scanning the
the bulk of the material SHG is generated in the for-                                                 laser in 0.5 GHz steps. At each step we recorded the
ward direction). A 785 nm long-pass dichroic mirror                                                   wavelength measured by the wavemeter and the SHG
5

intensity averaged over 4 seconds. Example results for      tions between excitonic states of opposite parity. Using
the spectral region covering n = 7 to 12 are shown          the exciton-polariton description of light-matter inter-
in Fig. 2 (c)(i), plotted against the two-photon exci-      actions, we derive the non-linear susceptibility for one-
tation (TPE) energy E = 2hfIN . As expected under           and two- photon excitation processes (see Appendix B),
two-photon excitation, the even parity (S and D) states     taking into account all dipole–allowed microwave cou-
are prominent. Odd parity excitons are also present         plings. At low microwave intensities and considering
between the S and D peaks. The P states have pre-           individual excited states, we recover the results of pio-
viously been observed in SHG and are attributed to a        neeering studies of the 2P → 1S electric dipole transi-
quadrupole excitation process [56].                         tion in Cu2 O [33, 35, 36, 66]. In this limit, the effect
   To observe the effect of the microwaves on the SHG       can be understood in terms of an AC Stark shift of the
spectrum, microwaves were applied in 0.5 second pulses      excitonic energy levels due to the microwave electric
with a 50% duty cycle, enabling concurrent measure-         field [33].
ment of the spectrum both with and without the mi-             In general, the light-matter coupling is a tensor de-
crowave field. For the experiments involving SHG, an-       pending on the crystallographic orientation and the po-
tenna A1 (Fig. 1(a)) was used. The effect of a mi-          larizations of the optical and microwave fields. How-
crowave field (fMW = 19.5 GHz) on the SHG spec-             ever, due to stress-induced birefringence in the CaF2
trum is shown in Fig. 2(c). The spectrum is modi-           windows, and the complex polarization behaviour of the
fied throughout the range of TPE energy, with some          antenna structures, we could not study polarization ef-
excitonic resonances enhanced, and others suppressed.       fects. Therefore in the following we neglect polarization
Fig. 2(c)(ii) plots the fractional change in intensity,     and consider only an effective scalar coupling.
∆I/Ioff = (Ion − Ioff )/Ioff . We note that in some re-
gions the fractional change in signal is larger than 40%.
As was the case for the experiments performed in sec-
tion II A the dependence of the signal on fMW was dom-      A.   Microwave modulation of optical transmission
inated by the response of the antenna (see Appendix A).
   To investigate the effect of the microwaves further,        First we consider the one-photon absorption exper-
we performed high-resolution spectroscopy of the SHG        iments presented in section II A. Neglecting reflection,
light using the temperature-tuned etalon shown in           the transmission, T , through a material can be mod-
Fig. 2(b). An emission spectrum obtained by scanning        elled by the Beer-Lambert law [67] as T = exp(−αL),
the etalon with the TPE energy fixed as E = E8S is          where α is the absorption coefficient and L is the thick-
shown in Fig. 2(d). With the microwaves off, we ob-         ness of the material. The absorption coefficient is re-
serve a single frequency component (the SHG carrier)        lated to the imaginary part of the susceptibility, χ, by
with a lineshape that is in excellent agreement with that   α = k Im(χ), where k is the wavenumber of the light.
obtained using the ppLN crystal, confirming that this       One-photon absorption in Cu2 O can be described by a
is indeed the coherently generated second harmonic.         linear susceptibility, χ(1) , which has contributions from
The addition of the microwave field leads to the ap-        both |n, Pi states and the phonon background. The
pearance of strong sidebands at fE = ±fMW , accompa-        contribution to the susceptibility from the |n, Pi state
nied by significant depletion of the carrier. We have       is given by
not observed higher-order sidebands. The sidebands
in Fig. 2(d) are not of equal strength, the sideband at                                               2
                                                                                       1     DVB→nP
+19.5 GHz (blue sideband) is significantly larger than                       (1)
                                                                            χnP    =                   .             (1)
the one at −19.5 GHz (red sideband). The relative am-                                20 ~η δnP − iΓnP
plitude of the sidebands and the carrier, and the sign
                                                                                                                       2
and magnitude of the asymmetry between the sidebands        Here, δnP = (EnP − E)/~ is the detuning, DVB→nP
is strongly dependent on E and fMW . We note that the       is the dipole moment per unit volume for the transition
total count rate in the SHG spectrum with microwaves        between the valance band (VB) and the |n, Pi state,
(Fig. 2(c)) represents the sum of these three compo-        EnP and ΓnP are the energy and width of the |n, Pi
nents.                                                      state, η is the refractive index of the material and E is
                                                            the excitation photon energy.
                                                               To model the change in absorption due to the mi-
                   III.   THEORY                            crowave field, we introduce a coupling between the even
                                                            and odd parity exciton states through electric dipole
  In this section we show that both the changes to          transitions, which gives rise to a third-order cross-Kerr
the absorption spectrum seen in Fig. 1 and the gener-       nonlinearity [33]. The contribution to the nonlinear sus-
ation of sidebands in the SHG process shown in Fig. 2       ceptibility from coupling the |n, Pi and |n0 , l0 i states is
can be explained in terms of the electric dipole transi-    given by
6
2 0 0 2 0 0 2
1 DVB→nP dnP→n l dnP→n l
(3) (1)
χnPn0 l0 = = χnP 2 . (2)
20 ~3 η (δnP − iΓnP )2 (δn±0 l0 − iΓn0 l0 ) ~ (δnP − iΓnP )(δn±0 l0 − iΓn0 l0 )
0 0
Here, dnP→n l = hn0 , l0 | e · r |n, Pi is the dipole matrix (a)
8D 9D
element and δn±0 l0 = (En0 l0 −E)/~∓2πfMW is the detun- 10D
ing from the |n0 , l0 i state. Both microwave absorption 7D
and emission, corresponding to plus or minus, respec-
tively, need to be retained as the linewidths of the states
ΔαL
involved are comparable to the microwave frequency 12P
5P 6P
meaning the rotating-wave approximation cannot be
made. Summing over the P states, and all correspond- 7P 11P
ing dipole-coupled states |n0 , l0 i, we find the change in 8P
9P 10P
absorption coefficient due to the microwaves
X (3) E (eV)
∆α = k Im 2
χnPn0 l0 EMW , (3) (b)
n,n0 ,l0 ,±
Enl = E8D Enl = E9D Enl = E10D 0.04
where EMW is the effective microwave electric field in-
side the sample. 0.03
R(Enl, E7D)
To relate the absorption coefficient to the measured
ΔαL
transmission, we must take into account the spectral 0.02
response of the monochromator. The optical transmis-
sion, T , measured in Fig. 1(d), can be written as a con- 0.01
volution T = (S ∗ e−αL ) over the photon energy E,
where S is the normalised zero-centred response func-
0.00
tion of the spectrometer. The absorption coefficient can
be written as α = α0 + ∆α, where α0 is the absorption fMW (GHz)
coefficient in the absence of microwaves. As is appar-
ent in Fig. 1(d) α0
∆α. In this limit, the measured Figure 3. Comparison of the predicted and measured change
fractional change in transmission can be approximated in one-photon absorption due to the microwave field. (a)
as Change in absorption due to the microwave field, ∆ᾱL, as
a function of excitation energy, E, at microwave frequency
∆T fMW = 15.0 GHz. The range of E spans from the n = 5
≈ −(S ∗ ∆α)L ≡ −∆ᾱL, (4)
Toff state up to the band edge. Experimental data is shown as
solid red line, and theoretical predictions as dashed blue line
where we introduced the convoluted quantity ∆ᾱ. for EMW = 400 V m−1 . (b) Predicted change in absorption
The parameters in equations (2)–(4) can be de- as a function of microwave frequency, fMW (shaded back-
termined experimentally or calculated from theory. ground, right axis) at excitation energy E = E7D . Also
S(E) was measured using frequency-doubled laser light. shown is the measured (points) and predicted (lines) ra-
χ(1) (E) can be obtained from fitting the absorption tio of the change in absorption at E = Enl to E7D ) as a
spectrum in the absence of microwaves (Fig. 1(d)). function of microwave frequency (left axis). Three different
values of Enl are shown, Enl = E8D (blue circles, solid line)
The energies and widths of the states can similarly
Enl = E9D (orange squares, dotted line) and Enl = E10D
be obtained from fitting the one-photon and two- (gold diamonds, dashed line) states.
photon (Fig. 2(c)(i)) spectra. The matrix elements,
0 0
dnP→n l , were calculated from theoretical exciton wave-
functions [48, 68].
Fig. 3(a) shows the predicted ∆ᾱL as a function of E not taken into account. More generally, there is good
at fMW = 15.0 GHz. Here the effective (unpolarized) qualitative agreement between the data and the model,
electric field strength EMW is used as a fitting parameter which reproduces all of the observed spectral features.
and found to be 400 ± 100 V m−1 . This value is in rea- The main discrepancy is that the model overestimates
sonable agreement with the calculated field inside the the reduction in absorption seen at the P states.
sample for antenna A2 of 1200 V m−1 , given that po- We note that this model is a perturbative ap-
larization effects and experimental insertion losses were proach which assumes a low microwave field strength.
7

This assumption0 0 is valid when the Rabi frequency               sence of the microwave field. The excitation is achieved
ΩnPn0 l0 = dnP→n l EMW /~ is considerably smaller than            through two dipole transitions and the emission by a
Γ. For the 8S→8P transition with an effective field               quadrupole transition [56]. The SHG intensity in the
strength of 400 V m−1 the effective Rabi frequency is             absence of a microwave field, Ioff , is given by
Ω8P8S = 2π × 9 GHz and the ratio of the Rabi fre-
                                                                                                                                             2
quency to the linewidth is Ω8P8S /Γ8P ≈ 0.4. This ratio
                                                                                                                1 Qnl→VB M VB→nl
increases with n; for the 10P→10D transition we ob-
                                                                                                      X
                                                                                           2
                                                                            Ioff =       AIIN                                                    ,
tain Ω10P10D /Γ10D ≈ 0.9. These values show that it is                                                         0 ~  δnl − iΓnl
                                                                                                 n,l=S,D
possible to achieve a coupling strong enough to match                                                                 2
                                                                                                                                                     (5)
the large nonradiative contribution to Γ even with the                                  2
                                                                                                      X         (2)
simple antenna designs used in this work. In the limit                              = AIIN                     χnl        .
Ω ∼ Γ higher order terms in the nonlinear susceptibility                                         n,l=S,D
will start to become significant, which may account for
                                                                                   (2)
some of the discrepancies seen between the theory and                Here χnl is the contribution from the |n, li state to
experiment in Fig. 3.                                             the second order nonlinear susceptibility, Qnl→VB is
                                                                                                                           2

   The microwave frequency dependence predicted by                the quadrupole moment per unit volume, M is an effec-
the model at E = E7D is shown as the shaded back-                 tive matrix element describing the two step excitation
ground in Fig. 3(b). As expected, the response is broad-          process, δnl = (Enl − E)/~ is the detuning from the
band due to the linewidth and large number of states              |n, li state with associated excitation energy E = 2hfIN ,
that contribute. To compare to experiment, we remove              IIN is the intensity of the excitation laser and A is a
the effect of the antenna resonances by taking the ratio          proportionality constant which depends on the phase
of the microwave response at different excitation ener-           matching condition, the length of the crystal, the fre-
gies, R(E1 , E2 ) = ∆ᾱ(E1 )/∆ᾱ(E2 ). In Fig. 3(b) we fix        quency of the light and the refractive index of Cu2 O.
E2 = E7D , and plot R for E1 = E8,9,10D . In all cases            We note that neglecting polaritonic effects [69, 70] SHG
R is nearly constant with microwave frequency fMW                 in Cu2 O is not well phase matched and so is an inef-
as predicted by the model. Indeed for the 8D and 9D               ficient process. A similar expression to equation 5 can
states we observed quantitative agreement between the-            be constructed for the contribution to Ioff from the odd
ory and experiment with no free parameters. For 10D               parity states [56, 58, 59]. However for simplicity we
R is underestimated by the model, which we attribute              neglect this process in the following, and assume that
to the likely breakdown of the perturbative approach              only even-parity states are excited in the absence of mi-
discussed above.                                                  crowaves.
                                                                     Now let us consider the case where a microwave field
                                                                  is applied. The first two steps of the four-wave mixing
B.   Second harmonic generation in the presence of                process are the same as the SHG process and can be de-
                a microwave field                                 scribed by the same effective matrix element, M . The
                                                                  microwave field introduces an electric dipole coupling to
  The model described in the previous section can be              odd-parity Rydberg states |n0 , l0 i which results in an ad-
extended to the SHG experiments presented in II B.                ditional electric dipole-allowed emission process. This
Here we show that such an extension results in a                  can viewed as a four-wave mixing process that leads to
semi-quantitative description of the appearance of side-          the creation of the sidebands on the second harmonic in
bands and reduction of the carrier intensity observed             Fig. 2(d). Again, we note that the large linewidth of the
in Fig. 2(d) that is in good agreement with the exper-            exciton resonances compared to their separation means
imental data. Details of the derivation are provided in           that the conventional near-resonant rotating-wave ap-
Appendix B.                                                       proximation cannot be made. The resulting expression
  First, let us describe the SHG process in the ab-               for the intensity ISB of the sidebands is

                                                                                                                                     2

                             X X 1                                    n0 l0 →VB                VB→nl
                ±                                               D                 Ωnln0 l0 M
               ISB     2
                   = AIIN                                                                                                              ,           (6)
                                   0 ~2                                                                        ±
                                                                                                               δn0 l0 −iΓn0 l0
                               0 0
                            n,l=S,D n l     (δnl −   iΓnl )(δn±0 l0   − iΓn0 l0 ) −      iΩ2nln0 l0       1+    ∓
                                                                                                               δn0 l0 −iΓn0 l0

where the ± corresponds to the blue and red sidebands             respectively.
8
As can be seen in Fig. 2(d) the intensity of the carrier field. The intensity of the carrier peak when the mi-
peak is also altered by the presence of the microwave crowave field is on, ICAR , is given by
2
X X 1 nl→VB VB→nl
Q M
2
ICAR = AIIN . (7)
0 ~ 1 1
0 0
n,l=S,D n l (δnl − iΓnl ) + Ω2nln0 l0 − + +
δn 0 l0 −iΓn0 l0 δn 0 l0 −iΓn0 l0
The change in carrier intensity, ICAR due to the mi- (a) (b)
crowave field is given by 10.00 ●
●
■
●
■
0.100
● ■
● ■
∆ICAR = ICAR − Ioff . (8) 1.00
I (kcps)
I (kcps)
● ■
■
● ◆
■ ◆
◆
Detailed derivations of equations 5, 6 and 7 are given 0.010
● ●
■
0.10 ◆
■
●
■ ◆
in Appendix B. ◆
To compare the model to experiment, we fit each 0.01 ◆
◆
feature (carrier, sidebands) in the experimentally mea- 0.001 ◆
sured etalon scans (an example is shown in Fig. 2(d)) 10 50 100 500 0.5 1 5 10
with the Lorentzian etalon response function. The de- PIN (mW) PMW (mW)
+
pletion in the carrier was measured by fitting Ion − Ioff Ioff |ΔICAR| ISB ISB
in the experimentally measured etalon scans. On the
theory side, the product |M VB→nl |2 IIN is obtained by Figure 4. Laser and microwave power dependencies of side-
fitting the SHG peak amplitudes in Fig. 2(c)(i). Here band and carrier amplitudes in the SHG experiment. Here
equation 5 should provide the appropriate fit function, the two-photon excitation energy is E = E8S and the mi-
with M VB→nl IIN , δnl and Γnl as fit parameters. How- crowave frequency is fMW = 19.5 GHz. (a) Laser power,
ever, fits using a sum of complex poles are not uniquely PIN , dependency of SHG (triangles), magnitude of carrier
depletion (circles), blue sideband (squares) and red side-
defined [71], and therefore we approximate equation 5
band (diamonds) at microwave power PMW = 25mW. Di-
as a sum of independent Lorentzians for each reso- agonal lines show the predicted quadratic dependencies on
nance [72]. All other parameters within the summation laser power. (b) Microwave power dependencies of the mag-
in equations 6 and 7 are measured or calculated in the nitude of carrier depletion (circles), blue sideband (squares)
same way as in section III A. Thus the only remaining and red sideband (diamonds) at PIN = 50 mW. Solid lines
free parameter is an overall amplitude scaling equivalent show predicted power dependencies from equations 6 and 7.
to the parameter A in equations 6 and 7.
In Fig. 4 we compare the experimentally measured
variation of the carrier and sideband amplitudes with dielectric screening, and any losses in the feedthroughs
laser power (PIN ) and microwave power (PMW ) to that to the cryostation. For a single value of B, a good fit is
predicted by equations 5, 6 and 8. As shown in Fig. 4(a), achieved for all three features. At the maximum input
all four features show a quadratic dependence on PIN power (PMW = 25 mW) and using the fitted value for
in agreement with the model, before deviating at about B, the effective field in the sample (produced by an-
200 mW. The deviation appears to occur at the same tenna A1) was found to be 200 ± 50 V m−1 which gives
value of PIN for all of the features. We attribute this Ω8S8P /Γ8S ≈ 0.3. The value of EMW = 200 V m−1 is in
deviation to effects such as localised heating which are reasonable agreement with the calculated field strength
not included in the model. For microwave power, the inside the sample of 360 V m−1 for antenna A1.
model predicts a linear dependence at low power, which The data in Fig. 4(b) highlights a key feature of
saturates as the power-dependent second term on the the observed emission spectra, which is that there is
denominator of equations 6 and 8 becomes significant a strong asymmetry in the strength of the sidebands.
(i.e. when Ω/Γ ∼ 1). As shown in Fig. 4(b), this pre- As shown in Fig. 5(a) to (c), this asymmetry is depen-
dicted behaviour is in excellent agreement with the ex- dent on the excitation energy E. When the excitation
perimental data. Here we have introduced a free param- energy is resonant with an S exciton (Fig. 5(a)) the
eter B, shared between all three features, which relates blue sideband is larger and when it is resonant with a
the power produced by the microwave generator to the D exciton (Fig. 5(c)) the red sideband is larger. When
effective field at the sample by PIN = B|EMW |2 . This two-photon resonant with a P state (Fig. 5(b)) the side-
parameter accounts for the efficiency of the antenna, the bands are of similar strengths. This observation is a
9

 (a)                  E = E8S                  (b)                     E = E8P                           (c)                       E = E8D
            0.4                                            0.1                                                      0.3

                                                                                                        ΔI (kcps)
                                               ΔI (kcps)
ΔI (kcps)

            0.0                                            0.0                                                      0.0

      0.4                                                  0.1                                            0.3
        -30 -20 -10 0 10 20              30                 -30 -20 -10 0 10                  20   30       -30 -20 -10 0 10                   20   30
                  fE (GHz)                                            fE (GHz)                                        fE (GHz)
    (d)           E8S E8P E8D                                              (e)                      E8S E8P E8D
         0.4
              8S                              blue sideband                                            8S                  9D
                                                                                                              8D    9S
                                              red sideband
                0.3              8D
   ISB (kcps)

                                              9S

                                                                         ΔICAR (kcps)
                        8P                     9D          10S
                0.2                                                                                                 8P                   10S
                                                                 10P
                0.1                                                                                                                 9P
                                              9P
                                                                                                                                             10P
                0.0                                                                     0.3

                                E (eV)                                                                                    E (eV)

  Figure 5. Dependence of sideband and carrier intensities on two-photon excitation energy, E. (a), (b) and (c) show the
  spectrally resolved change in second harmonic intensity due to a microwave field at fMW = 19.0 GHz for three different
  two-photon excitation energies E8S , E8P and E8D respectively. An asymmetry is observed, with the blue sideband larger
  when two-photon resonant with a S state and the red sideband larger when two-photon resonant with a D state. (d)
  Theory curve (solid) from equation 6 and experimental data (points) showing the intensity of the blue and red sidebands at
  microwave frequency fMW = 19 GHz and microwave power PMW = 3 mW as a function of two-photon excitation energy. (e)
  Theory curve (solid) from equation 8 and experimental data (points) showing change in carrier intensity at fMW = 19 GHz
  and PMW = 3 mW as a function of two-photon excitation energy. The shaded background in (d) and (e) is the fit to the
  SHG excitation spectrum in Fig. 2(c) to show the range of exciton states explored. Dashed vertical lines indicate the three
  two-photon excitation energies of the etalon scans in parts (a) to (c).

  direct consequence of the fact that the nearest odd par-              not included in our model for the SHG process. There
  ity state to the state nS state is the nP state at higher             also appear to be additional features in the experimen-
  energy, whereas for the nD state it is at lower energy.               tal data close to the D peaks. One possible explanation
  This strong, energy dependent asymmetry is apparent                   is that we have not included all of the relevant states.
  in equations 6, where it arises from the presence of both             In the theoretical model only D states of Γ+ 5 symmetry
  positive and negative components in the (δn±0 l0 − iΓn0 l0 )          were considered. The Γ+  5 D states are optically active in
  term.                                                                 TPE due to a mixing with the S states via the exchange
     The predicted amplitude of the sidebands as a func-                interaction [73, 74]. However, there are additional D
  tion of two-photon excitation energy, E, is shown in                  states (Γ+1 and Γ3 symmetry) which are not active in
                                                                                           +

  Fig. 5(d) at PMW = 3 mW. The only fit parameter is                    TPE but have been observed in the presence of external
  the amplitude A which is constrained to be the same                   fields [58, 59, 73–76]. Coupling between Rydberg states
  for both the red and blue curves. A similar plot for                  and these additional D states may explain some of the
  the carrier depletion ∆ICAR is shown in Fig. 5(e) (note               discrepancies between theory and experiment. By using
  A is different for the black curve). Overall, the excita-             higher quality samples with less strain and polarization-
  tion energy dependence of both the sideband asymme-                   sensitive measurements, we hope to explore the origin of
  try and the carrier depletion is well described by the                these additional features in future work. We also note
  model across the full range of Rydberg states shown.                  that the model predicts values of E where ∆ICAR > 0
  Given the complexity of the experiment this overall                   which was not observed in the experiment.
  agreement demonstrates that the model provides a solid                   Lastly, we note that the data in Figs. 4 and Figs. 5
  basis for understanding the observed microwave-exciton                was measured at a fixed microwave frequency fMW . The
  coupling. Nevertheless, there are some regions of E                   measured and predicted variation with microwave fre-
  where the agreement is less good. As expected, one                    quency is similar to that observed using one-photon
  of these is in the vicinity of the P states, which were               spectroscopy and is described in Appendix C.
10
IV. DISCUSSION 1.0
0.8
Our experiments demonstrate that Rydberg excitons
couple strongly to microwave electric fields. An “atomic
0.6 1.0 1.0
physics” view of the process, based on electric dipole
I
transitions between excitonic states of opposite par-
0.4 0.9 0.9
ity, provides a convincing explanation of the observed
microwave-optical coupling in both one and two photon 0.8 0.8
experiments. So far, the dominant effect of the crystal 0.2
lattice is the non-radiative broadening of the excitonic - 10 0 10 90 100 110
states due to phononic decay channels, which leads to - 50 0 50 100 150
a broadband microwave frequency response. The final
time (ns)
state for these phononic decay channels is the 1S ex-
citon, which then decays radiatively via a quadrupole
Figure 6. Time dependence of the second harmonic mi-
process. Using two-photon excitation to the Rydberg crowave response compared with turn on and off times of
states we have observed that the microwave field can microwave pulse. Normalised SHG intensity (not spectrally
modify the intensity of photoluminescence from the 1S resolved) as a function of time relative to the microwave
exciton. A detailed study of this effect and its relation pulse trigger. Data taken with E = E8S , fMW = 19.5 GHz
to exciton-phonon coupling is ongoing. Another effect and PMW = 25 mW. The microwave field causes a decrease
of the lattice is the dielectric screening in the mate- in the intensity of the light detected (blue data). The red
rial. The dielectric screening of the material reduces the curve shows the microwave pulse shape as measured on an
exciton binding energy, which leads to a higher dipole oscilloscope. Insets show zoom of the turn on and turn off
moment. However, this effect is cancelled by the dielec- times.
tric screening of the microwave electric field, leading to
similar Rabi frequencies to atomic systems at the same
principal quantum number n. periments could also provide information on the quan-
tum statistics of the generated light, which may be
The one-photon transmission measurements show modified by interactions [50]. We note that the ex-
that the microwave field has a sizeable effect on the tremely high resolution of this microwave/two-photon
optical properties. Even with our inefficient microwave method provides a new tool for studying the physics
antennae, we achieved a coupling parameter Ω/Γ of 0.9. of Rydberg excitons more generally, potentially includ-
Reaching the strong-driving limit (Ω/Γ > 1) should be ing states that are difficult to reach optically, such as
straightforward with improvements to our antenna de- high-lying paraexciton levels [83].
sign, using for example a copper coplanar resonator [77]. Lastly we consider the prospects for a fully quantum
In this limit, we anticipate that the physics will change interface, for example with superconducting quantum
significantly. New effects could include microwave- circuits. Our estimates suggest that in comparison to
induced dipole-dipole interactions [78–80], which could Rydberg atoms, reaching the single-particle strong cou-
potentially be stronger and longer range (∝ R−3 ) [81] pling regime of cavity QED (defined as g 2 /(κΓ)
1,
than the van der Waals interactions so far observed in where g is the microwave vacuum Rabi frequency and κ
Cu2 O (∝ R−6 ). Multi-photon processes, including pos- is the photon loss rate) is difficult due to the large non-
sible ionization, will also play a significant role, and a radiative contribution to Γ. However, a strong collective
new model will be required. As the exciton linewidths enhancement of the coupling can be obtained by excit-
are comparable to the separation between the exciton ing many excitons within the cavity mode, and we be-
states, reaching the strong driving limit also implies a lieve that the collective strong coupling regime [84, 85]
new regime where the Rabi frequency is comparable is within reach. We note also that the large microwave
to the transition frequency between adjacent dipole- bandwidth implies extremely fast switching times -
coupled states [82]. Fig. 6 shows that we achieved nanosecond switching
The SHG measurements clearly demonstrate the times in the SHG, limited only by our microwave gen-
modulation of an optical carrier by the microwave field erator. This is in contrast to atomic systems where
- an important feature of an optical to microwave in- the response is inherently narrowband, and may be
terface. Within the resolution of our experiment (set useful for some applications. In terms of the opti-
by the etalon) this effect appears to be coherent; an cal side, read-out via one-photon spectroscopy suffers
obvious future direction is to perform more detailed from a strong non-resonant phonon background which
measurements of the coherence using e.g. homodyne dominates the absorption. To overcome this, the mi-
detection of the optical beat signal. Together with crowave field could be combined with recent propos-
Hanbury Brown Twiss-type measurements, these ex- als to suppress this background using electromagneti-11
cally induced transparency [86]. For readout via SHG, came clear that the two antennae have radically differ-
the main issue is the low SHG efficiency in a centro- ent frequency responses as shown in Fig. 7. In both
symmetric material and the absence of phase-matching. cases strong resonances were observed at specific fre-
Here significant improvements could be made by us- quencies.
ing external fields such as strain or static electromag- To understand these results, we performed detailed
netic fields to break the symmetry, as well using optical modelling of the microwave field produced inside the
waveguides and resonator structures to maximise the sample using commercial finite-element electromagnetic
local pump intensity. design software. The frequency response of both anten-
nae was found to be strongly modified by the presence
of other metal components in the cryostat, in particular
V. SUMMARY AND CONCLUSION the mounts for the aspheric lenses. The components in-
cluded in the simulations are shown in Fig. 7(b). These
In summary, we have studied the coupling between parasitic couplings were responsible for the strongly res-
Rydberg excitons and microwave electric fields using onant behaviour of antenna A1, and the fine structure
one-photon and two-photon spectroscopy techniques. in the frequency response of antenna A2.
Even with inefficient microwave coupling a significant A comparison of the simulation results with the mi-
effect is observed, and the coherent modulation of an crowave response obtained from the experimental trans-
optical carrier was achieved. In the short term, our work mission spectra is shown in 7(c). The agreement is
provides a new tool for exciting and studying Rydberg very good for antenna A1 (Fig. 7(c)(i)) predicting major
exciton states. We expect to reach the strong driving peaks at 16 and 19 GHz as observed in the experimen-
regime, where this control will extend to many-body tal data. For the stripline antenna A2 (Fig. 7(c)(ii)),
physics and quantum states of light. Looking further agreement is reasonable, with the broad feature at low
ahead, there is the potential to engineer an optical-to- frequency predicted. The simulation does not predict
microwave interface at the quantum level, with poten- the fine structure present in the data. However, the de-
tial applications in quantum computing. tails of the simulated result are sensitive to the exact
The data presented in this paper is available for locations and sizes of all components inside the cryostat,
download at doi:10.15128/r13x816m66s. and we believe the level of the agreement is reasonable
considering the limitations of the CAD model used to
construct the simulations.
ACKNOWLEDGMENTS The simulation also showed that measurements of the
frequency dependence of the transmitted and reflected
microwave power (S parameters) were not directly cor-
The authors are grateful to Ian Chaplin and Sophie
related to the local electric field strength with in the
Edwards (Durham University, Department of Earth
sample, due to the strong coupling with the electro-
Sciences) for the slicing and polishing of the samples
magnetic environment. As a result we were unable to
used in this work. The authors would like to thank
independently determine the local electric field strength
Ifan Hughes and Robert Potvliege for fruitful discus-
from experiment. In light of the agreement observed in
sions. This work was supported by the Engineering and
Fig. 7 we consider that the simulations are a useful tool
Physical Sciences Research Council (EPSRC), United
to estimate the local electric field strength at the sam-
Kingdom, through research grants EP/P011470/1 and
ple.
EP/P012000/1. The authors also acknowledge seedcorn
funding from Durham University. LAPG acknowledges
financial support from the UK Defence and Scientific
Technology Laboratory via an EPSRC Industrial Case Appendix B: Exciton-polariton model of
award. VW acknowledges support by the NSF through microwave-optical coupling
a grant for the Institute for Theoretical Atomic, Molec-
ular and Optical Physics at Harvard University and the Here we provide a detailed derivation of the ex-
Smithsonian Astrophysical Observatory. pressions for the susceptibilities and intensities in sec-
tion III. Our model is based on the exciton-polariton
model of light-matter coupling. Bosonic operators
Appendix A: Frequency response of the microwave X̂nl describe the annihilation of excitons with quan-
antennae tum numbers n and l (denoted S,P,D etc). The
light fields are represented by classical amplitudes
Both antennae (A1 and A2) used in this work were EIN , EOUT , EMW , ESB , ESHG , for the laser-input and out-
conceived as broadband near-field devices. From one- put, microwave-, sideband-, and SHG-fields, respec-
photon transmission spectroscopy measurements it be- tively.12
(a) (i) A1 (b) (i) (c) (i)
ΔαL
|EMW|2 (V2/mm2)
|EMW|2
ΔαL
s
fMW (GHz)
(ii) (ii) (ii)
A2
ΔαL
|EMW|2 (V2/mm2)
|EMW|2
ΔαL
fMW (GHz)
Figure 7. Microwave frequency dependence of antennae. (a) Renderings of antenna A1 (i) and A2 (ii). (b) Rendering of
components included in microwave field simulations of antenna A1 (i) and A2 (ii). The antenna is positioned in the centre
between two stainless steel lens tubes (translucent grey) and support by a copper mounting plate (yellow). (c) Measured
microwave frequency dependence of the change in absorption at excitation energy E = E9D (dashed red, left axis), and the
corresponding variation of the modulus squared of the simulated microwave field strength inside the sample (solid orange,
right axis) for antenna A1 (i) and A2 (ii).
1. Single-photon absorption Herein g VB→nP is the coupling rate between valence
band and P-exciton of principle quantum number n, and
We begin by approximating the incident light field is connected to the dipole coupling strength, DVB→nP ,
(here produced by an LED) as a monochromatic field defined in the main text. We will analyze the relation
with well-defined energy E and field strength EIN . after solving this equation.
(we note for absorption experiments performed with a To calculate the field propagation inside the medium
laser [29] this would be exact). A dipole-active yellow and obtain its response, we apply the slowly-varying
amplitude approximation [89], and focus on the steady
P-exciton, described by X̂nP and of resonance energy
state, as all fields are CW. This connects the change
E + ~δnP , is excited and decays with rate ΓnP . De-
of the field amplitude to the medium emitters, i.e.
tailed analysis of the phonon-induced couplings to the
the excitons, or in classical electrodynamics terms, the
excitons and their decay channels implies
√ Fano-type res- medium polarization. The equations can be derived in
onance lines [87] on top of a broad E- shaped back-
the form
ground [64, 88]. Here we neglect the asymmetry of
the Fano lineshape and assume a symmetric Lorentzian. c
∂z EOUT = −ig nP→VB hX̂nP i. (B2)
The background absorption gains its oscillator strength η
from the 1S exciton. Electric dipole transitions from
this state are in the mid-infrared; therefore as we ob- Note that in the simple case of dipole input and out-
serve in experiment the background is unaffected by the put g nP→VB = (g VB→nP )∗ . Solving for the steady-state
far off-resonant microwave field. Therefore the back- polarization and inserting it into the solution for the
ground cancels exactly in ∆T and need not be included output field, we obtain
here.
c |g nP→VB |2
Under these conditions the equation for the operator ∂z EOUT = − EIN . (B3)
X̂nP is given by η iδnP + ΓnP
To understand the connection between this result and
˙
X̂nP = −(iδnP + ΓnP )X̂nP − ig VB→nP EIN . (B1) Eq. (1) in the main text, we first clarify that the rate13
g VB→nP effectively describes a Rabi frequency and thus we arrive at an effective Hamiltonian
the physical field amplitude Ephys is normalized outside †
X
of this rate, Ephys = E0 EIN/OUT . The normalization Ĥ/~ =δS X̂nS X̂nS + ∆α X̂α† X̂α
term E0 is included in the coupling rate and can be Xh
α
taken as the coupling between elementary field excita- + g VB→α
(EIN X̂α† + EIN
∗
X̂α )
tions (photons, even if we view the fields as classical) α
and the full fields. Its value can be found in any quan- †
+ (g α→nS X̂nS ∗
EIN X̂α + g nS→α EIN X̂α† X̂nS )
tum optics text book [90] and reads as i
† ∗
+ q nS→VB X̂nS ESHG + q VB→nS X̂nS ESHG ) .
(B7)
r
~ωIN
E0 = , (B4)
2ε0 εb V
Here we define the S-exciton resonance frequency ωnS =
δS + E/~; likewise ωα = ∆α + E/(2~) for the interme-
with εb being the background permittivity and V the
diate states. We note that the detuning from the inter-
mode volume. Applying the basic formula for the Rabi
mediate states ∆α is much larger than any other system
frequency g = dE0 /~ and the notion that the dipole
parameter (coupling strengths, linewidths).
strength in the main text is per volume, we arrive at
This effective Hamiltonian (B7) is unitary, and there-
ωIN fore treats both SHG and its time-reversed process
|g nP→VB |2 = |DnP→VB |2 . (B5) on an equal footing. However, in practice weak ex-
2ε0 ~η 2 citation of the SHG light, dissipation, and necessary
phase matching suppress the reverse process substan-
Here η is the (real) non-resonant background refractive tially. In (B7), the different internal momenta at E and
index of Cu2 O. The resulting formula for the spatial E/2 lead to a reduction of g nS→α compared to g α→nS .
change in the field amplitude is the well-known case of The process q VB→nS X̂nS †
ESHG , where the SHG light cre-
quasi resonant absorption [91] and reads ates an exciton via quadrupole absorption, is also much
less likely than the dominant two-photon excitation pro-
c ωIN |DnP→VB |2 cess. Therefore the time-reversed terms are suppressed,
∂z EOUT = − EIN †
η 2ε0 ~η 2 (iδnP + ΓnP ) (B6) yielding different equations for X̂nS and X̂nS . To en-
(1) sure conservation of energy (i.e. a stationary in flow
=iωIN χnP EIN .
and outflow of photons) we ensure that these operators
are appropriately normalised.
The resulting equations of motion for the two anni-
2. SHG without Microwave hilation operators and one creation operator are
˙
X̂α = − (i∆α + Γα )X̂α − ig VB→α EIN (B8)
Let us now move on to the SHG process without turn- ˙ X
ing on the microwave. In SHG, the input laser is at X̂nS = − (iδS + ΓnS )X̂nS − i g α→nS EIN X̂α (B9)
half the excitation energy ωIN = E/(2~), and as a re- α
sult it couples off-resonantly to all dipole allowed states. ˙†
X̂nS †
=(iδS − ΓnS )X̂nS ∗
+ iq nS→g ESHG . (B10)
The dominant contribution are from S excitons states
belonging to the “blue” series [64, 92] and to a smaller The fast motion of the off-resonant intermediate exci-
degree the yellow P-excitons. These intermediate states tons allows us to eliminate them adiabatically (setting
are described by operators X̂α , α being a general index ˙
X̂α = 0) and insert the solution into the equation for
for all these states. These states are then coupled to the S-exciton
the target yellow S- or D-exciton states via a second
electric dipole transition. To begin with we consider ˙ X g VB→α g α→nS E 2
X̂nS = −(iδS +ΓnS )X̂nS − IN
. (B11)
only a single final S exciton state, with associated op- i∆ α + Γ α
α
erator by X̂nS . The coupling constants of the first and
second process with intermediate exciton X̂α are desig- Due to |∆α |
Γα , we see that these sums are basi-
nated g VB→α and g α→nS , respectively. The S-exciton cally imaginary, allowing us to define an SHG driving
emits light via quadrupole emission with rate q nS→VB . strength mVB→nS :
This rate is analogue to the dipole coupling rates g and
˙
hence connects to the quadrupole moment QnS→VB in 2
X̂nS = − (iδS + ΓnS ) X̂nS + imVB→nS EIN , (B12)
the same way as for the dipolar counter part in Eq. (B5). X g VB→α g α→nS
Splitting off the laser energy ωIN from the kinetic energy mVB→nS = . (B13)
∆α
(2ωIN for the S-exciton as it is excited via 2 photons), αYou can also read