The nuclear import of the transcription factor MyoD is reduced in mesenchymal stem cells grown in a 3D micro engineered niche - Nature
←
→
Page content transcription
If your browser does not render page correctly, please read the page content below
www.nature.com/scientificreports
OPEN The nuclear import
of the transcription factor MyoD
is reduced in mesenchymal
stem cells grown in a 3D
micro‑engineered niche
Emanuela Jacchetti1,6*, Ramin Nasehi1,6, Lucia Boeri1, Valentina Parodi1, Alessandro Negro2,
Diego Albani3, Roberto Osellame4,5, Giulio Cerullo5, Jose Felix Rodriguez Matas1 &
Manuela Teresa Raimondi1
Smart biomaterials are increasingly being used to control stem cell fate in vitro by the recapitulation
of the native niche microenvironment. By integrating experimental measurements with numerical
models, we show that in mesenchymal stem cells grown inside a 3D synthetic niche both nuclear
transport of a myogenic factor and the passive nuclear diffusion of a smaller inert protein are
reduced. Our results also suggest that cell morphology modulates nuclear proteins import through
a partition of the nuclear envelope surface, which is a thin but extremely permeable annular portion
in cells cultured on 2D substrates. Therefore, our results support the hypothesis that in stem cell
differentiation, the nuclear import of gene-regulating transcription factors is controlled by a strain-
dependent nuclear envelope permeability, probably related to the reorganization of stretch-activated
nuclear pore complexes.
In the last 2 decades, stem cells have generated a considerable interest in biomedicine with many potential appli-
cations such as regenerative and personalized medicine. Mesenchymal stem cells (MSCs) are the most commonly
studied due to their ready isolation for autologous use, extensive in vitro expansion capability and the ability to
be differentiated into a wide number of tissue-specific l ineages1.
However, efficient culture systems that allow the large-scale expansion of MSCs while maintaining control
of their function are still lacking. Today, much is known about the effect of chemical signals on the activation of
cellular biochemical processes. Several studies have shown that also physical signals from the cellular environ-
ment, such as substrate s tiffness2, topography3 and dynamic mechanical s timuli4, can influence gene regulation
and, therefore, cell fate decisions2–5. In physiological environments, cells transmit forces from the focal adhesions
at their periphery to the nucleus via the actin cytoskeleton, where the nucleus acts as a mechanosensor affecting
chromatin organization and gene e xpression6.
While the effect of cytoskeletal deformation on cell fate has been extensively characterised, only recent
research has focused on the effects of cell nuclear deformation7. For example, it is now accepted that there are
mechanosensitive ion channels on the nuclear membrane, which, coupled to the mechanosensitive cytoskel-
eton, promote ion influx and associated gene t ranscription8. Other structures that may link cellular function to
nuclear plasticity/deformation are being searched for9–13. Current methods to investigate the cell nucleus as a
mechanosensor aim to control nuclear deformation, for example by micropipette aspiration, nanoindentation
and microfluidic fl ow10,14,15. Other techniques control cell adhesion on novel materials, either by modifying the
material’s stiffness or by patterning the substrate with engineered micro/nanoscale features such as pits, protru-
sions, channels, and p illars16,17. However, these substrates do not surround the cells but stand as an underlying
1
Department of Chemistry, Materials and Chemical Engineering “Giulio Natta”, Politecnico di Milano, Milan,
Italy. 2Department of Biomedical Sciences, University of Padua, Padua, Italy. 3Department of Neuroscience,
Istituto di Ricerche Farmacologiche Mario Negri IRCCS, Milan, Italy. 4Institute for Photonics and Nanotechnologies
– CNR, Milan, Italy. 5Physics Department, Politecnico Di Milano, Milan, Italy. 6These authors contributed equally:
Emanuela Jacchetti and Ramin Nasehi. *email: emanuela.jacchetti@polimi.it
Scientific Reports | (2021) 11:3021 | https://doi.org/10.1038/s41598-021-81920-2 1
Vol.:(0123456789)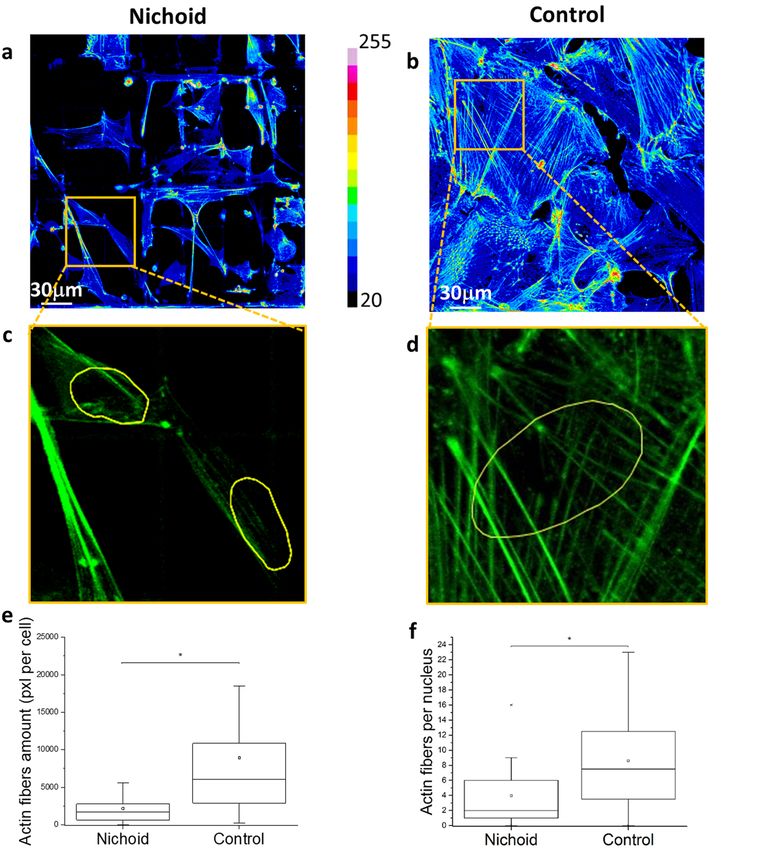
www.nature.com/scientificreports/
support; thus, they are not fully able to mimic the architectural cue that regulates the fate of stem cells in situ,
i.e. their three-dimensional (3D) spatial o rganisation18.
The innovative approach of our study is to use a scaffold enabling the cells to self-organize into a three-dimen-
sional configuration allowing a more realistic study of the nuclear import flows than in any 2D cell adhesion
configuration. This scaffold is a micro-fabricated substrate, produced by two-photon polymerization technique
of a biocompatible, inert and mechanically stable p hotoresin19. Thanks to this optical lithographic technique, it
is possible to create three-dimensional scaffolds with a resolution up to 100 nm. In our case, the scaffolds (30 μm
high and 450 μm × 450 μm in transverse dimensions) are lattice of interconnected lines forming pores of gradu-
ated size, spaced between 10 and 30 μm transversely and with a uniform spacing of 15 μm vertically. From now,
in this paper, these substrates will be called “Nichoid” for convenience.
Despite today, as demonstrated from the research of Discher and Engler g roups2, it is well known that sub-
strate stiffness correlates with stem cell fate, another factor influencing cellular functionality is the architecture of
the surrounding environment. Bao et al., for example, demonstrated that substrate architecture plays an impor-
tant role in generating specific cell adhesion configuration and in remodelling actin cytoskeletal organization or
the shape of the cell n ucleus20. Another example is the Nichoid, which is able to modulate cell morphology and
gene activation in several types of cells, based on purely architectural c ues19,21,22. In this paper, our modelling
approach, based on experimental results, aims at providing a mechanistic interpretation of nucleocytoplasmic
protein transport and protein localization. Our interesting findings are that in MSCs grown inside the Nichoid,
a transcriptional activator of myogenesis fused with a GFP (MyoD-GFP) is retained in the cytoplasm and that its
nuclear import flow is reduced. In addition, this reduction occurs also for GFP proteins that translocate into the
cell nucleus by passive diffusion. Finally, our results suggest that cell morphology modulates the protein nuclear
import through a partition of the nuclear envelope (NE) surface.
Results
Spatial organization of focal adhesions (FA) and actin filaments in MSCs adhering to the
Nichoid artificial niche. The Nichoid is a miniaturised scaffold made of repeated units consisting of a 3D
grid with micrometric pores surrounded by vertical walls (Fig. 1a,b1,b2). Immunofluorescence images show the
cell morphology and cellular architecture of MSCs grown in the Nichoid with respect to cells grown on glass
flat substrate, which we consider as the experimental 2D control (Control). Figure 1c,d presents z-projections of
immunofluorescence acquisitions showing the cell nuclei (blue), actin filaments (green) and vinculin (red). As
shown in Fig. 1c, the cytoskeletal organization of MSCs in the Nichoid prevails at the cell edge, with the forma-
tion of focal adhesions, where they attach to the substrate. Instead, in spread MSCs grown on the bi-dimensional
control (Fig. 1d), the cytoskeleton is highly organized, with several sharp filaments arranged into the cytosol.
Mature FAs are displaced at the edge of the cells and smaller FAs are visible at the bottom of the plasmatic mem-
brane, around the nuclei.
Western blot analysis of the FAs (Fig. 1e) reveals that cells produced a significantly higher level of vinculin
protein in the 2D-Control. Full length gels images are shown in Supplementary Fig. 1a,b. Fluorescence micros-
copy images show that these proteins are used to form visible clusters of large and mature FAs (Fig. 1d). In the
Nichoid instead there are less FAs, whose length does not exceed 2 µm, which is precisely the transverse size
of the trusses section forming the structure of the Nichoid (Fig. 1f–h). The formation of FAs is related to the
force transmitted from the environment to the cell nucleus via actin filaments. In the Nichoid the cytoskeleton
is composed of a cortical actin network, whereas long and thick actin filaments are mostly present in the Con-
trol, where cells assume a flattened and very thin “spread” shape with respect to cells adhering to the Nichoid,
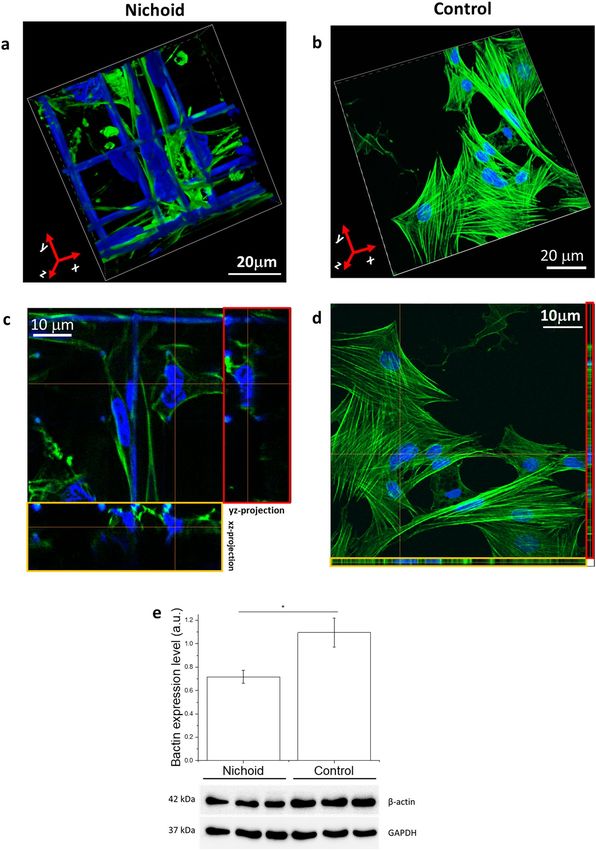
which are arranged in a fully 3D spatial configuration. Figure 2a,b report a 3D reconstruction of the nucleus
and the cytoskeleton of MSCs grown in the Nichoid and on 2D-Controls, respectively. To better visualize actin
organization, we report the orthogonal (yellow ROIs) and sagittal (red ROIs) projection of MSCs grown into the
Nichoid (Fig. 2c) and on Control (Fig. 2d). All these figures effectively show that within the cells grown in 3D
there are very few actin filaments and that they are spaced from the cell nucleus with respect to the cells grown
in the control. To quantify the expression level of actin proteins we used western blot technique. Full length gels
images are shown in Supplementary Fig. 1c,d. Figure 2e confirms the idea that cell production of actin proteins
is significantly reduced in cells grown in the Nichoid compared to the 2D Control. To identify thick stress fib-
ers, we produce z-projection images of actin cytoskeleton. Figure 3a,b show a color map of actin cytoskeleton
intensity: the thicker are the actin fibers, the brighter is the fluorescence emission from the Phalloidin–FITC
dye. These images qualitatively suggest the location where the force exerted by cytoskeleton fibers can be more
intense: in the Nichoid, there are bright bundles of actin only at the cortical actin level. Figure 3c,d are zooms of
the previous images, to better visualize the actin fibers organization around the cell nucleus: from the images it
is observable that in the case of the Nichoid, very few actin fibers are present in a neighborhood of the nucleus.
Finally, Fig. 3e,f show the actin fiber amount, which is known to correlate with force transmission2–6,20 (compres-
sion or pushing) to the cell nucleus. These results suggest that the nucleus in spread cells is subjected to a greater
stress and may therefore become more deformed than in cells grown in the Nichoid.
Spatial organization of cell morphology within the Nichoid artificial niche. To evaluate if actin
organization affects cell morphology, we stained the cell cytosol and the cell nucleus with two permeant and
viable cell fluorescent dyes and performed z-stack acquisition with a confocal microscope. Parameters such as
semi-axes, volume and distance of mass centres were used to characterize the shapes of the cell and the nucleus.
Images suggest that the nucleus can be very well described and represented by an ellipsoid in both cell configura-
tions: for MSCs grown in the Nichoid, it is a prolate spheroid, whereas the ellipsoid is tri-axial and very elongated
in the xy-plane for the Control. On the other hand, in both conditions (the Nichoid and the Control) the cells
Scientific Reports | (2021) 11:3021 | https://doi.org/10.1038/s41598-021-81920-2 2
Vol:.(1234567890)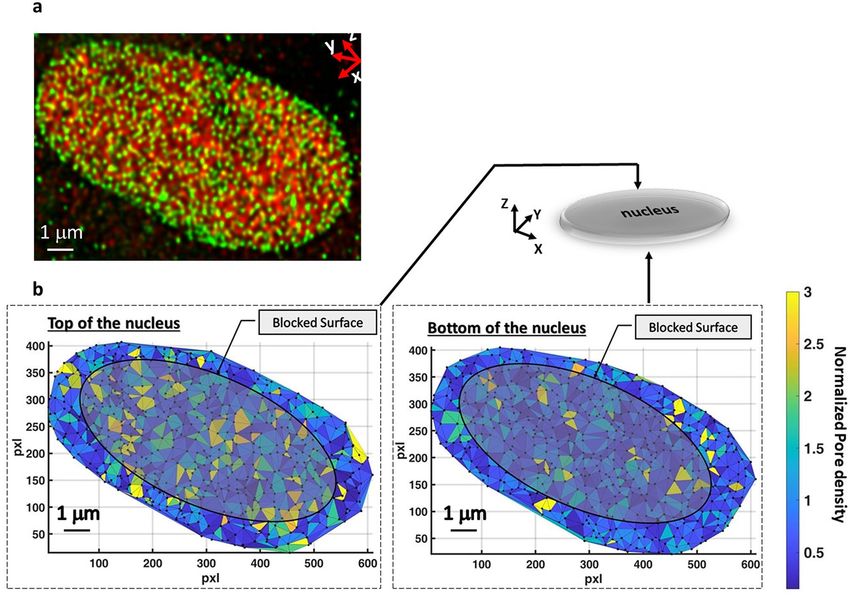
www.nature.com/scientificreports/
Figure 1. Spatial organization of focal adhesions in MSC adhering to the Nichoid artificial niche. (a, b) SEM
images of the Nichoid microstructured module cell scaffold and schematic representation of the samples
produced (b): b1 glass bottom Nunc Lab-Tek-8-chamber wells and (b2) 1.2 cm diameter glass culture coverslip.
The software used to create the image b1 and b2 are Microsoft PowerPoint 2018 (https://products.office.com/
it-it/powerpoint) and SolidWorks Education Edition 2020 (https://www.solidworks.it/sw/education/mecha
nical-engineering-student-software.htm). (c, d) Immunostaining of nuclei (blue), actin (green) and vinculin
(red) in cell grown into the Nichoid (c) and on glass flat substrate (d). (e) Vinculin expression level calculated
by western blot technique: actin production is reduced in cells grown into the Nichoid. (f) Number of focal
adhesions per cell. Spread cells present a high number of traction forces sites respect to the cells grown into
the Nichoid. (g) Focal adhesion area. The Control shows the presence of big focal adhesions respect to the cell
into the Nichoid. (h) Focal adhesions length. The Control presents a big number of mature focal adhesions
(2 µm < length < 20 µm). Graphs statistics: Mann–Whitney test. *Correspond to p < 0.05.
Scientific Reports | (2021) 11:3021 | https://doi.org/10.1038/s41598-021-81920-2 3
Vol.:(0123456789)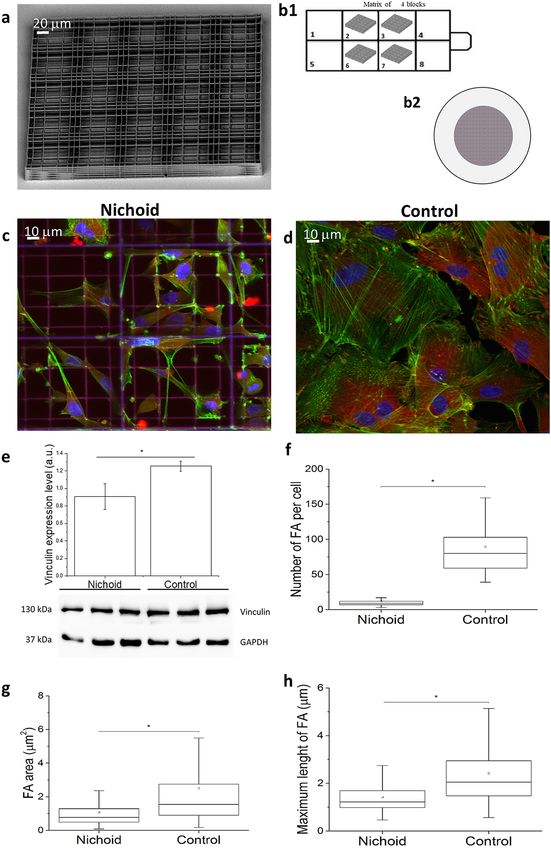
www.nature.com/scientificreports/

                                            Figure 2.  Spatial organization of actin filaments in MSCs adhering to the Nichoid artificial niche. (a,b) 3D
                                            reconstruction from confocal acquisitions of cells grown into the Nichoid (a) and on the Control (b). In green
                                            are identified actin fibers and in blue the cell nuclei. The SZ2080 photopolymer, used to fabricate the niche, is
                                            fluorescent at all excitation wavelengths, including at 405 nm that is the excitation wavelength of the fluorescent
                                            dye used to label the nuclear DNA. (c,d) Orthogonal (yellow ROIs) and sagittal (red ROIs) projections of MSCs
                                            grown into the Nichoid (c) and on a flat control substrate (d). (e) Actin expression level calculated by western
                                            blot. Statistics: Mann–Whitney test. *Corresponds to p < 0.05.

          Scientific Reports |   (2021) 11:3021 |                https://doi.org/10.1038/s41598-021-81920-2                                                   4

Vol:.(1234567890)
www.nature.com/scientificreports/

                                  Figure 3.  Spatial organization of actin filaments in MSCs adhering to the Nichoid artificial niche. (a,b)
                                  Representation of the actin fiber distribution in MSCs by using the pixel intensity color scale. (c,d)
                                  Representative images of actin fibers adjacent to the cell nuclei (represented by the yellow ROI). (e,f)
                                  Quantification of the number of actin fibers per cells and the number of actin fibers. Graphs (e) and (f) statistics:
                                  Mann–Whitney test. *Corresponds to p < 0.05.

                                  present a star-like shape, which is very difficult to reconstruct in a computational model. Therefore, it was chosen
                                  to represent the cellular cytosol with an ellipsoid with volume equal to the average cellular volume. Experimental
                                  data of the three ellipsoid semi-axes are reported in Fig. 4a,b. Figure 4c,d reports the nuclear volume (that is the
                                  same for cells grown into the Nichoid and on the Control) and the ratio between the nuclear and the cellular
                                  semi-axes. These data confirm the observation that the nuclear shape of cells grown on Control is a very thin
                                  disk, whereas cells grown into the Nichoid are roundish, like a prolate ellipsoid. To assess if the nuclear morphol-
                                  ogy of spread cells is due to the tension of actin cytoskeleton, we inhibited actin polymerization and disrupted

Scientific Reports |   (2021) 11:3021 |                https://doi.org/10.1038/s41598-021-81920-2                                                    5

                                                                                                                                                Vol.:(0123456789)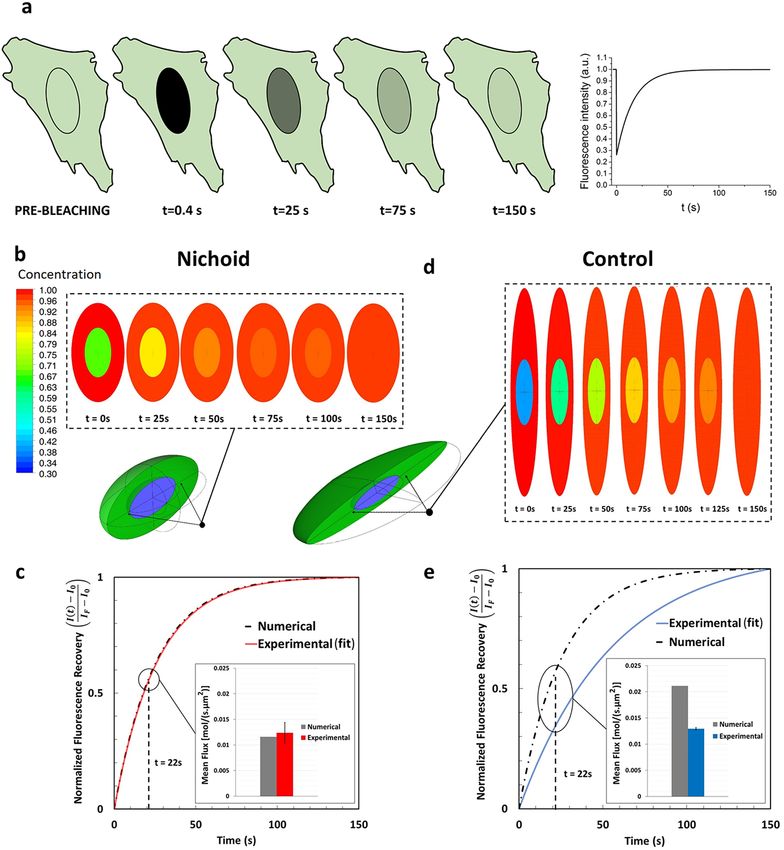
www.nature.com/scientificreports/
Figure 4. Spatial organization of cell morphology within the Nichoid artificial niche. (a) Nuclear semiaxes
length calculated by fitting the xy, xz projection of the nuclei with an ellipse. The lengths show that the nucleus
of MSCs grown into the Nichoid is modeled with a prolate ellipsoid and that the cells grown on the Control are
scalene ellipsoid. (b) Cellular semiaxes length calculated inscribing the cell with an ellipsoid. The graph shows
that the Control cells are very thin and elongate. (c) Nuclear volume calculates as sum of the image’s voxel. (d)
Ratio of the cell semiaxis length divided by the nuclear semiaxis length. The graph shows that on the control
the cell and the nuclear thickness are equal. (e, f) 3D reconstruction of nuclei (blue) of MSCs grown in the
3D-Nichoid and on the 2D-Control and semi-axes data used for the computational modelling. The software
used to create the images is Ansys 2019 R2 (www.ansys.com). Graphs (a) and (b) statistics: Kruskal–Wallis
multicomparison test. Graphs c and d statistics: Mann–Whitney test. *Corresponds to p < 0.05.
cytoskeleton organization by using the Cytochalasin-D drug. Our results confirm that the nuclear shape is gov-
erned by forces associated with actin cytoskeleton organization because its depolymerization makes the nucleus
roundish (Supplementary Fig. 2a). In the Nichoid, the cells occupy the pores of the structure, with anchoring
Scientific Reports | (2021) 11:3021 | https://doi.org/10.1038/s41598-021-81920-2 6
Vol:.(1234567890)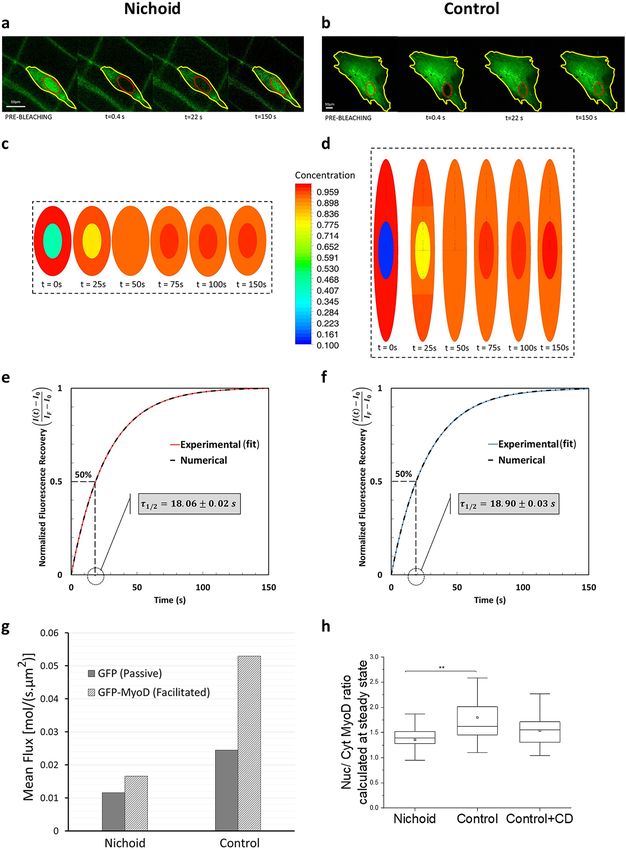
www.nature.com/scientificreports/
points often coinciding with the vertices where there is more material. Figure 4d and Supplementary Fig. 2b
show the ratio between the semi-axes of the cell and nucleus to highlight the amount of cytoplasm surrounding
the nucleus of MSCs grown in the Nichoid scaffold, whereas the nuclear volume to surface ratio, of which has
not been observed significant differences, is reported in Supplementary Fig. 2c. In both cellular configurations,
the nuclear volume and the surface are calculated as described in “Materials and Methods”.
Finally, to understand how the organization of the cell cytoskeleton affects cell morphology, the distance
between the center of mass of the whole cell and its nucleus was calculated. As shown in Supplementary Fig. 2d,e,
while the 3D structure does not significantly affect the relative position between the whole cell and its nucleus
in the cell equatorial plane, along the z direction the Nichoid allows a higher mobility of the cell nucleus. To
conclude the paragraph, the representation of the cell shape and rounded values of the semiaxes length used in
the computational model are reported in Fig. 4e,f.
Nucleo‑cytoplasmic fluxes of proteins inside the Nichoid artificial niche. Fluorescence recovery
after photobleaching (FRAP) experiments were used to evaluate the GFP and the MyoD-GFP nucleocytoplasmic
translocation. A representative scheme of FRAP technique is shown in Fig. 5a. To characterize the processes and
to evaluate the amount of protein involved, the half-time of the recovery and the protein fluxes were calculated.
The results are summarized in Figs. 5, 6 and 7. The temporal profile of the recovery curve describes the kinetics
of the process, from which we can calculate the flux of proteins that cross the NE using Eq. (6). To study the
passive diffusion across the nuclear pore complexes (NPCs), we used the inert fluorescent protein GFP with
molecular weight 27 kDa, which is far lower than the threshold known for facilitated t ransport23,24. Raw data are
shown in Supplementary Fig. 2a. Figure 5, instead, reports the fitting of the experimental results. To compare the
results of our numerical model with those obtained from FRAP experiments, the idealized geometries of cells
in the two conditions, Nichoid and Control, were generated (Fig. 4e,f). In our model, the NE is considered as a
membrane with a non-uniform pre-defined permeability; the value of the permeability can be assigned to the
NE membrane through the model setup. Figure 5b represents time-dependent contour plots of concentration
within the cell in the xz-plane obtained from the numerical simulation for cells grown in the Nichoid, in which
the numerical results match the experimental data. In fact, the corresponding recovery curve of GFP in the
nucleus is plotted in Fig. 5d and compared with the fit of experimental results, showing an excellent agreement.
The figure also shows a comparison of the average flux of GFPs at 22 s after bleaching, highlighting that the two
results are similar. Instead, Fig. 5c shows calculated time-dependent contour plots of concentration for cells
grown on the Control using the same value of nuclear permeability as the cells in the Nichoid and Fig. 5e com-
pares the recovery curve predicted by simulation with the fit of the experimentally measured curve: in this case,
the numerical simulation predicts a higher flux and faster recovery than that measured by FRAP. It is therefore
mandatory to modify the simulation model to fit experimental data.
This inconsistency can be explained by the fact that NPC contributes to GFP translocation if two conditions
are met: first, the pore complex is open, and second, the resident GFP in the cytoplasm has access to the inlet of
the pore complex. The 3D reconstruction of MSCs grown in the Nichoid and on the Control (Fig. 2) together
with the morphological MSCs analysis (Fig. 4) suggest a different accessibility of the GFP to NPCs due to the cell
morphology. This is supported by the resliced of the z-stack acquisition along the xz-plane (Fig. 6a,b) where there
is a noticeable difference in the cytoplasm shape and actin organization around the cell nucleus. The cytoplasm
occupies all the space around the nucleus of the cell located in the Nichoid. On the other hand, in MSCs grown
on the Control, the plasma membrane and the nucleus of the cell are at an extremely limited distance, less than
our microscope resolution, suggesting a limited transport of any molecule. Further experimental confirmations,
for instance by super resolution microscopy together with molecular dynamic simulation, are required to provide
important insights into this observation. However, to support our hypothesis, we show in Fig. 6c a collection
of explanatory images. In fact, the recovery of fluorescence in the nuclear slice is more uniform in the Nichoid
than in the Control, where a fluorescence gradient towards the center of the nucleus is clearly visible (see Fig. 6c,
bottom pannel). These results suggest on the one hand that, fluorescence recovery starts at the nuclear periphery
and gradually diffuses towards the nuclear centrum. On the other, they support the hypothesis of a larger exposed
surface of the nuclear envelop to the cytoplasm in the Nichoid as compared to the Control, that will favor a much
more uniform fluorescence recovery in the first case.
Hence, we continue with our conjecture to prove that our hypothesis is plausible. In fact, considering the
homogeneity of both nuclear pores distribution and the density of fluorescent protein, the extremely small por-
tion of volume available for protein diffusion, that the diffusion in the cytoplasm is much faster than nucleocyto-
plasmic transport (and therefore the second is a disadvantaged process), then protein transport can be neglected.
Hence, we suggest that in the Control, not all the surface of the NE contributes with the same effectiveness to the
transport of the GFP. In order to account for these observations, in our numerical simulation for flattened cells,
we divided the nuclear surface in two parts: i) the first through which effective transport occurs, and ii) a second
one in which transport is prevented (Fig. 6d). Therefore, our approach toward addressing this observation is to
use the numerical simulation to calculate the fraction of the nuclear envelope that should be blocked in order
to reproduce the experimental results obtained by FRAP technique recovery curve. The procedure to calculate
the blocked surface was as follow: in Fig. 5e the numerical recovery curve corresponding to the case in which
the entire surface of the NE is considered permeable for the transport is presented. In this case, the numerical
results do not match the experiments. Then, we systematically decreased the permeable portion of the NE and
compared the recovery curve from numerical simulation with the experimental one. The final result is presented
in the Fig. 6e: it shows the same experimental data of the Fig. 5e, but the numerical recovery curve has changed
due to the reduction of the effective surface in transport of the GFPs. The calculated effective surface results in a
46% of the total NE surface. Here, our first conclusion is that, for the cells grown on the stiff and flat substrate, a
Scientific Reports | (2021) 11:3021 | https://doi.org/10.1038/s41598-021-81920-2 7
Vol.:(0123456789)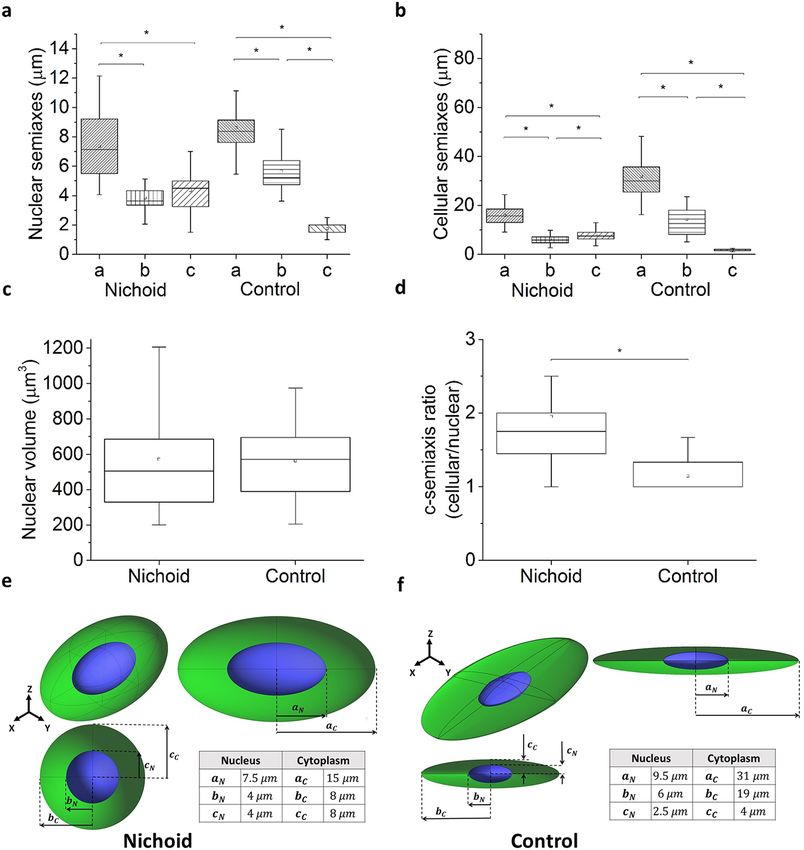
www.nature.com/scientificreports/
Figure 5. Passive Nucleo-cytoplasmic protein fluxes of proteins within the Nichoid artificial niche. (a)
Representative sketch of FRAP experiment to study fluorescent protein translocation into the cell nucleus and
a representative plot of the fluorescence intensity recovery curve. The software used to create the images are
Microsoft PowerPoint 2018 (https://products.office.com/it-it/powerpoint) and OriginPro 2019 (https://www.
originlab.com/origin). (b) Contour map of GFP concentration on xz-plane at different time points for cells
grown into the Nichoid (from numerical simulation). The software used to create the images is Ansys 2019
R2 (www.ansys.com) (c) Comparison of recovery curves and mean fluxes at 22 s after photobleaching for cells
grown in the Nichoid: numerical simulation (black dotted curve), FRAP experiments (red curve). (d) Contour
map of GFP concentration on xz-plane at different time points for cell on Control cells (from numerical
simulation). The software used to create the images is Ansys 2019 R2 (www.ansys.com) (e) Comparison
of recovery curves and mean fluxes at 22 s after photobleaching for cells grown on a flat control substrate:
numerical simulation (black dot), FRAP experiments (blue). The vertical axis of the graphs (d) and (e) shows
the normalized fluorescence intensity for FRAP and normalized concentration for the numerical simulation.
Scientific Reports | (2021) 11:3021 | https://doi.org/10.1038/s41598-021-81920-2 8
Vol:.(1234567890)www.nature.com/scientificreports/
significant portion of the NE has a negligible contribution to the nucleo-cytoplasmic transport. Obviously, the
correction of the nuclear effective surface depends on the substrate physico-chemical properties and, therefore,
it must be recalculated according to the cell morphology.
The combination of the fact that the transport occurs along less than half of the nuclear surface, with the
transport kinetics that has been found slightly slower (�t1/2 ≈ 33 s) on MSCs grown on Control with respect
to the cells into the Nichoid, suggests that the pores available for transport are more open. The conjecture is
confirmed by the flux calculated, using Eq. (6), at 22 s after photobleaching: it indicates that the GFP influx in
spread cells is 2.1-fold higher than the flux in MSCs grown in the Nichoid (inset of Fig. 6e).
To understand the effect of cell morphology on the rate of facilitated transport of large proteins, we studied
the transport of GFP-MyoD, a transcription factor (fused with a GFP) implicated in the differentiation towards
myogenic lineage. The total molecular weight of MYOD-GFP is around 62 kDa; it is big enough to require
facilitated transport. Moreover, MyoD is known to possess the nuclear localization signal (NLS) domain that
guides the facilitated transport process.
A representative nuclear fluorescence recovery, corresponding to the import of the GFP-MyoD during the
FRAP experiment, is shown in Fig. 7a, b for cells grown in the Nichoid and on the Control, respectively. The
fluorescence recovery starts after the photo-bleaching, slows down over time, and ends when a certain ratio of
nucleus-to-cell concentration of GFP-MyoD is achieved. (Raw data of the fluorescence recovery are reported
in Supplementary Fig. 3a,b). Instead, Fig. 7c,d show the protein concentration results obtained by the simula-
tion. For the Control cells, we considered the effective nuclear surface used to reproduce the FRAP experiments
with the GFP and, for the cells in the Nichoid, the entire nuclear surface. Using these parameters, we found the
corresponding permeability that enabled us to well represent the experimental FRAP curve with the numerical
simulation for both cases, cells in the Nichoid and on the Control substrate (Fig. 7e,f). The figures show that the
half-time recovery for both configurations in the case of the facilitated transport is quite similar (t1/2 ≈ 18 s).
This contrasts with the kinetics of passive transport, as shown in Fig. 5d,e, and it highlights the fact that the two
processes are not equally affected by the cell morphology. The fact that the half-time in the kinetics of spread
cells has shortened with respect to the passive transport equalizing the half-time of cells grown in the Nichoid
suggests that the NPC permeability in facilitated transport must be higher than in the Nichoid. The calculation
of GFP-MyoD translocation fluxes confirms this conjecture. In fact, the flux in spread MSCs is 3.1 times higher
than in cells grown in the Nichoid (Fig. 7g).
To observe if cell morphology can also affect the nuclear concentration of proteins, we calculated the fluo-
rescence intensity of nuclear MyoD-GFP. Our results show that the morphology adopted by MSCs grown in the
Nichoid changes the balance ratio of the transcription factor concentration into the nucleus, which is 20% less
than the concentration in the Control (Fig. 7h). Finally, in order to reduce the deformation of the nucleus in the
cells grown on a stiff and flat substrate, we used Cytochalasin-D drug. Its depolymerizing action of the actin fib-
ers reduce the tension on the cell nucleus, which assumes a roundish shape. In fact, the results obtained on the
nuclear geometry showed that, using Cytochalasin-D, the nuclear shape becomes roundish and tends to be more
similar, but not exactly the same, to the nuclear shape of cells grown in the Nichoid. In the case of Cytochalasin-D
treated cells, the Myod-GFP nuclear concentration is reduced around 10% respect to the Control, placing itself
at an intermediate concentration between the Control and Nichoid samples.
However, from a mechanistic point of view, the higher permeability may be associated with either a larger
number of pores per unit surface, a higher permeability of each single pore, or a combination of both. To examine
the first possibility, we stain NPCs with the Nup153 antibody and the cell nucleus (by using the H3k4me3 anti-
body) and imaged them using confocal microscopy. A representative image of one MSC grown on the Control
is reported in Fig. 8a. Already qualitatively Fig. 8a suggest that the distribution of NPCs as a function of the
deformation of the nucleus is quite homogeneous. the exact spatial position of the NPCs was extracted with the
software Huygens to create Fig. 8b, where the 3D localization of NPCs is shown together with the nuclear effective
and blocked surface. This schematic figure visualizes the distribution of NPCs in the entire nuclear membrane.
The color of each triangle element connecting three NPCs shows the normalized pore density which is varying
locally between 0.15 and 3 in the NE (the density is normalized by the mean value over the whole surface of the
NE). In our samples any particular patterns in NPCs density was observed. Therefore, the possibility that the
higher permeability of the nuclear surface exposed to the cytosol (effective surface) is due to the higher density
of NPCs at that region appears to be not supported by our analysis. On the contrary, the hypothesis that the
increase in permeability obeys to an opening of the nuclear pores appears reasonable.
Discussion
Mechanical and biochemical factors regulate stem cell renewal or differentiation. Thanks to integrin-mediated
FAs, cells can anchor to the substrate, sense the surrounding microenvironment, and provide a mechanism
through which environmental mechanical forces determine the stem cell function and fate. Extracellular cues are
thus translated to the nucleus via actin fibers, triggering gene expression, sensing environmental forces, internal-
izing membrane vesicles, providing internal forces, moving, and dividing cells. Actin therefore contributes to
fundamental biological processes25. Understanding how biophysical cues in the Nichoid regulate cell function
is important, since it leads to a much better understanding of how cells develop and maintain their distinctive
properties. It also enables us to understand how to design new scaffolds and what features need to be considered
in devices for tissue regeneration. Micropatterning techniques and substrate stiffness regulation are commonly
used to control cell shape and behaviour, although 2D cell cultures are not completely representative of the
in vivo cell phenotype. Researchers have recently been investigating how the 3D environment can influence cell
morphology and cell function20.
Scientific Reports | (2021) 11:3021 | https://doi.org/10.1038/s41598-021-81920-2 9
Vol.:(0123456789)www.nature.com/scientificreports/
Scientific Reports | (2021) 11:3021 | https://doi.org/10.1038/s41598-021-81920-2 10
Vol:.(1234567890)www.nature.com/scientificreports/
◂Figure 6. Effective NE surface for nucleo-cytoplasmic protein fluxes. (a) 3D rendering of MSCs grown in
the Nichoid. Actin fibers are in green and the cell nuclei are in blue. The cell nucleus is surrounded by the
cell cytosol in each direction. (b) 3D rendering of z-stack images: actin (green) and nuclei (blue). The image
shows that on a 2D flat control substrate, MSCs are very thin and the volume of the cell cytosol at the top
and the bottom of the nucleus is negligible. (c) Collection of explanatory images of the first seconds after the
photobleaching. These results show that, fluorescence recovery starts at the nuclear periphery and gradually
diffuses towards the nuclear centrum. In fact, the fluorescence recovery in the nuclear slice is more uniform
in the Nichoid than in the Control, where a fluorescence gradient towards the center of the nucleus is clearly
visible. On the left there are representative images of MSCs expressing GFP protein. The red ROI highlights the
cell nucleus. The white ROI shows the rectangle on which the pixel-by-pixel fluorescence intensity plots were
made. From left to right surface plots are shown at different times: 200 ms, 4 s, 35 s. (d) Scheme of the nuclear
surface (in blue) exposed for protein transport in MSCs grown into the Nichoid (up) and on a flat glass substrate
(down). The software used to create the images is Ansys 2019 R2 (www.ansys.com). (e) Comparison of recovery
curve and mean flux within first 22 s after photobleaching for cells on a flat control substrate considering the
effective surface of transport: numerical simulation (gray), FRAP experiments (blue).
We employed a microfabricated 3D culture substrate, the Nichoid, which modulates cell morphology and
gene activation based on architectural cues that condition cell adhesion19,21,22,26. As 2D Control substrates, we
used glass coverslips, which underwent the same treatment steps of the Nichoid samples, except for the exposure
to the polymerization laser beam Our previous findings using the N ichoid22,26 and the new results obtained here
using Cytochalasin-D to inhibit actin polymerization, suggest that 3D architectural cues of the Nichoid determine
the spatial configuration of the forces that guide MSC morphology and functionality. In cells, force transmission
depends on the FA strength, which is related to the FA dimension. There are small initial contacts mainly located
at the cell edge, the so-called “Dot” contacts, and there are mature FAs, the “Dash” contacts, associated with the
cytoskeletal actin b undles27. Our analysis on vinculin expression and localization reveals that mature FAs only
occur in the Control cells (Fig. 1), suggesting that the forces transmitted to the nucleus in MSCs grown in the
Nichoid are weaker than those transmitted in spread cells (Fig. 2). The actin staining also confirms the hypothesis
suggested by different research groups28–30 that there is a mechanism by which the shape of the nucleus can be
controlled by the underlying distribution of FAs. In our experiments, MSCs grown in the Nichoid lack the peri-
nuclear actin cap, contrary to cells grown on the Control (Figs. 2, 3, 5). This structure may be associated with the
observed deformation of the nucleus since it pushes and compresses the nucleus toward the bottom of the cell,
preventing the nucleus from bulging against the cell membrane while providing the observed disk-like shape.
For MSCs grown in the Nichoid, the role of the actin fibers is mostly associated with the creation of a struc-
ture, the actin cortex, that allows the cells to grow in a 3D environment, which offers few adhesion points and
therefore provides few sites for the transmission of internal forces from the environment to the nucleus. Other
researchers have obtained a similar result using substrates with a different stiffness, diversifying the cell volume,
depleting FA proteins or affecting the MAPK signalling31–33. They have thus confirmed that the nucleo-cytoplas-
mic translocation of proteins is mediated by forces transmitted to the nucleus. By disrupting the cytoskeletal
organization, using Cytochalasin-D drug, we demonstrated that the actin cap squeezes the nucleus, inducing
the thin disk-like shape. This modulation of the nuclear morphology affects the overall nuclear permeability,
at least for the inert GFP protein and for the transcription factor MyoD fused with a GFP (Figs. 5, 6, 7). As the
observations regarding cells grown on a flat substrate show, the bottom of the nucleus is in contact with the
substrate below, while the top of the nucleus is in close contact with the perinuclear cap and the cell membrane,
leaving almost no space for the cytoplasm (Fig. 6). It has been reported that nuclear stiffness and intracellular
forces control the maximum height of the cell on a flat s ubstrate34. Our work suggests that the nuclear shape and
the actin organization can also alter the accessibility of the NPCs to proteins translocation, hence changing the
overall nuclear permeability. In fact, our numerical simulation together with the experimental measurements
show that for Control cells, the mean flux of the GFP and GFP-MyoD proteins through the effective nuclear
surface is higher than that in cells grown in the Nichoid; this difference is magnified in the case of the transcrip-
tion factors MyoD (Fig. 7).
Our results agree with previous published research studies. For example, in 2013, using a combination of
theory, numerical simulations, and experiments, Rangamani et al.33 suggest that local curvature of the cell
modulates biochemical signaling pathways due to an accumulation of activated receptors at regions of higher
curvature with increasing cell eccentricity. Here, we demonstrate that in a 3D culture system, which is more
similar to the physiological one, the MyoD concentration in the nucleus is lower than that obtained in a standard
(two-dimensional) culture system (Fig. 7). This fact may occur due to a modulation of the nuclear permeability
through either a modification of the number of pores per unit surface, a higher NPC permeability, or a combi-
nation of both. Figure 8 denies the hypothesis of a significant NPC redistribution as a consequence of nuclear
deformation. Therefore, we can assume that the NPC distribution is quite homogeneous, and that the modulation
of the nuclear permeability is guided by the opening of the pores. Other researchers agree on the existence of
this mechanical p henomenon31 and our results regarding the flux of proteins entering in the cell nucleus in the
two nuclear conformation together with the reduction of the NPCs amount, due to the effective surface in the
deformed samples, suggest an opening of the NPCs located at higher nuclear curvature.
However, it should be remembered that this is a mechanistic interpretation of a phenomenon in which other
biological components will also compete. For instance, it could be that in the Control, the physiological regulators
of facilitated transport, such as proteins that are in charge of the nucleus-cytoplasm shuttling of macromolecules
(i.e. nuclear transport receptors -NTRs), are upregulated as a consequence of the 2D adhesion e nvironment35.
Scientific Reports | (2021) 11:3021 | https://doi.org/10.1038/s41598-021-81920-2 11
Vol.:(0123456789)www.nature.com/scientificreports/
Figure 7. Facilitated transport through the MSC pore complexes. (a,b) Representative FRAP experiment on MSCs expressing
GFP-MyoD protein, grown in the Nichoid (a) and on the control substrate (b). (c) Contour map of GFP-MyoD concentration
on xz-plane at different time points for cells grown in the Nichoid (from numerical simulation). (d) Contour map of GFP-
MyoD concentration on xz-plane at different times for cells grown on a flat control substrate (from numerical simulation). The
software used to create the images (c) and (d) is Ansys 2019 R2 (www.ansys.com). (e) Comparison of fluorescence recovery
curve for cells in the Nichoid: numerical simulation (gray), FRAP experiments (red). (f) Comparison of fluorescence recovery
curve for Control cells; numerical simulation (gray), FRAP experiments (blue). The vertical axis of the graphs e and f shows
the normalized fluorescence intensity for FRAP and the normalized concentration for the numerical simulation; the grey box
inside these figures shows the half-life recovery time. (g) Comparison of mean fluxes (passive and facilitated) calculated by
computational modelling, within the first 22 s after photobleaching for cells in the Nichoid and on the Control. (h) GFP-
MyoD concentration in the cell nucleus at steady state conditions. The nuclear concentration in cells with thin disk-like shape
is bigger than in MSCs with roundish nuclei. Graph (h) statistics: Kruskal–Wallis multicomparison test. *Corresponds to
p < 0.05.
Scientific Reports | (2021) 11:3021 | https://doi.org/10.1038/s41598-021-81920-2 12
Vol:.(1234567890)www.nature.com/scientificreports/
Figure 8. Mean nuclear flux and pore distribution. (a) 3D reconstruction of confocal z stack images. In green is
visible the nuclear pore distribution and in red the DNA (Nup153 protein and H3K4me3 staining respectively).
(b) Superimposition of the NPC nuclear localization and the transport-blocked surface; the surface is
reconstructed by Delaunay triangulation method and the color shows the normalized NPC density at each
triangle elements. The software used to create the two images is Matlab R2019b (https://it.mathworks.com/).
However, the time constant of the mechanical- and genetic-related changes in permeability would differ by
several orders of magnitude. In the future, we aim to explore this possibility both experimentally and with a
computational model at a molecular scale.
Methods
Microfabrication of 3D Nichoid structures. The culture substrates used as the basis for the Nichoid
production were the Nunc Lab-Tek-8-chamber wells (Thermo Fisher Scientific, Italy) or glass culture coverslip
1,2 cm in diameter. In both cases the glass category is #1.5, i.e. 0.17–0.19 µm thick, with Young’s modulus of
around 80 GPa. In the first case, Nichoids were fabricated in the four central wells (7 mm × 9 mm each) and
spatially organized in 2 × 2 units, each of which was 450 μm × 450 μm × 30 μm in size (Fig. 1a). In the latter, a
circular area with 8 mm in diameter was fully covered with Nichoids. Detail on Nichoid fabrication are reported
in36. The Young’s modulus of the photo-polymerized Nichoid micro-lattice is two orders of magnitude less stiff
than glass22,24.
In all experiments the Lab-Tek bottom glass or commercial glass coverslip, which have undergone all the treat-
ment steps except the exposure to the polymerization laser beam, are considered as 2D-control sample (Control).
Scaffolds (Nichoids and Controls) were sterilized by washing three times with deionized sterile water and
incubating for a few hours in ethanol 70%, followed by 1 h UV exposure and three with deionized sterile water
washes.
Cell culture and seeding. Rat-MSCs were cultured for a few passages (maximum 5) in alpha-MEM phenol
red free medium supplemented with 20% fetal bovine serum, 1% L-glutamine (2 mM), penicillin (10 units/ml),
and streptomycin (10 µg/ml) at 37 °C and in 5% C O2 (Euroclone, Italy). Culture medium was changed every
2–3 days and cells were used at passages 1–6 after thawing.
For the fluorescence microscopy experiments, 1 04 MSCs were seeded in each well and analyzed after immu-
nofluorescence assay, permeable fluorescent dye or transfection treatment. For the western blot analysis 15 × 103
MSCs were seeded in the Nichoid substrate, while 7 × 10³ MSCs were seeded on glass coverslip 2 cm in diameters.
Cells were grown for one week and then lysed.
Scientific Reports | (2021) 11:3021 | https://doi.org/10.1038/s41598-021-81920-2 13
Vol.:(0123456789)www.nature.com/scientificreports/
Western blot analysis. Protein lysates were extracted using a lysis buffer (50 mM tris–HCl, 1% Triton
X-100, 150 mM NaCl, 0.5 mM EDTA, pH 7.4) supplemented with 1% protease inhibitor cocktail (Sigma-
Aldrich). 20 μg of protein extract was separated by SDS–PAGE and transferred onto a nitrocellulose mem-
brane (Biorad). Non-specific binding sites were blocked with 5% BSA in Tris-buffered saline buffer with 0.1%
Tween 20 (TBST) for 1 h at room temperature. Membranes were incubated with specific antibodies overnight at
4 °C (anti-GAPDH 1:1000 Cell Signaling; anti-Vinculin 1:10,000 Abcam; anti-βactin 1:10,000, Sigma-Aldrich).
HRP-conjugated anti-mouse (Jackson) or anti-rabbit (Santa Cruz Biotechnology) secondary antibodies were
then used to incubate membranes for 1 h at room temperature. Chemiluminescent signals were detected using
Immobilon Western Chemiluminescent HRP Substrate (Millipore) and the ChemiDoc Imaging System (Bio-
rad). Signal intensity was analyzed using ImageJ software. GAPDH was used as the endogenous control and the
results were expressed relative to its levels.
Immunofluorescence assay. To visualize the organization of the actin stress fibers and the focal adhesion
localization, one day after seeding, cells were fixed for 15 min in 4% paraformaldehyde, washed with phosphate
buffered saline (PBS, Euroclone, Italy) and permeabilized with 0.25% Triton X-100-PBS (Sigma Aldrich, Italy).
After 15 min incubation at room temperature, they were processed for indirect immunofluorescence a nalysis37.
Cells were blocked in PBS-2%bovine serum albumin (BSA, Sigma Aldrich, Italy) for 4 h; then incubated
at 4 °C, over-night, with primary antibody (mouse monoclonal anti-Vinculin antibody (Sigma Aldrich, Italy),
Nup153 and H3K4ME3, Abcam UK,). After three washes, samples were incubated at room temperature for
45 min with 1 μg/ml phalloidin-FITC (Sigma Aldrich, Italy), if necessary, to stain actin cytoskeleton, and/ or
with 2 μg/ml secondary antibody (Alexa Fluor, Abcam, United Kingdom). Cell nuclei were stained with a 10-min
incubation using 1 μg/ml of Hoechst 33342 (Thermo Fisher Scientific, Italy) in PBS. After other three washes,
samples were imaged using a confocal microscopy set-up. For actin cytoskeleton, vinculin focal adhesions and
nuclear morphology characterization 1 µµ step z-stack were performed with airy1 pinhole settings and 200 nm
pixel dimension. A total of 21 (Nichoid) and 18 (Control) cells were analyzed. For NPC characterization 300 nm
step z-stack were performed with airy 0.7 pinhole settings and 30 nm pixel dimension. Ten cells grown on con-
trols were analyzed.
Live cell staining. MSC nuclei were incubated with 1 μg/ml Hoecst-33342 and 0.8 µM calcein-AM fluores-
cent probes (Thermo Fisher Scientific, Italy) ten minutes before the experiments. After one washing step, the cell
culture medium was replaced. Samples were imaged using a confocal microscopy set-up.
All the experiments were repeated independently three times for each reported dataset (Nichoid and Control).
The number of cells analyzed was 32 and 28, respectively.
3D fluorescence images. Fixed samples maintained in PBS, and live samples maintained in fresh cul-
ture medium were imaged using a confocal microscope (Olympus Fluoview FV10i) equipped with four diode
lasers (emission wavelength 405, 473, 559, 635 nm), with a 60 × water immersion objective, 1.2 N.A. (image size
212.13 × 212.13 µm2). The pinhole was set to 1 Airy Unit. Z-stack images were acquired on cells in the Nichoid
microstructure (40 µm acquisition depth) and on the Control cells (10 µm acquisition depth) with a 1 µm step.
Cellular parameter analysis. The image analysis was carried out with the open source software ImageJ
(https://imagej.nih.gov/ij/index.html, USA) and the data analysis was performed with Origin Pro software.
Images were converted in 8 bits.
Focal adhesions. The number of focal adhesions, area and maximum elongation were calculated by manually
drawing the regions of interest (ROIs) around FA projecting a curved surface and comparing it to a 2D surface.
analyzed.
Actin fibers. Actin fibers amount per cells were calculated in few steps:
1. the production of a maximum value-z-projection image of the z-stacks.
2. Identifying each cell profile manually drawing a ROI on their edge.
3. Filtering the -z-projection image using as minimum threshold the 30% of the total value (pixel value below
76.5 were discarded) and producing a binary image.
4. Finally, the actin fibers amount was calculated measuring the number of white pixels per cell.
Instead, actin fibers interacting with the cell nucleus were calculated by using the same maximum value-z-
projection image of the z-stacks. ROIs identifying the cell nuclei were manually drawn on the Hoechst33342
channel and then reported on the actin channel. The number of actin fibers crossing the nuclear ROI were
manually counted.
Cell morphology. Samples treated with Hoechst-33342 and Calcein-AM were analyzed separately to evaluate
the morphological feature of MSCs.
To evaluate the semi-axes, two orthogonal projections (xy and xz) of the z-stack were performed for each
cell. This solution identifies the largest xy and xz nuclear and cellular sections. The semi-axes a, b and c were
obtained by fitting the results with ellipses. The ratio between the cellular and nuclear semi-axes c returns the
cell elongation along the z-axis.
Scientific Reports | (2021) 11:3021 | https://doi.org/10.1038/s41598-021-81920-2 14
Vol:.(1234567890)www.nature.com/scientificreports/
The coordinates of the cellular and nuclear mass centers were calculated by drawing two ROIs around the
cell in two orthogonal projection planes.
The nuclear and the cell volume were calculated manually by drawing a ROI for each cell z-stack and calculat-
ing the sum of voxels included in the ROIs.
For the Control dataset, nuclear surfaces, S, were calculated using the scalene ellipsoid (a > b > c) formula:
(1)
S = 4π (ab)p (ac)p (a)c p
p
where p = 1.6075.
For the Nichoid dataset, nuclear surfaces, S, were calculated using the prolate ellipsoid (a > b = c) formula:
2 arccos ac
S = 2π c + ac (2)
sin arccos ac
GFP‑MyoD cloning. In order to create the GFP-MyoD recombinant protein, we fused MyoD onto a
supernegative variant of GFP created by Lawrence and c olleagues38. We amplified the (-30)GFP sequence from
the pET-(-30)GFP-9xGGS-Cre-6xHis (Addgene, plasmid #62,372). We fused the MyoD sequence at the (-30)
GFP-C terminal and inserted the recombinant sequence in the eukaryotic plasmid pcDNA3 using the NdeI and
HindIII restriction sites. We used the TOP10 E. coli strain for GFP-MyoD cloning procedures.
Cell transfection. In order to study the passive diffusion, cells were transfected with a plasmid coding for a
standard GFP (pmaxGFP), while in order to study facilitated transport, MSCs were transfected with pcDNA3-
GFP-MyoD. Transfection procedures were performed using a commercially available protocol (jetPRIME, Poly-
plus Transfection, USA). Briefly, a solution composed of 0.5 µg of DNA, 25 µl of jet PRIME buffer and 1.12 µl
of jet PRIME reagent was prepared and kept at RT for 15 min. Cells were incubated with the transfection solu-
tion added to 400 µl of antibiotic free medium (alpha mem, 20% fetal bovine serum (FBS), 1% L-Glutamine;
Euroclone, Italy). After 4 h, the solution was replaced with a complete medium38. Before FRAP experiments, cell
nuclei were labelled with 1 µM DRAQ5 fluorescent probe (ThermoFisher, Italy).
Fluorescence recovery after photobleaching (FRAP). FRAP measurements were performed as
described in39,40 with minor modifications. Briefly, images were acquired with a confocal Laser Scanning micro-
scope (Leica SP8) equipped with an Argon laser and a white light laser, a 63X PlanApo oil-immersion objective
(NA 1.4) and an incubator chamber. Image size was 256 × 256 pixels and the scan speed was 700 Hz. Pinhole size
was set to reach a z-resolution of 3 µm. More than 20 cells per dataset (Nichoid and Control) were acquired in
three different experiments.
To detect the cell nucleus and choose the best plane to perform the FRAP measurement, DRAQ5 dye was
detected using 8% of the Leica White Light Laser (excitation 633 nm, emission 650–750 nm). For each cell, we
identified and recorded a ROI describing the section of the nucleus for the FRAP measurements. The images
were collected using, at the sample, around 15 µΩ excitation power of an Argon Laser (excitation wavelength
488 nm, emission wavelength 500–580 nm) was used. Nuclear proteins were photobleached by scanning a
nuclear ROI with the 488 nm laser at full (100%) power. Three to five seconds were required to photobleach
most of the nuclear fluorescence, without destroying too much of the cytosolic fluorescence, in cells spread on
glass substrate. For the cells grown in the niche, in order to avoid bleaching the fluorescent proteins present in
the cytoplasm, the maximum photobleaching time was in the order of hundreds of milliseconds. The plots of
Fig. 6c, showing the pixel-by-pixel fluorescence intensity of a rectangular ROI circumscribing the cell nucleus
during the fluorescence recovery, were created using the ImageJ "Surface Plot" plugin.
Nuclear fluorescence recovery was measured by starting a time-lapse acquisition within a few hundred mil-
liseconds (382 ms) after the bleaching, acquiring 20 images every 191 ms and then 90 images 241 every 6 s in the
case of GFP, and acquiring 200 images every 191 ms and then 100 images every 5 s to study GFP-MyoD recovery.
As shown in Supplementary Fig. 3c–f the different bleaching time between cells grown in the Nichoid and on the
Control is necessary to obtain a significant bleaching of the nuclear fluorescence. The bleaching depth is 0.7 ± 0.1
e 0.8 ± 0.1 for MSC grown on flat substrate and expressing GFP and MyoD-GFP proteins, respectively. In the case
of Nichoid the bleaching depth is 0.5 ± 0.1 0.6 ± 0.1, respectively. During the bleaching time, it is inevitable that
some fluorescent proteins into the cytoplasm will also bleached; however, as shown in Supplementary Fig. 3g,h
it does not introduce considerable artefacts because the recovery of the nucleus is governed by the permeability
of the NE and the transport through the NE is about three orders of magnitude slower than transport inside
the cytoplasm and nucleoplasm. It means that the cytoplasm recovers in some milliseconds while transporting
through the NE takes some of seconds. Therefore, the effect of NE as a membrane that hinders the recovery
of the nucleus is dominant enough. The recovery of the fluorescence was evaluated for at least 9 min, which is
enough time to observe a long plateau in the fluorescence intensity recovery curve. In each acquisition, the image
background was subtracted from the curves.
The fluorescence signal was assumed as being proportional to the protein concentration and described by
the function:
t
F(t) = F ∞ (t) + (F 0 (t) − F ∞ (t))e− τ (3)
Scientific Reports | (2021) 11:3021 | https://doi.org/10.1038/s41598-021-81920-2 15
Vol.:(0123456789)www.nature.com/scientificreports/
To remove the fluorescence bleaching due to the measurements, nuclear recovery data were divided by the
total cell fluorescence intensity, using an ROI drawn on the cell edge as shown in Fig. 4c.
Data of the three experiments were mediated and fitted (Origin Pro software) to a single exponential function
using the following equation:
t
y = y0 + Ae− τ (4)
where τ is the characteristic time of the protein translocation from cytosol to the nucleus, A is the difference
between the nuclear fluorescence after bleaching and the nuclear fluorescence at the end of the recovery, cor-
responding to the fraction of protein involved, and y 0 is the fluorescence measured at the end of the recovery. A
characteristic parameter of exponential decay is the half-life (the time needed to reach 50% of the total amount
of fluorescence) which is calculated as t1/2 = τ ln2.
Data after the bleaching time were considered and then normalized between 0 and 1 using the following
equation:
Icell (t) − I0
I(t) =
If − I0 (5)
where Icell (t) is the recovery curve, I0 is the intensity value of the nuclei after bleaching and If is the value of the
plateau.
The flux of proteins, GFP and GFP-MyoD, across the nuclear pore complexes were calculated by
Iτ Vnuc
�(τ ) = (6)
τ Snuc
where Iτ is the mean intensity at a delay τ after bleaching (chosen here as τ = 22 s), Vnuc is the nuclear volume
measured in the morphological analysis, and Snuc is the nuclear surface calculated by the Eq. (2). The MyoD
protein concentration in the cell nucleus was evaluated, at steady state, by measuring the average fluorescence
intensity in an ROI with 1.5 µ m radius, positioned at the nucleus center, and normalizing it by the average
fluorescence intensity in ROI, with equal radius, positioned in the cytosol the furthest away from the cell nucleus.
Statistical analyses. The experimental data were analysed by non-parametric test, such as Mann–Whitney
U test, for the comparison just between two groups, and Dunn’s Kruskal–Wallis Multiple Comparison test, when
the groups are more than two. Associations with *p values < 0.05 were considered significant.
Governing equations for passive transport. Passive transport of the GFP inside the cell is determined
by Fick’s law of diffusion formulated as
∂c −
→ −→
= ∇. D∇c (7)
∂t
where c = c x, y, z, t is the concentration of the GFP inside the cell. If the diffusion coefficient is set as a func-
tion of the spatial coordinate system, Eq. (7) governs any change in the GFP concentration inside the cytoplasm
and nucleus. This coefficient depends on both the medium composition and the size of the GFP. Therefore, three
values may be associated with the diffusion coefficient: one related to free diffusion inside the nucleus ( DNu =
25 µm2 /s ), one to free diffusion inside the cytoplasm ( DCyt = 25µm2 /s ) and one to transport through the NE
app
( DNE )40. Here, NE is modeled as a permeable membrane whose transport of small molecules through its NPCs
is described by simple passive diffusion. To determine the apparent diffusion coefficient of the NE, we considered
partition and hindrance factors, ϕ and ε, respectively. The partition factor is the ratio of the NPC area to the NE
area and is calculated by
∼
ANPC
ϕ=N (8)
ANE
∼
where, ANPC = (1/N) N i=1 ANPCi is the mean transport area of NPCs. The hindrance factor accounts for the
resistance of the NPC to the diffusion of molecules, i.e. due to molecular crowding. Therefore, regarding the
apparent diffusion coefficient of the NE, we have
app
DNE = ϕεDCyt (9)
Equations (8) and (9) describe how we can model the NE as a virtual permeable membrane. In the simulation
app
of the transport through the NE, we set the value of DNE . Our approach toward the problem was to set different
values of the diffusion coefficient in the numerical model and find out the values by which we observe a good
agreement between the simulation results and FRAP.
app
Although implicit determination of DNE can be achieved by MD simulation of the transport inside the NPCs,
it can also be estimated using FRAP. Considering FRAP, a linear proportionality between the concentration of
the molecules and their fluorescence can be a ssumed39–41 by a direct comparison of the results of FRAP and the
simulation.
Scientific Reports | (2021) 11:3021 | https://doi.org/10.1038/s41598-021-81920-2 16
Vol:.(1234567890)You can also read