Single-Cell Mapping of GLP-1 and GIP Receptor Expression in the Dorsal Vagal Complex
←
→
Page content transcription
If your browser does not render page correctly, please read the page content below
Diabetes Volume 70, September 2021                                                                                                                           1

Single-Cell Mapping of GLP-1 and GIP Receptor
Expression in the Dorsal Vagal Complex
Mette Q. Ludwig,1 Petar V. Todorov,1 Kristoffer L. Egerod,1 David P. Olson,2,3 and Tune H. Pers1
Diabetes 2021;70:1–11 | https://doi.org/10.2337/dbi21-0003

The dorsal vagal complex (DVC) in the hindbrain, com-                              Intracerebroventricular injection of either GIP or GLP-
posed of the area postrema, nucleus of the solitary tract,                      1 reduces body weight and combined intracerebroventric-
and dorsal motor nucleus of the vagus, plays a critical role                    ular injection of GIP and GLP-1 (at subeffective doses
in modulating satiety. The incretins glucagon-like peptide 1                    for each individual peptide) synergistically reduces body
(GLP-1) and glucose-dependent insulinotropic polypeptide                        weight in mice (5). Due to the rapid degradation of
(GIP) act directly in the brain to modulate feeding, and

                                                                                                                                                                  DIABETES SYMPOSIUM ARTICLE
                                                                                endogenous GLP-1 and GIP by dipeptidyl peptidase 4, it
receptors for both are expressed in the DVC. Given the                          is unlikely that intestinal-derived incretins reach receptors
impressive clinical responses to pharmacologic manipula-
                                                                                in the brain. However, the brain mediates the anorexic
tion of incretin signaling, understanding the central
                                                                                effects induced by degradation-resistant incretin receptor
mechanisms by which incretins alter metabolism and
                                                                                agonists; for instance, knockdown of Glp1r in the central
energy balance is of critical importance. Here, we
review recent single-cell approaches used to detect
                                                                                nervous system abolishes weight loss in mice treated
molecular signatures of GLP-1 and GIP receptor–ex-                              peripherally with GLP1RA (6). Interestingly, both periph-
pressing cells in the DVC. In addition, we discuss how                          erally and centrally administered GIPR antagonists have
current advancements in single-cell transcriptomics,                            been shown to protect against obesity in rodents and
epigenetics, spatial transcriptomics, and circuit map-                          nonhuman primates (7,8), indicating that the cellular
ping techniques have the potential to further charac-                           mechanisms through which GIPR signaling improves met-
terize incretin receptor circuits in the hindbrain.                             abolic function remain undefined.
                                                                                   Neurons in the hindbrain and especially the dorsal
                                                                                vagal complex (DVC) are optimally positioned to play a
The incretins glucagon-like peptide 1 (GLP-1) and glu-                          key role in mediating incretin’s effects on food intake.
cose-dependent insulinotropic polypeptide (GIP) are pep-                        The DVC is located in the medulla oblongata by the
tide hormones released by intestinal enteroendocrine cells                      fourth ventricle and comprises the area postrema (AP),
in response to a meal (1). In addition to augmenting insu-                      the nucleus of the solitary tract (NTS), and the dorsal
lin secretion during an oral glucose load, both hormones                        motor nucleus of the vagus (DMV). The AP senses circu-
modulate satiety (1). GLP-1 receptor agonists (GLP1RA)                          lating metabolic signals (9), and the NTS processes and
are approved for the treatment of obesity (2), and GLP-1                        relays intestinal information to the brain (10). Studies in
and GIP receptor coagonists show pronounced synergistic                         rodents and/or nonhuman primates have shown that
effects on weight loss in clinical trials (3). Moreover,                        GLP1R is expressed in the AP, NTS, and DMV (11–16)
genome-wide association studies (GWAS) for BMI (a sur-                          and that Gipr is expressed in the AP (15–17). In addition,
rogate measure to approximate adiposity) have associated                        the NTS houses a small population of GLP-1–producing
coding variants in the GIP receptor (GIPR) with lowered                         neurons (18). Moreover, GLP1R in glutamatergic and not
body weight (4), further supporting a weight-modulatory                         GABAergic neurons are required for weight loss induced
role of GIPR in human obesity.                                                  by peripherally administered GLP1RA in mice (14).

1
  Novo Nordisk Foundation Center for Basic Metabolic Research, University of    Received 15 March 2021 and accepted 8 June 2021
Copenhagen, Copenhagen, Denmark                                                 This article contains supplementary material online at https://doi.org/10.2337/
2
  Department of Molecular and Integrative Physiology, University of Michigan,   figshare.14748642.
Ann Arbor, MI
3                                                                               © 2021 by the American Diabetes Association. Readers may use this article
  Division of Pediatric Endocrinology, Department of Pediatrics, Michigan
                                                                                as long as the work is properly cited, the use is educational and not for
Medicine, Ann Arbor, MI
                                                                                profit, and the work is not altered. More information is available at https://
Corresponding author: Tune H. Pers, tune.pers@sund.ku.dk                        www.diabetesjournals.org/content/license.

                            Diabetes Publish Ahead of Print, published online July 8, 2021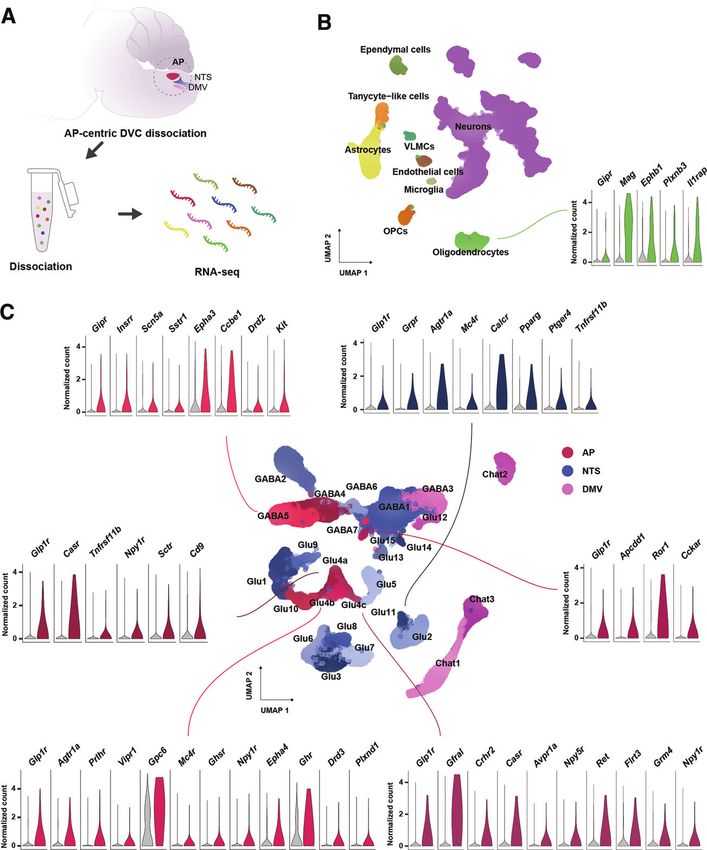
2       GLP-1 and GIP Receptor Expression in the DVC                                     Diabetes Volume 70, September 2021

Indeed, Glp1r is predominantly expressed in glutamatergic        integrate a unique barcode (cell barcode) for all tran-
neurons in the AP and NTS (14), and administration of            scripts originating from a given cell and a transcript-
GLP1RA in the fourth ventricle suppresses feeding (19).          specific unique molecular identifier to control for PCR-
Furthermore, peripherally administered GLP1RA-induced            induced amplification biases. Single-cell level barcoding
transcriptional changes are particularly pronounced in the       can be achieved in multiple ways, but most approaches
AP compared with the NTS and extra-DVC brain areas               capture individual cells in an isolated reaction environ-
(16). However, some studies have suggested an involve-           ment until the cell barcode is encoded. This can be
ment of GABAergic NTS neurons and question whether               achieved through serial dilution into reaction wells,
AP cells are necessary for GLP1RA to exert control on            FACS, micropipetting, and valve-based, nanowell-based,
feeding (19–22), leaving the role of the DVC unclear.            or droplet-based microfluidics. An alternative approach
   Here we argue that elucidating the mechanisms by which        is combinatorial indexing where cells are repeatedly
incretins affect feeding requires a more detailed under-         mixed into different wells to attain a unique combina-
standing of the incretin receptor circuits in the hindbrain.     tion of barcodes. Whereas valve- and nanowell-based
Whereas immunohistochemistry, in situ hybridization, flow         protocols enable complex operations such as in-well
cytometry, and traditional large-scale molecular profiling        imaging and capture of full-length RNAs, allowing detec-
approaches can provide information on the spatial distribu-      tion of splice isoforms (e.g., the human GLP1R and
tion and expression levels of incretin receptors, they pro-      GIPR are transcribed into at least four and eight splice
vide limited information on the cell types expressing the        variants, respectively [24]), they typically have lower
receptors. Given the cellular heterogeneity of the DVC,          throughput in terms of the total number of cells as
large-scale molecular approaches operating at single-cell res-   compared with droplet- and combinatorial indexing–-
olution are imperative to further map the role of hindbrain      based techniques. Due to their scalability and ease of
incretin signaling in body weight regulation. Here, we           use, microfluidic-based techniques have become a popu-
describe recent advancements in transcriptional characteri-      lar choice for scRNA-seq. See ref. 25 for a comparison of
zation of GLP-1 and GIP receptor cells in the DVC and out-       specific techniques.
line how single-cell transcriptomics, epigenetics, spatial          Tissue dissociation, cell capture, barcoding, and library
transcriptomics, and circuit mapping techniques have the
                                                                 construction are followed by massively parallel sequencing
potential to further our understanding of incretin signaling
                                                                 and data analysis. Transcripts are mapped to a reference
in hindbrain circuits.
                                                                 genome, and a count matrix of the captured transcripts is
                                                                 constructed. Following quality control steps and data nor-
Mapping the Distribution of Incretin Receptors Using
                                                                 malization, cells are clustered and marker genes for each
Single-Cell Transcriptomics
Due to the development of robust protocols using minimal         cluster are identified. Cell type labels can be automatically
amounts of biological input material and the introduction        inferred from one of the growing numbers of DVC
of easy-to-use commercial systems, RNA sequencing (RNA-          scRNA-seq data sets becoming available with use of data
seq) has become the preferred choice for single-cell profil-      integration tools (26). Downstream analyses of hindbrain
ing. Below we describe key concepts and considerations           single-cell data include but are not limited to identifica-
that need to be taken into account when profiling incretin        tion of differentially expressed genes between treatment
receptor circuits in the hindbrain.                              groups, network-based analyses to identify sets of coregu-
                                                                 lated genes within a given cell type, integration with
Hindbrain Single-Cell RNA-seq Data Generation and                GWAS data to identify cell types expressing marker
Analysis                                                         genes that colocalize with genetic association signals for
The first step in generating single-cell RNA-seq (scRNA-          metabolic traits, and mapping of intercellular signaling
seq) data is to dissociate tissue into a solution of single      between cell types (27). See ref. 28 for a review of best-
cells or single nuclei. Single-nucleus RNA-seq (snRNA-           practice recommendations in single-cell data analysis.
seq) has emerged as the preferred protocol for single-
cell sequencing analysis of the hindbrain based on its           Key Questions in Hindbrain Single-Cell Transcriptomics
applicability to frozen tissue samples and because nuclei        Studies
are less vulnerable to mechanical stresses imposed by            Four important questions arise when using single-cell
whole-cell dissociation protocols. Although nucleus-             experiments to study incretin receptor expression in the
based approaches do not assay cytosolic RNAs, RNAs in            hindbrain.
whole cells and nuclei are similarly distributed so that
nuclei-based protocols are expected to provide an                What Should I Pay Attention to During the Study Design?
equally good estimate of the cells’ transcriptional state           We anticipate that most hindbrain single-cell sequenc-
(23). Typically, data from 2,000–3,000 nuclei can be             ing studies will be designed to investigate stimulus-
obtained from a single mouse DVC isolated from a fro-            induced gene expression changes, e.g., transcriptional
zen brain sample. The RNA from each cell is captured             characterization of cell types directly and indirectly
and processed to “sequencing-ready libraries” that               responding to incretin dual agonist treatment in model
diabetes.diabetesjournals.org Ludwig and Associates 3
organisms. Ensuring a sufficient number of biological rep- mouse DVC, respectively (16). Unbiased profiling studies
licates per group is key, and we advise using power calcu- investigating incretin receptor signaling in response to
lations based on established DVC single-cell data sets to relevant physiological stimuli will be costly unless effec-
estimate that number. Next, because the induced tran- tive sorting-based enrichment of the target cells is used;
scriptional changes can be subtle, and despite the emer- however, such sorting-based approaches can be difficult
gence of computational approaches, technical variation to set up and apply. Finally, single-cell sequencing results
can introduce batch effects (26). Thus, to ensure preserva- are only descriptive; identified genes will need to be vali-
tion of biological variation, we recommend using “cell dated in a relevant physiological context using reverse
hashing” techniques that allow cells or nuclei from a genetics approaches, and relevant cell types will need to
greater number of samples to be pooled and processed be validated in vivo using direct manipulation of cell
together not only to reduce batch effects but also to mini- activity in response to defined physiologic stimuli.
mize cell doublets and experiment costs (29).
Single-Cell Profiling of Incretin Receptor–Expressing
Which Technique Should I Use? Cell Populations in the DVC
If the aim is to map hindbrain cell types, then a single- Targeted studies combining genetic mouse models and
nucleus droplet-based approach typically constitutes an immunohistochemistry have made valuable insights about
appropriate choice due to its minimal tissue-handling incretin receptor expression in the hindbrain. For exam-
requirements and the capability to work with frozen tis- ple, the majority of Glp1r AP and NTS neurons coexpress
sue and because it facilitates unbiased capture of activity- solute carrier family 17 member 6 (Slc17a6) and tyrosine
regulated transcription factor genes—a class of genes typ- hydroxylase (Th) (14,34), suggesting that glutamatergic
ically being transcribed shortly after neuron activation. If and dopaminergic/noradrenergic neurotransmission may
the experimental focus is on specific cell types that can be be important mediators of central GLP1RA action. How-
genetically labeled with fluorophores, then FACS purifica- ever, unbiased and comprehensive transcriptional charac-
tion followed by scRNA-seq represents an efficient way to terization of incretin receptor–expressing cells in the
profile the genetically defined cell type. CITE-seq (cellular hindbrain is still in its infancy. Below we combine and
indexing of transcriptomes and epitopes by sequencing) expand on findings from two recent studies using single-
(30) and inCITE-seq (intranuclear CITE-seq) (31) are two cell techniques to profile DVC cell populations in mouse
related techniques, which provide quantitative informa- models.
tion on cellular and intranuclear protein levels, respec-
tively, along with transcriptome measurements. Such Insights From Mouse Single-Cell Transcriptomics Studies
approaches can for instance be applied to quantify the Zhang et al. (15) profiled the transcriptomes of 3,657
protein abundance of activity-regulated transcription fac- cells from the AP and proximal NTS of mice to unravel
tors in characterization of cell types responding to physio- groups of AP neurons mediating nausea-associated behav-
logical stimuli such as incretin receptor agonists. iors. To understand cell populations involved in body
weight control, we (Ludwig et al. [16]) characterized the
How Many Cells Do I Need and What Sequencing Depth Should transcriptomes of 72,128 cells from AP-centric DVC tissue
I Aim for When Profiling the Incretin Response in the Hindbrain? of mice with diet-induced obesity that were 1) treated
Typically, the number of cells and sequencing read depth with GLP1RA peripherally, 2) given vehicle and fed ad
are traded off against each other (32). Heterogeneous libitum, or 3) weight matched to the GLP1RA-treated
structures like the hindbrain require a larger number of group for 7 days.
cells to be profiled than more homogeneous tissues. How- Both studies identified expression of Glp1r in glutama-
ever, incretin receptor–expressing cells constitute a small tergic neurons and Gipr in GABAergic neurons in the AP
fraction of the total number of cells in the DVC and we (15,16). In addition, Ludwig et al. detected Glp1r in
suggest using one of the following two sorting strategies to GABAergic AP neurons and glutamatergic NTS neurons
profile stimulus-induced expression changes in GLP1R- and and Gipr in oligodendrocytes, which may have been unde-
GIPR-positive hindbrain cells: 1) a transgenic animal model tected by Zhang et al. due to a less dense coverage of
reporter line expressing a nuclear membrane protein such these cell populations. Here, we integrated cells from
as SUN1 driven by the promoter for Glp1r, Gipr, or a gene these two atlases into a single DVC cell population map
marking the focal cell type; or 2) the Probe-Seq approach (see https://github.com/perslab/Ludwig-Diabetes-2021/
(33), which relies on fluorescent in situ hybridization for Methods). This atlas comprises a total of 8 glial cell
(FISH) to label intranuclear GLP1R or GIPR RNAs. types and 27 neuronal populations (Fig. 1); for a complete
list of marker genes see Supplementary Table 1. We note
What Drawbacks Should I Be Aware of When Using Single-Cell that since the dissections in both studies are AP-focused,
Sequencing to Explore Hindbrain Incretin Receptor Circuits? populations in the NTS and DMV may have been missed,
Glp1r and Gipr are expressed at relatively low levels such as Glp1r-expressing GABAergic NTS neurons and
and detected in only 0.7% and 1% of the cells in the Glp1r-expressing DMV neurons.4 GLP-1 and GIP Receptor Expression in the DVC Diabetes Volume 70, September 2021 Transcriptional Signatures of Incretin Receptor Cells and (16), consistent with the observation that GLP-1 neurons Their Potential Role in Energy Balance Control are not necessary for GLP1RA-induced weight loss but In the AP, Glp1r is expressed in a subset of glutamatergic when activated may act synergistically to reduce food neurons (Glu4a-c in Fig. 1C) distinct from calcitonin intake (41). receptor (Calcr)-expressing and receptor activity modify- Gipr is expressed in oligodendrocytes and GABAergic ing protein 3 (Ramp3)-expressing neurons (Glu10 in Fig. AP neurons (GABA5) (Fig. 1B and C). The top marker of 1C), highlighting that GLP-1 and amylin/calcitonin acti- Gipr-expressing GABAergic neurons was the transcription vate different cell populations. Glu4a neurons were factor paired box 5 (Pax5). GLP1RA administration did marked by solute carrier family 6 member 2 (Slc6a2), not alter gene expression in Gipr neurons (16). Since Glu4b by thymocyte selection–associated high mobility GABAergic neurons in the AP mainly innervate targets in group box (Tox), and Glu4c neurons by GDNF family the AP and proximal NTS (15), including TH-immunore- receptor a-like (Gfral). In all three neuronal populations, active AP neurons (42), this suggests that GIP may pre- at least one of the enzymes involved in dopamine and/or synaptically modulate the action of other metabolic noradrenaline synthesis was expressed (Th, dopamine peptides in the DVC. Interestingly, a single-cell transcrip- b-hydroxylase [Dbh], and DOPA decarboxylase [Ddc]). tomics study of the AP and NTS of fed and fasted mice Furthermore, Glu4b neurons expressed the melanocortin published during revision of this article suggests that oli- 4 receptor (Mc4r), which reduces feeding upon activation godendrocytes are particularly sensitive to changes in in the DVC (35) and is upregulated in the AP following energy status (43), indicating a potential metabolic role GLP1RA administration (16). Glu4a and Glu4c neurons for GIPR signaling in DVC oligodendrocytes. expressed the calcium-sensing receptor (Casr), which con- In sum, while many questions regarding GLP-1 and tributes to AP-mediated nausea, consistent with the find- GIP action in the DVC remain to be answered, single-cell ing that Slc6a2-, Gfral-, and Glp1r-expressing AP neurons transcriptomics has provided a number of important activate aversive calcitonin gene–related peptide (Cgrp) answers: a map of the transcriptional heterogeneity in neurons in the parabrachial nucleus (PBN) (15). It DVC cell populations that express combinations of the remains unclear whether Glp1r-expressing AP neurons receptors for GLP-1, GIP, amylin, calcitonin, and growth/ also activate anorectic circuits independent of nausea. In differentiation factor 15 (GDF15) and identification of the AP, Glp1r was also expressed in a small population of marker genes for 27 DVC neuronal populations that can GABAergic neurons (GABA7 in Fig. 1C) that expressed be used for cell type–specific manipulations. Key issues to the receptor for the anorexic peptide cholecystokinin resolve include mapping of additional NTS and DMV cell (Cckar) at high specificity. This population has, however, populations, screening of incretin receptor expression in not been confirmed using in situ hybridization or immu- less prevalent DVC cell populations and extra-DVC hind- nohistochemistry. In the NTS, Glp1r is expressed in brain nuclei, delineation of species differences in incretin glutamatergic neurons (Glu11 in Fig. 1C) where the gas- receptor circuits, and elucidation of how incretin recep- trin-releasing peptide receptor (Grpr) was the top marker tor–expressing cell types interact when activated. gene. These neurons expressed Th, Ddc, and Dbh and may play a role in decreased preferences for palatable foods Mapping cis-Regulatory Factors Regulating Incretin seen after intraparenchymal NTS injection of GLP1RA Action in the Hindbrain (36), as DBH-immunoreactive NTS neurons project to the Heritability of obesity is predominantly driven by common nucleus accumbens (a key brain area in food reward proc- genetic variants found mostly within intergenic, gene-regu- essing) (37). In contrast to the AP, Glp1r NTS neurons latory regions distributed throughout the human genome coexpressed Calcr, suggesting that calcitonin and GLP-1 (44). Consequently, insights into hindbrain circuits mediat- activate partly overlapping NTS cell populations. In addi- ing genetic susceptibility to metabolic disease in humans tion, these neurons expressed Mc4r. Following treatment can be inferred by identifying cis-regulatory elements with GLP1RA, genes specific to glutamatergic Glp1r- across relevant hindbrain cell types. Below we outline some expressing AP and NTS neurons were upregulated, includ- of the most popular methods to map candidate cis-regula- ing Bdnf, Ptprn, and Pam, which also colocalize with tory elements and their target genes, and we review our GWAS-associated loci for BMI (16,38,39). In contrast, recent effort to map chromatin accessibility in the DVC to genes expressed in glial cells including astrocytes and oli- identify candidate cell populations mediating genetic risk godendrocytes were downregulated following GLP1RA for obesity. treatment (16). The fact that Glp1r expression was not detected in glial cells in current DVC single-cell atlases Single-Cell Techniques for Mapping cis-Regulatory suggests that glial cells respond indirectly to treatment, Elements and Their Target Genes although other studies have described a role of Glp1r- Enhancers are an important class of cis-regulatory DNA expressing NTS astrocytes in GLP1RA-mediated feeding elements that bind transcription factors and regulate the suppression (40). Moreover, GLP1RA administration did expression of proximal genes. However, enhancers remain not alter expression of genes specific to GLP-1–producing unidentified for the far majority of rodent and human cell glucagon (Gcg) neurons in the NTS (Glu14 in Fig. 1C) types (45). Active enhancers typically reside in DNA
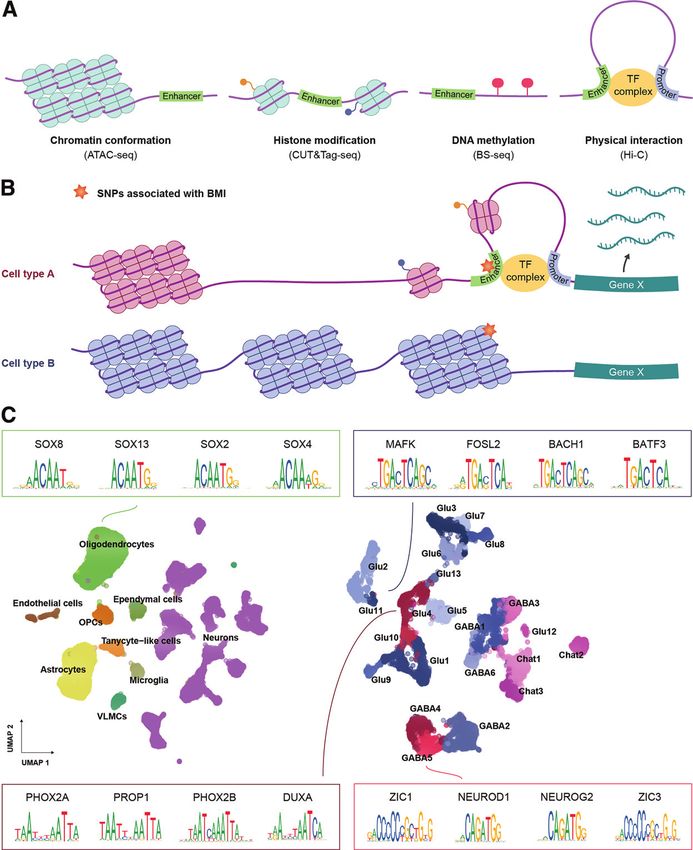
diabetes.diabetesjournals.org                                                                                Ludwig and Associates       5

Figure 1—Combined DVC single-cell transcriptomics atlas highlights distinct groups of incretin receptor cells. A: Graphical illustration of
snRNA-seq of the DVC. B: UMAP plot of 75,785 DVC cells from two independent studies (15,16). The receptors found among the top 100
most specifically expressed genes in oligodendrocytes, the only incretin receptor–expressing glial cell type, are plotted by the normalized
transcript counts in the focal cell type (green) and remaining cells (gray). C: UMAP plot of 51,212 DVC neurons from the combined atlas.
The cell population classifications from the atlas provided by Ludwig et al. (16) have been maintained except for Glu4 neurons, which were
split into three clusters (Glu4a-c) following the classification by Zhang et al. (15). The expression of receptors being part of the top 100
most specifically expressed genes in incretin receptor–expressing neurons is depicted in terms of the normalized transcript counts in the
focal neuronal population (red, AP; blue, NTS) and remaining neurons (gray). OPCs, oligodendrocyte precursor cells; VLMCs, vascular
and leptomeningeal cells.
6       GLP-1 and GIP Receptor Expression in the DVC                                       Diabetes Volume 70, September 2021

stretches devoid of closed chromatin and can be charac-            threshold) of mouse cis-regulatory elements have human
terized by high levels of active histone modifications, low         orthologs, with the majority of these also being cis-regula-
levels of DNA cytosine methylation, and physical interac-          tory elements in humans (55,56).
tions with gene promoter regions (45) (Fig. 2A). Profiling
of open chromatin at single-cell resolution can be accom-          Mapping Chromatin Accessibility and Overlap With
plished by scATAC-seq (single-cell assay for transposase-          Obesity GWAS Signals in the DVC
accessible chromatin using sequencing) (46), which uses a          As part of the above-mentioned DVC snRNA-seq
hyperactive Tn5 transposase that simultaneously cuts and           study, Ludwig et al. (16) profiled the chromatin
tags DNA at accessible regions with sequencing adaptors,           accessibility landscape of the DVC in mice with
enabling DNA in open chromatin to be profiled (47). Sin-            diet-induced obesity exposed to GLP1RA or control
gle-cell profiling of chromatin components such as acety-           treatments for 7 days. The resulting snATAC-seq atlas
lation of lysine 27 at the histone H3 protein (H3K27ac)            comprised 253,452 accessible chromatin regions
(a marker for active transcription) or binding of a tran-          across 22,545 cells spanning 8 distinct glial and 22
scription factor can be performed using scCUT&Tag-seq              neuronal cell populations (Fig. 2C). Transcription fac-
(single-cell cleavage under targets & tagmentation using           tors, potentially involved in establishing and main-
sequencing) (48). Here the protein of interest is bound by         taining cellular identities of incretin receptor cells,
an antibody that recruits a Tn5 transposase–protein A              were identified from enriched transcription factor
fusion protein whereby sequencing adaptors are inte-               binding sites (henceforth referred to here as “motifs”)
                                                                   at accessible chromatin sites (the top four motifs are
grated at chromatin-protein binding sites. Single-cell
                                                                   depicted in Fig. 2C). Glutamatergic Glp1r-expressing
bisulfite-sequencing (scBS-seq) can be applied to measure
                                                                   AP and NTS neurons contained motifs for the PHOX2A
the DNA methylation landscape through the conversion
                                                                   and PHOX2B transcription factors, which are known to
of cytosine to uracil, leaving methylated cytosines unaf-
                                                                   regulate transcription of Dbh (57), consistent with the
fected (49). Lastly, the single-cell Hi-C technique can be
                                                                   noradrenergic profile of these neurons. Upon adminis-
used to determine chromatin interactions (such as
                                                                   tration of GLP1RA, the accessibility of motifs for activ-
enhancer-promoter contacts) by cross-linking and then
                                                                   ity-regulated transcription factor genes in glutamatergic
fragmenting the DNA in a way that allows sequencing
                                                                   Glp1r AP neurons increased, highlighting GLP1RA-
and identification of DNA that are in close proximity in
                                                                   induced reorganization of chromatin in these cells.
the three-dimensional chromosomal organization but dis-
                                                                   GABAergic Gipr neurons displayed a chromatin accessi-
tant in terms of genomic distance (50).
                                                                   bility landscape distinct from that of Glp1r neurons with
   Integration of results from these epigenetic profiling
                                                                   an enrichment of ZIC1 and NEUROD1 motifs across the
techniques into computational models enables prediction of
                                                                   accessible regions.
cell type–specific cis-regulatory elements mediating genetic
                                                                      To investigate whether BMI-associated genetic variants
risk for obesity (Fig. 2B). In epigenetic single-cell data, cell   nonrandomly colocalized with cell population–specific genes
clusters are typically annotated with cell type labels through     and motifs, Ludwig et al. (16) separately integrated DVC
correlation of epigenetic marks at promoter regions and            snRNA-seq and snATAC-seq data with BMI GWAS data.
gene bodies with single-cell transcriptomics data from the         They found that glutamatergic DVC neurons, including
same tissue with use of label-transfer algorithms (26). A          Glp1r-expressing AP and NTS neurons, were enriched for
subsequent key step is to map enhancers to genes. While            BMI-associated genetic variants, suggesting a role of GLP1R
perturbation screens are ultimately needed to establish a          neurons in the predisposition to obesity.
causal link between an enhancer and its target gene,                  In sum, whereas the current mouse chromatin accessibil-
enhancer-gene pairs can to some extent be predicted by cor-        ity atlas of DVC cell populations provides initial understand-
relating chromatin accessibility or differentially methylated      ing of specific transcription factors maintaining cellular
DNA at promoters with enhancer activity at less proximal           identity and regulating GLP1RA-induced activity, key human
sites (51,52). Fulco et al. (53) showed that by profiling mul-      DVC-centric analyses remain to be done, namely, 1) map-
tiple epigenetic layers (chromatin accessibility, H3K27ac          ping of active enhancers under all relevant physiological con-
marks, and three-dimensional chromatin conformation),              ditions, 2) identification of activity-dependent transcription
enhancer-gene prediction can be substantially improved.            factors and their target genes, and 3) identification of BMI-
Having mapped cell type–specific enhancers, machine learn-          associated variants that perturb binding to active enhancers.
ing frameworks can be used to estimate whether genetic
variants impact a transcription factor’s ability to bind a         Spatial Transcriptomics and Sequencing-Based Circuit
given regulatory element (e.g., by using single-cell chroma-       Mapping of the Hindbrain
tin data [54]). While we anticipate that animal models will        In addition to assessing cellular identities at the transcrip-
be valuable for predicting human cis-regulatory elements in        tional and epigenetic level, maturing single-cell spatial
incretin receptor circuits, the divergence between animal          transcriptomics and circuit-mapping technologies have
and human DNA segments must be considered. Between                 the potential to shed light on the spatial locations and
65 and 80% (dependent on the sequence homology                     physical interactions of incretin receptor cells within and
diabetes.diabetesjournals.org Ludwig and Associates 7 Figure 2—Single-cell epigenetic techniques and landscape of incretin receptor DVC cells. A: Graphical illustration of the epigenetic fea- tures regulating enhancer activity. Enhancers typically reside in DNA stretches found in open chromatin, with high levels of active histone marks, devoid of cytosine methylation and in physical proximity to gene promoter regions. These features can be measured at single-cell resolution using the indicated assays. B: Graphical illustration of how single-cell epigenetic profiling can predict cell type–specific enhancers mediating genetic risk to human obesity. Colocalization of a BMI-associated genetic variant with the active enhancer in cell type A suggests that the genetic variant exerts its effect on obesity risk by modifying expression of the associated effector gene X in cell type A (and not cell type B). C: UMAP plots of 22,545 cells and 11,651 neurons from the snATAC-seq atlas provided by Ludwig et al. (16). The top four most enriched motifs in incretin receptor–expressing cells are shown by their position weight matrices; at each position of a given motif, the relative distribution of a given nucleotide is depicted. SNP, single nucleotide polymorphism. TF, transcription factor.
8          GLP-1 and GIP Receptor Expression in the DVC                                    Diabetes Volume 70, September 2021

    Table 1—Summary of spatial transcriptomics profiling technologies
                                                            Reference         Pixel      Number of
    Modality                              Method               no.         resolution   unique genes          Capture area
    Imaging                              RNAscope                77         #1   mm          12                 $1 cm2
                                         MERFISH                 78         #1   mm        10,000                1 cm2
                                         seqFISH                 79         #1   mm        10,000                1 cm2
                                         CARTANA                 80         #1   mm         600                  1 cm2
    Massively parallel sequencing    10x Genomics Visium         81          55 mm          2,500               0.44 cm2
                                         Slide-seqV2             62          10 mm          2,000                 7 mm2
                                         DBiT-seq                63          10 mm          2,000                 1 mm2
                                                                             25 mm            —                 6.25 mm2
                                                                             50 mm          3,700                25 mm2
                                          Seq-Scope              64           1 mm           500         2.2–5.5 mm  125 mm
    Imaging technologies such as RNAscope, MERFISH, seqFISH, and CARTANA have large capture areas and excellent resolution
    while requiring the use of a predefined probe set limited to a smaller number of unique genes. Massively parallel sequencing
    approaches have smaller capture areas and sample from the entire transcriptome, although they capture a fraction of unique
    genes with reduced sensitivity compared with imaging methods. DBiT-seq, deterministic barcoding in tissue for spatial omics
    sequencing; MERFISH, multiplexed error-robust fluorescence in situ hybridization; seqFISH, sequential barcode fluorescence in
    situ hybridization; Seq-Scope, Sequence-Scope.

outside the hindbrain. In the following, we will describe          treatment and other metabolic perturbations potentially
some of the currently available protocols for assessing the        alter local cell-to-cell communication.
spatial organization of incretin receptor–expressing cell
types and sequencing-based methods for tracing their               Toward Mapping of Incretin Receptor–Mediated Neuronal
connectivity.                                                      Circuits
                                                                   In contrast to GABAergic AP neurons, which mostly
Toward Spatial Profiling of Incretin Receptor Expression           innervate cells within the AP and proximal NTS (15), glu-
in the Hindbrain                                                   tamatergic AP and NTS neurons project to targets outside
Spatial transcriptomics facilitates the assignment of cell         the DVC (15,66). Thus, in addition to determination of
types to their spatial locations. The majority of these            the molecular signatures and spatial locations of incretin
methods can be categorized as those that rely on FISH              receptor–expressing cells and their response to agonists,
and those that use massively parallel sequencing to profile         there is a need to identify the circuits in which these cells
the transcriptome (58) (Table 1). FISH-based methods               reside. Conventional mapping techniques using cell filling
enable subcellular resolution (#1 mm) and are sensitive            fluorophores, antigenic tags, or viral expression of fluores-
enough to localize lowly expressed genes such as incretin          cent proteins have provided critical information regarding
receptors. Depending on the technique, anywhere from               the connectivity of the DVC and its subregions (67,68).
ten to a few thousand genes can be profiled in large                The development of Cre-dependent viral tracing tools has
(1 cm2) sections of tissue sections. Computational tools           further refined these approaches by allowing cell-specific
can adequately integrate image-based spatial transcrip-            anterograde tracing from genetically defined DVC cell
tomics with scRNA-seq to locate cell types (59) or impute          populations to their projection targets (66). Monosynaptic
unmeasured genes (59–61). In parallel with FISH-based              rabies tracing technologies have also allowed investigators
spatial transcriptomics, techniques that use sequencing            to map afferent inputs to defined cell types within the
are rapidly improving. Currently available commercial              brain (69,70).
devices and published protocols offer spatial barcoding               Recent approaches have harnessed the power of single-
arrays with resolution from 55 mm to 10 mm (62,63),                cell transcriptomics for better understanding of connec-
while emerging methods push this limit down to 1 mm                tivity in defined neural circuits. MAPseq (multiplexed
(64), making the resolution comparable with that offered           analysis of projections by sequencing) takes advantage of
by FISH-based imaging. A major benefit of sequencing-               the ability to virally express a library of short random bar-
based spatial transcriptomics is its ability to sample the         coded RNAs in a defined brain region and then harvest
entire transcriptome without the need to define a set of            the injected region and projection terminal areas for
genes a priori, although this comes at the cost of lower           sequence analysis (71). As each neuron is labeled with a
sensitivity. While sequencing-based spatial transcriptom-          unique barcode, the presence of barcoded RNAs can be
ics has been performed to construct a spatial atlas of             used to rapidly construct a terminal field map with single-
brain areas from adult mice (65), this data set does not           neuron resolution (71). BARseq (barcoded anatomy
adequately capture the DVC. Future studies will be                 resolved by sequencing) combines MAPseq with in situ
needed to reveal the spatial organization of incretin              sequencing to preserve spatial organization of the termi-
receptor cells in the hindbrain and how incretin                   nal neurons (72). MAPseq and BARseq are not
diabetes.diabetesjournals.org Ludwig and Associates 9
replacements for conventional tracing approaches but, efficient model systems, we envision that future approaches
rather, serve as complementary methods that can provide will use combinations of animal models, induced pluripo-
a level of specificity that is not easily achievable by con- tent stem cells, and postmortem brain setups to map
ventional techniques. retro-seq combines scRNA-seq with enhancers and their target genes. With the growing number
recently developed retrograde viral vectors (73). In this of transgenic mouse models, the ability to resolve molecular
approach, injection of a neuronal projection area with a heterogeneity at the single cell level, and the increasing
virus that has the capacity to travel in a retrograde fash- number of genetic variants associated with obesity, there is
ion results in “tagging” the cell body of interest with an unprecedented opportunity to further understand the
expression of a transgene, allowing for subsequent identi- role of incretin-responsive circuits in metabolic health and
fication and downstream processing (73). For example, to disease.
catalog the specific AP and NTS neuronal populations
that project to the PBN, a retrograde virus expressing a
robust fluorophore could be injected into the PBN. After Acknowledgments. The authors thank the reviewers for their valuable
allowing for retrograde transport and transgene expres- and constructive feedback. The authors also acknowledge the Single-Cell
sion, AP and NTS cells that project to the PBN will Omics Platform at the Novo Nordisk Foundation Center for Basic Metabolic
express the virally encoded fluorophore and would then Research for technical expertise and support.
be amenable to isolation and sequencing. These Funding. Novo Nordisk Foundation Center for Basic Metabolic Research
is an independent research center, based at the University of Copenhagen,
approaches will also require additional reagents/molecular
and partially funded by an unconditional donation from the Novo Nordisk
tools that will allow simultaneous yet independent manip-
Foundation (https://www.cbmr.ku.dk/) (grant NNF18CC0034900). The authors
ulation of neighboring cell types. Moreover, establishing a
acknowledge the Novo Nordisk Foundation (grant NNF16OC0021496 to T.H.P.)
local circuit diagram for incretin receptor-expressing cells
and the Lundbeck Foundation (grant R190-2014-3904 to T.H.P.). Further-
in the AP and NTS will benefit from the application of more, this work was supported by a research grant from the Danish Diabe-
additional functional techniques including electrophysiol- tes Academy, which is funded by the Novo Nordisk Foundation (grant
ogy and channelrhodopsin-assisted circuit mapping. In NNF17SA0031406). Finally, this work has been supported by the National
sum, integration of conventional mapping techniques Institute of Diabetes and Digestive and Kidney Diseases (grants R01
with cell-specific labeling approaches and sequencing has DK104999 and P01 DK117821).
the promise to deepen our understanding of the neural Duality of Interest. No potential conflicts of interest relevant to this
circuits in which incretin receptor–expressing cells reside article were reported.
and operate. Author Contributions. M.Q.L., P.V.T., K.L.E., D.P.O., and T.H.P. wrote
the manuscript. T.H.P. is the guarantor of this work and, as such, had full
Future Avenues access to all the data in the study and takes responsibility for the integrity of
We are just in the beginning of understanding how hind- the data and the accuracy of the data analysis.
brain incretin-sensing circuits control satiety and respond
References
to physiological stimuli. Although we have described
1. Baggio LL, Drucker DJ. Biology of incretins: GLP-1 and GIP. Gastro-
single-cell sequencing as measures of only one modality,
enterology 2007;132:2131–2157
single-cell approaches for profiling different layers of
2. Srivastava G, Apovian CM. Current pharmacotherapy for obesity. Nat Rev
information in the same cell are starting to emerge and Endocrinol 2018;14:12–24
have great potential to improve our understanding of 3. Frias JP, Nauck MA, Van J, et al. Efficacy and safety of LY3298176, a
cellular mechanisms controlling energy balance. Several novel dual GIP and GLP-1 receptor agonist, in patients with type 2 diabetes: a
single-cell and spatial methods have the capacity for randomised, placebo-controlled and active comparator-controlled phase 2
simultaneous assessment of gene expression with chroma- trial. Lancet 2018;392:2180–2193
tin accessibility, histone modifications, or DNA methyla- 4. Turcot V, Lu Y, Highland HM, et al.; CHD Exome1 Consortium; EPIC-CVD
tion (74–76), allowing one to directly link the epigenome Consortium; ExomeBP Consortium; Global Lipids Genetic Consortium; GoT2D
with gene expression abundance. Likewise, it is possible to Genes Consortium; EPIC InterAct Consortium; INTERVAL Study; ReproGen
jointly profile multiple layers of epigenetic marks at single- Consortium; T2D-Genes Consortium; MAGIC Investigators; Understanding
cell resolution (76). We anticipate that with the emergence Society Scientific Group. Protein-altering variants associated with body mass
of multimodal profiling techniques and sophisticated index implicate pathways that control energy intake and expenditure in
obesity. Nat Genet 2018;50:26–41
machine learning prediction models all relevant enhancer-
5. NamKoong C, Kim MS, Jang BT, Lee YH, Cho YM, Choi HJ. Central
gene pairs across the hindbrain will gradually be mapped.
administration of GLP-1 and GIP decreases feeding in mice. Biochem Biophys
Once enhancers have been mapped they can be overlaid
Res Commun 2017;490:247–252
with human GWAS data; cell types with enriched colocaliza- 6. Sisley S, Gutierrez-Aguilar R, Scott M, D’Alessio DA, Sandoval DA, Seeley
tion of active enhancers and fine-mapped genetic associa- RJ. Neuronal GLP1R mediates liraglutide’s anorectic but not glucose-lowering
tion signals will provide important starting points to effect. J Clin Invest 2014;124:2456–2463
identify causal genes and hindbrain circuits mediating 7. Killion EA, Wang J, Yie J, et al. Anti-obesity effects of GIPR antagonists
genetic susceptibility to human obesity. Whereas induced alone and in combination with GLP-1R agonists in preclinical models. Sci
pluripotent stem cells appear as the most promising and Transl Med 2018;10:eaat339210 GLP-1 and GIP Receptor Expression in the DVC Diabetes Volume 70, September 2021 8. Kaneko K, Fu Y, Lin H-Y, et al. Gut-derived GIP activates central Rap1 to impair 28. Luecken MD, Theis FJ. Current best practices in single-cell RNA-seq neural leptin sensitivity during overnutrition. J Clin Invest 2019;129:3786–3791 analysis: a tutorial. Mol Syst Biol 2019;15:e8746 9. Gabery S, Salinas CG, Paulsen SJ, et al. Semaglutide lowers body weight 29. Gaublomme JT, Li B, McCabe C, et al. Nuclei multiplexing with barcoded in rodents via distributed neural pathways. JCI Insight 2020;5:133429 antibodies for single-nucleus genomics. Nat Commun 2019;10:2907 10. Grill HJ, Hayes MR. Hindbrain neurons as an essential hub in the 30. Stoeckius M, Hafemeister C, Stephenson W, et al. Simultaneous epitope and neuroanatomically distributed control of energy balance. Cell Metab 2012; transcriptome measurement in single cells. Nat Methods 2017;14:865–868 16:296–309 31. Chung H, Parkhurst CN, Magee EM, et al. Simultaneous single cell 11. Merchenthaler I, Lane M, Shughrue P. Distribution of pre-pro-glucagon measurements of intranuclear proteins and gene expression. bioRxiv. 2021 and glucagon-like peptide-1 receptor messenger RNAs in the rat central Jan 19;2021.01.18.427139. nervous system. J Comp Neurol 1999;403:261–280 32. Zhang MJ, Ntranos V, Tse D. Determining sequencing depth in a single- 12. Heppner KM, Kirigiti M, Secher A, et al. Expression and distribution of cell RNA-seq experiment. Nat Commun 2020;11:774 glucagon-like peptide-1 receptor mRNA, protein and binding in the male 33. Amamoto R, Garcia MD, West ER, et al. Probe-Seq enables nonhuman primate (Macaca mulatta) brain. Endocrinology 2015;156:255–267 transcriptional profiling of specific cell types from heterogeneous tissue by 13. Jensen CB, Pyke C, Rasch MG, Dahl AB, Knudsen LB, Secher A. RNA-based isolation. ELife 2019;8:e51452 Characterization of the glucagonlike peptide-1 receptor in male mouse brain 34. Cork SC, Richards JE, Holt MK, Gribble FM, Reimann F, Trapp S. Distribution using a novel antibody and in situ hybridization. Endocrinology 2018;159: and characterisation of glucagon-like peptide-1 receptor expressing cells in the 665–675 mouse brain. Mol Metab 2015;4:718–731 14. Adams JM, Pei H, Sandoval DA, et al. Liraglutide modulates appetite 35. Williams DL, Kaplan JM, Grill HJ. The role of the dorsal vagal complex and body weight through glucagon-like peptide 1 receptor–expressing and the vagus nerve in feeding effects of melanocortin-3/4 receptor glutamatergic neurons. Diabetes 2018;67:1538–1548 stimulation. Endocrinology 2000;141:1332–1337 15. Zhang C, Kaye JA, Cai Z, Wang Y, Prescott SL, Liberles SD. Area 36. Richard JE, Anderberg RH, G€oteson A, Gribble FM, Reimann F, Skibicka postrema cell types that mediate nausea-associated behaviors. Neuron KP. Activation of the GLP-1 receptors in the nucleus of the solitary tract 2021;109:461–472.e5 reduces food reward behavior and targets the mesolimbic system. PLoS One 16. Ludwig MQ, Cheng W, Gordian D, et al. A genetic map of the mouse 2015;10:e0119034 dorsal vagal complex and its role in obesity. Nat Metab 2021;3:530–545 37. Olson VG, Heusner CL, Bland RJ, During MJ, Weinshenker D, Palmiter 17. Adriaenssens AE, Biggs EK, Darwish T, et al. Glucose-dependent RD. Role of noradrenergic signaling by the nucleus tractus solitarius in insulinotropic polypeptide receptor-expressing cells in the hypothalamus mediating opiate reward. Science 2006;311:1017–1020 regulate food intake. Cell Metab 2019;30:987–996.e6 38. Locke AE, Kahali B, Berndt SI, et al.; LifeLines Cohort Study; ADIPOGen 18. Holt MK, Richards JE, Cook DR, et al. Preproglucagon neurons in the Consortium; AGEN-BMI Working Group; CARDIOGRAMplusC4D Consortium; nucleus of the solitary tract are the main source of brain GLP-1, mediate CKDGen Consortium; GLGC; ICBP; MAGIC Investigators; MuTHER Consortium; stress-induced hypophagia, and limit unusually large intakes of food. Diabetes MIGen Consortium; PAGE Consortium; ReproGen Consortium; GENIE 2019;68:21–33 Consortium; International Endogene Consortium. Genetic studies of body 19. Hayes MR, Leichner TM, Zhao S, et al. Intracellular signals mediating the mass index yield new insights for obesity biology. Nature 2015;518: food intake-suppressive effects of hindbrain glucagon-like peptide-1 receptor 197–206 activation. Cell Metab 2011;13:320–330 39. Kichaev G, Bhatia G, Loh P-R, et al. Leveraging polygenic functional 20. Baraboi E-D, Smith P, Ferguson AV, Richard D. Lesions of area postrema enrichment to improve GWAS power. Am J Hum Genet 2019;104:65–75 and subfornical organ alter exendin-4-induced brain activation without 40. Reiner DJ, Mietlicki-Baase EG, McGrath LE, et al. Astrocytes regulate GLP-1 preventing the hypophagic effect of the GLP-1 receptor agonist. Am J Physiol receptor-mediated effects on energy balance. J Neurosci 2016;36:3531–3540 Regul Integr Comp Physiol 2010;298:R1098–R1110 41. Brierley DI, Holt MK, Singh A, et al. Central and peripheral GLP-1 systems 21. Secher A, Jelsing J, Baquero AF, et al. The arcuate nucleus mediates independently suppress eating. Nat Metab 2021;3:258–273 GLP-1 receptor agonist liraglutide-dependent weight loss. J Clin Invest 2014; 42. Guan JL, Wang QP, Shioda S, Ochiai H, Nakai Y. GABAergic synaptic 124:4473–4488 innervation of catecholaminergic neurons in the area postrema of the rat. Acta 22. Fortin SM, Lipsky RK, Lhamo R, et al. GABA neurons in the nucleus Anat (Basel) 1996;156:46–52 tractus solitarius express GLP-1 receptors and mediate anorectic effects of 43. Dowsett GKC, Lam BYH, Tadross JA, et al. A survey of the mouse liraglutide in rats. Sci Transl Med 2020;12:eaay8071 hindbrain in the fed and fasted states using single-nucleus RNA sequencing. 23. Bakken TE, Hodge RD, Miller JA, et al. Single-nucleus and single- Mol Metab 2021;53:101240 cell transcriptomes compared in matched cortical cell types. PLoS One 44. Gusev A, Lee SH, Trynka G, et al.; Schizophrenia Working Group of the 2018;13:e0209648 Psychiatric Genomics Consortium; SWE-SCZ Consortium; Schizophrenia 24. Thierry-Mieg D, Thierry-Mieg J. AceView: a comprehensive cDNA- Working Group of the Psychiatric Genomics Consortium; SWE-SCZ Consortium. supported gene and transcripts annotation. Genome Biol 2006;7(Suppl. 1): Partitioning heritability of regulatory and cell-type-specific variants across 11 S12.1–14 common diseases. Am J Hum Genet 2014;95:535–552 25. Ziegenhain C, Vieth B, Parekh S, et al. Comparative analysis of single-cell 45. Nord AS, West AE. Neurobiological functions of transcriptional enhancers. RNA sequencing methods. Mol Cell 2017;65:631–643.e4 Nat Neurosci 2020;23:5–14 26. Luecken MD, B€uttner M, Chaichoompu K, et al. Benchmarking atlas-level 46. Buenrostro JD, Giresi PG, Zaba LC, Chang HY, Greenleaf WJ. data integration in single-cell genomics. 27 May 2020 [preprint]. bioRxiv: Transposition of native chromatin for fast and sensitive epigenomic profiling of 2020.05.22.111161 open chromatin, DNA-binding proteins and nucleosome position. Nat Methods 27. Armingol E, Officer A, Harismendy O, Lewis NE. Deciphering cell-cell 2013;10:1213–1218 interactions and communication from gene expression. Nat Rev Genet 47. Klemm SL, Shipony Z, Greenleaf WJ. Chromatin accessibility and the 2021;22:71–88 regulatory epigenome. Nat Rev Genet 2019;20:207–220
diabetes.diabetesjournals.org                                                                                                 Ludwig and Associates            11

48. Kaya-Okur HS, Wu SJ, Codomo CA, et al. CUT&Tag for efficient                    65. Ortiz C, Navarro JF, Jurek A, M€artin A, Lundeberg J, Meletis K. Molecular
epigenomic profiling of small samples and single cells. Nat Commun 2019;            atlas of the adult mouse brain. Sci Adv 2020;6:eabb3446
10:1930                                                                            66. Cheng W, Gonzalez I, Pan W, et al. Calcitonin receptor neurons in the
49. Smallwood SA, Lee HJ, Angermueller C, et al. Single-cell genome-wide           mouse nucleus tractus solitarius control energy balance via the non-aversive
bisulfite sequencing for assessing epigenetic heterogeneity. Nat Methods            suppression of feeding. Cell Metab 2020;31:301–312.e5
2014;11:817–820                                                                    67. Han W, Tellez LA, Perkins MH, et al. A neural circuit for gut-induced
50. Nagano T, Lubling Y, Stevens TJ, et al. Single-cell Hi-C reveals cell-to-      reward. Cell 2018;175:665–678.e23
cell variability in chromosome structure. Nature 2013;502:59–64                    68. Holt MK, Pomeranz LE, Beier KT, Reimann F, Gribble FM, Rinaman L.
51. Cusanovich DA, Hill AJ, Aghamirzaie D, et al. A single-cell atlas of in vivo   Synaptic inputs to the mouse dorsal vagal complex and its resident
mammalian chromatin accessibility. Cell 2018;174:1309–1324.e18                     preproglucagon neurons. J Neurosci 2019;39:9767–9781
52. Liu H, Zhou J, Tian W, et al. DNA methylation atlas of the mouse brain at      69. Callaway EM, Luo L. Monosynaptic circuit tracing with glycoprotein-
single-cell resolution. 30 April 2020 [preprint]. bioRxiv:2020.04.30.069377        deleted rabies viruses. J Neurosci 2015;35:8979–8985
53. Fulco CP, Nasser J, Jones TR, et al. Activity-by-contact model of              70. Lavin TK, Jin L, Wickersham IR. Monosynaptic tracing: a step-by-step
enhancer-promoter regulation from thousands of CRISPR perturbations. Nat           protocol. J Chem Neuroanat 2019;102:101661
Genet 2019;51:1664–1669                                                            71. Kebschull JM, Garcia da Silva P, Reid AP, Peikon ID, Albeanu DF, Zador
54. Corces MR, Shcherbina A, Kundu S, et al. Single-cell epigenomic                AM. High-throughput mapping of single-neuron projections by sequencing of
analyses implicate candidate causal variants at inherited risk loci for            barcoded RNA. Neuron 2016;91:975–987
Alzheimer’s and Parkinson’s diseases. Nat Genet 2020;52:1158–1168                  72. Chen X, Sun Y-C, Zhan H, et al. High-throughput mapping of long-range
55. Moore JE, Purcaro MJ, Pratt HE, et al.; ENCODE Project Consortium.
                                                                                   neuronal projection using in situ sequencing. Cell 2019;179:772–786.e19
Expanded encyclopaedias of DNA elements in the human and mouse
                                                                                   73. Tasic B, Yao Z, Graybuck LT, et al. Shared and distinct transcriptomic
genomes. Nature 2020;583:699–710
                                                                                   cell types across neocortical areas. Nature 2018;563:72–78
56. Yue F, Cheng Y, Breschi A, et al.; Mouse ENCODE Consortium. A
                                                                                   74. Kashima Y, Sakamoto Y, Kaneko K, Seki M, Suzuki Y, Suzuki A. Single-
comparative encyclopedia of DNA elements in the mouse genome. Nature
                                                                                   cell sequencing techniques from individual to multiomics analyses. Exp Mol
2014;515:355–364
                                                                                   Med 2020;52:1419–1427
57. Yang C, Kim HS, Seo H, Kim CH, Brunet JF, Kim KS. Paired-like
                                                                                   75. Zhu C, Zhang Y, Li YE, Lucero J, Behrens MM, Ren B. Joint profiling of
homeodomain proteins, Phox2a and Phox2b, are responsible for noradrenergic
                                                                                   histone modifications and transcriptome in single cells from mouse brain. Nat
cell-specific transcription of the dopamine beta-hydroxylase gene. J Neurochem
                                                                                   Methods 2021;18:283–292
1998;71:1813–1826
                                                                                   76. Luo C, Liu H, Xie F, et al. Single nucleus multi-omics links human
58. Waylen LN, Nim HT, Martelotto LG, Ramialison M. From whole-mount to
                                                                                   cortical cell regulatory genome diversity to disease risk variants. 12 December
single-cell spatial assessment of gene expression in 3D. Commun Biol
2020;3:602                                                                         2019 [preprint]. bioRxiv:2019.12.11.873398
59. Stuart T, Butler A, Hoffman P, et al. Comprehensive integration of single-     77. Wang F, Flanagan J, Su N, et al. RNAscope: a novel in situ RNA analysis
cell data. Cell 2019;177:1888–1902.e21                                             platform for formalin-fixed, paraffin-embedded tissues. J Mol Diagn 2012;
60. Nitzan M, Karaiskos N, Friedman N, Rajewsky N. Gene expression                 14:22–29
cartography. Nature 2019;576:132–137                                               78. Moffitt JR, Zhuang X. RNA imaging with multiplexed error-robust
61. Abdelaal T, Mourragui S, Mahfouz A, Reinders MJT. SpaGE: Spatial Gene          fluorescence in situ hybridization (MERFISH). Methods Enzymol 2016;572:1–49
Enhancement using scRNA-seq. Nucleic Acids Res 2020;48:e107                        79. Shah S, Lubeck E, Zhou W, Cai L. In situ transcription profiling of single
62. Stickels RR, Murray E, Kumar P, et al. Highly sensitive spatial                cells reveals spatial organization of cells in the mouse hippocampus. Neuron
transcriptomics at near-cellular resolution with Slide-seqV2. Nat Biotechnol       2016;92:342–357
2021;39:313–319                                                                    80. Hernandez I, Qian X, Lalakova J, Verheyen T, Hilscher M, K€uhnemund M.
63. Liu Y, Yang M, Deng Y, et al. High-spatial-resolution multi-omics              Application note: mapping brain cell types with CARTANA in situ sequencing
sequencing via deterministic barcoding in tissue. Cell 2020;183:                   on the Nikon Ti2-E microscope. Accessed 19 May, 2021. Available from
1665–1681.e18                                                                      https://www.nature.com/articles/d42473-019-00264-8
64. Cho C-S, Xi J, Park S-R, et al. Seq-Scope: submicrometer-resolution            81. Ståhl PL, Salmen F, Vickovic S, et al. Visualization and analysis of gene
spatial transcriptomics for single cell and subcellular studies. 27 January        expression in tissue sections by spatial transcriptomics. Science 2016;
2021 [preprint]. bioRxiv:2021.01.25.427807                                         353:78–82
You can also read