Effect of Phosphorylated Tau on Cortical Pyramidal Neuron Morphology during Hibernation
←
→
Page content transcription
If your browser does not render page correctly, please read the page content below
Cerebral Cortex Communications, 2020, 1, 1–25

                                                                            doi: 10.1093/texcom/tgaa018
                                                                            Original Article

ORIGINAL ARTICLE

                                                                                                                                                        Downloaded from https://academic.oup.com/cercorcomms/article/1/1/tgaa018/5841606 by guest on 15 November 2020
Effect of Phosphorylated Tau on Cortical Pyramidal
Neuron Morphology during Hibernation
Mamen Regalado-Reyes1 , Ruth Benavides-Piccione1,2 ,
Isabel Fernaud-Espinosa1 , Javier DeFelipe1,2 and Gonzalo León-Espinosa1,3,
1 Laboratorio Cajal de Circuitos Corticales, Centro de Tecnología Biomédica, Universidad Politécnica de Madrid,
Madrid 28002, Spain, 2 Instituto Cajal, Consejo Superior de Investigaciones Científicas, Madrid 28002, Spain and
3 Facultad de Farmacia, Departamento de Química y Bioquímica, Universidad San Pablo-CEU, CEU Universities,

Urbanización Montepríncipe, Boadilla del Monte, Madrid 28660, Spain
Address correspondence to Gonzalo León-Espinosa, Facultad de Farmacia, Departamento de Química y Bioquímica, Universidad San Pablo-CEU, CEU
Universities, Urbanización Montepríncipe, Boadilla del Monte, Madrid 28660, Spain. Email: gonzalo.leonespinosa@ceu.es.

Abstract
The dendritic spines of pyramidal cells are the main postsynaptic target of excitatory glutamatergic synapses. Morphological
alterations have been described in hippocampal dendritic spines during hibernation—a state of inactivity and metabolic
depression that occurs via a transient neuronal tau hyperphosphorylation. Here, we have used the hibernating Syrian
hamster to investigate the effect of hyperphosphorylated tau regarding neocortical neuronal structure. In particular, we
examined layer Va pyramidal neurons. Our results indicate that hibernation does not promote significant changes in
dendritic spine density. However, tau hyperphosphorylated neurons show a decrease in complexity, an increase in the
tortuosity of the apical dendrites, and an increase in the diameter of the basal dendrites. Tau protein hyperphosphorylation
and aggregation have been associated with loss or alterations of dendritic spines in neurodegenerative diseases, such as
Alzheimer’s disease (AD). Our results may shed light on the correlation between tau hyperphosphorylation and the
neuropathological processes in AD. Moreover, we observed changes in the length and area of the apical and basal dendritic
spines during hibernation regardless of tau hyperphosphorylation. The morphological changes observed here also suggest
region specificity, opening up debate about a possible relationship with the differential brain activity registered in these
regions in previous studies.

Key words: 3D reconstructions, cerebral cortex, dendrites, dendritic spines, Syrian hamster

Introduction                                                                participates in axonal transport, synaptic function, and in other
Tau is a protein that belongs to the family of the microtubule-             novel processes beyond its habitual function as microtubule-
associated proteins. Under physiological conditions, tau protein            regulating protein (Medina et al. 2016; Wang and Mandelkow
binds microtubules by tubulin interaction and participates in               2016; Sotiropoulos et al. 2017; Ittner and Ittner 2018). The bio-
their assembly and stabilization, thus allowing reorganization              logical activity of tau is mainly regulated by post-translational
of the cytoskeleton (Weingarten et al. 1975). In addition, tau              modifications, particularly phosphorylation (Gong et al. 2010;

Received: 2 May 2020; Accepted: 3 May 2020

© The Author(s) 2020. Published by Oxford University Press.
This is an Open Access article distributed under the terms of the Creative Commons Attribution License (http://creativecommons.org/licenses/by/4.0/),
which permits unrestricted reuse, distribution, and reproduction in any medium, provided the original work is properly cited.

                                                                                                                                               1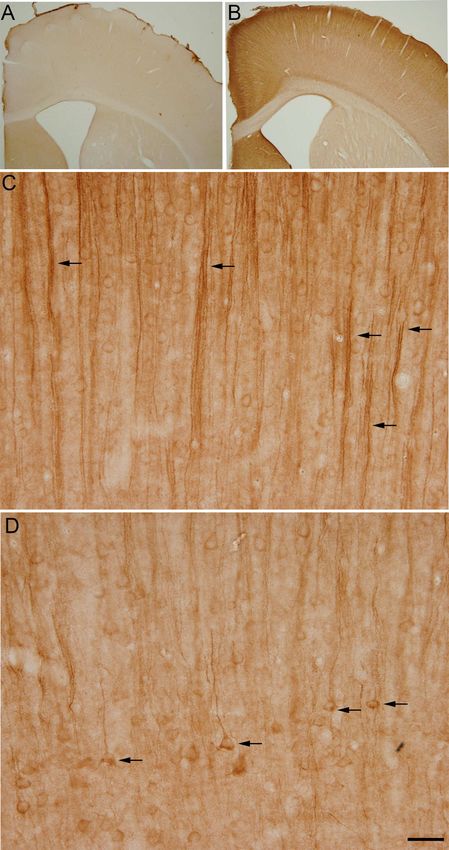
2     Cerebral Cortex Communications, 2020, Vol. 1, No. 1

Iqbal et al. 2016). Specifically, phosphorylated tau loses affin-      shorter and less branched) and a reduction in spine density of
ity for microtubules, promoting their destabilization, leading to      hippocampal CA3 pyramidal neurons during the hibernation of
cytoskeleton instability. Tau is predominantly distributed in the      ground squirrels (Spermophilus citellus) (Popov et al. 1992). These
axon of healthy mature neurons, but, in Alzheimer’s Disease (AD)       changes were fully reversed upon emerging from hibernation
and other tauopathies, tau protein is hyperphosphorylated and,         (arousal). In a later study, von der Ohe observed that arborization
aberrantly, moves to the somatodendritic compartment where             retraction also occurred in layer IV cortical spiny stellate neurons
it aggregates to form paired helical filaments (PFH) (Iqbal et al.     and in thalamus and suggested a linear relationship between this
2016). PHF are the major component of neurofibrillary tangles,         retraction and the drop in body temperature (von der Ohe et al.
which are a hallmark of AD. Several antibodies against the main        2006). Other similar studies revealed the loss of synaptic protein
phosphorylation sites have been designed to study tau hyper-           clustering and confirmed hypothermia as a trigger (Popov et al.
phosphorylation. Among them, AT8 antibody, which detects tau           2007; von der Ohe et al. 2007). Moreover, Magariños et al. reported
phosphorylation at residues Ser202 and Thr205, is an important         the loss of dendritic spines and reduced apical dendritic tree

                                                                                                                                              Downloaded from https://academic.oup.com/cercorcomms/article/1/1/tgaa018/5841606 by guest on 15 November 2020
one to highlight, as it is the most commonly antibody used to          complexity in CA3 neurons from hibernating European hamsters
classify the degree of pathology during the development of AD          (Cricetus cricetus). Interestingly, basal dendritic trees remained
(Braak and Braak 1995).                                                unaltered, and no variations in spine density were detected in
    In the mammalian cerebral cortex, pyramidal cells are the          CA1 pyramidal neurons (Magariños et al. 2006). A more recent
most abundant neurons, estimated to represent 70–80% of the            study showed a transient spine reduction in apical dendrites of
total neuronal population. They are excitatory and represent           hippocampal pyramidal cells (CA1 and CA3) during the hiberna-
the majority of the projecting cells of the cerebral cortex. Fur-      tion of the Syrian hamster and ruled out a memory impairment
thermore, they constitute the major source of cortical excitatory      because of the seasonal and repeated neuronal changes (Bull-
synapses, and their dendritic spines are the principal cortical        mann et al. 2016).
postsynaptic targets of excitatory synapses (DeFelipe and Fariñas          Hibernation is a useful model to study tau phosphorylation
1992; Kanari et al. 2019). Thus, pyramidal cells are considered        and dephosphorylation events: labeling with PHF-like epitopes
the main building blocks of the cerebral cortex. Differences in        revealed that tau is reversibly hyperphosphorylated in torpid
the patterns of dendritic branching may determine the degree           animal neurons (Arendt et al. 2003). In this regard, Bullmann and
to which the integration of inputs is compartmentalized within         colleagues also proposed tau hyperphosphorylation as one of
their arbors (Koch et al. 1982; Spruston 2008). Furthermore, dif-      the main elements involved in the reversible synaptic regression
ferences in the density of dendritic spines indicate differences in    (Bullmann et al. 2016). Thus, mammalian hibernation allows
the number of excitatory synaptic inputs and may also influence        us to analyze the transient tau protein hyperphosphorylation
the local summation of postsynaptic potentials or the coop-            through a natural nontransgenic animal model.
erativity between inputs (e.g., Shepherd et al. 1985; Spruston             To date, there are no detailed studies of dendritic spine mor-
2008). Therefore, elucidating the effect of tau phosphorylation on     phology in the neocortex of any hibernating species and the
pyramidal neuron structure may shed light on the alterations of        direct relationship between tau hyperphosphorylation and the
the integration of inputs that take place in AD.                       morphological neuronal changes in cortical neurons needs fur-
    Synapse loss has been documented in the hippocampal neu-           ther analysis. Here, we investigated whether tau hyperphos-
rons of P301S mutant human tau transgenic mice (Yoshiyama              phorylated layer Va neocortical pyramidal neurons display any
et al. 2007). In addition, tau mislocalization to dendritic spines     morphological alterations during the hibernation of the Syrian
has been reported to cause early synaptic dysfunction by sup-          hamster.
pression of the AMPA receptor-mediated synaptic responses in a
mouse model expressing P301L human tau (Hoover et al. 2010). In        Materials and Methods
human AD samples, the accumulation of hyperphosphorylated
tau in a pretangle state does not seem to induce changes in
                                                                       Syrian Hamsters
the dendrites of pyramidal neurons, whereas the presence               A total of 14 male 4-month-old Syrian hamsters were purchased
of intraneuronal neurofibrillary tangles has been associated           from Janvier Labs. These animals had free access to food and
with loss of dendritic spines and dendrite atrophy, including          water and were kept at 23 ◦ C with an 8:16 h light:dark cycle
alterations in dendritic spine head volume and dendritic spine         for a 4–6 week acclimatization period in our animal facility.
length (Merino-Serrais et al. 2013). Importantly, tau pathology        Subsequently, as described in Antón-Fernández et al. (2015), in
is correlated with cognitive impairment progression in AD              order to obtain the torpor experimental group, 7 of the animals
(Nelson et al. 2012).                                                  were transferred to a special chamber which makes it possible
    Hibernation is described as a period in which some winter-         to gradually reduce the temperature (via LM35 sensors), control
adapted animals save energy by entering a dormant state called         the illumination (adjustable LED RGB), and monitor the hamsters
torpor. In some small mammals, such as the Syrian hamster              by measuring the general locomotor activity with a PIR (passive
(Mesocricetus auratus), torpor is characterized by reduced body        infrared) sensor mounted on top of each cage. In addition, we
temperature and metabolic rate that can last for 3–4 days. Mul-        recorded all data obtained in a notebook computer, distinguish-
tiple bouts of torpor, interspersed with short arousal periods         ing between the torpor and arousal phases during hibernation
of activity and normothermia, occur until favorable conditions         using the software package Fastwinter 1.9 (developed by Tiselius
appear again (Ruf and Geiser 2015). The Syrian hamster is a            s.l.). Hibernating animals were considered to be torpid when they
facultative hibernator, which means that it may enter hiberna-         had been inactive for at least 24 h. The status of the animals
tion artificially when exposed to a short-day photoperiod and          was confirmed by body temperature measurements (infrared
cold temperature (Chayama et al. 2016). Previous studies have          thermometer) since the body temperature of a hibernating ani-
demonstrated that the brain of these animals undergoes com-            mal falls to almost 5 ◦ C, whereas it is about 35 ◦ C in euthermic
plex adaptive and reversible changes that are supposed to protect      animals. Since torpor bouts (periods of time a hibernator spends
the brain from hypoxia and hypothermia. In 1992, Popov and col-        at low body temperature) are nonregular at the start of hiber-
leagues described a retraction of dendritic trees (i.e., they became   nation, we considered animals torpid and ready to be sacrificed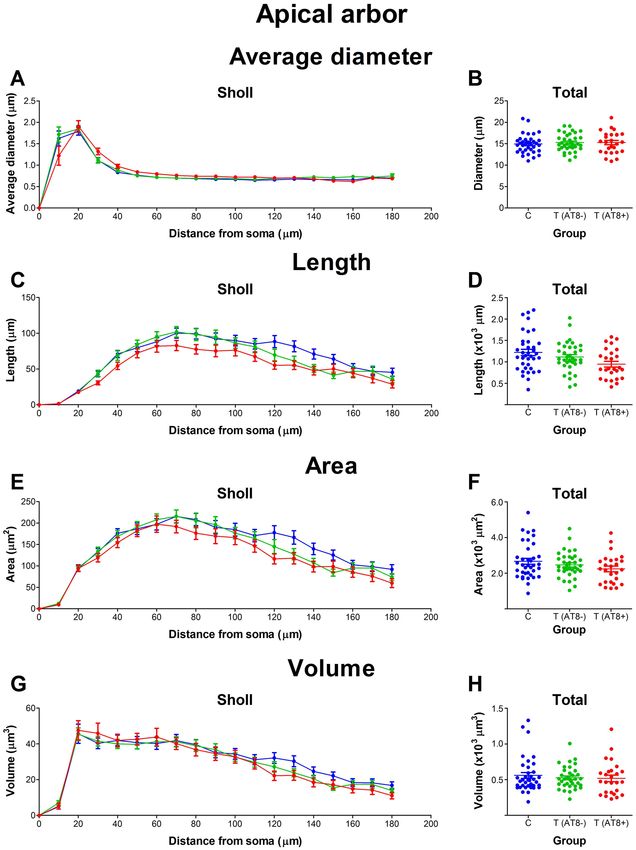
Effect of Phosphorylated Tau on Cortical Pyramidal Neuron Morphology during Hibernation               Regalado-Reyes et al.       3

only when they had completed 3 full torpor bouts. Hamsters were       (1:400 000; generated at the Instituto Cajal, Madrid) diluted in
sacrificed at 36–48 h of torpor—the period when the brain has         stock solution (2% bovine serum albumin, 1% Triton X-100,
been described as displaying the highest levels of hyperphospho-      and 5% sucrose in PB) for 48 h. Immunostaining for LY (in
rylated tau (Bullmann et al. 2016).                                   stock solution) was maintained for a further 48 h, together
    All experimental procedures were carried out at the animal        with antiPHF-tauAT8 (mouse; 1:2000 in stock solution; MN1020,
facility in the San Pablo CEU University of Madrid (SVA-CEU.USP,      Pierce Endogen). AntiPHF-tauAT8 binding was detected with a
registration number ES 28022 0000015) in accordance with the          biotinylated horse anti-mouse secondary antibody (1:200 in stock
European Union Directive (2010/63/CE) and the approval of the         solution; BA-2000, Vector), followed by a mixture of Alexa Fluor
institutional Animal Experiment Ethics Committee (No. PROEX           488 anti-rabbit (1:1000 in 0.1 M PB) and streptavidin coupled
292/15).                                                              to Alexa Fluor 594 (1:1000 in 0.1 M PB; Molecular Probes). The
                                                                      sections were then mounted with ProLong Gold Antifade Reagent
                                                                      (Invitrogen Corporation) and stored at −20 ◦ C. See (Elston et al.

                                                                                                                                            Downloaded from https://academic.oup.com/cercorcomms/article/1/1/tgaa018/5841606 by guest on 15 November 2020
Tissue Preparation
                                                                      2001; Benavides-Piccione and DeFelipe 2003) for further details
Animals were sacrificed by a lethal intraperitoneal injection of      of the cell injection method.
sodium pentobarbital (200 mg/kg) and were then perfused intrac-
ardially with a saline solution followed by 4% paraformaldehyde
                                                                      Image Acquisition
in 0.1 M phosphate buffer (PB, pH 7.4). The brain of each animal
was removed and postfixed by immersion in the same fixative for       Following the method described in Benavides-Piccione et al.
24 h at 4 ◦ C. Serial coronal sections (200 µm thick) were obtained   (2013), imaging was performed with a Zeiss LSM 710 confocal
with a vibratome (St Louis, MO, USA) and kept in 0.1 M PBS            microscope coupled to an Axio Observer inverted microscope
(phosphate buffer saline).                                            (Zeiss), recording Alexa 488 (green) and 594 (red) fluorescence
                                                                      through separate channels. For cell reconstruction, consecutive
                                                                      stacks of images at high magnification (×63 glycerol; voxel size,
DAB Immunostaining
                                                                      0.110 × 0.110 × 0.350 µm) were acquired to capture dendrites
Free-floating sections were pretreated with 1.66% H2 O2 for           along the apical and basal dendritic arbors. For dendritic spine
30 min to quench the endogenous peroxidase activity and               reconstruction, consecutive stacks of images at high magnifi-
then for 1 h in PB with 0.25% Triton-X and 3% normal goat             cation (×63 glycerol; voxel size: 0.057 × 0.057 × 0.140) were
serum (Vector Laboratories). The sections were then incubated         acquired to capture dendritic spines along the length of the
overnight at 4 ◦ C with a mouse antiPHF-tauAT8 antibody (Pierce       main apical dendrite. It is important to note that, for each stack,
Endogen, 1:2000), and the following day they were rinsed and          the laser intensity and detector sensitivity were set such that
incubated for 1 h in biotinylated goat anti-mouse IgG (1:200;         the fluorescence signal from the dendritic spines occupied the
Vector Laboratories). Antibody binding was detected with a            full dynamic range of the detector. Therefore, some pixels were
Vectastain ABC immunoperoxidase kit (Vector Laboratories)             saturated in the dendritic shaft, but no pixels were saturated
and visualized with the chromogen 3,3′ -diaminobenzidine              within the dendritic spines.
tetrahydrochloride (DAB; Sigma-Aldrich). After staining, the
sections were dehydrated, cleared with xylene, and covered-
                                                                      Cell Reconstruction and Quantitative Analysis
slipped (DePeX; Merck KGaA 100579).
                                                                      The morphological analysis was performed in 3D using Neurolu-
                                                                      cida 360 (MBF Bioscience) and included 90 cells, from which
Intracellular Injections and Immunocytochemistry
                                                                      33 cells belonged to the T(AT8−) group, 27 cells belonged
Sections from both hemispheres were prelabeled with 4,6-              to the T(AT8+) group, and 30 cells belonged to the control
diamidino-2-phenylindole (DAPI; Sigma), and a continuous              group.
current was used to blindly inject individual cells with Lucifer         Briefly, apical and basal arbors were described through 3D
yellow (LY; 8% in 0.1; Tris buffer, pH 7.4) in layer Va of the        points. These points have an associated diameter that provides
primary sensory neocortex (area S1 according to Morin and             the information of the varying thickness of the dendrite at that
Wood 2001). The primary somatosensory cortex was chosen               particular point and varies along the length of the dendrite.
in order to follow up on previously published work by our                Several morphological variables were extracted using Neu-
laboratory in which cellular changes were found in this cortical      rolucida software (see Benavides-Piccione et al. 2006 for details).
area during the hibernation of the Syrian hamster (microglial         As discussed in Benavides-Piccione et al. (2020), some of the
processes numbers increase, along with a shortening of the Iba-       features measured did not depend on the entirety of the recon-
1 immunoreactivity; the length of the axon initial segment is         structed cell and can thus be considered as full measurements:
significantly increased; and the Golgi apparatus of glial cells and   mean soma area (estimated by measuring the area of the max-
neurons alike undergo structural modifications) (Leon-Espinosa        imum perimeter of the soma) and average dendritic segment
et al. 2017; Leon-Espinosa et al. 2018; Leon-Espinosa et al. 2019).   diameter, length, surface area, and volume. However, other mor-
LY was applied to each injected cell by continuous current until      phological variables did depend on the entirety of the cell and,
the distal tips of each cell fluoresced brightly, indicating that     thus, may only partially describe the cell and can be consid-
the dendrites were completely filled and ensuring that the            ered “non-full” measurements: area and volume of the dendritic
fluorescence did not diminish at a distance from the soma.            arbor, total number of dendrites, total number of nodes, total
1200 pyramidal neurons of the Syrian hamsters (including both         dendritic length, total dendritic surface area, and total dendritic
control and torpor) were injected, from which 90 cells were           volume.
selected for the study based on the quality of the LY-labeled            Values are expressed as total numbers, per branch order
cells.                                                                segment and as a function of the distance from soma (Sholl
    Following the intracellular injections, the sections were         analysis). Only dendritic segments that were completely recon-
immunostained for LY using a rabbit antibody against LY               structed were included in the analysis.
4      Cerebral Cortex Communications, 2020, Vol. 1, No. 1

                                                                                                                                                                         Downloaded from https://academic.oup.com/cercorcomms/article/1/1/tgaa018/5841606 by guest on 15 November 2020
Figure 1. (A) Imaris software screenshot showing a basal dendrite belonging to a LY injected layer Va pyramidal neuron; (B) reconstruction of the basal dendrite shown
in (A) using Imaris Software Filament Tracer Tool; (C and D) higher magnification of the terminal region of the dendrite shown in (A) and its reconstruction.

Dendritic Spine Reconstruction and Quantitative Analysis                              dendritic arbor nearest the surface of the slice from which the
                                                                                      cell soma was injected (typically at a depth of ∼30 µm from the
After image acquisition, the stacks were opened with three-
                                                                                      surface) was lost. It is important to note that the percentage
dimensional image processing software—Imaris 7.6.4 (Bitplane
                                                                                      of the basal arbor and apical arbor included within the section
AG)—and dendritic spines were individually reconstructed using
                                                                                      may vary in each cell depending on how parallel the main apical
Filament Tracer Tool in the main apical dendrite (n = 31 cells in
                                                                                      dendrite runs with respect to the surface of the slice. In the
control group; n = 33 cells in T(AT8−) group; n = 26 cells in T(AT8+)
                                                                                      present study, neurons were included in the analysis if they had a
group) and in randomly selected basal dendrites (n = 25 cells in
                                                                                      main apical dendrite length of at least 200 microns. Furthermore,
all groups) that run parallel to the cortical surface. The dendritic
                                                                                      dendrites that ran for further than ∼900 µm from the soma were
spine density was established as the number of dendritic spines
                                                                                      not properly filled with dye, and, therefore, distal apical dendrites
found in segments of 10 µm along the length of the dendrite.
                                                                                      (apical tufts) of layer Va cells were not included in the analysis.
Dendritic spine length, area, and volume were obtained using the
                                                                                           In addition, as hyperphosphorylated tau was mainly observed
same software (Fig. 1).
                                                                                      in the proximal region of the apical dendrite emerging from the
                                                                                      soma, we limited the study of the apical arbor to the first 180 µm
                                                                                      from the soma. Thus, the changes described here during hiberna-
Statistical Analysis                                                                  tion may not necessarily reflect the alterations in the remaining
                                                                                      cell structure. Due to technical limitations (mostly incomplete
All statistical analyses were performed using GraphPad Prism
                                                                                      filling of the cells by LY), tridimensional spine analysis was
version 5.00 for Windows (GraphPad Software). When morpho-
                                                                                      performed in the proximal regions of the apical dendrite, since
logical parameters were presented as mean values, the Kruskal–
                                                                                      distal apical dendrites (e.g., apical tufts) could not be included in
Wallis test was used to compare between the groups. Measure-
                                                                                      the analysis.
ments reported as a function of the distance from the soma
were analyzed using a two-way ANOVA test. Differences were
considered to be significant when P < 0.05. Measurements are
reported as mean ± SEM, unless otherwise indicated.                                   Results
                                                                                      Different Tau Hyperphosphorylation (AT8) Patterns in
                                                                                      Pyramidal Neurons from Layer V
Methodological Considerations
                                                                                      As previously described, AT8 immunostaining showed that tau
Since the intracellular injections of the pyramidal cells were                        hyperphosphorylation occurs upon hibernation and that it fol-
performed in 200-µm-thick coronal sections, the part of the                           lows a nonhomogenous pattern (Arendt et al. 2003). In this study,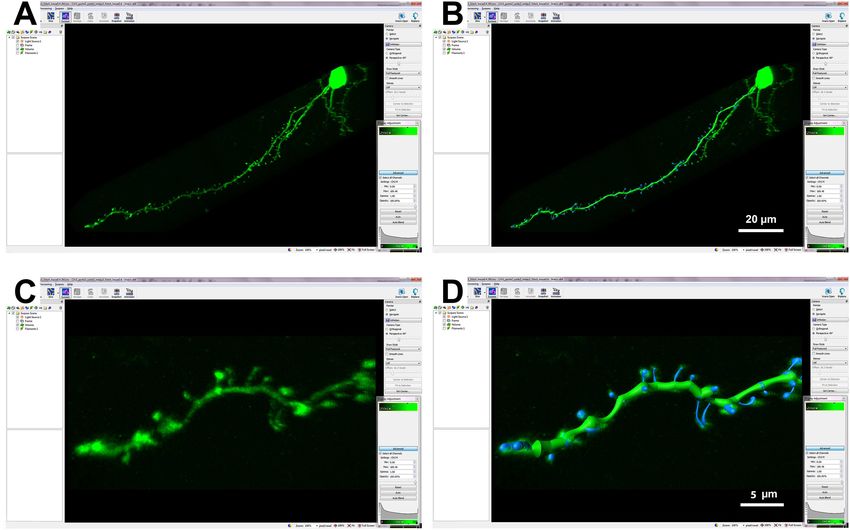
Effect of Phosphorylated Tau on Cortical Pyramidal Neuron Morphology during Hibernation                            Regalado-Reyes et al.         5

                                                                                   Neuronal Tree Reconstruction
                                                                                   To analyze the effect of tau phosphorylation on dendritic and
                                                                                   spine morphology, we performed Lucifer yellow intracellular
                                                                                   injections in the somatosensory cortex (Fig. 3). To study a repre-
                                                                                   sentative cohort of cells, we injected specifically the Va layer cells
                                                                                   of control (nonhibernating) and torpor animals, where cells with
                                                                                   high AT8 immunoreactivity are relatively abundant (Fig. 3 D-G).
                                                                                   The injected cells from torpid animals (60 cells) were divided
                                                                                   into 2 different groups depending on the presence or absence
                                                                                   of PHF-tauAT8 labeling: 1) T(AT8−) (33 cells; see Fig. 3M–O),
                                                                                   which did not have any detectable AT8 labeling and 2) T(AT8+)
                                                                                   (27 cells; see Fig. 3J–L), which displayed prominent AT8 labeling

                                                                                                                                                            Downloaded from https://academic.oup.com/cercorcomms/article/1/1/tgaa018/5841606 by guest on 15 November 2020
                                                                                   in the soma and the apical dendrite. It is important to note
                                                                                   that, in some injected cells, AT8 labeling was present at the
                                                                                   distal region of the apical dendrite but not in the soma and
                                                                                   proximal regions. The number of cells following this pattern
                                                                                   was difficult to estimate due to technical issues, such as the
                                                                                   inclination of the slice, the penetration of the antibodies used,
                                                                                   or the quality of the intracellular injections. These cells were not
                                                                                   selected for the study, thus restricting the analysis to cells with
                                                                                   positive AT8 labeling in the soma, as they are interesting for the
                                                                                   characterization of the phosphorylated tau distribution within
                                                                                   neurons.
                                                                                       The dendritic fields of the cells were reconstructed through
                                                                                   manually traced 3D points, and the data points of neuron mor-
                                                                                   phology of each pyramidal cell were included in the comparative
                                                                                   analysis between groups (Fig. 4).
                                                                                       Both apical and basal arbors were analyzed separately regard-
                                                                                   ing the number of intersections, number of endings, number of
                                                                                   nodes, average diameter, length, surface area and volume. Each
                                                                                   measurement was expressed as a function of the distance from
                                                                                   soma (Sholl analysis) and as a total average value.

                                                                                   Apical Arbor
                                                                                   Numbers of Intersections, Nodes, and Endings in Apical Arbor
                                                                                   Lower during Hibernation
                                                                                   Regarding Sholl analysis, the torpor group (both T(AT8−) and
                                                                                   T(AT8+)) had significantly fewer intersections than the control
                                                                                   group. Control neurons had significantly higher values at 90,
                                                                                   100, 120, and 130 µm from soma when compared to T(AT8−)
Figure 2. Photomicrographs showing the patterns of hyperphosphorylated tau         and at 120 µm from soma when compared to T(AT8+) (Fig. 5A;
immunostaining (using AT8 antibody) in the brain of control (A) and torpid (B)
                                                                                   Supplementary Tables 1 and 2). The number of nodes and
Syrian hamsters. Representative images from layer II–III (C) and layer IV–V (D)
somatosensory cortical layers are shown. Arrows in C point out apical dendrites
                                                                                   the number of endings were significantly reduced in the
from lower layer cells. Arrows in D indicate some AT8-positive layer Va neurons.   T(AT8+) group when compared to the control and T(AT8−)
Scale bar in D indicates 750 µm in (A,B) and 75 µm in (C,D).                       groups. Again, all groups followed the same pattern in the
                                                                                   Sholl graph, but T(AT8+) cells had lower values (Fig. 5B,C;
                                                                                   Supplementary Tables 3–5).

we chose the subpopulation of pyramidal cells located in layer
                                                                                   No Variations in Mean Values for Diameter, Length, Surface Area, or
Va because some of those neurons displayed a strong phospho-
                                                                                   Volume of the Apical Arbor during Hibernation
tau expression (T(AT8+)), whereas other neighboring pyramidal
neurons were lightly labeled or not labeled (Fig. 2). Thus, these                  In terms of average dendritic diameter, no significant differences
T(AT8+) neurons were suitable to analyze the possible effects                      between groups were found when total values were compared
of tau phosphorylation on cortical pyramidal cell morphology                       (Fig. 6A,B). However, there was a significantly lower dendritic
by making comparisons with neighbor non-tau phosphorylated                         diameter in the T(AT8+) group at a distance of 10 µm from soma
cells (T(AT8−)). The accumulation of hyperphosphorylated tau                       (Fig. 6A; Supplementary Table 6). Interestingly, the proximal
in layer Va pyramidal neurons was restricted to the soma and                       areas were the ones that displayed the highest hyperphos-
the main apical dendritic shaft that emerges from the soma. AT8                    phorylated tau. Regarding total values of dendritic length,
labeling was not detected in the basal arbor, in the axon, or within               surface area, and volume, no significant differences were found
the dendritic spines. However, the dendrites that ascend through                   between groups (Fig. 6B,D,F,H). However, Sholl graphs did have
superficial layers from lower cortical layers also displayed an                    lower values in the torpor group, mostly in the T(AT8+), with
evident and strong AT8 labeling (see Figs 2C and 3F,G).                            significantly lower length and surface area values at 120 µm from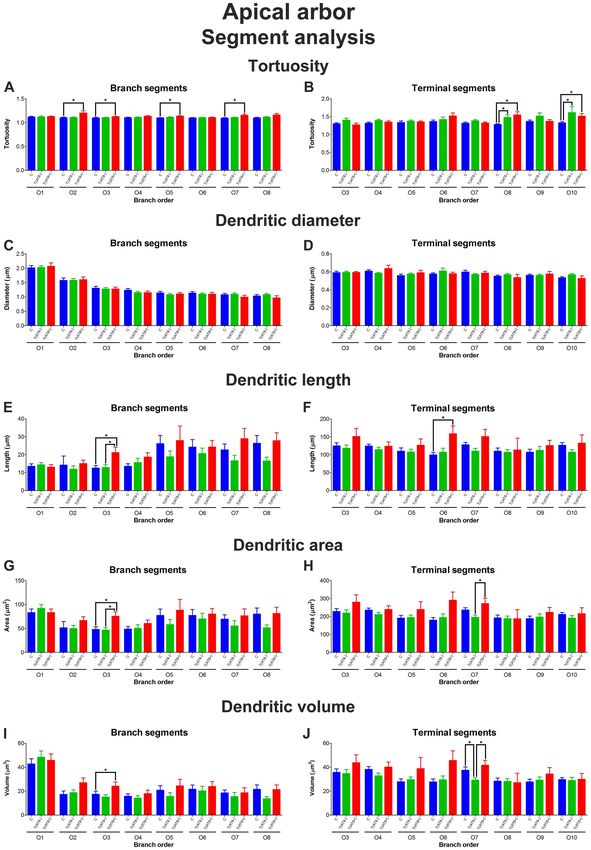
6 Cerebral Cortex Communications, 2020, Vol. 1, No. 1
Downloaded from https://academic.oup.com/cercorcomms/article/1/1/tgaa018/5841606 by guest on 15 November 2020
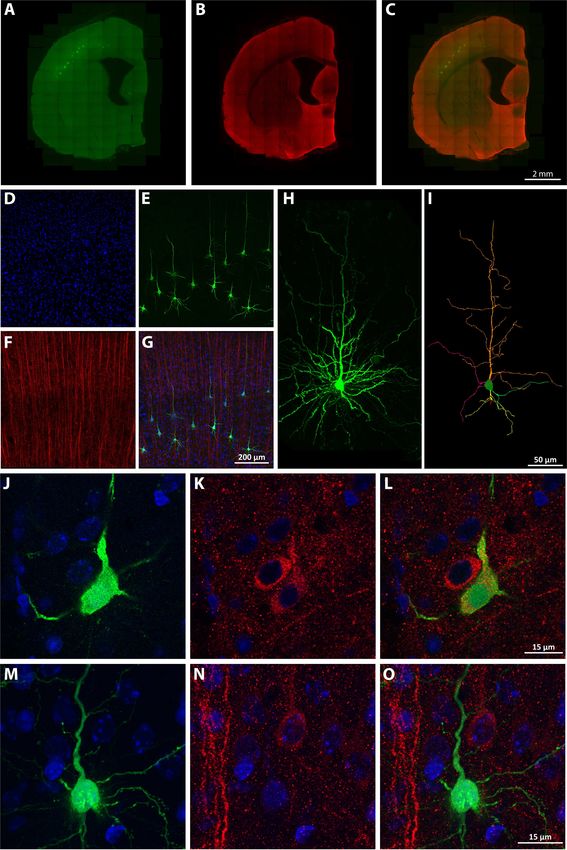
Figure 3. (A–C) Representative panoramic images of pyramidal neurons injected with LY in the somatosensory cortex; LY injections are shown in A, AT8 immunostaining
in B, and they are merged in C. (D–G) Higher magnification confocal image of a group of injected pyramidal neurons showing DAPI staining (D), LY staining (E), AT8
staining (F), and D–F merged (G). (H) Higher magnification photomicrograph of a representative injected pyramidal neuron. (I) 3D reconstruction of the same cell.
(J–O) High magnification confocal microscopy images of 2 different injected somatosensory layer V-injected cells, showing an injected pyramidal neuron with positive
PHF-tauAT8 immunostaining (and therefore included in the T(AT8+) group (J–L)) and an injected pyramidal neuron showing negative PHF-tauAT8 immunostaining (and
therefore included in the T(AT8−) group (M–O)). For all images: DAPI is shown in blue, LY is shown in green, and AT8 is shown in red. Scale bars are shown at the bottom
of each set of images: 2 mm in A–C, 200 µm in D–G, 50 µm in H–I, and 15 µm in J–O.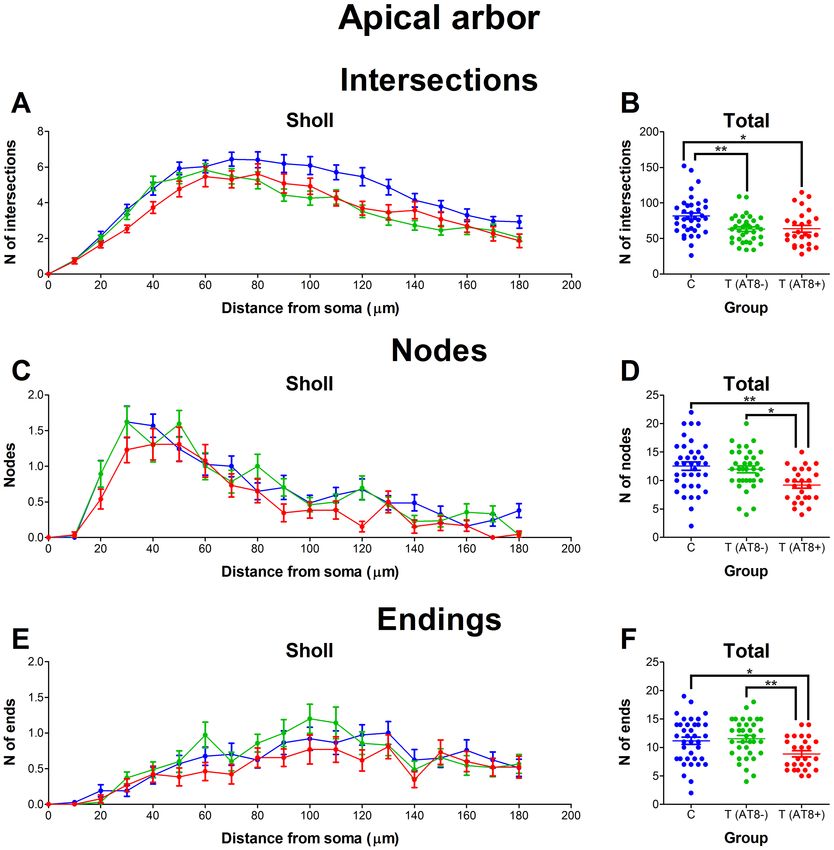
Effect of Phosphorylated Tau on Cortical Pyramidal Neuron Morphology during Hibernation                             Regalado-Reyes et al.       7

                                                                                     Basal Arbor
                                                                                     No Variations in Mean Values for Intersections, Nodes, and Endings
                                                                                     in the Basal Arbor during Hibernation
                                                                                     Regarding the number of intersections, nodes, and endings, no
                                                                                     significant differences between groups were found when com-
                                                                                     paring mean total values (Fig. 7B,D,F). However, the analysis of
                                                                                     the number of nodes based on the distance from soma (Sholl
                                                                                     analysis) revealed significantly higher values at 20 and 40 µm for
                                                                                     the T(AT8+) group compared to both the control group and the
                                                                                     T(AT8−) group (Fig. 7C; Supplementary Table 9).

                                                                                                                                                           Downloaded from https://academic.oup.com/cercorcomms/article/1/1/tgaa018/5841606 by guest on 15 November 2020
                                                                                     Basal Arbor Diameter is Higher in the T(AT8+) Group, Whereas
                                                                                     Length, Surface Area, and Volume Mean Values Remain Constant
                                                                                     during Hibernation
                                                                                     Regarding average dendritic diameter, the T(AT8+) group had
                                                                                     significantly higher total mean values than the T(AT8−) and
                                                                                     the control groups (Fig. 8B; Supplementary Table 11). The Sholl
                                                                                     curve also reflected this, with significantly higher values at 20
                                                                                     and 30 µm from soma when compared to the control group
                                                                                     and 20–60 µm from soma when compared to the T(AT8−) group
                                                                                     (Fig. 8A; Supplementary Table 10). Considering dendritic length,
                                                                                     no significant differences were found when comparing total
                                                                                     length values or comparing between Sholl curves (Fig. 8C,D). In
                                                                                     addition, no significant differences were found for total surface
                                                                                     area comparisons; however, unlike with length, in the case of
                                                                                     these 2 variables, significant differences were apparent from
                                                                                     the Sholl graphs. For surface area, the T(AT8+) values were
                                                                                     significantly higher at 90 and 100 µm from soma when com-
                                                                                     pared to the control group but not compared to T(AT8−) (Fig. 8E;
                                                                                     Supplementary Table 12). In the case of volume, T(AT8+) mean
                                                                                     total values were significantly higher than control and were sig-
Figure 4. Drawings of the apical (blue) and basal (red) dendritic arbors of 3 rep-   nificantly higher from 50 to 100 µm from soma when compared
resentative somatosensory layer Va pyramidal neurons belonging to the control,       to the control group and from 50 to 70 µm from soma when com-
T(AT8−), and T(AT8+) groups. Axons are shown in green. Scale bar, 200 µm.            pared to the T(AT8−) group (Fig. 8G,H; Supplementary Tables 13
                                                                                     and 14).
                                                                                         To sum up, when comparing basal dendrites, the average
                                                                                     diameter was significantly higher in the T(AT8+) group than in
                                                                                     the control and T(AT8−) groups. Moreover, Sholl graphs showed
                                                                                     a tendency of higher values in T(AT8+) compared to the resting
soma compared to control (Fig. 6C,E,G; Supplementary Tables 7                        groups for all variables analyzed.
and 8).
    In summary, when comparing the first 180 µm Sholl dis-
tance of the apical arbor from torpor and control layer Va neu-
rons, significant differences appear in terms of total number                        Dendritic Segment Analysis
of intersections, nodes, and endings. Regarding nodes, both tor-                     Segments were classified into branching segments (a segment
por groups, T(AT8−) and T(AT8+), had fewer total nodes than                          that bifurcates) and terminal segments (a segment that ends).
the control group, whereas the total number of intersections
and total number of endings were lower than control only in
                                                                                     Apical Arbor
the case of the T(AT8+) group. Regarding length, area, and vol-
ume, no significant differences were found in the total val-                         Our results regarding the apical arbor indicate that tortuosity
ues, but Sholl graphs did show a tendency for the T(AT8+)                            (Fig. 9A,B; Supplementary Tables 15 and 19)—along with the
group values being lower than those of the control and T(AT8−)                       length (Fig. 9E,F; Supplementary Tables 16 and 20), the area
groups.                                                                              (Fig. 9G,H; Supplementary Tables 17 and 21), and volume (Fig. 9I,J;
    To further characterize the morphology of apical arbors, we                      Supplementary Tables 18 and 22) of dendritic segments that
analyzed the distance from soma at which oblique branches                            composed the apical arbor—was higher in torpor in comparison
emerge. To do so, we calculated the distance at which the nodes                      with the control and T(AT8−) experimental groups, both
of the main apical dendrite were located. No significant dif-                        regarding terminal and branching segments; the differences
ferences between groups were found up to the sixth oblique                           were statistically significant at certain specific branch orders.
branch (Supplementary Fig. 1). Thus, hibernation does not affect                     However, we did not perceive any significant difference in the
the distance at which first oblique branches emerge from the                         segment diameter, regardless of the segment type or branch
apical arbor.                                                                        order (Fig. 9C,D).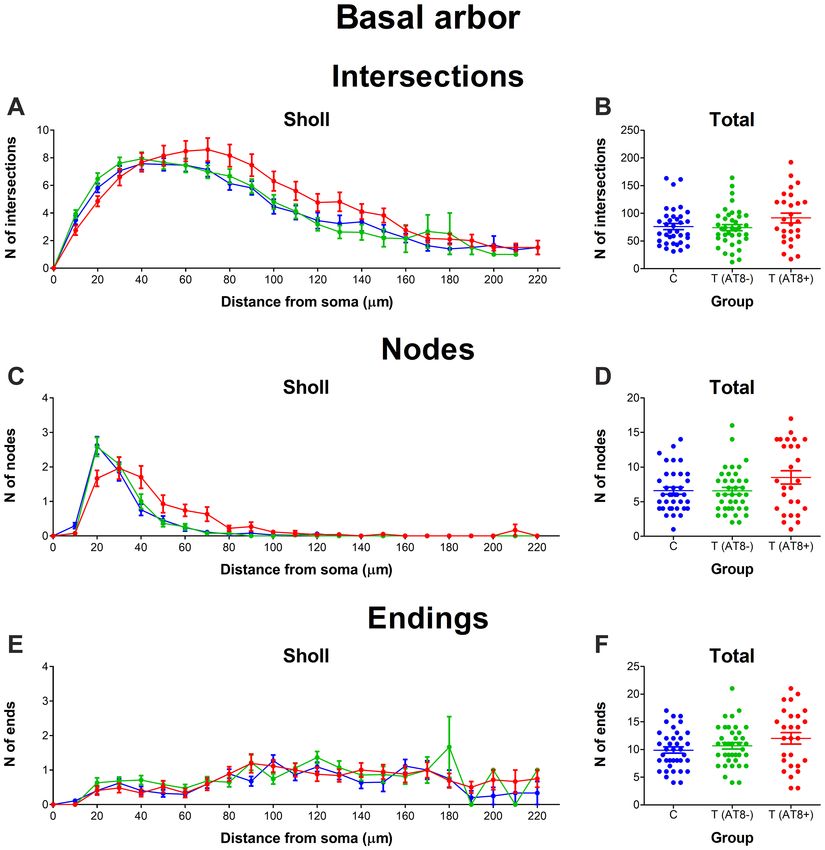
8      Cerebral Cortex Communications, 2020, Vol. 1, No. 1

                                                                                                                                                                         Downloaded from https://academic.oup.com/cercorcomms/article/1/1/tgaa018/5841606 by guest on 15 November 2020
Figure 5. Graphs showing some morphological features of the apical dendritic arbor: apical arbor intersections (A, B), nodes (C, D) and endings (E, F), expressed as a
function of the distance from soma (Sholl analysis) and as total average values.

Basal Arbor                                                                           phosphorylated nearby cells or with control cells from non-
                                                                                      hibernating animals.
When the basal tree segments were analyzed, we observed
higher values for their length, area, and diameter in the case
of T(AT8+) for terminal and branching segments at specific
                                                                                      Dendritic Spine Density during the Hibernation of the Syrian
branch orders (Fig. 10C–J; Supplementary Tables 24–27 and 28–
                                                                                      Hamster
31), but no significant differences were observed regarding
tortuosity in this group (Fig. 10). However, a significant increase                   Dendritic spine density in the proximal apical dendrite was not
was found for tortuosity in T(AT8−) group both in branching                           significantly altered between groups, except at 100 µm from
and terminal segments (Fig. 10A,B; Supplementary Tables 23                            soma between C and T(AT8−) groups (Fig. 11A,B; Supplementary
and 27).                                                                              Table 32). Regarding basal dendrites, dendritic spine density
                                                                                      values remained constant between groups. This can be observed
                                                                                      when data are shown as a function of the distance from soma,
                                                                                      as total values, and as a frequency distribution (Fig. 11C,D).
Dendritic Spine Reconstructions                                                       Worth noting that preliminary results in our laboratory indicated
Complete reconstructions were carried out for the dendritic                           that the dendritic spine density is lower in CA3 cells. We
spines in the main apical dendrite and in some basal dendrites.                       examined collateral branches of apical dendrites of pyramidal
Several morphological values, as well as dendritic spine                              cells and found that the density of spines was 3.145 ± 0.156
density, were analyzed by making comparisons with non-tau                             spines/µm (mean ± sd) in control animals (n = 6 dendrites),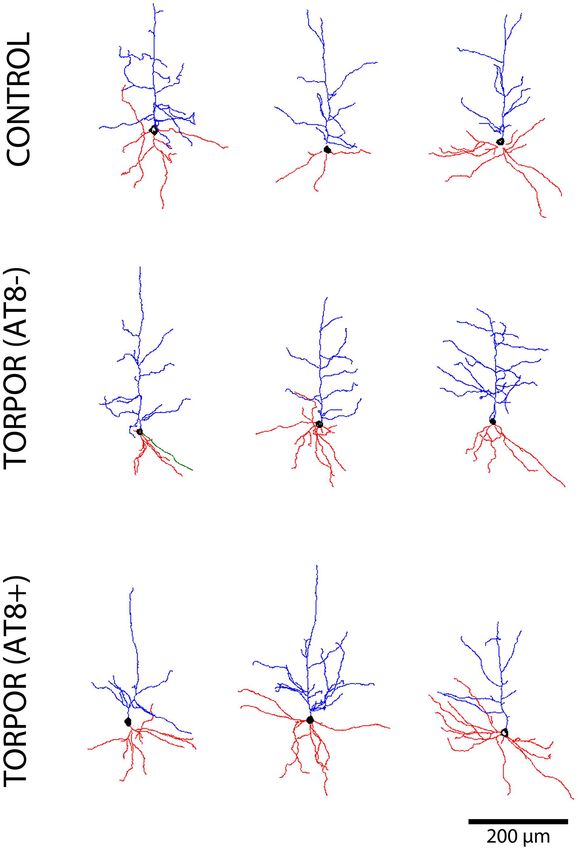
Effect of Phosphorylated Tau on Cortical Pyramidal Neuron Morphology during Hibernation                                      Regalado-Reyes et al.             9

                                                                                                                                                                           Downloaded from https://academic.oup.com/cercorcomms/article/1/1/tgaa018/5841606 by guest on 15 November 2020

Figure 6. Graphs showing some morphological features of the apical dendritic arbor: apical arbor average diameter (A, B), length (C, D), surface area (E, F), and volume
(G, H), expressed as a function of the distance from soma (Sholl analysis) and as total average values.

whereas in torpor animals was 2.724 ± 0.132 spines/µm (n = 6                           Spine Morphology in Apical Main Dendrite
dendrites). This result confirms previous observations about
spine density in the hippocampal CA3 neurons upon hibernation                          Significant differences were found in the morphology of den-
(Popov et al. 1992; Magariños et al. 2006; Bullmann et al.                             dritic spines when comparing average spine length, with higher
2016).                                                                                 values in the T(AT8+) and T(AT8−) groups compared to the
10 Cerebral Cortex Communications, 2020, Vol. 1, No. 1
Downloaded from https://academic.oup.com/cercorcomms/article/1/1/tgaa018/5841606 by guest on 15 November 2020
Figure 7. Graphs showing some morphological features of the basal dendritic arbor, including basal arbor intersections (A, B), nodes (C, D), and endings (E, F), expressed
as a function of the distance from soma (Sholl analysis) and as total average values.
control group. The Sholl graph also reflected this difference, Spine Morphology in Basal Dendrites
with the control curve appearing below the T(AT8+) and T(AT8−)
Regarding the morphology of dendritic spines in the basal den-
curves. Moreover, data represented as a frequency distribution
drites, a significantly higher dendritic spine length was found in
had larger frequencies in small spines for the control group than
T(AT8−) cells compared to control cells. However, no significant
in the torpor groups (Fig. 12; Supplementary Tables 33 and 38).
differences were found between the T(AT8+) group and the
Similarly, when we compared dendritic spine area, the control
control group (Fig. 15; Supplementary Tables 35 and 41).
group had significantly smaller spines than the torpor groups
Moreover, dendritic spine area was significantly higher in
(Fig. 13; Supplementary Table 39).
both the T(AT8−) and T(AT8+) groups compared to the control
Finally, dendritic spine volumes for the T(AT8+) and T(AT8−)
group. Moreover, the T(AT8−) group had significantly higher
groups were significantly bigger than those from the control
values than the T(AT8+) group (Fig. 16; Supplementary Tables 36
group (Fig. 14; Supplementary Tables 34 and 40).
and 42).
To sum up, no significant differences in spine density values
Furthermore, regarding dendritic spine volume, values were
were found between groups. However, in the torpor group, the
significantly higher in both the T(AT8−) and T(AT8+) groups
spines were significantly longer and larger on average compared
compared to the control group (Fig. 17; Supplementary Tables 37
to control.
and 43).Effect of Phosphorylated Tau on Cortical Pyramidal Neuron Morphology during Hibernation Regalado-Reyes et al. 11
Downloaded from https://academic.oup.com/cercorcomms/article/1/1/tgaa018/5841606 by guest on 15 November 2020
Figure 8. Graphs showing some morphological features of the basal dendritic arbor, including basal arbor average diameter (A, B), length (C, D), surface area (E, F), and
volume (G, H), expressed as a function of the distance from soma (Sholl analysis) and as total average values. ∗ P < 0.05; ∗∗ P < 0.001; ∗∗∗ P < 0.0001.
Finally, cell body area was analyzed, and no significant T(AT8+) group. A summary of all the results obtained
differences were found between groups, with area values for the apical dendrites are shown in Tables 1–3—for apical
of 144.5 ± 30.20 µm2 in the control group, 139.4 ± 25.54 µm2 dendrites, basal dendrites, and dendritic spine morphology,
in the T(AT8−) group, and 162.6 ± 42.27 µm2 in the respectively.12 Cerebral Cortex Communications, 2020, Vol. 1, No. 1
Downloaded from https://academic.oup.com/cercorcomms/article/1/1/tgaa018/5841606 by guest on 15 November 2020
Figure 9. Graphs showing the segment analysis for the apical dendrites. For the 3 groups, C (blue), T(AT8−) (green), and T(AT8+) (red), the following variables are shown:
tortuosity, for branch segments (A) and terminal segments (B); diameter, for branch segments (C) and terminal segments (D); length, for branch segments (E) and terminal
segments (F); area, for branch segments (G) and terminal segments (H); and volume, for branch segments (I) and terminal segments (J). Mean ± SD. ∗ P < 0.05.
Discussion layer Va with abundant AT8 labeling (in torpid animals; T(AT8+))
and layer Va cells that do not express hyperphosphorylated
AT8-Immunoreactivity Pattern in the Syrian Hamster
tau in either control animals or the torpor group T(AT8−).
Somatosensory Cortex
Comparing between groups allows us to study the effect of
During the hibernation of the Syrian hamster, some specific tau phosphorylation on the morphology of cortical neurons.
neuronal subpopulations are more prone to express phospho- However, we should take into account that, in these T(AT8−)
rylated tau. Making use of this, we studied cortical cells from cells, tau could be phosphorylated in residues other thanEffect of Phosphorylated Tau on Cortical Pyramidal Neuron Morphology during Hibernation Regalado-Reyes et al. 13
Downloaded from https://academic.oup.com/cercorcomms/article/1/1/tgaa018/5841606 by guest on 15 November 2020
Figure 10. Graphs showing the segment analysis for the apical dendrites. For the 3 groups, C (blue), T(AT8−) (green), and T(AT8+) (red), the following variables are shown:
tortuosity, for branch segments (A) and terminal segments (B); diameter, for branch segments (C) and terminal segments (D); length, for branch segments (E) and terminal
segments (F); area, for branch segments (G) and terminal segments (H); and volume, for branch segments (I) and terminal segments (J). Mean ± SD. ∗ P < 0.05; ∗∗ P < 0.001;
∗∗∗ P < 0.0001.
Serines 202 and 205. In fact, using western Blot, Stieler and could not be recognized by the AT100 antibody and vice versa
colleagues (Stieler et al. 2011) showed an overall increase in (Regalado-Reyes et al. 2019). Therefore, studying if tau phospho-
phosphorylated tau during torpor using the following antibodies: rylation takes place simultaneously, in a sequential manner or
AT100 (T212/S214/T217), AT180 (T231/S235), AT270 (T181), and independently within pyramidal neurons during hibernation,
PHF1 (S396/S404). Moreover, it has been described that, in may shed light on the mechanisms that promote neuronal
AD, neurofibrillary tangles labeled with the AT8 antibody plasticity.14 Cerebral Cortex Communications, 2020, Vol. 1, No. 1
Downloaded from https://academic.oup.com/cercorcomms/article/1/1/tgaa018/5841606 by guest on 15 November 2020
Figure 11. Graphs showing the dendritic spine density (per µm) in the apical main dendrite (A, B) and basal dendrites (C, D) of cortical layer V pyramidal neurons
expressed as a function of the distance from soma (A, C) and as total average values (B, D).
The majority of the studies carried out to date have analyzed The Protein Tau and Neuronal Plasticity of Neocortical Cells
the plastic changes in CA3 neurons upon hibernation (Popov et al. during Hibernation
1992; Magariños et al. 2006; Bullmann et al. 2016). In this regard,
strong reactivity for AT8 was found in most of the hippocampal The main finding of the present study is that tau phosphory-
CA3 pyramidal cells, reflecting a more homogenous pattern than lation may play a role in the morphological changes that take
in the neocortex. In our study, since we were able to compare place in cortical pyramidal neurons during the hibernation of the
between cells that overexpressed phosphorylated tau and cells Syrian hamster. We have shown that layer Va cells with abundant
which did not, it was possible to evaluate whether the results AT8 expression have fewer nodes, intersections, and endings
obtained were specifically attributed to phosphorylation of the (less complexity) in the apical dendrite. This is in agreement
tau protein. with other studies in CA3 neurons that describe a reduced apical
Here, we observed an increase in the basal dendrite diameter dendritic tree complexity (Popov et al. 1992; Magariños et al. 2006;
in AT8-positive cells. Changes in the diameter of the basal den- Bullmann et al. 2016). Different branch structures undertake
drites may affect calcium dynamics, since it has been reported distinct forms of neuronal processing within the dendritic tree
that the peak calcium levels are inversely related to branch diam- before input potentials arrive at the soma. Therefore, there may
eter (Anwar et al. 2014). This is important because calcium influx be greater potential for compartmentalization in the cells that
into the cytoplasm of dendrites and dendritic spines is involved have a more highly branched pattern than in those with fewer
in cytoskeletal remodeling, regulating dendrite morphogenesis branches (Stuart et al. 1997; Koch and Segev 2000; Spruston 2008).
(Higley and Sabatini 2008; Rosenberg and Spitzer 2011). Moreover, The impact on cell function of the accumulation of phospho-
it has been suggested that hibernation promotes a decrease rylated tau protein is not clear. However, it has been suggested
in the activity of calcium channels to prevent excessive Ca2+ that high tortuosity of tau-positive neuronal cells may be related
entry (Gattoni and Bernocchi 2019; Wang et al. 2002; Zhang to excessive phosphorylation in the brain of dogs (Wegiel et al.
et al. 2020). Based on these data, we propose a relationship 1998). This result is in line with previous studies that described a
between tau hyperphosphorylation and calcium signaling by dendritic retraction in hibernating golden-mantled ground squir-
dendrite remodeling to prevent neurodegeneration. Future stud- rels (von der Ohe et al. 2006) and neurite retraction in rat cere-
ies should focus on interpreting these findings from a functional bellar granule neurons upon GSK-3-mediated hyperphosphory-
perspective. lation of the protein tau (Sayas et al. 2002). Our results are inEffect of Phosphorylated Tau on Cortical Pyramidal Neuron Morphology during Hibernation Regalado-Reyes et al. 15
Downloaded from https://academic.oup.com/cercorcomms/article/1/1/tgaa018/5841606 by guest on 15 November 2020
Figure 12. Graphs showing hamster somatosensory pyramidal layer V neuron dendritic spine length of the main apical dendrite, expressed as a function of the distance
from soma (Sholl analysis) (A), as a relative frequency distribution (B), as total average values (C), and as a cumulative frequency distribution (D). ∗∗ P < 0.001; ∗∗∗ P < 0.0001.
agreement with the above data, as we observed that tortuosity Nevertheless, we observed that spines were significantly
was higher in the apical tree of T(AT8+) cells than in control cells. longer and larger during hibernation. This is in contrast to pre-
Regarding the study of dendritic spines, we observed no spine vious studies that show spine length reduction in hippocampal
density variation in the apical or basal dendrites of somatosen- pyramidal neurons (Popov et al. 1992; Popov and Bocharova 1992;
sory layer Va neurons as a consequence of the hibernation of Magariños et al. 2006). Again, hippocampus and neocortex may
Syrian hamsters. Given that previous studies—using different respond differently when hibernation is triggered. Since the
methodological approaches—describe a lower spine number in length of the dendritic spine is proportional to the extent of
CA1 and CA3 hippocampal neurons (Popov et al. 1992; Magariños biochemical and electrical isolation from its parent dendrite and
et al. 2006; Bullmann et al. 2016), our results may suggest a the spine size is correlated with synaptic currents (Harris and
brain region-dependent response upon hibernation between the Stevens 1989; Yuste and Denk 1995; Nusser et al. 1998; Matsuzaki
hippocampal and somatosensory pyramidal cells. et al. 2004), the findings described here suggest a variation in the16 Cerebral Cortex Communications, 2020, Vol. 1, No. 1
Figure 13. Graphs showing the dendritic spine area in the main apical dendrite, expressed as a function of the distance from soma (Sholl analysis) (A), as a relative
Downloaded from https://academic.oup.com/cercorcomms/article/1/1/tgaa018/5841606 by guest on 15 November 2020
frequency distribution (B), as total average values (C), and as a cumulative frequency distribution (D). ∗∗ P < 0.001.
integration of inputs that may be regarded as a compensatory neurons of the transgenic mouse model P301S (Hoffmann et al.
mechanism. 2013). Phosphorylated tau localization during the hibernation
Tau mislocalization may provide a valuable clue to explain of Syrian hamsters is mainly restricted to the apical dendrite
and understand the role of Tau in synaptic alterations. Under and the cellular soma. We have not detected phospho-tau
pathological situations such as AD, misfolded tau has been in the dendritic spines (in somatosensory cortex or in the
detected at presynaptic and postsynaptic terminals, which may hippocampus). However, we have detected AT8 immunostaining
represent early signs of neuronal impairment (Tai et al. 2014). in the distal region of the apical dendrite from injected layer
Later studies found hyperphosphorylated tau in the thorny Va pyramidal cells that do not contain phosphorylated tau in
excrescences of CA3 hippocampal neurons of AD patients the soma or any other regions of the proximal apical or basal
(Blazquez-Llorca et al. 2011) and in the dendritic spines of CA3 dendrites (Fig. 18). Future studies including the terminal tuftEffect of Phosphorylated Tau on Cortical Pyramidal Neuron Morphology during Hibernation Regalado-Reyes et al. 17
Downloaded from https://academic.oup.com/cercorcomms/article/1/1/tgaa018/5841606 by guest on 15 November 2020
Figure 14. Graphs showing the dendritic spine volume in the main apical dendrite, expressed as a function of the distance from soma (Sholl analysis) (A), as a relative
frequency distribution (B), as total average values (C), and as a cumulative frequency distribution (D). ∗∗ P < 0.001.
dendrites of pyramidal neurons should be performed to better Similar immunostaining was described previously in AD
understand the effects of tau hyperphosphorylation on layer V patients, with PHF-tauAT8 being found in the distal dendritic
pyramidal neurons. segments of Lucifer yellow-injected cells, classified as pattern
The large number of apical dendritic shafts present in lay- IIa neurons (Merino-Serrais et al. 2013). Merino and colleagues
ers II–III, which are labeled with AT8, contrasts with the low suggested that dendritic spine loss is associated with the
number of cells with such labeling in layers V–VI (see Fig. 2B). intracellular tau pathology, occurring first in the distal and
The most likely interpretation that explains this fact is that then in the more proximal regions (Merino-Serrais et al. 2013).
neurons that have hyperphosphorylated tau in distal regions of They also suggested that disconnection occurs only in the
the apical dendrite do not present it in the soma, as shown in distal segments of pyramidal cells, where accumulation of
Figure 18. fibrillary phospho-tauAT8 and reduction in the density of18 Cerebral Cortex Communications, 2020, Vol. 1, No. 1 Figure 15. Graphs showing hamster somatosensory pyramidal layer V neuron dendritic spine length of the basal dendrites, expressed as a function of the distance from Downloaded from https://academic.oup.com/cercorcomms/article/1/1/tgaa018/5841606 by guest on 15 November 2020 soma (Sholl analysis) (A), as a relative frequency distribution (B), as total average values (C), and as a cumulative frequency distribution (D). ∗∗∗ P < 0.0001. dendritic spines is observed. Further evidence of distal phospho- Neuronal Activity and Morphological Cell Alterations during tau localization was described in a recent study carried out Syrian Hamster Hibernation in AD samples, where AT8-ir segments were localized in the distal basal dendrites of isolated cortical neurons. This Torpor is characterized by a notable decrease in neuronal activity localization appears to follow a sequential pattern that could throughout the whole brain (reviewed in Sonntag and Arendt support the transcellular spreading of pathological “tau seeds,” 2019). EEG studies at the end of the nineteenth century demon- a prion model of tau propagation (Braak and Del Tredici strated that the cortex and other brain regions appear to remain 2018; Perez et al. 2019). Our results show that this special silenced at low temperatures (Krelstein et al. 1990). This reduc- phospho-tau localization is present under nonpathological tion, in parallel with the temperature drop, follows a progressive conditions. and sequential EEG frequency decrease, where the neocortex is
Effect of Phosphorylated Tau on Cortical Pyramidal Neuron Morphology during Hibernation                                             Regalado-Reyes et al.              19

                                                                                                                                                                                   Downloaded from https://academic.oup.com/cercorcomms/article/1/1/tgaa018/5841606 by guest on 15 November 2020
Figure 16. Graphs showing hamster somatosensory pyramidal layer V neuron dendritic spine area of the basal dendrites, expressed as a function of the distance
from soma (Sholl analysis) (A), as a relative frequency distribution (B), as total average values (C), and as a cumulative frequency distribution (D). ∗ P < 0.05; ∗∗ P < 0.001;
∗∗∗ P < 0.0001.

affected first and the hippocampus last (Heller 1979; Curry-Hyde                           drop during the course of hibernation is likely to be behind the
et al. 2020). However, the limbic system remains responsive to                             general reduction of EEG signal (Cerri 2017); however, this point
stimuli during hibernation, as CA1 hippocampal neurons are                                 remains controversial. A recent study highlighted the mainte-
able to generate action potentials below 15 ◦ C, even though they                          nance of electrical properties of peripheral somatosensory neu-
cannot generate long-term potentiation (LTP) (Hamilton et al.                              rons (dorsal root ganglia) during the hibernation of 13-lined
2017; Horowitz and Horwitz 2019). It could be speculated that                              ground squirrels (Hoffstaetter et al. 2018). Hoffstaetter suggested
the differences in neuronal activity for each brain region might                           complex compensation mechanisms that involve a decrease in
account for the differential neuroplasticity found between the                             voltage-gated sodium channel activity and that cannot simply
hippocampus and somatosensory cortex neurons. Temperature                                  be explained by a decrease in temperature.
20 Cerebral Cortex Communications, 2020, Vol. 1, No. 1
Downloaded from https://academic.oup.com/cercorcomms/article/1/1/tgaa018/5841606 by guest on 15 November 2020
Figure 17. Graphs showing hamster somatosensory pyramidal layer V neuron dendritic spine volume of the basal dendrites, expressed as a function of the distance
from soma (Sholl analysis) (A), as a relative frequency distribution (B), as total average values (C), and as a cumulative frequency distribution (D). ∗ P < 0.05; ∗∗∗ P < 0.0001.
In situ hybridization studies documented that during feature that could give us clues about cell activity is the
hibernation, c-Fos expression is suppressed in the cortex organization of the Golgi apparatus, involved in the processing
of the 13-lined ground squirrel (Bratincsak et al. 2007). In and transport of proteins. In this regard, torpor promotes a
addition, 14 C-2-deoxyglucose uptake is also reduced in Golden- general reduction in the volume and surface area of the elements
mantled ground squirrels (Kilduff et al. 1990). Both articles of Golgi apparatus in both the hippocampus and neocortex
highlighted the activity inhibition of cortical regions in torpor, (Anton-Fernandez et al. 2015).
in line with the abovementioned electrophysiological studies. Despite the cortical neural inactivity in some brain regions,
However, these 2 studies also showed activation of hypothalamic hibernating animals perceive temperature variations and
regions such as the suprachiasmatic nucleus, which may be external sensory stimuli, including touch and acoustic detection
responsible for promoting initiation of the arousal state. Another (Strumwasser 1959). This indicates that the sensory system isEffect of Phosphorylated Tau on Cortical Pyramidal Neuron Morphology during Hibernation Regalado-Reyes et al. 21
Table 1. Summary of the analysis regarding differences observed during hibernation of the Syrian hamster concerning apical dendrites
C vs. T(AT8−) C vs. T(AT8+) T(AT8−) vs. (AT8+)
Apical arbor Intersections Total ∗∗ ∗ ns
Whole-cell Sholl 90∗ , 130∗∗ ; 100, 120 µm∗ ns
reconstructions 120 µm
Nodes Total ns ∗∗ ∗
Sholl ns ns ns
Endings Total ns ∗ ∗∗
Sholl ns ns 90 µm∗
Av. diameter Total ns ns ns
Sholl ns 10 µm∗∗∗ 10 µm∗∗∗
Downloaded from https://academic.oup.com/cercorcomms/article/1/1/tgaa018/5841606 by guest on 15 November 2020
Length Total ns ns ns
Sholl ns 120 µm∗ ns
Surface area Total ns ns ns
Sholl ns 120 µm∗ ns
Volume Total ns ns ns
Sholl ns ns ns
Apical arbor Tortuosity Branch ns O2∗ , O3, O5, O7 ns
Segment analysis Terminal O8∗ , O10 O8∗ , O10 ns
Av. diameter Branch ns ns ns
Terminal ns ns ns
Length Branch ns O3∗ O3∗
Terminal ns O6∗ ns
Surface area Branch ns O3∗ O3∗
Terminal ns ns O7∗
Volume Branch ns O3∗ ns
Terminal O7∗ ns O7∗
∗ P < 0.05; ∗∗ P < 0.001; ∗∗∗ P < 0.0001.
Table 2. Summary of the analysis regarding differences observed during hibernation of the Syrian hamster concerning basal dendrites
C vs. T(AT8−) C vs. T(AT8+) T(AT8−) vs. (AT8+)
Basal arbor Intersections Total ns ns ns
Whole-cell Sholl ns ns ns
reconstructions Nodes Total ns ns ns
Sholl ns 20∗∗∗ , 40 µm 20 µm∗∗∗ ; 40 µm∗
Endings Total ns ns ns
Sholl ns ns ns
Av. diameter Total ns ∗∗ ∗∗∗
Sholl ns 20–30 µm∗∗∗ ; 20–60 µm∗∗∗ ; 70 µm∗
50–60 µm∗∗ ; 40 µm∗
Length Total ns ns ns
Sholl ns ns ns
Surface area Total ns ns ns
Sholl ns 90 µm∗ ns
Volume Total ns ∗ ns
Sholl ns 50–70 µm∗∗ ; 50, 70 µm∗∗ ; 60 µm∗
80–100 µm∗
Basal arbor Tortuosity Branch O1∗ ns ns
Segment analysis Terminal O2∗ ns ns
Av. diameter Branch ns O1∗∗ ; O2∗ O1∗∗∗
Terminal ns ns O2∗ ; O3
Length Branch ns O1∗∗∗ ; O3∗ ns
Terminal ns O2∗∗∗ ; O3 O2∗∗ ; O3∗∗∗ ; O4∗
Surface area Branch ns O1∗∗∗ O1∗∗∗ ; O2∗ ; O3
Terminal ns O2∗∗∗ ; O3 O2∗∗ ; O3∗∗∗ ; O4∗
Volume Branch ns O1∗∗∗ ; O2∗ O1∗∗∗ ; O2∗∗ ; O3∗
Terminal ns O2∗∗∗ ; O3 O2∗∗∗ ; O3
∗ P < 0.05; ∗∗ P < 0.001; ∗∗∗ P < 0.0001.You can also read