Early Visual Cortex as a Multiscale Cognitive Blackboard
←
→
Page content transcription
If your browser does not render page correctly, please read the page content below
VS02CH07-Roelfsema ARI 22 September 2016 9:0
ANNUAL
REVIEWS Further
Click here to view this article's
online features:
• Download figures as PPT slides
• Navigate linked references
• Download citations
• Explore related articles
Early Visual Cortex as a
• Search keywords
Multiscale Cognitive
Blackboard
Access provided by Radboud Universiteit Nijmegen on 10/26/16. For personal use only.
Annu. Rev. Vis. Sci. 2016.2:131-151. Downloaded from www.annualreviews.org
Pieter R. Roelfsema1,2,3 and Floris P. de Lange4
1
Netherlands Institute for Neuroscience, 1105 BA Amsterdam, The Netherlands;
email: p.roelfsema@nin.knaw.nl
2
Department of Integrative Neurophysiology, VU University Amsterdam,
1081 HV Amsterdam, The Netherlands
3
Psychiatry Department, Academic Medical Center, 1105 AZ Amsterdam, The Netherlands
4
Donders Institute for Brain, Cognition and Behavior, Radboud University,
6525 EN Nijmegen, The Netherlands
Annu. Rev. Vis. Sci. 2016. 2:131–51 Keywords
First published online as a Review in Advance on visual cortex, cortical layers, visual routines, working memory,
July 18, 2016
decision-making
The Annual Review of Vision Science is online at
vision.annualreviews.org Abstract
This article’s doi: Neurons in early visual cortical areas not only represent incoming visual in-
10.1146/annurev-vision-111815-114443
formation but are also engaged by higher level cognitive processes, including
Copyright c 2016 by Annual Reviews. attention, working memory, imagery, and decision-making. Are these cog-
All rights reserved
nitive effects an epiphenomenon or are they functionally relevant for these
mental operations? We review evidence supporting the hypothesis that the
modulation of activity in early visual areas has a causal role in cognition. The
modulatory influences allow the early visual cortex to act as a multiscale cog-
nitive blackboard for read and write operations by higher visual areas, which
can thereby efficiently exchange information. This blackboard architecture
explains how the activity of neurons in the early visual cortex contributes to
scene segmentation and working memory, and relates to the subject’s infer-
ences about the visual world. The architecture also has distinct advantages
for the processing of visual routines that rely on a number of sequentially
executed processing steps.
131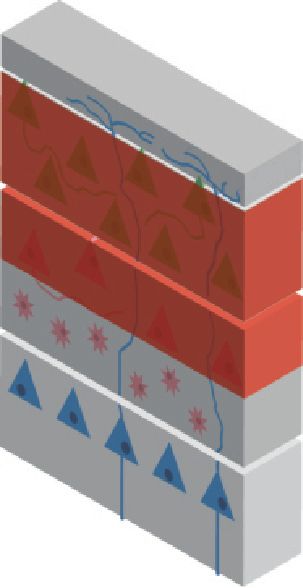
VS02CH07-Roelfsema                                                             ARI     22 September 2016            9:0

                                                                                                 INTRODUCTION
                                                                                                 Humans and nonhuman primates are visual creatures: Vision is our dominant sense, both in terms
                                                                                                 of perception (e.g., Rock & Victor 1964) and in terms of the amount of neural circuitry dedicated
                                                                                                 to it (Kaas 2008). For example, in the macaque monkey, the presence of visually responsive neu-
                                                                                                 rons and major inputs from known visual areas indicates that more than 30 separate neocortical
                                                                                                 areas are implicated in visual processing, so more than 50% of the cerebral cortex contributes to
                                                                                                 visual processing (Felleman & Van Essen 1991). Although all these cortical areas are undoubt-
                                                                                                 edly relevant for the processing of visual information, recent findings have suggested that many
                                                                                                 of them may also play an important part in cognitive processes that are not strictly visual, such
                                                                                                 as working memory or decision-making, thus blurring the boundaries between perception and
                                                                                                 cognition (Mesulam 2008).
                                                                                                     The early visual cortex receives information from higher cortical areas through numerous
Access provided by Radboud Universiteit Nijmegen on 10/26/16. For personal use only.

                                                                                                 feedback projections, at least as many as the feedforward projections from lower to higher areas
  Annu. Rev. Vis. Sci. 2016.2:131-151. Downloaded from www.annualreviews.org

                                                                                                 (Markov et al. 2011). For example, there are many feedback projections to the primary visual cortex,
                                                                                                 originating from areas within the visual system [e.g., V2–V4, V5 (or MT)], from other sensory cor-
                                                                                                 tices (e.g., the primary auditory cortex), and also from nonsensory areas in the parietal and frontal
                                                                                                 cortices (Markov et al. 2011, Muckli & Petro 2013). Thus, the early visual cortex interacts with
                                                                                                 several other cortical systems, but the role of feedback connections is only partially understood.
                                                                                                     We review and extend a theoretical framework in which feedback connections enable the early
                                                                                                 visual cortical areas to act as an active blackboard (Bullier 2001, Cavanagh 2011, Kosslyn et al.
                                                                                                 2001, Mumford 1991, Van der Velde & de Kamps 2006) where task-relevant features are high-
                                                                                                 lighted with enhanced neuronal activity. The great advantage of such a blackboard is that early
                                                                                                 visual areas encode low-level, general-purpose features. Higher areas can write to the blackboard
                                                                                                 by activating or enhancing the representation of those features that are currently of importance
                                                                                                 and by suppressing features that are not. Other higher areas can then read out these task-relevant
                                                                                                 features for further processing. This blackboard function circumvents the need for direct interac-
                                                                                                 tions between higher areas that process unrelated features, which may be difficult to implement.
                                                                                                 We review evidence in favor of such a retinotopic cognitive blackboard, drawing on previous re-
                                                                                                 sults from tasks involving scene segmentation, selective attention, working memory (Harrison &
                                                                                                 Tong 2009), mental imagery (Albers et al. 2013, Pearson et al. 2015), decision-making (Lorteije
                                                                                                 et al. 2015, Nienborg & Cumming 2009), and visual routines (Moro et al. 2010). We examine how
                                                                                                 feedback signals from higher areas to the early visual cortex can be interpreted in terms of write op-
                                                                                                 erations to the blackboard, which can then be read by other cortical areas and subcortical structures
                                                                                                 in later processing steps, thereby supporting the exchange of intermediate computational results.

                                                                                                 SCENE SEGMENTATION
                                                                                                 When we see a new image, cortical processing goes through different phases. The first phase is
                                                                                                 dominated by feedforward connections that propagate information from the lateral geniculate
                                                                                                 nucleus (LGN) of the thalamus to the primary visual cortex (area V1) and then onward to higher
                                                                                                 visual areas. During this feedforward sweep, low-level areas extract basic visual features, such as
                                                                                                 orientation, motion, and color, and higher visual areas extract more complex, semantic features,
                                                                                                 such as the presence of faces, animals, and other object categories (Hung et al. 2005, Thorpe et al.
                                                                                                 1996; reviewed in Roelfsema 2006). During the next, recurrent phase, horizontal and feedback
                                                                                                 connections come into play. Feedback connections propagate activity from higher areas back to
                                                                                                 lower areas, and horizontal connections enable interactions within the areas, for example between
                                                                                                 cells with different receptive field locations.

                                                                                         132     Roelfsema   ·   de Lange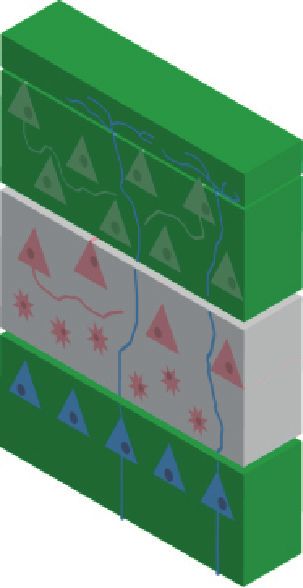
VS02CH07-Roelfsema ARI 22 September 2016 9:0
These different connection types provide distinct contributions to visual perception. Take,
for example, the texture-segregation task in Figure 1a, where we perceive a figure composed
of line elements that differ in their orientation from the background. Psychophysical (Mumford
et al. 1987, Wolfson & Landy 1998), neurocomputational (Bhatt et al. 2007), and neurophys-
iological (Lamme 1995, Poort et al. 2012, Zipser et al. 1996) studies have demonstrated that
figure–ground segregation relies on a number of processing steps. First, the feedforward sweep
activates orientation-selective neurons in low-level areas with small receptive fields and in higher
visual areas that represent the image at a coarser resolution (Figure 1b). Then, the image is repre-
sented at multiple resolutions in an image-processing pyramid (Burt & Adelson 1983, Hochstein
& Ahissar 2002). The next step is boundary detection. This process is sensitive to changes in ori-
entation at locations where the figure and background abut. The network can detect boundaries
if there are inhibitory connections between neurons that are tuned to the same orientation and
whose receptive fields are adjacent to each other (Figure 1b). Inhibition is strong in regions with
Access provided by Radboud Universiteit Nijmegen on 10/26/16. For personal use only.
a homogeneous orientation, such as the background and the center of the figure, but weaker at
Annu. Rev. Vis. Sci. 2016.2:131-151. Downloaded from www.annualreviews.org
the boundaries (Itti & Koch 2001, Roelfsema et al. 2002). As a result, neuronal activity is highest
at the boundaries between figure and background (Figure 1a,b). In this phase, the representation
of the center of the figure is still suppressed in lower visual areas, including V1. However, neurons
in higher areas that respond to the figure center increase their activity. They have larger recep-
tive fields, and this has two consequences. First, the neurons do not resolve local figure–ground
boundaries, which are, therefore, blurred. Second, neurons whose receptive fields cover the figure
receive very little inhibition from neighbors that represent pure background, causing an enhanced
activity level that psychologists call pop-out (Itti & Koch 2001, Lee et al. 2002, Poort et al. 2012).
The ensuing process is called region filling, and it relies on feedback connections from neurons
in higher visual areas that have increased activity due to pop-out (Figure 1b). The feedback inputs
amplify the activity of neurons in lower areas that code for the figure’s line elements at increasingly
precise spatial scales (Figure 1b). Next, the entire figural region is labeled with enhanced neuronal
activity at multiple scales. This region-filling process appears to be important for behavior because
the distribution of enhanced V1 activity across the figure predicts the landing position of the eye
if an eye movement is made toward the figure (Poort et al. 2012). If the response enhancement
is stronger on the right side of the figure, the landing position is biased to the right, and if the
response modulation is stronger on the left, the gaze tends to land on that side. Furthermore, if
the task demands that the animal directs attention away from the figure, region filling is weaker, as
if the representations of unattended objects are left in a more primordial state (Figure 1a). In the
blackboard metaphor: Higher visual areas write to the early visual cortex to highlight the features
of the figure. The enhanced activity is the chalk on the blackboard. Eye movement processing
centers, such as the superior colliculus and the frontal eye fields, read the pattern of enhanced
activity to determine the target for an eye movement, enabling the eye to land on the center of
gravity of the region that is labeled with enhanced activity.
Boundary detection and region filling require different computations (Roelfsema et al. 2002),
and the visual brain apparently implements these two processes through different connection
types and at different times. Furthermore, feedforward drive from the LGN strongly depends
on AMPA receptors, whereas the feedback influence for region filling depends more strongly on
NMDA receptors (Self et al. 2012). Finally, the different phases of texture segregation involve
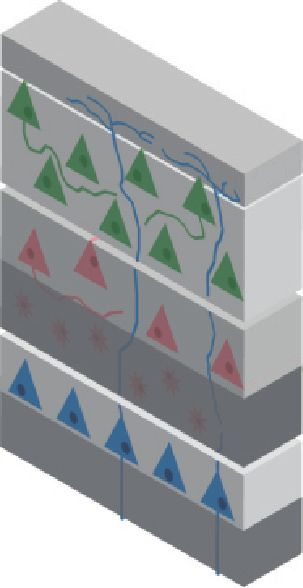
different layers of the cortex (Self et al. 2013). The activity from the LGN arrives in V1 in layers
4 and 6, and neurons in these layers then quickly propagate activity to the other cortical layers
(Figure 1c). Next, the boundaries are detected in the superficial layers of the cortex, which amplify
the representation of the boundaries. This is followed by the region-filling process that involves
feedback from higher visual areas to layers 1 and 5, which are known to be the targets of feedback
www.annualreviews.org • Early Visual Cortex as a Cognitive Blackboard 133VS02CH07-Roelfsema ARI 22 September 2016 9:0
a
Stimulus Spontaneous activity Visual response Boundary detection Region filling
Attended
40 ms 65 ms
V1 activity 95 ms
Not attended
Access provided by Radboud Universiteit Nijmegen on 10/26/16. For personal use only.
Annu. Rev. Vis. Sci. 2016.2:131-151. Downloaded from www.annualreviews.org
b
Visual response and
boundary detection Region filling
TE
TEO
V1
NMDA
AMPA
V4
V4 V2
V1
Feedforward excitation
Lateral inhibition
Input
Feedback excitation
c
Visual response Boundary detection Region filling
Feedback
Superficial
L1
V1 Layer 4
NMDA
Deep AMPA
L4
L5
40 ms 65 ms 95 ms
L6
Feedforward
(lateral geniculate nucleus)
134 Roelfsema · de LangeVS02CH07-Roelfsema ARI 22 September 2016 9:0
connections (Rockland & Virga 1989). Region filling enhances the activity elicited by the figure
in all cortical layers, but most strongly in the superficial and deep layers (Self et al. 2013).
It is an open question whether a similar succession of processes occurs for images other than
these simplified texture stimuli. Recent progress in deep learning has been made in the recogni-
tion of semantic categories in photographs by using neural networks consisting of many layers
(LeCun et al. 2015). The representations formed by these deep networks resemble those found
along the visual cortical processing hierarchy (Güçlü & van Gerven 2015, Yamins et al. 2014),
and computer vision studies have started to use semantic labels for image segmentation. These
algorithms can register which pixels belong to the various objects in a scene, using a process that
resembles the influence of corticocortical feedback (Long et al. 2014). We expect that new in-
sights into the processes of scene segmentation in the visual cortex will be obtained by comparing
neurophysiological findings to the organization of these deep networks.
Access provided by Radboud Universiteit Nijmegen on 10/26/16. For personal use only.
Annu. Rev. Vis. Sci. 2016.2:131-151. Downloaded from www.annualreviews.org
OBJECT-BASED ATTENTIONAL SELECTION
Some perceptual grouping tasks rely on a more prolonged process of recurrent interaction (Chen
et al. 2014). One example is the curve-tracing task illustrated in Figure 2a. If you want to switch
on the hair dryer, would you pick up the white or black plug? To identify the correct plug, partici-
pants trace the relevant cable by gradually spreading object-based attention over its representation
(Houtkamp et al. 2003). Reaction time increases with the length of the curve, indicating a serial
process ( Jolicoeur et al. 1991). Similarly, in the visual cortex of monkeys, curve tracing is associ-
ated with the gradual spread of enhanced neuronal activity over the representation of the curve
(Pooresmaeili & Roelfsema 2014, Roelfsema et al. 1998). Neurons with receptive fields located
near the start of the curve exhibit an earlier enhancement of their response than neurons with
receptive fields farther along the curve, and eventually the entire curve is labeled with enhanced
neuronal activity (Figure 2b). Importantly, the propagation speed of this labeling process depends
on the distance between the curves. If the traced curve is near a distracting curve, the tracing speed
is lower, but the speed is higher when the curves are farther apart ( Jolicoeur et al. 1991, Poores-
maeili & Roelfsema 2014). As a result, the processing time in Figure 2a is independent of the
viewing distance ( Jolicoeur & Ingleton 1991). If you look at the image from a distance of, say, 1 m,
you have to trace a short curve (measured in degrees of visual angle), but it is close to the distractor.
If you view it from 25 cm, its length in degrees increases by a factor of 4, but the distance between
the curves increases by the same factor, so that the total tracing time remains roughly the same.
We can explain this scale-invariant tracing speed if tracing relies on the blackboard’s multiple
scales. The tracing process involves neurons with different receptive field sizes at different levels
of the visual cortical hierarchy. Figure 2c illustrates this idea. Initially, the curves are far apart,
←−−−−−−−−−−−−−−−−−−−−−−−−−−−−−−−−−−−−−−−−−−−−−−−−−−−−−−−−−−−−−−−−−−−−−−−−−−−−−−−−−−−−−−−−−−
Figure 1
Neuronal computations for texture segregation. (a) Stimulus with a square figure composed of line elements with one orientation
superimposed on a background with a different orientation (left ). The other subpanels illustrate the successive processing phases in V1.
First, features are registered, and then V1 activity increases at the boundaries. Finally, region filling occurs, so that the V1
representation of image elements in the figure’s interior is also enhanced. Region filling is incomplete for nonattended figures (Poort
et al. 2012). (b) Feedforward connections use AMPA receptors to propagate activity to higher areas with larger receptive fields (black
arrow). Boundary detection (and pop-out) occurs at each level because neurons that are tuned to the same orientation inhibit one
another (red connections). Feedback connections depend on NMDA receptors, and they enhance activity at the figure’s center for region
filling ( green arrow) (Self et al. 2012). (c) Features are first registered in layers 4 and 6 of area V1 ( gray). Boundary detection (red ) occurs
slightly later in the superficial layers, and region filling ( green) occurs due to feedback to the superficial layers and layer 5, causing an
enhancement of firing rates that is most prominent in the superficial and deep layers (Self et al. 2013).
www.annualreviews.org • Early Visual Cortex as a Cognitive Blackboard 135VS02CH07-Roelfsema ARI 22 September 2016 9:0
a Stimulus b Area V1
i
iii
ii iv
106 ms i 375 ms
iii
0 200 400 600 0 200 400 600
ii iv Time (ms) Time (ms)
Access provided by Radboud Universiteit Nijmegen on 10/26/16. For personal use only.
Annu. Rev. Vis. Sci. 2016.2:131-151. Downloaded from www.annualreviews.org
c
V4
V2
V1
Time
d V1 FEF
FEF 166 ms 158 ms
V1
0 200 400 0 200 400
Time (ms) Time (ms)
Figure 2
Neuronal mechanisms for object-based attention at multiple spatial scales. (a) A serial process is invoked in a curve-tracing task. Here,
the task is to determine which plug is connected to the hair dryer. (b) V1 neurons enhance their response if the RF falls on the target
curve (left, yellow response; see the RF labeled ii in panel a) compared with when it falls on the distractor (black response; i in panel a). The
response enhancement occurs at a later time point for RFs farther along the curve (right; RFs labeled iii, iv in panel a). (c) Contour
grouping proceeds at a high speed if curves are far apart. Presumably, it relies on the propagation of enhanced activity among neurons
in higher areas with large RFs. Yellow circles represent RFs that have been reached by the propagating wave of enhanced activity.
These neurons also send feedback to neurons in lower areas, enhancing the activity elicited by the relevant curve (red downward arrows).
If curves are close to each other, multiple curves fall within one RF in the higher areas, so neurons in lower areas with smaller RFs take
over because propagation in the higher areas is blocked (red circles). Propagation in the lower areas is slower because it relies on neurons
with smaller RFs. If the response modulation reaches a region of the image where the distance between curves is larger, the higher areas
can resume the propagation process, and its speed increases (Pooresmaeili et al. 2014). (d ) If curves are far apart, the spread of
object-based attention has similar timing in V1 and the FEFs (Pooresmaeili & Roelfsema 2014). Abbreviations: FEF, frontal eye field;
RF, receptive field.
136 Roelfsema · de LangeVS02CH07-Roelfsema ARI 22 September 2016 9:0
and tracing proceeds at high speed in the higher visual areas where the receptive fields are large.
Neurons in lower areas receive feedback from higher areas (Figure 2c) so that the propagation
is also fast. When the curves are near to each other, however, the larger receptive fields cannot
resolve the individual curves and propagation in higher areas is blocked. According to this model,
the lower areas have to take over, but at a slower speed due to their smaller receptive fields. Farther
along the curve, the distance between the curves increases again, so the higher areas can resume
their contribution to the tracing process. Measurements of the propagation delays in monkey
V1 during the curve-tracing task have provided strong evidence in favor of such a multiscale
blackboard model, revealing a horizontal propagation of approximately 50 ms per receptive field
at the level where the fastest progress is made (Pooresmaeili & Roelfsema 2014).
A recent study made simultaneous recordings in V1 and the frontal eye fields (FEFs), a frontal
area involved in eye movement planning, during curve tracing (Pooresmaeili et al. 2014). Remark-
ably, the latency of attentional selection (i.e., the labeling process) in the visual and frontal cortices
Access provided by Radboud Universiteit Nijmegen on 10/26/16. For personal use only.
was similar (Figure 2d ). Yet in V1, the amplitude of the attentional signal was smaller than in
Annu. Rev. Vis. Sci. 2016.2:131-151. Downloaded from www.annualreviews.org
the FEF, and it saturated early during the trials. The selection signal in the FEF kept increasing
until the behavioral response (an eye movement), as if the neurons in the FEF were integrating
attentional signals in the visual cortex (reading from the blackboard). The delay between the V1
and FEF neurons that represented the same curve was remarkably short, much shorter than that
between V1 neurons representing different segments of an elongated curve (Figure 2b). However,
this near-simultaneity broke down if the monkey made an error. In error trials, enhanced activity
for the wrong curve first appeared in the FEF, which then imposed the erroneous selection signal
onto the visual cortex, where it was expressed more than 100 ms later (Pooresmaeili et al. 2014,
Roelfsema & Spekreijse 2001). The fact that selection signals in the FEF influence attentional
signals in the visual cortex also follows from studies that used electrical microstimulation to per-
turb activity. If the activity of the FEF neurons with a receptive field at a particular location is
increased with microstimulation, the activity of neurons in the visual cortex that represent the
same location also increases (Armstrong et al. 2006, Ekstrom et al. 2008, Moore & Armstrong
2003). Thus, the reciprocal interactions between the visual cortex and higher areas enable the
coselection of the same stimulus across different brain regions, which is essential for perceptual
organization (Duncan et al. 1997).
The slow, serial processing that characterizes curve tracing generalizes to other perceptual
grouping tasks. It is relatively easy to construct stimuli for which comparable delays occur during
grouping by proximity, common fate, and similarity (Houtkamp & Roelfsema 2010), and these
grouping cues cause a comparable spread of attentional selection signals in the visual cortex (Gilad
et al. 2013, Li et al. 2006, Wannig et al. 2011). In all these cases, perceptual grouping is accompanied
by the labeling of the to-be-grouped image elements in the visual cortex with enhanced neuronal
activity (the precise relationship between object-based attention and perceptual grouping has
been discussed in Roelfsema & Houtkamp 2011). Again, the lower visual areas appear to provide
a blackboard to which the higher areas write the outcome of their computations, establishing
groupings by labeling neurons with enhanced activity. Neurons in the lower areas could actively
participate in this labeling process through horizontal connections, and higher areas could read
from this blackboard whenever subsequent mental processing steps or overt behavior depended on
the established groupings, for example for planning an eye movement (Pooresmaeili et al. 2014,
Poort et al. 2012) or arm movement toward the correct plug in Figure 2a. So far, the evidence for
a causal role of these response modulations in perceptual grouping has remained indirect. Future
studies might test whether interfering with the modulation of activity in the early visual cortex
impairs perceptual grouping and object-based attention.
www.annualreviews.org • Early Visual Cortex as a Cognitive Blackboard 137VS02CH07-Roelfsema ARI 22 September 2016 9:0
MAINTAINING AND MANIPULATING VISUAL INFORMATION
The sections above illustrate how the early visual cortex can assist in complex perceptual op-
erations. However, many cognitive processes do not act upon information that is immediately
available to the eyes, but rather on information that is kept in working memory. Do early vi-
sual areas also have a role in working memory and can they contribute to the maintenance and
manipulation of information that is not directly visible? Traditionally, these mnemonic functions
have been ascribed to prefrontal neurons that show sustained, elevated neural firing during the
maintenance of visual information (Goldman-Rakic 1995), but the evidence for working memory
in sensory areas is more equivocal (Pasternak & Greenlee 2005). Several studies have shown that
activity in the early visual cortex of awake-behaving monkeys during the maintenance of sensory
material is at baseline levels (Lee et al. 2005), or weak and transient (Ferrera et al. 1994, Zaksas &
Pasternak 2006), unless the to-be-remembered stimulus remains on the screen (Supèr et al. 2001).
Access provided by Radboud Universiteit Nijmegen on 10/26/16. For personal use only.
A recent study has observed sustained, working-memory-related spiking activity in the MST re-
Annu. Rev. Vis. Sci. 2016.2:131-151. Downloaded from www.annualreviews.org
gion but not the earlier sensory MT region, suggesting a sharp boundary between early visual
areas, which are involved in perception, and late visual areas, which are involved in mnemonic
processes (Mendoza-Halliday et al. 2014).
Contrary to this notion, however, recent data from the Roelfsema lab have indicated elevated
spiking activity in V1 during the maintenance of visual material in memory (van Kerkoerle et al.
2014). In support of this view, neuroimaging studies in humans have uncovered orientation-
selective activity patterns in the early visual cortex (V1–V4) during the maintenance of oriented
stimuli in working memory (Albers et al. 2013, Harrison & Tong 2009, Serences et al. 2009).
Note, however, that this finding might arise from the nature of the measurements: BOLD (blood
oxygen level–dependent) signals represent a mass action signal that is sensitive to variations in the
firing rate of neurons but also to synaptic activity that does not translate into spiking (Logothetis &
Wandell 2004), and that is manifested only in the local field potentials (Mendoza-Halliday et al.
2014). Although more research is needed, it is conceivable that the involvement of brain regions in
maintaining visual information depends on the exact stimulus properties and task demands, rather
than there being a strict dividing line between sensory and memory-related regions. Mnemonic
activity in early visual areas might be necessary in tasks that require memory for low-level features
and a high spatial resolution.
Humans and nonhuman primates (Rainer et al. 1999) not only are able to maintain information
over time, but also can mentally manipulate internally stored visual information. For example,
when determining whether the letters depicted in Figure 3a are in normal or mirror image form,
participants typically report mentally rotating the letters into their upright form and inspecting
the resulting mental image (Kosslyn 1996). In line with this suggestion, the time required for
these judgments monotonically increases with the amount of mental rotation required (Shepard
& Cooper 1982, Shepard & Metzler 1971).
Are early visual cortical areas involved in the mental manipulation of visual content? Recent
neuroimaging studies in humans have indicated that this is indeed the case (Albers et al. 2013,
Stokes et al. 2009). For example, Albers et al. (2013) compared the cortical representation in
the early visual cortex during working memory and mental imagery to that elicited by bottom-
up stimulation. Participants saw images of oriented gratings, which they had to memorize or
rotate mentally (Figure 3b). Overall levels of BOLD activity in the visual system were increased
after presentation of the stimuli, but dropped in the intervening maintenance or manipulation
interval (Harrison & Tong 2009). Importantly, the pattern of BOLD activity across voxels in
the early visual cortex during this interval reliably reflected the stimulus in working memory
(Figure 3c), or, in the case of mental rotation, what the stimulus looked like after mental rotation
138 Roelfsema · de LangeVS02CH07-Roelfsema ARI 22 September 2016 9:0
a b
R J Working
memory
Maintain ... ?
G
F Mental Rotate 120° ... ?
rotation clockwise
c d
Access provided by Radboud Universiteit Nijmegen on 10/26/16. For personal use only.
Presented stimulus Presented stimulus
Annu. Rev. Vis. Sci. 2016.2:131-151. Downloaded from www.annualreviews.org
(maintained) Rotated stimulus
50 50
Classifier choice (%)
Classifier choice (%)
40 40
30 30
Delay period Probe Delay period Probe
20 20
−2 0 2 4 6 8 10 12 14 16 18 20 −2 0 2 4 6 8 10 12 14 16 18 20
Time (s) Time (s)
Figure 3
Mental manipulation of images. (a) Example of a mental rotation test. Are these letters in normal or mirror image form? Participants
respond more quickly to the top row (R is the mirrored letter, and J the canonical letter) than the bottom row (F is the mirrored letter,
and G the canonical letter) due to the smaller amount of mental rotation necessary to turn the letters to their upright position. (b) Task
setup of Albers et al. (2013). Participants had to either memorize a visually presented grating for 10 s (working memory) or mentally
rotate the grating and imagine the rotated stimulus. After the memory delay, the participants had to compare the orientation that they
had in mind to the orientation of a probe. BOLD (blood oxygen level–dependent) activity patterns in the visual cortex were recorded
during task performance using functional magnetic resonance imaging. (c) During working memory, BOLD activity patterns in the
visual cortex resembled the bottom-up activity patterns of the stimulus that was maintained in working memory. (d ) During mental
rotation, activity patterns in the visual cortex initially resembled the bottom-up activity patterns of the presented stimulus, but
subsequently resembled the mentally rotated stimulus.
(Figure 3d ). Moreover, these BOLD patterns were similar to those elicited during bottom-up
visual stimulation, implying a common internal representation for perception and imagery.
Although mental imagery is difficult to assess in nonhuman primates, several studies have
suggested that monkeys do indeed also form mental images. For example, when arrows become
associated with certain motion directions via learning, presentation of an arrow can elicit direction-
selective activity of MT neurons tuned to the respective motion direction (Albright 2012, Schlack
& Albright 2007). Related findings have been obtained in the inferotemporal (Sakai & Miyashita
1991) and frontal cortices (Rainer et al. 1999). For example, Rainer et al. (1999) trained monkeys
to associate a sample stimulus with a test stimulus. After training, the presentation of the sample
www.annualreviews.org • Early Visual Cortex as a Cognitive Blackboard 139VS02CH07-Roelfsema ARI 22 September 2016 9:0
stimulus gradually recruited neurons representing the test stimulus during a memory epoch when
monkeys anticipated making a judgment based on this test stimulus.
Does the modulation of activity in the early visual cortex during working memory and imagery
have a causal influence or is it an epiphenomenon caused by the presence of feedback connections
from higher cortical areas? The use of transcranial magnetic stimulation (TMS) that disrupted
activity in the early visual cortex during imagery (Kosslyn et al. 1999) and working memory tasks
(van de Ven et al. 2012) has suggested that activity in the early visual cortex is indeed read out and
influences task performance, although this is still an active topic of ongoing research.
These results, taken together, provide support for our hypothesis that early visual areas can serve
as a blackboard for the information generated by bottom-up perception and are involved not only
in the modulation of this information by attention but also during higher level cognitive processes,
including working memory and imagery (Bullier 2001, Harrison & Tong 2009, Roelfsema 2005).
Access provided by Radboud Universiteit Nijmegen on 10/26/16. For personal use only.
Annu. Rev. Vis. Sci. 2016.2:131-151. Downloaded from www.annualreviews.org
PERCEPTUAL DECISION-MAKING
Perceptual decision-making refers to the deliberate and effortful process of collecting sensory
evidence over time or space, resulting in the commitment to a categorical proposition (Gold &
Shadlen 2007, Schall 2001). Decision-making is intimately related to working memory because it
requires integrating previous sensory evidence in memory with new evidence that comes in. Much
progress has been made in terms of understanding how we accrue and weigh sensory evidence
and how and when a decision is made. For example, when a link is imposed between a perceptual
decision and a particular course of action (e.g., an eye movement), movement-selective neurons in
the parietal and prefrontal cortices ramp up activity during the decision process, and this activity
reaches a stereotypical peak just prior to movement onset when the neurons have reached a
critical firing rate. This suggests that these neurons accumulate evidence for a perceptual decision
(Shadlen & Newsome 1996). Neuronal activity in these structures is also influenced by the prior
probabilities of different stimuli and the reward structure of the task (Platt & Glimcher 1999),
just as is required for making optimal decisions (Gold & Shadlen 2001). The activity of sensory
neurons, however, does not always show a ramping profile and is often only weakly predictive
of the ultimate decision (Britten et al. 1996, Shadlen et al. 1996). Some studies, therefore, have
suggested that the role of sensory areas is restricted to providing momentary evidence (Law &
Gold 2008), which accumulates downstream into a decision. Yet other studies have revealed clear
signatures of the decision outcome in the early visual cortex. For example, when monkeys perform
a curve-tracing task, the activity of the V1 neurons that represent the traced curve is enhanced,
even if the animals mistakenly trace the wrong curve (Roelfsema & Spekreijse 2001). The influence
of a perceptual decision on the activity of sensory neurons is called choice probability, and this
effect is presumably related to top-down influences on the visual cortex from areas that make the
decision. Similarly, the reward structure of a curve-tracing task has been shown to influence V1
activity: Curves associated with larger rewards elicit stronger activity than curves associated with
smaller rewards (Stănişor et al. 2013).
Although the choice probabilities in the curve-tracing task reflect the covert selection of one
of a number of curves, Nienborg & Cumming (2009) used choice probabilities to demonstrate
a clear relation between neuronal activity in the early visual cortex and the perceptual repre-
sentation of the sensory features of a stimulus. Monkeys were engaged in a binocular dispar-
ity discrimination task in which the information about the depth of a stimulus was presented
in a time-varying and stochastic manner. The authors found that early disparity information
influenced the monkey’s decision and that later information was less effective, as if the animal had
already made up its mind. Nevertheless, the activity of V2 neurons was related to the monkey’s
140 Roelfsema · de LangeVS02CH07-Roelfsema ARI 22 September 2016 9:0
a b c
D1 D2
80.0
Reconstructed direction (degrees)
I
Perceived
Real
62.5 b FB
fMRI activation E1 E2
pattern 45.0
I
27.5
X
σ
10.0
Access provided by Radboud Universiteit Nijmegen on 10/26/16. For personal use only.
10.0 27.5 45.0 62.5 80.0
Annu. Rev. Vis. Sci. 2016.2:131-151. Downloaded from www.annualreviews.org
Presented direction (degrees)
?
Figure 4
Influence of decision-making on activity in the early visual cortex. (a) Participants engaged in a motion identification task, in which they
had to indicate the predominant direction of motion of a cloud of moving dots. Perceptual decisions were biased by presenting subjects
with a tone prior to each trial, which indicated the likely direction of motion. Behavior and activation patterns were collected using
fMRI. (b) Tone cues biased the perceived direction of motion as well as the sensory representation of motion direction in the early
visual cortex, as reconstructed from the patterns of activity (Kok et al. 2013). (c) Recurrent network model composed of a sensory circuit
(E1 and E2) that is coupled to a decision population (D1 and D2). Such a network can mimic the backpropagation of decision signals to
sensory populations (Wimmer et al. 2015). Abbreviation: fMRI, functional magnetic resonance imaging. Panel c was adapted from
Wimmer et al. (2015).
decision for the full duration of the sensory sampling epoch, which suggested that the neurons
received a disparity-related, feature-selective feedback signal from neurons in higher areas coding
for the decision about disparity (Cohen & Newsome 2008).
Functional magnetic resonance imaging studies in humans have also revealed an influence of
sensory decisions on activity in the early visual cortex. For example, when predictive cues or stim-
ulus statistics bias a perceptual decision, this alters choice-related signals in early visual cortical
areas (Kok et al. 2012, 2014). Furthermore, manipulating participants’ expectation about the likely
direction of motion biases the perceptual decision as well as the neural representations in the early
visual cortex (Kok et al. 2013) that can be gleaned from the BOLD activity patterns (Figure 4a,b).
Together, these findings cast decision-making as a process of probabilistic inference, in which
sensory and decision-related neurons are in a hierarchical and interactive relationship (Haefner
et al. 2015, Nienborg & Roelfsema 2015, Summerfield & de Lange 2014). Neurocomputational
modeling efforts (Wimmer et al. 2015; Figure 4c) have successfully described how interactions
between decision and sensory neurons can give rise to the observed time courses of choice prob-
ability and evidence integration. As argued earlier, the role of the visual system may be likened to
that of a dynamic blackboard, which not only provides information to a decision process but on
which the unfolding decision process also writes.
COMPLEX DECISIONS AND VISUAL ROUTINES
Although many studies have focused on the neuronal processes underlying simple decisions, the
neuronal correlates of decision-making have also been studied in more complex decision tasks.
Lorteije et al. (2015), for example, recently studied the neuronal mechanisms of a hierarchical
www.annualreviews.org • Early Visual Cortex as a Cognitive Blackboard 141VS02CH07-Roelfsema ARI 22 September 2016 9:0
decision-making task in areas V1 and V4 of monkeys. The animals had to find the optimal path in
an explicit decision tree (Figure 5a). They first had to make a decision at choice point L1, next to
the fixation point, where they had to choose the branch with the brightest initial segment. After
this, the monkeys encountered a second choice point (L2 or L2 , depending on their choice at L1)
where they had to choose the brightest branch once more and then select the circle at the end of this
branch as the target for an eye movement (Figure 5a). Importantly, the luminance information at
the three choice points was presented in a stochastic, time-varying manner so that the monkeys had
to integrate luminance information over time to make optimal decisions. One might have expected
that the monkeys would first decide about the choice point at L1 and then consider the downstream
L2 decision so that they would not have to evaluate the irrelevant choice point L2 . However, the
data suggested a different strategy. V1 and V4 neurons initially integrated luminance information
for all choice points in parallel, starting at a latency of approximately 115 ms after the appearance
of the stimulus. During this phase, the curves connected to the brighter branches were labeled
Access provided by Radboud Universiteit Nijmegen on 10/26/16. For personal use only.
with enhanced neuronal activity (Figure 5a). This was followed by a later phase during which the
Annu. Rev. Vis. Sci. 2016.2:131-151. Downloaded from www.annualreviews.org
monkey’s decision about all choice points became apparent, approximately 225 ms after stimulus
onset (Figure 5a). At that point, the monkey’s commitment to the L1 choice boosted the selection
of the L2 decision behind the brighter L1 branch while evidence integration at the now irrelevant
L2 decision declined. As a result of interactions between these local decision signals, the full path
between the fixation point and the correct target for an eye movement was eventually labeled with
enhanced neuronal activity in V1 and V4. Thus, in a decision-making task, the blackboard appears
to represent the accumulation of evidence. The high spatial resolution representations in the early
visual cortex may be essential for selecting one of a number of branches if they are close to one
another in the image.
Although the decision tree in Figure 5a involved multiple similar decisions about brightness,
there are also many tasks that involve a number of subtasks that are more heterogeneous (Ullman
1984). As a real world example, consider the task of making a cup of tea, which involves many
substeps: locating the teacup, locating the teabag, putting the teabag in the cup, etc. In these
cases, it can be useful to store the outcome of a decision on the retinotopic blackboard so that
the next operator can act upon it. A location or feature that is the end product of one cognitive
operation is tagged by enhanced neural activity, which can then be read out as the starting point
for a subsequent operation. Empirical evidence for such a role of the visual system in multistep
−−−−−−−−−−−−−−−−−−−−−−−−−−−−−−−−−−−−−−−−−−−−−−−−−−−−−−−−−−−−−−−−−−−−−−−−−−−−−−−−−−−−−−−−−−→
Figure 5
Complex decisions and visual routines. (a) Hierarchical decision-making task. The monkeys had to mentally trace curves and make
decisions at the bifurcations L1, L2, and L2 by choosing the path with the brightest curve elements. The visually driven activity in V1
and V4 was followed by a phase (starting at approximately 115 ms after stimulus onset) during which evidence for the three decisions
was integrated in parallel. In a later phase, the path toward the correct eye movement target was labeled with enhanced activity as the
result of interactions between the three local decisions while the incorrect path was suppressed. (Right) Time course of the visual
response (black), the parallel integration phase (red; extra activity elicited by all the target branches), and the overall strategy ( yellow;
extra activity at L2 relative to L2 ). (b) Search-then-trace task. The monkey had to search for a marker with the same color as the
fixation point (T-marker) and then trace the target curve connected to this marker and make an eye movement to a target disc at the
end of this curve. (c) The response enhancement due to search (red; 228 ms) preceded the response enhancement due to tracing ( yellow;
287 ms). (d ) Pseudocode that illustrates the concept of parameter transfer. The subroutines require variables as input and produce
output that is stored in other variables. For example, Search_Color uses the variable Col as input, and it then retrieves Loc1, which is
the location on the retinotopic map where this color is found. In a computer program, the variables refer to memory locations that hold
the relevant information. The variable Loc1, for example, has to be stored so that it can be transferred to the subsequent tracing
operation that has to start at this location. In the cortex, this variable can be stored as a focus of enhanced activity in the early visual
cortex (red circle in c). Panel a adapted from Lorteije et al. (2015). Panels b–d adapted from Moro et al. (2010).
142 Roelfsema · de LangeVS02CH07-Roelfsema ARI 22 September 2016 9:0
tasks has been provided in the realm of visual search-and-trace tasks (Moro et al. 2010, Roelfsema
et al. 2003).
One example task is illustrated in Figure 5b. The monkey had to search for a marker that was
cued by the color of the fixation point and he then had to mentally trace a curve that started at
this marker to locate a disc that was the target of an eye movement. Activity in V1 revealed the
a Hierarchical decision task
FP Eye
Stochastic movement
evidence 40 ms, visual response
L1
115 ms, parallel integration
L2 L2'
225 ms, strategy
Access provided by Radboud Universiteit Nijmegen on 10/26/16. For personal use only.
Annu. Rev. Vis. Sci. 2016.2:131-151. Downloaded from www.annualreviews.org
Visual response Parallel integration Strategy
Stimulus onset
Time
b Search then trace
Fixation
Stimulus
Eye movement
D-marker
T-marker
D-disc
T-disc
–300 ms
0 ms
600 ms
Time
c d
Visual Search Trace
V1 Search_then_Trace
{
Col = Register_Color(FP)
Loc1 = Search_Color(Col)
Loc2 = Trace_Curve(Loc1)
Initiate_Saccade(Loc2)
40 ms, visual response }
228 ms, search
287 ms, tracing
0 200 400 600
Time (ms)
www.annualreviews.org • Early Visual Cortex as a Cognitive Blackboard 143VS02CH07-Roelfsema ARI 22 September 2016 9:0
order of cognitive steps. First, neurons coded the visual attributes of the stimulus, at a latency of
40 ms. This was followed by a phase during which the visual search process labeled the target
marker with enhanced neuronal activity in V1 (after 228 ms; Figure 5c). In the last phase, the V1
representation of the relevant curve, including the disc that was the target of the eye movement,
was enhanced. Note how this task illustrates the utility of the early visual cortex as a cognitive
blackboard, which enables the exchange of information between successive processing steps. It
is likely that the color of the fixation point is first registered in regions of the visual and frontal
cortices and that these areas feed back to earlier visual areas to highlight the location of the marker
that has the same color (Hamker 2005, Spaak et al. 2016, van der Velde & de Kamps 2001). This
focus of enhanced activity in the retinotopic cortex can then be read out from the blackboard and
used as the starting point for the subsequent tracing operation.
Figure 5d illustrates how a computer programmer would implement parameter transfer by
storing the intermediate result of the search operator in a variable called Loc1, which is provided
Access provided by Radboud Universiteit Nijmegen on 10/26/16. For personal use only.
as a starting point for the subsequent tracing operator. Within a computer, these operations are
Annu. Rev. Vis. Sci. 2016.2:131-151. Downloaded from www.annualreviews.org
associated with the copying of parameter values between memory locations in the computer during
run time. The blackboard hypothesis proposes that the temporary storage can take place in the
early visual cortex by highlighting the relevant features with enhanced neuronal activity, without
the need to copy the values from one area to another. Area V1 may store spatial locations and
elementary features in this way, whereas mid-level areas might store other features, such as the
direction of motion (areas MT and MST) and color (area V4). These mid-level areas could also
be the sites of write operations that highlight neuronal representations of task-relevant features
so that subsequent read operations can use the response enhancement as input for successive
cognitive steps.
CHALLENGES FOR THE BLACKBOARD HYPOTHESIS
The hypothesis that the early visual cortex can act as a cognitive blackboard faces a number
of challenges. First, low-level attributes, such as luminance contrast, have a strong influence
on the activity in the early visual cortex. Is it possible to highlight task-relevant features on the
blackboard if they have a lower luminance contrast than irrelevant features? Previous work suggests
that it is. Pooresmaeili et al. (2010) have demonstrated that it is possible to separately decode
luminance contrast and behavioral relevance from V1 activity because there are neurons in the
early visual cortex that are influenced by attention (A-neurons) and other neurons that are not (N-
neurons). Higher visual areas can retrieve veridical information about luminance contrast from the
N-neurons, and they can also selectively read out what has been highlighted on the blackboard
by evaluating the difference in activity between A- and N-neurons. Thus, variations in contrast
across a visual scene need not interfere with blackboard functionality.
Eye movements, which occur on average three times per second, are another challenge for
the blackboard. They shift the visual image across the retina and cause a new wave of feedfor-
ward input into the visual areas, which requires updating the pattern of response modulations on
the blackboard. Interestingly, the approximately 300 ms fixation period between successive eye
movements is longer than the processing time needed for the feedforward analysis of the visual
scene. Therefore, the interval between eye movements provides a time window for information
exchange via the blackboard. In this view, the length of the typical fixation reflects a trade-off
between the need to exchange information via the blackboard and the advantage of acquiring new
visual information by making a saccade. Moreover, eye movements do not completely erase the
blackboard because higher areas may help to remap the blackboard’s content after every saccade
(Melcher & Colby 2008). To test the impact of eye movements on V1 activity during curve tracing,
144 Roelfsema · de LangeVS02CH07-Roelfsema ARI 22 September 2016 9:0
Khayat et al. (2004) required monkeys to make eye movements across a curve-tracing stimulus.
The monkeys previewed the stimulus so that they knew the course of the target curve before they
made the saccade. If the eye movement brought a contour element into a V1 receptive field, the
response enhancement occurred approximately 50 ms earlier if the stimulus had been previewed
compared with when it had not been previewed. The implication is that task-relevant information
highlighted on the blackboard is quickly restored after every saccade.
CONCLUDING REMARKS
In this review, we have put forward the view that cognitive operations may use the early visual
cortex as a multiscale cognitive blackboard. This hypothesis is supported by a multitude of cognitive
operations beyond the detection of the low-level features in which the visual cortex assists, some
of which were reviewed here. Blackboard architectures have distinct computational advantages.
Access provided by Radboud Universiteit Nijmegen on 10/26/16. For personal use only.
They allow processors in higher visual areas to write their intermediate computational results
Annu. Rev. Vis. Sci. 2016.2:131-151. Downloaded from www.annualreviews.org
to lower areas where they can be represented in a format that is accessible for other processors
and can be easily read out for subsequent computations. The cognitive blackboard also enables
analysis at multiple spatial scales (Hochstein & Ahissar 2002). If the task can be solved at a coarse
resolution, higher visual areas with large receptive fields can make quick progress, but when the
task requires an analysis of fine details, lower areas come into play, usually at the cost of increased
processing times. In previous work, we have suggested that sequences of read and write operations
resemble the functionality of a Turing machine. In a Turing machine, the input and the content
of memory jointly determine the next action, which then writes new information to the memory
to bias the selection of subsequent actions (Zylberberg et al. 2011). Van der Velde & de Kamps
(2006) have proposed a related blackboard architecture for language processing that enables the
flexible binding of words and concepts into larger sentences.
The evidence that higher cortical areas write to the blackboard of lower areas is compelling
because many perceptual processes, such as texture segregation, visual search, and contour group-
ing, influence neuronal activity in the early visual cortex. These operations highlight visual features
that are of current behavioral relevance. In addition, the blackboard may be used to exchange infor-
mation when the stimulus is no longer in view, and we have reviewed evidence for the contributions
of the early visual cortex to working memory and the mental manipulation of visual information
(imagery). Determining the precise involvement of the early visual cortex in these mnemonic
processes is an active topic of current research.
A crucial and complementary aspect of the blackboard functionality is that other brain areas
read the information that has been stored in previous processing steps. We reviewed indirect
evidence for read out in the texture-segregation task in which the pattern of response enhance-
ment elicited by a figure predicts the precise landing position of the eye, which suggests that
eye movement centers are sensitive to the pattern of activity on the blackboard. More direct
tests of reading the blackboard rely on causal techniques to influence the response modulations
in early visual areas without interfering with the initial propagation of information from lower
to higher areas after the presentation of a new visual stimulus. Researchers have applied TMS
pulses to disrupt activity in the early visual cortex at a point in time when the visual informa-
tion has reached the higher visual areas. These TMS studies have revealed that interference
with V1 activity indeed impairs accuracy in a number of cognitive processes that, according to
our view, should rely on the blackboard, including texture segregation (Heinen et al. 2005),
scene perception (Koivisto et al. 2011), visual search ( Juan & Walsh 2003), imagery (Kosslyn
et al. 1999), and the storage of information in working memory (van de Ven et al. 2012). Fu-
ture studies might use newly developed methods, such as optogenetics, to influence neuronal
www.annualreviews.org • Early Visual Cortex as a Cognitive Blackboard 145VS02CH07-Roelfsema ARI 22 September 2016 9:0
activity in a more precise manner and to further scrutinize the predictions of the blackboard
hypothesis.
The cognitive blackboard provides a unifying framework for understanding the distinct, or
even seemingly conflicting, hypotheses that the labeling of neurons with enhanced activity in the
early visual cortex is the neuronal correlate of selective attention (Chelazzi et al. 2001), perceptual
organization (Li et al. 2006, Roelfsema 2006), decision-making (Lorteije et al. 2015, Nienborg &
Cumming 2009), visual routines (Moro et al. 2010), belief states (Nienborg & Roelfsema 2015), or
the value of visual stimuli (Baruni et al. 2015, Stănişor et al. 2013). These cognitive processes have
often been studied separately, but they are all associated with the propagation of selection signals
that cause task-relevant information to be highlighted on the blackboard. In decision-making
tasks, the subject has to integrate sensory evidence to determine the next item that is relevant.
Evidence integration is then associated with a gradual increase in the blackboard’s representation
of the item that needs to be selected. If the accumulation process goes awry and an erroneous
Access provided by Radboud Universiteit Nijmegen on 10/26/16. For personal use only.
item is highlighted, the subject makes an error, thus explaining the relation between neuronal
Annu. Rev. Vis. Sci. 2016.2:131-151. Downloaded from www.annualreviews.org
activity in the early visual cortex and the subject’s perceptual decision (Kok et al. 2013, Nienborg
& Roelfsema 2015). Furthermore, if items are associated with different reward levels, blackboard
activity depends on the relative value of these items. Similarly, if the task demands the formation
of perceptual groups, as is the case in texture-segregation and contour-grouping tasks, all features
that belong to the task-relevant perceptual group are highlighted together on the blackboard
(Roelfsema 2006, Roelfsema & Houtkamp 2011). Psychologists describe this selection process as
attentional selection. Thus, it is precisely the information that needs to be transferred from one
cognitive step to the next in a visual routine that is within the focus of the subject’s attention. We
expect that future studies will continue to take advantage of the blackboard metaphor as a unifying
framework for the many cognitive influences on neuronal activity in the early visual cortex, their
computational advantages for information transfer in computational neuroscience, and the role
of attention in cognitive psychology.
SUMMARY POINTS
1. The early visual cortex not only encodes sensory input but also assists in several cognitive
operations, including attention, perceptual organization, working memory, imagery, and
decision-making.
2. During these operations, the early visual system may serve as a cognitive blackboard,
storing intermediate and final computations of other processors by highlighting relevant
features with enhanced neuronal activity.
3. Higher areas can write to the blackboard by activating or enhancing the representation of
features that are currently relevant and by suppressing features that are not. Intermediate
computational results are thereby made available in a format that is easily read out for
the computation of other processors.
4. If a visual object is selected for further processing, neurons in the early visual cortex that
code the various features of the object enhance their response. As a result, these features
are grouped in perception.
5. Neurons in the early visual cortex represent the stimuli held in working memory, and
they also encode imagined stimuli during visual imagery.
146 Roelfsema · de LangeYou can also read