Ashburton Labour Force Plan - Assessing Ashburton's labour force and addressing its labour shortages - NZIER
←
→
Page content transcription
If your browser does not render page correctly, please read the page content below

Ashburton Labour Force Plan
Assessing Ashburton’s labour force and addressing its
labour shortages

NZIER final report to Ashburton District Council
23 October 2018
About NZIER
NZIER is a specialist consulting firm that uses applied economic research and analysis
to provide a wide range of strategic advice to clients in the public and private sectors,
throughout New Zealand and Australia, and further afield.
NZIER is also known for its long-established Quarterly Survey of Business Opinion and
Quarterly Predictions.
Our aim is to be the premier centre of applied economic research in New Zealand.
We pride ourselves on our reputation for independence and delivering quality
analysis in the right form, and at the right time, for our clients. We ensure quality
through teamwork on individual projects, critical review at internal seminars, and by
peer review at various stages through a project by a senior staff member otherwise
not involved in the project.
Each year NZIER devotes resources to undertake and make freely available economic
research and thinking aimed at promoting a better understanding of New Zealand’s
important economic challenges.
NZIER was established in 1958.

Authorship
This paper was prepared at NZIER by Christina Leung, Dr Eilya Torshizian and Dion
Gamperle.
It was quality approved by John Ballingall.
The assistance of Sarah Spring, (StatsNZ datalab) is gratefully acknowledged.

L13 Willeston House, 22-28 Willeston St | PO Box 3479, Wellington 6140
Tel +64 4 472 1880 | econ@nzier.org.nz
© NZ Institute of Economic Research (Inc) 2018. Cover image © Dreamstime.com
NZIER’s standard terms of engagement for contract research can be found at www.nzier.org.nz.
While NZIER will use all reasonable endeavours in undertaking contract research and producing reports to ensure the
information is as accurate as practicable, the Institute, its contributors, employees, and Board shall not be liable (whether in
contract, tort (including negligence), equity or on any other basis) for any loss or damage sustained by any person relying on
such work whatever the cause of such loss or damage.

Key points
NZIER has been asked by the Ashburton District Council to assess the Ashburton
labour force, and to develop a Labour Force Plan that addresses labour shortages.

What are the complexities?
Labour force figures provide information about the availability of labour. In a full
employment situation (i.e. when the labour market is at capacity), however, labour
shortages put pressure on businesses and the mismatch between supply and demand
of skills increases.
The true extent of labour shortages is unobserved, given a degree of circularity
between labour demand and supply – firms may choose not to hire as many staff
because there is a lack of available staff to hire.

A reasonable benchmark for Ashburton’s labour shortage should
account for the potential of its economy
Estimating this true level of labour shortage requires information about a region’s
quality of living and quality of doing business. Regions with the best combination of
quality of labour and quality of business are better placed to provide the required
labour for their economic growth.
The required skillset of an industry’s labour force varies over time, depending on its
stage in the business cycle. So we estimate labour shortages for Ashburton based on
the employment that we expect given its economic composition and regional
features.

Ashburton is the 6th most desired district for business and the 12th
most desired for living
According to our estimation of quality of doing business, Ashburton is ranked 6th in
the ranking amongst the 66 districts. Meanwhile, it ranks 12th in quality of living.
This implies that Ashburton is viewed more favourably as a place to do business than
as a place to live, relative to other districts.
This difference helps to explain the labour shortages prevalent in the district, as
businesses attracted to the region drive strong employment demand. However, the
number of people who want to live in Ashburton falls short of this demand for
labour.

The current labour shortage is costing Ashburton $16 million
We estimate the current labour shortage cost the Ashburton economy at least $16
million in 2018 in terms of lost output.
A large increase in dairy production in recent years has underpinned strong demand
for labour, not just on-farm and in processing, but also in supporting services sectors.
Labour supply growth has not kept up with labour demand growth, with the ageing
Ashburton population exacerbating labour shortages. The “hollowing out” of the

NZIER report -Ashburton Labour Force Plan i
youth labour force in Ashburton due to students moving out of the district to study
also reduces opportunities to build a strong pipeline of workers in Ashburton.

The cost of labour shortages could rise to over $100 million by 2030
We forecast labour shortages will become more acute, with the total cost of these
shortages expected to rise to $105 million by 2030. This represents an increase in the
labour shortage from the current estimated total of 503 to 589 workers in 2030.
As an economy progresses, developments such as technological advances increase
the demand for higher skilled jobs at the expense of lower skilled jobs. This means
that the value of higher skilled jobs, which face an increasing shortage, to the
industries rises over time.

Improving the quality of living in Ashburton is the key
Closing the gap between labour demand and supply will require an improvement in
the quality of living in Ashburton to attract and retain workers in the district. This is
where Ashburton District Council has the most influence within the scope of its work
and can make the most effective contribution in mitigating labour shortages.
While some of the factors driving the quality of living, such as weather conditions,
are outside the control of the Ashburton District Council, there are many other steps
it can take to improve its quality of living rankings. These include improving the
recreational facilities in Ashburton to encourage young families to settle down in the
district.
Another way to increase the vibrancy of the district is to include events to welcome
new migrants. Although the Council is already doing this, more prominent and
regular events, plus a webpage profiling migrants, will help migrants integrate into
the community and build a more diverse and vibrant district. This in turn should
attract more migrants to work in Ashburton.

Promoting the Ashburton story will be vital
It is not enough to build an attractive district to live in – people have to know about
it. The Council should invest in communications, through an advertising campaign
and development of a dedicated website, to promote the benefits of living and
working in Ashburton.

Training the future workforce
Workers stay in their jobs when there are opportunities for career progression. The
Council will need to work with businesses to develop sustainable career pathways for
Ashburton workers. These pathways should be promoted to motivate workers to stay
in Ashburton.

NZIER report -Ashburton Labour Force Plan ii
Contents
1. Introduction ...................................................................................................... 1
2. Our framework and approach .......................................................................... 4
3. What’s the shortage? ........................................................................................ 6
 3.1. Outcomes of the quality of life and quality of business assessment 6
 3.2. Estimation of labour shortage ........................................................... 9
 3.3. Limitations of our analysis............................................................... 11
4. Literature review............................................................................................. 12
 4.1. How could the labour shortage be addressed? .............................. 12
 4.2. Regional development policies ....................................................... 13
5. SWOT analysis ................................................................................................. 16
6. IDI framing....................................................................................................... 17
 6.1. IDI framework.................................................................................. 17
 6.2. Findings from our IDI analysis ......................................................... 18
7. Stakeholder interviews and workshops .......................................................... 24
 7.1. Skills and training ............................................................................ 24
 7.2. Immigration ..................................................................................... 25
 7.3. Living in Ashburton .......................................................................... 25
 7.4. Tourism............................................................................................ 26
 7.5. Collaborating with other districts.................................................... 26
 7.6. Technology ...................................................................................... 27
 7.7. Stakeholder buy-in .......................................................................... 27
8. Labour Force Plan ........................................................................................... 28
 8.1. Ashburton District Council .............................................................. 28
 8.2. Businesses ....................................................................................... 32
 8.3. Central Government ........................................................................ 33
 8.4. Specific action points....................................................................... 34
References ................................................................................................................... 37

NZIER report -Ashburton Labour Force Plan iii
Appendices
Appendix A Methodology for estimating labour force gaps ....................................... 39
Appendix B Estimated labour shortage ....................................................................... 44
Appendix C Canterbury labour market indicators ....................................................... 45
Appendix D Stakeholder engagement ......................................................................... 47

Figures
Figure 1 Forecast employment demand in Ashburton ................................................................ 1
Figure 2 Proportion of New Zealand’s and Ashburton’s populations across age groups ............ 2
Figure 3 Ashburton population projections across age groups ................................................... 3
Figure 4 Our framework for this project – Ashburton’s labour market stock-flow linked to
policy levers ................................................................................................................................. 4
Figure 5 Estimated QB for 2000 and 2017 ................................................................................... 7
Figure 6 Estimated QL for 2000 and 2017 ................................................................................... 8
Figure 7 Labour shortage for different economic sectors ......................................................... 10
Figure 8 Labour shortage over time, 2000-2030 ....................................................................... 11
Figure 9 Overview of the Integrated Data Infrastructure .......................................................... 17
Figure 10 Canterbury has the lowest worker turnover in the primary sector ........................... 18
Figure 11 Net internal migration ............................................................................................... 19
Figure 12 Internal migration to and from Ashburton district .................................................... 20
Figure 13 Net internal migration ............................................................................................... 21
Figure 14 Net international inflows ........................................................................................... 22
Figure 15 Net international inflow by ethnicity ......................................................................... 22
Figure 16 Inflow of migrants by age and visa type .................................................................... 23
Figure 17 Projected growth in households in Canterbury region’s districts over 2013-2038 ... 27
Figure 18 Framing the policy levers ........................................................................................... 28
Figure 19 Projected growth in Ashburton households over 2013-2038 ................................... 30
Figure 20 Projected growth in Ashburton families over 2013-2038 ......................................... 31
Figure 21 Average rents, 2000-2015 ......................................................................................... 40
Figure 22 Median wages for new jobs, 2000-2015.................................................................... 41
Figure 23 NZIER QSBO ease of finding skilled labour ................................................................ 45
Figure 24 Beveridge Curves for Canterbury and New Zealand .................................................. 46

Tables
Table 1 Ashburton labour force SWOT analysis ........................................................................ 16
Table 2 Labour Force Plan ......................................................................................................... 35
Table 3 Estimated labour shortage for different economic sectors .......................................... 44

NZIER report -Ashburton Labour Force Plan iv
1. Introduction
Growth in the Ashburton economy has driven strong demand for labour in recent
years. As the economy has grown, the composition of employment has shifted
towards growth in higher skilled jobs.
However, growth in the labour force has not kept up with the rise in labour demand.
This has resulted in labour shortages.
Figure 1 illustrates our estimation and forecast of employment across the different
economic sectors in Ashburton over 2000-2030. A large increase in dairy production
has been associated with higher employment demand in the district, not just in the
agriculture sector but across the supporting services such as infrastructure delivery
including drainage and waste services.
Other supporting sectors which benefit from growth in dairy production include
machinery and equipment manufacturing, and non-metallic mineral product
manufacturing such as fertiliser.

Figure 1 Forecast employment demand in Ashburton

Source: Statistics NZ, NZIER

Against this strong increase in employment demand has been an ageing population in
Ashburton. The shrinking working age population is exacerbating the labour
shortages.
Compared to the rest of New Zealand, Ashburton has a relatively high proportion of
its population in the older age brackets (Figure 2). Statistics NZ population estimates

NZIER report - Ashburton Labour Force Plan 1
show that Ashburton makes up 0.7% of the New Zealand population, but 0.9% of the
80 years and over population.
In contrast, Ashburton accounts for only 0.6% of the New Zealand population of 15-
to 29-year-olds.

Figure 2 Proportion of New Zealand’s and Ashburton’s populations
across age groups
Population estimate at 2013 (% of population)

 0-4 years
 5-9 years
 10-14 years
 15-19 years
 20-24 years
 25-29 years
 30-34 years
 35-39 years
 40-44 years
 45-49 years
 50-54 years
 55-59 years
 60-64 years
 65-69 years
 70-74 years
 75-79 years
 80-84 years
 85 years+
 0% 1% 2% 3% 4% 5% 6% 7% 8%
 NZ Ashburton
Source: Statistics NZ

Statistics NZ projects further ageing in the Ashburton population over the coming
decades. It expects the proportion of 30- to 64-year-olds in Ashburton to decline
from 42% in 2018 to 40% in 2038. Meanwhile, the proportion of those aged over 65
years is expected to increase from 20% in 2018 to 22% in 2038.

NZIER report - Ashburton Labour Force Plan 2
Figure 3 Ashburton population projections across age groups Population projections (% of population) 0-4 years 5-9 years 10-14 years 15-19 years 20-24 years 25-29 Years 30-34 years 35-39 years 40-44 years 45-49 years 50-54 years 55-59 years 60-64 years 65-69 years 70-74 years 75-79 years 80-84 years 85 years+ 0% 1% 2% 3% 4% 5% 6% 7% 8% 2018 2028 2038 Source: Statistics NZ The ageing Ashburton population will limit the extent to which its workforce can grow to meet increasing labour demand. In the absence of international or within- New Zealand migration, labour shortages will become more acute. Targeted policy levers are required to address these labour shortages, to help grow the economy and improve the living standards of the people of Ashburton. Our report covers: An analysis of Ashburton’s labour force – setting out current and likely future requirements A Labour Force Plan – for the Council and other key stakeholder to address the identified requirements. NZIER report - Ashburton Labour Force Plan 3
2. Our framework and approach Our framework is a labour supply stock-flow. The framework incorporates the labour demand composition from our assessment of the industries in Ashburton, as well as the policy levers available to the Council to address Ashburton’s labour shortages. Figure 4 Our framework for this project – Ashburton’s labour market stock-flow linked to policy levers Labour demand Composition and wage taken as given by market trends “Labour Matching policy shortage or gap” levers Entry (flow) Labour supply (stock) Exit (flow) Composition by age, Migration, education Reason for exit, occupation, tenure, education, or training destination industry Attraction policy Retention policy levers levers Source: NZIER The framework consists of labour: Demand – granular analysis of labour demand by industry, occupation, education and other variables through time Supply stock – granular analysis by age, occupation, education and other variables Supply flow – the flow of workers and how it affects the composition of the workforce: entry: migration, education or training exit: reason for exit (retirement, relocation), destination after exit (i.e. Auckland, overseas) Matching – for a given demand and supply of labour, the quality of the matching of skills i.e. how easy is it for businesses to find the skills that they are looking for? The policy levers for the Council are directed towards influencing the labour supply flow and the quality of the matching between the demand for labour and the labour supply stock. NZIER report - Ashburton Labour Force Plan 4
Our framework incorporates three groups of policy levers that the Council can use to
address the “gap” between the demand and supply or stock of labour:
 1. Attraction (Labour supply entry flows) – i.e. Recruitment, training and other
 levers
 2. Retention (Labour supply exit flows) – i.e. Ongoing training to develop
 career pathways within Ashburton, placemaking and other levers
 3. Matching (Labour supply stock) – i.e. Services which support employers in
 their search for specific skills.

NZIER report - Ashburton Labour Force Plan 5
3. What’s the shortage?
Compared to other districts, Ashburton provides a unique combination of quality of
business and quality of life for residents. Its distance from major population centres
has not stopped its agriculture sector and the associated services sectors from
building a prosperous economy.
However, competition with other regions in attracting skilled labour force has been a
challenge for Ashburton.
With an unemployment rate of 4.8%, the New Zealand economy is experiencing high
demand for labour. Despite the national labour shortage, regions with the best
combination of quality of labour and quality of business are placed better to provide
the required labour for their economic growth.
The concept of labour shortage is complex as employment figures do not inform us
about a lack of labour – only the amount of labour supply which has met labour
demand.
There has been analysis on labour market decision-making using open and data-
driven skills taxonomy, which involves creating an algorithm to determine skill
requirements embedded in job advertisements (Djumalieva and Sleeman, 2018).
However, hiring intentions of firms are often influenced by the labour supply
available, so may underestimate true labour demand when labour supply is limited.
We account for the complexities of the shortage of labour in our assessment
framework.

3.1. Outcomes of the quality of life and
 quality of business assessment
We start by constructing indicators for the Quality of Business (QB) and for the
Quality of Life (QL). QB relates to the attractiveness of doing business in an area,
while QL relates to the attractiveness for residents to live in an area. Labour will
gravitate towards districts with either high QL or high QB. The best performing
districts will have a strong combination of both.

Ashburton is the 6th most desired district for business and the 12th
most desired for living
According to our estimation of QB, Ashburton is ranked 6th in the ranking amongst 66
districts. It ranks 12th in QL.
This implies that Ashburton is viewed more favourably as a place to do business than
as a place to live, relative to other districts.
This difference helps to explain the labour shortages prevalent in the district, as
businesses attracted to the region drive strong employment demand. However, the
number of people who want to live in Ashburton falls short of this demand for
labour.

NZIER report - Ashburton Labour Force Plan 6
The ranks are illustrated in Figure 5. As illustrated, Ashburton and its surrounding
districts (Selwyn and Timaru) have experienced a significant increase in QB over this
period. Dark (light) shading is equal to higher (lower) levels of QBs and having a
darker (lighter) shading compared to the left-hand side figure means an increase
(decrease) in QB between 2000 and 2017.

Figure 5 Estimated QB for 2000 and 2017

Source: NZIER (2018). Note: dark shading is equal to higher levels of QB.

Figure 6 illustrates the QL in 2000 on the left-hand side and the 2017 figures on the
right-hand side. The QL in Ashburton has improved significantly over this period, with
the district now having a quality of life similar to its surrounding competing districts.
Dark (light) shading is equal to higher (lower) levels of QLs and having a darker
(lighter) shading compared to the left-hand side figure means an increase (decrease)
in QL between 2000 and 2017.

NZIER report - Ashburton Labour Force Plan 7
Figure 6 Estimated QL for 2000 and 2017

Source: NZIER (2018). Note: dark shading is equal to higher levels of QL.

Ashburton’s comparative advantage is its business strength
It is always tricky to isolate out correlation from causation, given some degree of
circularity between labour demand and supply – for example the lack of workers
available will limit hiring intentions of firms.
However, after accounting for the different features of districts and only looking at
the impact of a change in QB versus a change in QL, we find that Ashburton will only
remain a desirable destination for its labour force if its business quality remains
strong.
Ultimately, it is the availability of jobs which will encourage people to move to
Ashburton.

However, quality of life needs to be higher
While QB is the key driver of the movement of people to Ashburton (given it
determines the availability of jobs), it will need to be associated with investment in
promoting a higher QL.
This is particularly important as the cost of attracting labour (i.e. wages) will have to
be significantly higher if investment is only on one of the aspects (QB or QL). For
example, an Ashburton business will have to offer much higher wages to entice
someone to move to the district if the quality of living in Ashburton was low.

NZIER report - Ashburton Labour Force Plan 8
3.2. Estimation of labour shortage
How big is the labour shortage?
Labour will gravitate towards districts with either high QL or high QB. The best
performing districts will have a strong combination of both.
For example, when it comes to economic composition (i.e. the shares of different
industries in a region’s economy) or quality of life and quality of business, Ashburton
will not be a perfect substitute for bigger job markets such as Auckland, Wellington
and Christchurch.
The question is:
 What is the potential level of quality of life and quality of business
 that Ashburton is likely to have?
To answer this question, we estimate the likely level of QL and QB based on the share
of different activities in the economy across different districts. Hence, our response
to the question is:
 The maximum level of QL and QB that Ashburton could potentially
 have is based on its economic composition and its regional
 features.
We estimate the levels of QL and QB that an economy with the features of Ashburton
economy, such as the share of different industries in production, could potentially
expect to have. This provides us with a range of expected QL and QB for different
districts across New Zealand. Accordingly, we estimate Ashburton could potentially
have 2.86% higher QL and 2.27% higher QB than is currently the case. This would
imply an increase in the ranking of Ashburton by 1 place for both QL and QB.
This forms the counterfactual which provides the true (unobservable) level of labour
supply and demand against which the current labour supply and demand is assessed
to find the extent of the labour shortage.
We estimate the current labour shortage to be 0.22% (of the current employment
figures) and closing the gap would require a significant improvement of quality of
life and quality of business.

The stress of the labour shortage for Ashburton industries is significant
We also consider a counterfactual scenario where the constraints of the current
economic composition of Ashburton were relaxed1:
 What’s the shortage without any constraints – i.e. if the supply of
 labour was flexible and industries could hire as much labour as
 needed?
Answering this question shows the stress on Ashburton industries, as it shows that
demand for labour would have been even greater if it was not constrained by the
current industry composition and the effects of composition on labour supply.
 1
 The rationale is that the supply of labour force to different regions is constrained by the size of different economic activities
 in the regions. Therefore, a specific industry attracts a number of mobile migrants to a region (that we estimate in our
 models).

NZIER report - Ashburton Labour Force Plan 9
We estimate the labour shortage to be 24%, relative to the true labour demand if
Ashburton industries were provided with an unlimited supply of labour.
The negative impact of labour shortages is felt across all industries. The share of the
primary sector in Ashburton remains large in absolute numbers, but the marginal
expansion of sectors will be most significant for the services sector.
This reflects the fact that the dairy sector supports demand for many service sector
businesses. This implies the services sector in Ashburton will increase more than the
other sectors (2.41%) if the labour supply shortage was to be addressed.

Figure 7 Labour shortage for different economic sectors

Source: NZIER (2018)

Labour shortage cost Ashburton at least $16 million in 2018
The labour shortage for primary industries will steadily increase over the next
decade, as increased output means increased demand for labour. Given the flow-
through impact of increased dairy output on demand for supporting services, the
labour shortage for services will be much more significant (Figure 8). The labour
shortage for manufacturing will increase too.
We estimate the total labour shortage in 2018 to be 503 employees (0.22% of
current Ashburton employment).

NZIER report - Ashburton Labour Force Plan 10
Our estimation of the minimum cost of the labour shortage in terms of lost output to the Ashburton economy is $16 million in 2018.2 We forecast this will increase to $105 million by 2030, reflecting a shortage of 589 employees. Figure 8 Labour shortage over time, 2000-20303 Source: NZIER (2018) 3.3. Limitations of our analysis Distinguishing between drivers and correlations of migration of the labour force is controversial. We have used the best possible practice for estimating labour shortage figures. This is based on the recent progress in the literature on quality of life and quality of business. Our framework is based on the Ashburton economy over the past few decades, taking into account the trends that comes with business cycles. This means our forecast of the future shortages do not incorporate the impact of any policy changes, such as the effects of changes to water quality regulations on agriculture production. Our results provide sensible outcomes for Ashburton according to our anecdotal understanding of current economic conditions. This however needs to be tested on a wider range of districts with different living and economic compositions. Testing the causality of the relationships that we have used will be a question for future studies. 2 These figures are based on our realistic estimation of labour shortage based on the constraints from the economic composition of Ashburton. Our estimation figures are provided in Appendix B. 3 NZIER report - Ashburton Labour Force Plan 11
4. Literature review
4.1. How could the labour shortage be
 addressed?
This fundamental question has been discussed in only a few studies in New Zealand.
Income and housing cost (rents) are the two main drivers of population location. Our
results suggest that higher wages are important for attracting more workers to
Ashburton, but this will need to be associated with improved affordability of housing
and greater availability of housing choices.
In addition to income and rent, we also need to understand the importance of other
factors e.g. living conditions, that influence migration and the labour force. This will
provide information about the needed amenities and facilities for attracting labour
force.
Apatov & Grimes (2016) introduce the presence of higher education institutions as a
driver for regional growth in New Zealand. Torshizian (2017) discusses the desirability
of factors of living environment, and particularly residential density and household
crowding, in Auckland. There have been many studies on the clustering of population
in New Zealand. Maré, Coleman & Pinkerton (2011) study the patterns of population
location in Auckland.
Some recent studies discuss the importance of regional endowments, such as hours
of sunshine, temperature and wind (e.g. Fleming et al, 2018). While understanding
the importance of the endowments to clustering of population is important, it does
not improve our knowledge of the drivers of employment in New Zealand and
particularly in Ashburton.
Becker et al (2013) consider labour attraction and retention strategies in rural and
remote Queensland communities, and highlight the need for communities and
businesses to work together to overcome labour shortages in rural and remote
locations. This is because workers only stay in a region if they feel they belong in the
community, hence it is important to develop support structures for employees and
their families.
Many small communities overseas also focus on immigrant attraction to fulfil labour
market requirements. Challenges include settlement services, appropriate housing,
transportation systems, suitable employment, cultural amenities, diversity in the
school system, and community tolerance (Wiginton, 2013). The study finds increased
institutional capacity and resources are needed to support immigrant welcoming
initiatives.
The literature findings show that many factors drive the attractiveness of living in a
region, including wages, diversity of job opportunities, availability of suitable
housing, presence of supporting institutions and living conditions.

NZIER report - Ashburton Labour Force Plan 12
4.2. Regional development policies
McIlrath and Erasmus (2017) highlight in their assessment of the Ashburton economy
the challenges the district faces with an ageing population and the resultant decline
in its working age population. Retail, accommodation and food services sectors are
areas of opportunity given the expected increase in tourism activity in the district.
Ashburton’s exposure to global forces given the concentration of dairy in its economy
leaves the district vulnerable to negative external developments such as a slowing in
the Chinese economy. Improving the connectivity of Ashburton through roads and
telecommunications was an important means of supporting the district’s economic
development.
Hooper (2018) recommends the Ashburton Economic Development Strategy should
be closely aligned with the Canterbury Regional Economic Development Strategy and
be refreshed every 4-5 years, in order for Ashburton District Council to maximise
economic development within the region in the near term. He also recommends the
Council should partner with other organisations, such as ChristchurchNZ or Te
Runanga o Ngai Tahu, to ensure efforts are not duplicated.
There have been success stories overseas of communities and universities working
together to retain graduation students in their communities. The Trainee Sør
program is a collaboration between the regional energy company, the regional skills
development agency, the City of Kristiansand, and the regional university which
provides trainees with professional and personal development opportunities whilst
promoting innovation and knowledge sharing amongst the businesses. Over 18
months, trainees work for three different employers and there are personal
development opportunities through mentorship for each trainee, educational
courses, study excursions, and team building and social events. This encourages
networking within the community. Around 90% of trainees have been offered work
in the region, with the majority staying on in the area (MDB Insight, 2017).
Sustainable regional development policies require residents to have a sense of
ownership in the initiatives they are involved with. Dyer’s analysis of self-reliant
policies in the Nelson regional economy (2016) found that worker co-operatives
where residents shared in the wealth and leveraged the economic strength of anchor
institutions led to more successful outcomes for regional economic development. It
also allowed indigenous residents to incorporate their values and intergenerational
vision into the business.
Nel and Stevenson (2014) highlight the importance of benevolent entrepreneurs
which create activity (such as events) to attract other businesses and create vibrancy
and economic diversification in a region. They also point out how market-based
policies and reforms over the past decade have seen an expansion of tourism towns,
in contrast to the contraction in resource-based and manufacturing towns. They find
that tourism-elated growth corresponded to economic and population growth.
Howison (2014) discusses the important role of the transient overseas workforce in
filling an important gap in servicing tourism in Queenstown given its seasonal nature.
Cultural differences matter, with Europeans considered to have more favourable
work ethics than South Americans (and the local workforce). She finds that transient
workers tend to stay because of location, activities, lifestyle, money and work

NZIER report - Ashburton Labour Force Plan 13
experience. Short term measures such as positive feedback, vouchers and training
were also useful for staff retention.
These transient workers tend to move on due to low pay and a lack of opportunity
(as well as the limitation of the work visa). Given the high cost of recruitment there
has been more reliance on working holiday and work permits to fill the gap, which
leaves Queenstown businesses vulnerable to changes in government policy and
global events which affect the influx of workers.
Prescott et al (2017) discuss the crucial role of a governing authority in managing
competing interests of stakeholders of a regional economic development scheme, to
ensure there is a clear shared vision. Although increasing connectivity (through
access to the internet and transport network) is important, a critical mass of
customers is required to justify the upfront investment involved.
Places such as commerce hubs provide opportunities for “bumping” and connecting,
which would reduce the need for commuting. This “bumping” relates to the chances
of meeting like-minded people physically through being in the same vicinity, which
means increased opportunities for collaboration. The commercial outcome of these
investments should be shared between hubs and commuters. It was important to
create a unique selling point to promote the region so that it is seen as an attractive
destination to visit and move to. Successful initiatives which encourage social
interaction and engagement will enhance place-making, thus improving the
attractiveness of the region.

Southland Workforce Strategy 2014-2031
Venture Southland’s Southland Workforce Strategy 2014-2031 (Jackson, 2015)
focused on four key groups to address the labour shortages in the region:
 1. increasing net migration
 2. increasing the participation rate of workers aged 15-25
 3. increasing the participation rate of women
 4. increasing the participation of those aged over 55.

Across this plan are the over-arching themes of Attraction, Retention, Upskilling and
Utilisation.
Southland is facing a structural ageing of its population and with it a shrinking
workforce, at the same time as employment demand is growing. These issues are
similar to what Ashburton is facing.
Venture Southland recommends a range of measures to address the growing labour
shortages based on the focus on those four key areas they have identified. Increased
participation rates could be aided by more flexible working arrangements.
Meanwhile, training, jobs rotation and intergenerational mentoring would improve
the culture of knowledge sharing and create sustainable career pathways for both
young and older workers, as well as migrants. Having a more engaged workforce
would mean long-term social and economic impacts for the region.
Many of these strategies identified are relevant to Ashburton given the similar
situation the district is facing. Our policy levers should aim to increase the size of the
Ashburton labour force through increasing both net migration and the participation
rate in some parts of the labour force.

NZIER report - Ashburton Labour Force Plan 14
Implications for Ashburton
The relevance of the findings from the literature review for Ashburton can be broadly
summarised as: increasing labour supply through attracting workers into the region
and encouraging more residents to remain in the workforce; knowledge sharing to
increase the capability and opportunities for the Ashburton workforce and develop
its pipeline; and ensuring buy-in of a common vision across all stakeholders.

NZIER report - Ashburton Labour Force Plan 15
5. SWOT analysis
We summarise our SWOT analysis of the Ashburton labour force in the table below.
While Ashburton has benefited from the improvement in dairy farm income in recent
years, its concentration in this industry also leaves the district exposed to any
unfavourable developments in the dairy sector.

Table 1 Ashburton labour force SWOT analysis
Strengths: Weaknesses:
 - Co-location of different primary industry - Ashburton City is a small city for its
 land uses primary export production
 - Top NZ dairy production district - Lack of Tertiary Education
 - High wages relative to other regions providers within Ashburton makes
 it hard to build broad pipeline of
 - Tourism industry that can be leveraged to
 workers
 attract visitors and residents
 - Concentration of dairy sector
 - Low cost of living and affordable housing
 leaves the district vulnerable to
 developments which negatively
 affects the dairy sector e.g.
 Mycoplasma bovis outbreak
 - Lack of infrastructure to support
 business activity e.g. Port Timaru
 makes Timaru more attractive for
 businesses to base there
 - Gap of young residents, who leave
 for schooling and only return much
 later to raise a family or retire
Opportunities: Threats:
 - Potential spill-over effects from strong - Tightening in net migration, largely
 population growth in adjacent areas (e.g. from policy changes e.g. Skilled
 Selwyn) Migrants points system, holiday
 - Strong national net migration means visas
 potential to expand workforce – either - Attractiveness of other town
 permanently or on seasonal basis centres (Timaru, Selwyn and
 - Christchurch rebuild winding down, Christchurch) – Ashburton has
 making labour available for other “Middle Child Syndrome”.
 industries - Lack of critical mass makes it hard
 to compete with nearby districts
 for workers.

Source: NZIER

NZIER report - Ashburton Labour Force Plan 16
6. IDI framing
6.1. IDI framework
The Integrated Data Infrastructure (IDI) is a large research database consisting of
microdata about people and households. Data from government agencies, Statistics
NZ surveys, and non-government organisations (NGOs) are linked together and can
be used to help answer questions about complex issues affecting New Zealanders.4

Figure 9 Overview of the Integrated Data Infrastructure

Source: Statistics NZ

We use the following datasets in the IDI to delve into the Ashburton labour force at a
much more granular level. By tracing through the pathways of Ashburton workers,
we can answer more targeted questions such as where workers come from and
where do they move on to?

 4
 https://www.stats.govt.nz/integrated-data/integrated-data-infrastructure/

NZIER report - Ashburton Labour Force Plan 17
There is evidence to suggest that the primary sector in Canterbury has low worker
turnover. The worker turnover rate in 2016 for the primary sector in Canterbury was
23% – lower than the national average at 29% and other key dairying regions such as
Southland (28%) and Otago (30%).
A low worker turnover rate does not mean the retention rate should or could not be
increased further, but it does suggest that on this aspect the Canterbury labour
market already performs well relative to the other regions.

Figure 10 Canterbury has the lowest worker turnover in the primary
sector
Worker turnover rate (%); Agriculture, forestry, and fishing; 2016

Source: Statistics New Zealand, LEED

It is important to note that worker turnover doesn’t necessarily imply exit of the
labour market (i.e. migration to another region such as Auckland). Workforce
turnover can also occur within the region, for example when workers change jobs
more often without changing their location. Nonetheless, worker turnover is a
reasonable indicator for worker retention in a region.

6.2. Findings from our IDI analysis
More people moving out of Ashburton to the other districts
IDI data on internal migration shows the net number of people moving out of
Ashburton has been increasing in the past few years (Figure 11), with net outflows
out of Ashburton totalling 129 in 2016 (the latest year IDI data is updated till 2016).

NZIER report - Ashburton Labour Force Plan 18
Figure 11 Net internal migration
Between Ashburton and all other TLA’s

 400

 300

 200

 100

 0

 -100

 -200
 2009 2010 2011 2012 2013 2014 2015 2016
Source: Treasury, NZIER

A look at these internal migration flows across the New Zealand districts shows that
since 2009, Ashburton has had the greatest number of migration flows with its
neighbouring districts. The number of people coming into Ashburton have
predominantly been from its neighbouring districts, and Auckland.

NZIER report - Ashburton Labour Force Plan 19
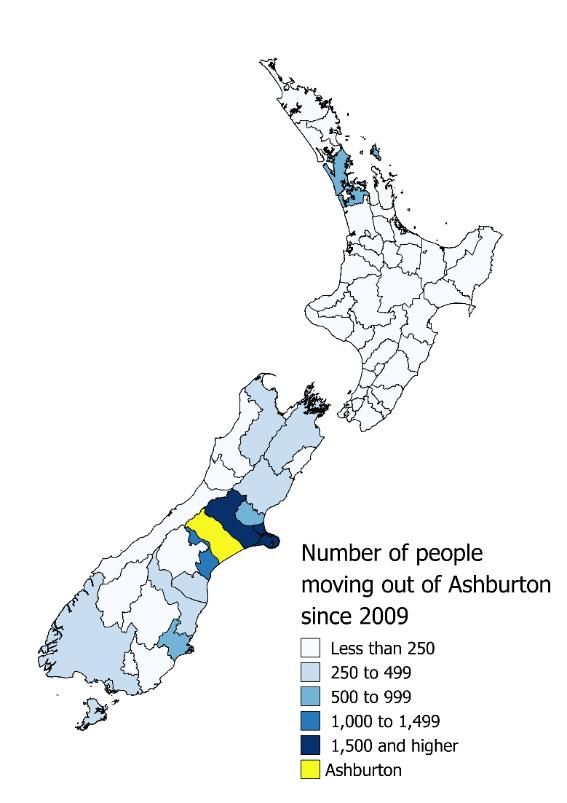
Figure 12 Internal migration to and from Ashburton district
Aggregate total number of people moving to and from Ashburton since 2009

Source: Treasury, NZIER

Looking at net flows of people moving in and out of Ashburton, we can see that with
more people moving out of Ashburton to its neighbouring districts than the number
of people moving in, this has meant there has been a concentration of Ashburton
residents moving out to neighbouring districts. There has also been a substantial net
outflow of Ashburton residents to Tasman since 2009.
Despite the substantial number of people moving out of Ashburton to Auckland, this
has been more than offset by the number of people moving into Ashburton from
Auckland. This means that Ashburton has gained people from Auckland since 2009.

NZIER report - Ashburton Labour Force Plan 20
Figure 13 Net internal migration
Aggregate total to and from Ashburton since 2009

Source: Treasury, NZIER

Growing number of migrants
Since 2009, an average of 300 more people a year have migrated into the Ashburton
district from overseas than leave. As a percentage of Ashburton’s population this
corresponds to about 1 percent, compared to the national average of 0.4 percent of
total population since 2009. In other words, Ashburton has been able to attract and
retain more international migrants than other regions.
This can also be seen in the following figure, which shows Ashburton has more net
international migrants than most similar regions, except Selwyn which has seen net
inflows of 3 percent of its population. This is not surprising as the Christchurch
rebuild has attracted migrants into the region, with Selwyn being able to take
advantage given it is so close to Christchurch.

NZIER report - Ashburton Labour Force Plan 21
Figure 14 Net international inflows
By selected TLAs

 Ashburton Selwyn South Waikato
 Timaru New Zealand
 New migrants as % of population

 4%
 3%
 2%
 1%
 0%
 -1%
 -2%
 2009 2010 2011 2012 2013 2014 2015 2016

Source: NZIER (2018)

Figure 15 shows net inflows of migrant by ethnicity, with Asians being the largest
group migrating into Ashburton since 2009 (1,000 people). Eighty five percent of
these Asian migrants are from the Philippines.
The next largest ethnicity groups are Europeans (560 people since 2009) and Pacific
(495 people since 2009). Of the European migrants, most come from the United
Kingdom, while of the Pacific migrants most are from Samoa and Fiji.

Figure 15 Net international inflow by ethnicity

 Asian European Pacific Other
 300

 200

 100

 0

 -100

 -200
 2009 2010 2011 2012 2013 2014 2015 2016
Source: NZIER (2018)

NZIER report - Ashburton Labour Force Plan 22
The majority of Ashburton’s migrants move to the region to work, with over 41
 percent arriving on work visas (Figure 16) or 2,200 people since 2009. Another 960
 people have moved to Ashburton on resident visas, which means they are not
 required to work but are legally able to. Ashburton migrants are also likely to be in
 prime working age, with 65 percent of migrants being between 15-49 years old. This
 shows how important migrants are in filling the gap of young Ashburton residents
 who have left the district to study or pursue early career opportunities i.e. counter-
 acting the “hollowing out” of Ashburton residents in the 15 to 29 year age group.

 Figure 16 Inflow of migrants by age and visa type
 Since 2009

 Visa type Age
 Other; 12% 35-49 Under 15 years; 17%
 years; 30%
Work
visa; Resident;
37% 16%
 15-24
 years;
 19%
 Student;
 7%

 Unknown; 28% 25-34 years; 34%
 Source: NZIER (2018)

 NZIER report - Ashburton Labour Force Plan 23
7. Stakeholder interviews and
 workshops
We engaged with businesses in interviews and a workshop to delve deeper into the
key issues around recruitment of workers to Ashburton. There were some familiar
themes, with businesses noting the difficulty in attracting workers to move to
Ashburton. The lack of career progression opportunities also made it difficult to
retain workers in Ashburton.
Newcomers to Ashburton tend to spend around two to five years in the district, but
those who stay beyond five years tend to stay in Ashburton for the rest of their life.
Personal circumstances also had a large influence on labour supply, with workers
often moving to Ashburton to be with someone. Conversely, the movement of a
partner to another area was often a reason for a worker to leave Ashburton.

7.1. Skills and training
Businesses highlighted the difficulty in not having a pipeline of workers with skills
ready for the market. The unreliability of the unemployed domestic workforce was
noted as an issue.
There was a strong desire to see a consistent set of vocational training standards,
which could be achieved with industry accreditation. This stemmed from recent
experience with uncertainty over the validity of the qualifications of some applicants,
particularly recent migrants.
Training is expensive in terms of time and financial cost. Some businesses took on
trainees, but there was generally a hesitancy to invest in the training and upskilling of
staff given the prevalence of poaching of staff in many industries. Besides losing staff
to other businesses, there was also the uncertainty over whether staff on working
holiday visas will have to leave the country after a few years should they fail to get
approval for a residency visa.
Workers often decide to move to a job in Ashburton as a stepping stone to work in a
role with more responsibility and then grow with the company. This highlights the
need to develop opportunities for career progression in roles in Ashburton, so that
staff will not move on to similar roles in other regions once they have obtained that
experience.
This general uncertainty over whether staff will stay beyond a year or two makes it
difficult for businesses to plan over the longer term, and discourages them from
investing in their staff. This is turn tends to reduce staff’s commitment to the firm,
creating a negative cycle.

NZIER report - Ashburton Labour Force Plan 24
7.2. Immigration
Migrants have helped to alleviate labour shortages in Ashburton. However, the influx
of migrants in recent years have brought with it challenges. As mentioned, the
inability of migrants to convert their working holiday visa to a residency visa has
contributed to the churn in workers, with businesses losing workers they have
trained for a few years who then have to return home.
The lack of certainty in migration policy was highlighted by businesses as a hindrance
in closing labour shortages in Ashburton. Businesses noted the deterioration in
labour shortages following the change in immigration policy with the shortening of
the skills shortage list.
A regional skills shortage list specific to Ashburton would be useful, to recognise that
regions are not homogeneous so there may be severe labour shortages in particular
industries in Ashburton which are not felt by that same industry in another region.
Although there is a Canterbury Skills Shortage list (CSSL), this is targeted at the
rebuild and recovery of the region from earthquake damage suffered in 2011.5
The protracted immigration application process often deterred businesses from
hiring migrants, given the potential costs involved such as engaging immigration
advisers to guide them through the application process. On the flip side, the lack of
certainty over whether they will be able to gain residency after a few years of
working in Ashburton also deters overseas applicants. These applicants may choose
to work in other countries such as Canada.
Businesses noted the cultural fit of migrants was important. The influx of migrants in
recent years has made Ashburton more multi-cultural. Initiatives by the Council to
encourage the integration of migrants into the community was highlighted by
businesses as a success story.
It was important for migrants to have a strong support network, with businesses
noting that migrants who stay for two years were more likely to integrate into the
community and stay on in Ashburton.

7.3. Living in Ashburton
Although there are many advantages of living in Ashburton, many businesses felt
these were not promoted enough to those outside to encourage them to work in
Ashburton.
The low cost of living, particularly with housing, was considered a main benefit of
living in Ashburton. The abundance of outdoor recreational activities, and proximity
to ski fields, were also highlighted as key benefits.
Businesses suggested the Council website should have a centralised portal dedicated
to recruitment, where businesses can post job ads and workers can go to look for
work in Ashburton and find out information about living in Ashburton. It would also
outline key requirements for living in Ashburton, such as a drivers’ licence to get
around the district.

 5
 https://www.immigration.govt.nz/knowledgebase/kb-question/kb-question-4551

NZIER report - Ashburton Labour Force Plan 25
Businesses offered non-monetary benefits to recruit for workers in Ashburton,
particularly for roles which require specific skills. These benefits include flexible
working conditions such as remote working, or assistance with accommodation.
However, many things also needed to be improved to entice workers to Ashburton.
For example, the limited choice in shops on the main street meant residents often
made a trip into Christchurch to shop. Similarly, the lack of family-friendly attractions
in Ashburton means families have to go to other districts for recreational activities.
These factors reduce the vibrancy of the city and may discourage workers to move to
Ashburton.
There was a recognition amongst many businesses that workers may move to bigger
cities to gain more experience. Similarly, Ashburton residents often left the district
when young to attend boarding school and university. What is important is that these
residents are encouraged to return to Ashburton with newly acquired skills later on
in life, perhaps when they decide to settle down and raise families.
Overall, businesses felt the need for Ashburton to develop a unique selling point that
clearly and succinctly shows why workers should live and work in the district. Selling
this “Ashburton Story” to the outside world would be a key channel for attracting
workers to Ashburton.

7.4. Tourism
Tourism was considered an important means of promoting Ashburton and hence
helping the recruitment of workers. Tourists coming through Ashburton can
experience the district and hence be more likely to consider working in Ashburton in
the future.
Tourists could also help to promote the positive aspects of the Ashburton lifestyle to
family and friends back home, which would help in encouraging more people to work
in Ashburton.

7.5. Collaborating with other districts
Businesses often found themselves competing with other districts for workers.
Commuting was often a double-edged sword – while it allowed people who lived in
neighbouring districts to work in Ashburton, conversely some Ashburton residents
chose to commute to work outside of the district.
Businesses highlighted opportunities for Ashburton District Council to collaborate
with other district councils to attract working holiday visa workers to the wider
region by developing a programme of jobs rotation across the different districts. This
would expose these workers to different areas of rural New Zealand and increase the
likelihood of them choosing to stay on in one of the districts after the programme.
For some roles that are quite specific to Councils such as planners and environmental
health officers, there should be a programme that provides opportunities for workers
to move across districts, to promote career progression.
Given the projected strong growth in neighbouring districts such as Selwyn, there are
opportunities to leverage off this growth and to encourage Selwyn residents to

NZIER report - Ashburton Labour Force Plan 26
commute to work in Ashburton, even if it is part of a wider programme of job
rotation around the districts.

Figure 17 Projected growth in households in Canterbury region’s
districts over 2013-2038
Average annual change (%)

 3.0

 2.5
 Average annual % change

 2.0

 1.5

 1.0

 0.5

 0.0

Source: Statistics NZ

7.6. Technology
Technological advances have enabled businesses to offer more flexible working
conditions such as remote working. This has helped businesses to recruit for workers
in Ashburton.
Changes in technology have also brought changes to the skills required for roles.
While a degree of automation has helped to replace some of the lower skilled and
repetitive jobs, it has created demand for workers with more technical skills.
The use of technology has also helped to alleviate some of the workload of workers
in Ashburton. For example, patients can get a diagnosis online hence relieving the
need to be assessed by a general practitioner and reducing the need for general
practitioners to be located close to patients.

7.7. Stakeholder buy-in
The buy-in of stakeholders increases the chances of success for any strategy. Some
businesses could provide an opportunity for workers to take an ownership share of
the business as a way to recruit workers to Ashburton and encourage them to stay
with the organisation (and hence in the district).
Those we spoke to also flagged the importance of buy-in: the Labour Force Plan
needs to have a common vision amongst all businesses.

NZIER report - Ashburton Labour Force Plan 27
You can also read