Factors shaping the abundance and diversity of archaea in the animal gut
←
→
Page content transcription
If your browser does not render page correctly, please read the page content below
Factors shaping the abundance and diversity of archaea in the animal gut Courtney Thomas Institut Pasteur Elie Desmond-Le Quemener INRAe https://orcid.org/0000-0003-1675-2744 Simonetta Gribaldo Institut Pasteur Guillaume Borrel ( guillaume.borrel@pasteur.fr ) Institut Pasteur https://orcid.org/0000-0003-4893-8180 Article Keywords: gut microbiome, gut archaeome, methanogens Posted Date: August 26th, 2021 DOI: https://doi.org/10.21203/rs.3.rs-789824/v1 License: This work is licensed under a Creative Commons Attribution 4.0 International License. Read Full License
Factors shaping the abundance and diversity of archaea in the animal gut

     Courtney M. Thomas1,2, Elie Desmond-Le Quemener3, Simonetta Gribaldo1 and Guillaume Borrel1,*

     1Department     of Microbiology, Unit Evolutionary Biology of the Microbial Cell, UMR 2001, Institut Pasteur, Paris, France
     2Université   Sorbonne Paris Cité, Paris, France
     3INRAE,   Univ Montpellier, LBE, Narbonne, France
     * Corresponding author: guillaume.borrel@pasteur.fr

 1   Abstract
 2   Archaea are active members of the gut microbiome, but a thorough analysis of their diversity
 3   and abundance in a wide range of animals is lacking. Here, we examined both quantitatively
 4   and qualitatively the gut archaeome of 269 species from invertebrates to primates. Archaea
 5   are present across many animals and mostly represented by four genera and one family of
 6   methanogens, but also members of Thaumarchaeota. Five major events of adaptation to the
 7   gut in the Archaea were identified. Host phylogeny, diet, and intestinal tract physiology are
 8   key factors shaping the structure and abundance of the archaeome. The abundance of
 9   methanogens is positively correlated with diet fibre content in mammals and
10   hydrogenotrophic methyl-reducing methanogenesis (the main methanogenesis pathway in
11   many animals) is linked to diet and methyl compounds-producing bacteria. Our results provide
12   unprecedented insights on the intestinal archaeome and pave the way for further studies on
13   their role in this environment.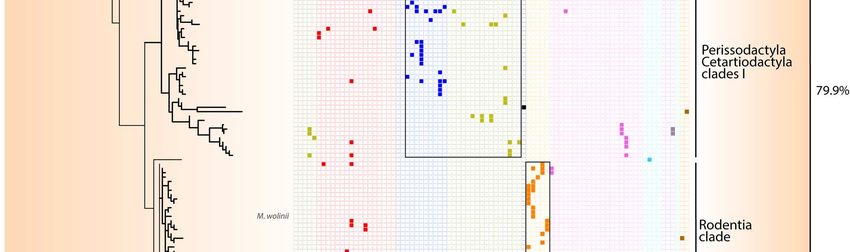
14   Introduction
                                                                  1–8
15   The intestinal microbiome plays key roles in host health        . It is composed of bacteria,
16   archaea, microbial eukaryotes, and viruses/phages. Research on the microbiome of many
17   animals has unveiled features that influence the overall structure of the intestinal microbiome
18   such as diet and the ability to fly 9–12. However, most of these studies have only targeted the
19   bacterial intestinal community. It is known that host-associated archaeal methanogens
20   produce a significant amount of methane gas in ruminants, which makes them ecologically
21   and environmentally important 13. In humans, archaea have been linked to various conditions
22   of health and disease 5. Nevertheless, archaea-centric intestinal microbiome studies have
23   been generally conducted in a narrow group of animals such as termites, primates, humans,
24   and ruminants 5,14,23,15–22.
25           The gut archaeome of other animals such as rats, hoatzin, pigs, seals, wallabies,
26   kangaroos, iguanas, fish, horses, and even in the tissue of sponges was examined by
27   independent studies using different molecular and cultural approaches 15,24–30. Overall, these
28   studies reported that the most common methanogens in the gut are members of the
29   Methanobacteriales and Methanomassiliicoccales, and that the Methanosarcinales and
                                                                         13,15,31,32
30   Methanomicrobiales are also present, although less frequently                 . Only one study
31   addressed the distribution of intestinal methanogens in a wide variety of animals, but using
32   methane gas detection tests 33. This study detected methanogens in a wide range of animals.
33   It also suggested that they have been acquired early in animal evolution and were completely
34   lost in some lineages such as the Carnivora. However, the methodology used in this study has
35   several limitations, as it does not provide taxonomic information and cannot detect
36   methanogenic populations with low concentrations in faeces or non-methanogenic archaea.
37           Here, we carried out a sequence-based analysis of the gut archaeome based on nearly
38   400 samples from 269 species covering a broad spectrum of animal diversity. We investigated
39   the host range of archaea in eight animal classes, identified the major gut archaeal lineages
40   and predicted the dominant methane metabolisms using both sequencing and quantitative
41   approaches. We discussed the number of events of adaptation to the gut in the Archaea,
42   including in ammonia-oxidizing Thaumarchaeota and in Bathyarchaeota, both previously
43   rarely identified in this environment. By using a large range of metadata from the literature
44   we define key factors structuring the abundance and composition of the gut archaeome across
45   the animal kingdom.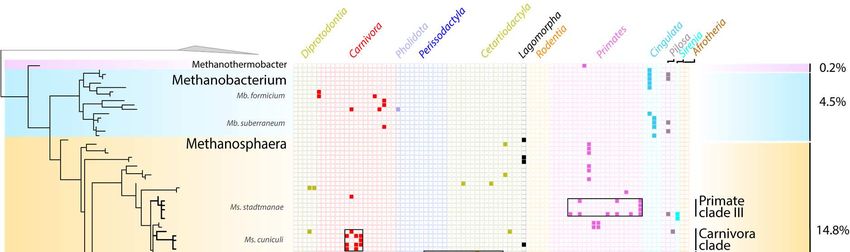
46   Results and discussion
47   Archaea are present in the gut microbiome throughout the animal kingdom
48   We collected faeces from 269 species of animals (n samples = 391) ranging from Invertebrates
49   to Mammals – the majority of which, except for birds, fish, and gastropods, came from captive
50   specimens (Table S1). We used tree approaches to characterize the archaeal community of
51   these samples: i) quantitative PCR (qPCR) targeting total Archaea, total Bacteria, and five
52   archaeal lineages previously found in the animal intestine (Methanobacteriales,
53   Methanomassiliicoccales, Methanomicrobiales, Methanimicrococcus and Thaumarchaeota),
54   and ii) 16S rRNA gene amplicon sequencing of the Archaea only and iii) of the entire microbial
55   community. We detected the presence of archaea in the gut microbiome of 175 species
56   belonging to all eight classes of animal investigated, including 14 orders of mammals (Figure
57   1; Table S1).

      Figure 1. Detection of archaea in animal species with three approaches. Invertebrates gather 3 classes
      (Insecta, Mollusca, and Malacostraca).
58   Archaea were detected in a higher proportion of the samples when using archaea-specific
59
60   primers for qPCR (78%) or amplicon sequencing (76%) with respect to the universal prokaryote
61   primers for amplicon sequencing (44%). This difference was observed in most animal classes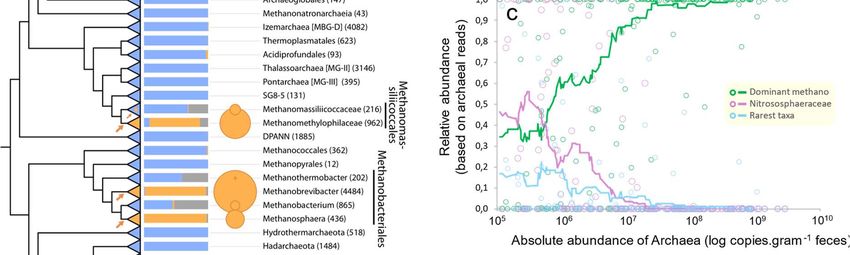
62   (Figure 1). In addition, universal prokaryote primers also captured a lower number of ASVs
63   (1.9 + 2.6 ASVs per sample) with respect to the archaea-specific primers (13.6 + 20.3 ASVs per
64   sample) (Kruskal-Wallis p = 1.65e-8 (Figure S1), n = 218). With ~10,000 prokaryotic reads per
65   samples, the archaeal species/ASVs that represent less than 0.01% of the microbial
66   community are likely missed, which may explain both lower proportion of archaea-positive
67   animals and the lower archaeal alpha-diversity in the approach relying on prokaryote universal
68   primers.
69
70   Five major events of adaptation to the gut in the Archaea
71   The broad taxonomic coverage of the animal hosts and the use of archaeal specific primers
72   allowed us to identify archaeal ASVs belonging to 19 described families, 10 orders, 6 classes,
73   and 3 phyla. 84.9% of these ASVs (94.5% of the reads) share more than 95% identity with
                                                                    34
74   species in the Living Tree Project (LTP, v138) database             amended with characterized
75   candidate species, and half of the reads share more than 99% identity with known species
76   (Table S2). Consistently, the vast majority (93.7%) of the reads are affiliated to only six genera
77   or families (Figure 2a): Methanobrevibacter, Methanosphaera (Methanobacteriales),
78   Methanomethylophilaceae              (Methanomassiliicoccales),            Methanocorpusculum
79   (Methanomicrobiales),     Methanimicrococcus        (Methanosarcinales),    Nitrososphaeraceae
80   (Nitrososphaerales/Thaumarchaeota group 1.1b). These lineages also constitute more than
81   50% of the gut archaeome in 92% of the sampled animals and can be qualified as “dominant
82   gut    archaea”.      Among       them,        Methanobrevibacter,      Methanosphaera        and
83   Methanomethylophilaceae had already been extensively reported in the gut microbiota of
                                          5,15,20
84   ruminants, human and termites              . Our results show that they are also the main
85   methanogenic lineages in a much wider range of animals. Methanobrevibacter members are
86   by far the most dominant methanogens in our dataset – composing over a third of the total
87   number of reads, followed by Methanomethylophilaceae members which accounted for
88   17.5% of the total reads (Figure 2a). The two others methanogen lineages that are the most
89   prevalent in our dataset, Methanocorpusculum and Methanimicrococcus, have been less
90   often reported in previous studies on the animal digestive tract 15,35.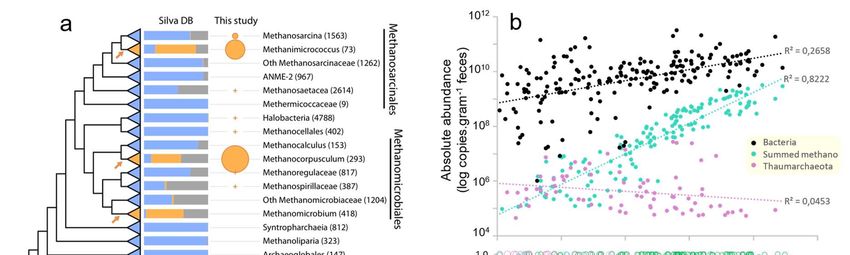
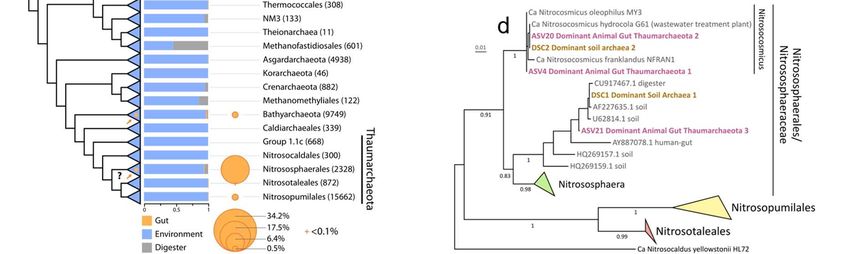
Figure 2. Proposed independent events of adaptation to the gut in the domain archaea. a) Distribution of
archaeal 16S rRNA gene sequences in the gut and other environments based on sequences obtained from the
Silva database and this study. The archaeal tree is based on Borrel et al., 36 enriched with DPANN lineages.
Orange arrows on the tree indicate proposed events of adaptations to the gut environment, either at the base
or within displayed lineages. The histogram shows the proportion of sequences from a given lineage present
in either animal digestive tract (« Gut »), open natural environment (« Environment ») or built environment
(« Digester »). Circle surface area represents the percentage of reads attributed to each taxon in our study
including only gut-related samples. b) Correlation between the absolute abundance of Archaea and the
absolute abundance (16S rRNA copies/gram of feces) of Bacteria (black), summed methanogen lineages
(Methanobacteriales, Methanomassiliicoccales, Methanomicrobiales, Methanimicrococcus; green) and
Thaumarchaeota (purple), all determined by qPCR using lineage specific primers. The scale of the absolute
abundance of Archaea is on panel c). Plotted samples correspond to those with amplified Archaea in Miseq,
presented in panel c. c) Proportion of archaea corresponding to the dominant methanogen lineages (green),
Nitrososphaeraceae (purple) and rarer taxa (light blue) in samples, based on Miseq sequencing with archaeal
specific primers, according to absolute abundance of archaea in the sample (qPCR). Dots indicate the relative
abundance of these three categories/lineages of archaea in each sample. Lines indicate the moving averages
with a subset size of 25 samples. The dominant methanogen lineages category contains Methanobrevibacter,
Methanosphaera, Methanomethylophilaceae, Methanocorpusculum, Methanimicrococcus. The rarest taxa
category contains Methanobacterium, Methanothermobacter, Methanomassiliicoccaceae, Methanosarcina,
Methanoregulaceae,         Methanospirillaceae,   Methanosaeta,      Methanocellales,     Nitrosopumilaceae,
Nitrosotaleaceae, Bathyarchaeota, Halobacteriales. d) Phylogenetic position of dominant gut
Thaumarchaeota (this study, ASV4, ASV20 and ASV21, purple) and dominant soil archaea 37 (DSC1 and DSC2,
brown). ASV4/ASV20 are virtually similar to DSC2 representative sequence (only 1 indel in a 4/5Gs
homopolymer region, which may be due to a 454-sequencing error in DSC2 38. ASV21 shares 99.2% identity
with the DSC1 representative sequence.
91          The five dominant methanogen lineages in the gut have been rarely reported in open
 92   environments, as revealed by a meta-analysis of the archaeal 16S rRNA gene sequences
 93   present in the Silva database (Figure 2a). They are also often dominant in samples with the
 94   highest archaeal absolute abundance (Figure 2c). In contrast, Nitrososphaeraceae and rarer
 95   archaeal lineages (e.g., Methanobacterium, Methanosarcina, Methanomassiliicoccaceae) are
 96   more often dominating in samples with the overall lowest archaeal absolute abundance
 97   (Figure 2b and c). Sequences from the rarer archaeal lineages have been generally reported
 98   from non-gut environments such as sediments and wetland soils 32,39 (Figure 2a). Therefore,
 99   these lineages likely contain free-living archaea that have weaker capacity to develop in the
100   gut and are only detectable when the most adapted archaea are absent or occur in low
101   abundance. These lineages that are weakly associated with the gut microbiome are often the
102   closest phylogenetic relatives to the ones that are highly abundant in the gut (Figure 2a). In
103   addition, the dominant gut genera/families belong to orders that are often present in
104   digestors/bioreactors, suggesting a more ancient adaptation to high resource availability in
105   these lineages (Figure 2a). This suggests that some of the traits favouring development in the
106   gut were already present in the last common ancestor of Methanobacteriales,
107   Methanomassiliicoccales or Methanosarcina+Methanimicroccus, which may have facilitated
108   the emergence of gut-specialized archaea particularly in these lineages. Considering that the
109   dominant gut methanogen lineages are rarely detected in open environments, and that
110   closely related lineages are rarely present in the gut, a strong specialization to the gut
111   microbiome likely occurred at the divergence of each of the five dominant gut methanogen
112   lineages, suggesting at least five major events of adaptation to the gut in the Archaea (Figure
113   2a). A few other methanogen lineages may have developed specific adaptations to certain gut
114   conditions or specific hosts. For example, “Candidatus Methanomassiliicoccus intestinalis”
115   was also detected in high absolute abundance in the gut of elderly people being in long-term
116   residential care and having a disturbed gut microbiota 18. Methanomicrobium mobile was not
117   detected in our samples (Figure 2a), but it can represent a large proportion of archaea in the
                                                                             40
118   rumen and it is almost never detected in open environments                  , suggesting a high
119   specialization on this gut compartment, which was not examined here.
120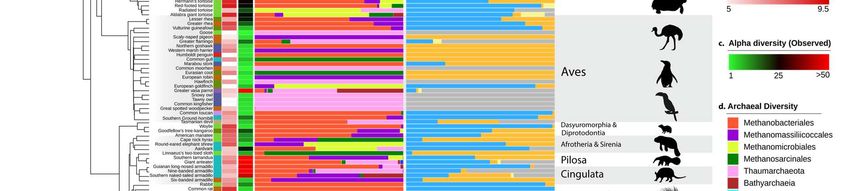
121   Non-methanogenic lineages are components of the animal gut archaeome
122   The family Nitrososphaeraceae (Thaumarchaeota), which gathers 15% of the total reads in our
123   study, has rarely been reported in previous gut microbiomes studies (great apes and humans)
124   and only when archaeal specific primers coupled with high-throughput sequencing (or nested
125   PCR) were used 16,41,42. Conversely, this lineage is common in terrestrial environments such as
126   soils (Figure 2a) 37,43–45. The large presence of these obligate aerobes in the gut is somehow
127   surprising, but oxygen is available in some gut sections and in proximity of the gut wall in other
128   sections dedicated to fermentation 46 and some animal host more aerobic communities than
129   others 47. The three thaumarchaeotal ASVs that gather the largest number of reads in our
130   dataset (ASV4/ASV20/ASV21) are also highly distributed among animal species, ASV4 being
131   the most widespread archaeon in our samples (present in 65 animal species from 8 classes).
132   These three ASVs correspond to the most prevalent and abundant archaeal phylotypes
133   (named DSC1 and DSC2) among 146 soils from various biomes 37 (Figure 2d). Because most
134   animals live (eat, sleep, groom...) on soil, these dominant soil archaea may be ingested by
135   chance, which could explain why they are present in a wide range of animal at a low absolute
136   abundance (Figure 2d). However, a sequence closely related to ASV21 and DSC1 has also been
137   found in the human gut 42 (Figure 2d). Moreover, while Thaumarchaeota group I.1c are among
                                     37,48
138   the dominant archaea in soil       , we only found one ASV belonging to this lineage in one
139   sample. ASV4/ASV20 and DSC2 are closely related to several “Candidatus Nitrosocosmicus”
                45,49,50
140   species          ; Figure 2d). These species can grow at ammonia concentrations (>20mM)
141   prevailing in the gut 51–53, that inhibit other ammonia-oxidizing Thaumarchaeota 45. Also, one
142   of them was cultured from a wastewater treatment plant 49, an environment that shares some
143   characteristics with the gut. Therefore, an alternative hypothesis is that the dominant
144   Thaumarchaeota in the animal gut can maintain in this environment, which may be beneficial
145   for their dispersion in soils, being spread by animal faeces. The degree of adaptation and role
146   of Nitrososphaeraceae in the gut remains to be elucidated.
147          Finally, although Bathyarchaeota were not common in our samples, most of the
148   sequences we retrieved are closely related to a clade formed by “Ca. Termiticorpusculum”
149   and “Ca. Termitimicrobium” (>95% id to termite sequences), two lineages recently identified
150   in the termite gut 54. Together with sequences from anaerobic digestors and sediments, our
151   sequences from mammal, birds, reptiles, and crayfish, form a sister clade to termite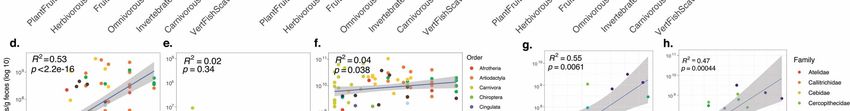
152   sequences (Figure S2), suggesting that some general traits needed to maintain in the gut are
153   shared by these Bathyarchaeota.
154
155   Specific associations between archaea and their hosts
156             In mammals, main factors significantly affect the beta-diversity of archaea with the
157   following level of influence: host phylogeny > coefficient of gut differentiation > host diet >
158   digestive     tract      type,      regardless        of    the   diversity     measurement               used    –        i.e.,
159   Weighted/Unweighted UniFrac, Bray-Curtis, and Jaccard (Table 1; Figure S3). Other factors
160   such as the geographic origin of the samples and the body mass have little influence on the
161   archaeal community structure (Supplementary text).

        Beta diversity       Host      Gut diff    Diet     GIT Body        qPCR      Arc:bac   Stomach           Mean    Origin*
          measure           order       Coeff     df = 7   type mass      archaeal      ratio      pH           retention
                            df = 10     n = 23             df = 4 df = 1 abundance     (qpcr)    n = 18           time
                                        df = 1                             df = 1      df = 1     df = 1          df =1

      Weighted      R2 = 0.40         0.32        0.20 0.10      0.06 0.04           0.04
                                                                                                ns              ns          ns
      unifrac       p = 0.001         0.0009      0.002 0.02     0.002 0.01          0.03

      Unweighted R2 = 0.33            0.17        0.19 0. 13 0.03                                                           0.05
                                                                    ns               ns         ns              ns
      unifrac    p = 0.001            0.0009      0.001 0.001 0.003                                                         0.035

                    R2 = 0.25         0.13        0.16 0.14 0.02        0.02         0.02                                   0.05
      Bray-Curtis                                                                               ns              ns
                    p = 0.001         0.0009      0.001 0.001 0.01      0.03         0.01                                   0.018

                    R2 = 0.21         0.13        0.14 0.11 0.02        0.02         0.02                                   0.05
      Jaccard                                                                                   ns              ns
                    p = 0.001         0.0009      0.001 0.001 0.02      0.02         0.02                                   0.018

       Table 1. Factors that influence the Beta Diversity of archaea in Mammals. Mammals with > 2 species per order
       (n = 73, unless otherwise indicated) rarefied to 3000 reads per sample were subject to beta diversity analyses.
       * including only zoo from which more than three samples were collected, and samples from the same species
       were treated separately (n = 99; df = 11). Signficant differences were tested for between beta diversity metrics
       using a permutational analysis of variance (PERMANOVA), p < 0.05 was considered signifcant.
162
163             The level of beta-diversity variance explained by host phylogeny is as high (or higher)
                                                                                                     9,10,47,55–58
164   as the one previously reported for bacterial communities in mammals                                              . Specific
165   associations between archaeal and animal host lineages are visible through the dominance of
166   gut archaeome by Methanobacteriales/Methanobrevibacter in Rodentia and most
167   Cetartiodactyla,          Methanomassiliicoccales/Methanomethylophilaceae                            in        Lemuridae,
168   Methanomicrobiales/Methanocorpusculum in Perissodactyla and several Reptiles or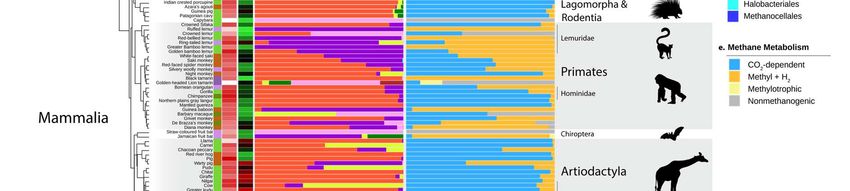
169 Thaumarchaeota/Nitrososphaeraceae in Gastropoda (Figure 3d). A link between archaea and
170 their host is also evident from the existence of archaeal clades associated with specific host
Figure 3. Archaeal taxonomic diversity and abundance in the animal gut. a) Information on animal primary
diet gathered using the Elton Trait database, the Animal Diversity Website database, or from specialists who
provided fecal samples. Primary diet was considered food material that made up >70% of the animal’s diet. b)
Absolute abundance of archaea as determined by qPCR with archaea-targeting primers on a log scale. c)
Observed richness (number of different ASV) of archaea. Green represents animals with low richness, black
represents medium richness ~ 25; and red represents high richness >50 archaeal ASVs. d) Taxonomic diversity
of archaea in the animal intestinal microbiome. Samples were rarefied to 3000 archaeal reads. e) Predicted
methane metabolism, assigned to ASVs based on taxonomic annotation (Table S4).
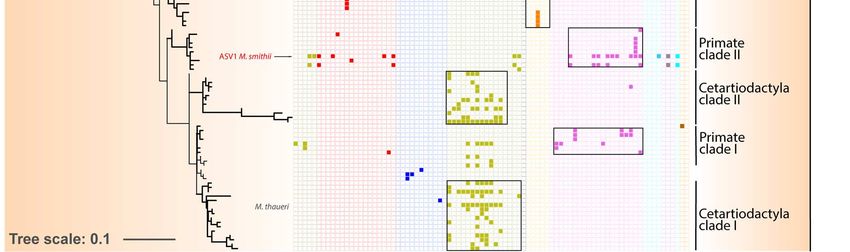
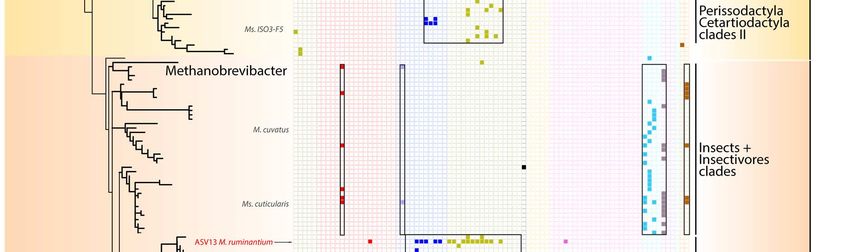
171 orders. Methanobrevibacter is the most structured genus with respect to these specific
172 associations, several Methanobrevibacter clades being enriched in one type of mammal host
173 (Primates, Cetartiodactyla, Perissodactyla Rodentia) (Figure 4). These results are consistent
174 with the previous report of Methanobrevibacter OTUs showing phylogenetic association with
10
175 hosts . In Methanocorpusculum, a large Perissodactyla-associated clade is sister to a
176 Cetartiodactyla-associated clade (Figure S4), suggesting that the ancestor of these two177 archaeal clades was present in the ancestor of the Ungulata. Close relationships between
178 Perissodactyla and Cetartiodactyla ASVs are also visible in Methanobrevibacter and
179 Methanosphaera (Figure 4).
Figure 4. Distribution of Methanobacteriales ASVs among Mammals. The phylogenetic tree (maximum-
likelihood, GTR+G4) was built with nearly full length 16S rRNA genes sequences from literature and the ASVs
sequences from this study. For display purposes, the shown tree includes only the ASV representing more
than 1% of the sequences per sample. The percentages on the right indicate the proportion of reads from
Methanobacteriales that were annotated as Methanobrevibacter, Methanosphaera, Methanobacterium or
Methanothermobacter.180 In the Methanomethylophilaceae, there is a large Primates-associated clade containing
18
181 several of the typical human-associated species (Mx-03, Mx06; ; Figure S5). Fewer host-
182 specific clades are observed outside mammals, except for reptile-specific clades in
183 Methanocorpusculum. These clades complement the previously reported insect/termites-
184 specific ones within Methanobrevibacter, Methanomethylophilaceae and
185 Methanimicrococcus 20,35) and support the hypothesis that archaea developped adaptations
186 for specific host lineages with which they may have been associated for a long evolutionary
187 time. In contrast, no clear host-associations are visible in Nitrososphaerales (Figure S6) which
188 points at the absence of specialization to specific animal guts and supports the hypothesis of
189 their low level of adaptation to the gut, as discussed above.
190 Host phylogeny also influences the absolute abundance and alpha diversity of archaea.
191 Indeed, mammals have the highest absolute abundance of archaea, followed by reptiles and
192 amphibians (Figure 5a). Birds, bony fishes, and invertebrates have instead the lowest
193 concentrations. This global trend for archaea is mostly driven by variation in the methanogen
194 lineages, particularly concerning the Methanobacteriales (Figure S7; Supplementary text).
Figure 5: Absolute Abundance of Archaea (red) and Bacteria (blue) determined via qPCR in a) animal classes
(n = 286) and b) mammalian orders (n = 156). Animal lineages with significantly different archaeal/bacterial
abundances are labeled. Wilcoxon rank sum *: p < 0.05; **: p < 0.01; ***: p < 0.001; ****: p < 0.0001.195 Archaea were also detected in a lower proportion of bird and fish species than in other animal 196 classes (Figure 1; Figure S8). In Mammalia, samples belonging to Perissodactyla, 197 Cetartiodactyla, Primates, Diprotodontia and Rodentia have the highest absolute 198 concentration of archaea, whereas those belonging to Carnivora and Pholidota have the 199 lowest (Figure 3b). Conversely, the abundance of bacteria is more uniform across mammalian 200 orders (Figure 3b). Closely related groups of animals also tend to have similar levels of archaeal 201 alpha diversity, as supported by the Moran index (I=0.08, p= 0.001, n = 150). For example, the 202 archaeal richness is high in the members of Gastropoda and in most members of the Cingulata, 203 Equidae (order Perissodactyla) and Bovidae (order Cetartiodactyla) within mammals (Figure 204 3b; Table S1). Conversely, we found comparably low levels of archaeal richness within the 205 Aves and Actinopterygii. 206 207 Strong influence of diet on methanogen abundance and composition 208 Diet is another important factor affecting the gut archaeome, both in terms of alpha- 209 diversity, beta-diversity (Table 1; Figure S9) and abundance (Figure 6). Figure 6: Influence of host diet-type, diet-fibre content, and mean retention time on the absolute abundance of total methanogens, Thaumarchaeota and Bacteria. Abundance of a) total methanogens (n = 161), b) Thaumarchaeota (n = 116) and c) Bacteria (n = 223) according to host diets-type. Significant differences across all groups were determined via the Kruskal-Wallis test, with p < 0.05 set as significant. Wilcoxon rank sum test with continuity correction was used to determine differences between diet types *: p < 0.05; **: p < 0.01; ***: p < 0.001; ****: p < 0.0001. Correlation between diet-fibre content and absolute abundance of d) methanogens (n = 103), e) Thaumarchaeota (n = 55) and f) Bacteria (n = 107) in mammal species. g) Dietary fibre versus averaged absolute abundance of methanogens in Primates (n = 12). Mean retention time is significantly related to the abundance of methanogens in primates. Statistical analyses and representation
of the absolute/relative abundance of methanogens were carried out on species where archaea have been detected. h)
  Correlation between digesta mean retention time vs Averaged absolute abundance of methanogens in Primates (n = 24).
  Fibre consumption is significantly related to the abundance of Methanogens in primates.

210            Indeed, herbivorous animals have a higher number archaeal ASV than carnivorous and
211   omnivorous animals (Figure S9). Moreover, the absolute and relative abundance of
212   methanogens is higher in animals with a plant-based diet (e.g., leaves, fruits) than in animals
213   feeding on meat or insects, and their abundance is intermediate in omnivorous animals
214   (Figure 6a). This link between methanogen abundance and diet-type is further supported by
215   the positive correlation of both the absolute and relative abundances of methanogens (but
216   not of Thaumarchaeota, and very weakly for bacteria) with the fibre content of the diet (Figure
217   6d-f; Figure S10). The increase in methanogen absolute/relative abundance reaches a limit at
218   around 200 g of crude fibre/kg of dry matter (Figure 6d; Figure S10). At lower host taxonomic
219   level, the positive correlation also holds for Primates, for which we sampled species with
220   contrasted average fibre intake (Figure 6g). An increased diet fibre content was previously
221   reported to be associated with a higher expression level of methanogenesis genes in humans
      59                                                   60                   61
222        and a greater methane production in pigs             and ruminants     . As the vast majority of
223   intestinal methanogens are hydrogenotrophic, these relationships can be explained by the
224   higher production of hydrogen from fibre/carbohydrates-rich diets (plant) than from
225   protein/fat-rich diets (meat) 62.
226            However, the level of H2 produced from fibre degradation also depends on which
227   bacteria are involved, Clostridiales being known to producing more H2 than Bacteroides during
                            63
228   fibre degradation       . Thus, other than diet, methanogens are also influenced by the
229   composition of the bacteria degrading it. In humans, cellulolytic Ruminococcaceae
230   (Clostridiales, Firmicutes) spp. have been reported to be present in the gut of methane
                                                                                                       63
231   producers, while cellulolytic Bacteroides spp. prevail in non-methane producers                    , and
232   methanogens are enriched in subjects with Firmicutes/Ruminococcaceae enterotype 64. We
233   found that eight Ruminococcaceae OTUs (including six from uncharacterized genera) co-occur
234   with methanogens, and -more generally- 19 out of the 30 bacterial OTUs positively associated
235   with methanogens belong to Clostridiales and only four to Bacteroidales (Table S3,
236   Supplementary text). Other than benefiting from fibre degradation, methanogens can also
237   favour it by stimulating microbes involved in its degradation. Indeed, the presence of
238 methanogens in cocultures has been shown to increase the level of extracellular
239 polysaccharide-degrading enzymes of Ruminococcus flavefaciens 65.
240 The abundance of hydrogenotrophic methyl-reducing methanogen lineages (i.e.,
241 Methanomassiliicoccales and Methanimicrococcus) is less influenced by fibre content than
242 lineages that include hydrogenotrophic CO2-reducing methanogens (i.e., Methanobacteriales
243 and Methanomicrobiales; Figure S11). Moreover, hydrogenotrophic methyl-reducing
244 methanogens represent a lower proportion of the methanogens in herbivorous animals than
245 in animals having another type of diet (p = 0.003). As methyl-reducing methanogens depend
246 on different methyl-compounds (e.g. methanol, methylamines) for their energy metabolism
247 and because they can utilize hydrogen at lower concentration than CO2-reducing
66
248 methanogens , their distribution may be more affected by the availability of methyl-
249 compounds than by fibre content. One of these methyl-compounds, methanol, is produced
250 by the bacterial degradation of pectin 67. This metabolism was shown to occur in the animal
251 gut (e.g., human, pigs, lemurs, ruminants) as revealed by the identification of bacteria with a
68,69
252 methylesterase activity and by the increase in methanol concentrations in response to
253 pectin consumption 70–72. Our data show that the ratio of hydrogenotrophic methyl-reducing
254 to CO2-reducing methanogens is higher in frugivorous species than in herbivorous ones (p =
255 0.005), which is likely related to large amounts of pectin in fruits. This support a previous
256 hypothesis that the high relative abundance of Methanosphaera stadtmanae (an obligate
257 methanol-reducing methanogen) in orangutan is related to their high fruit consumption 73.
258 We also found a high relative abundance of hydrogenotrophic methyl-reducing
259 methanogens in most of the sampled Primates (Figure 3e), and particularly in Lemuridae,
260 which may be related to the presence of fruits in their diet (Table S1). This relationship is
261 further substantiated by the association between an archaeal OTU closely related to
18
262 Methanomethylophilaceae sp. Mx06 and a bacterial OTU closely related to Lachnospira
263 pectinoschiza (OTUarc_11; OTUbac_2345; Table S3). This bacterium grows mainly on pectin,
264 producing methanol as a by-product of its degradation 74, and Methanomethylophilaceae sp.
265 Mx06 has the genetic potential to grow by reducing methanol and methylamines with H2 18. A
266 similar link may exist in humans, as both Lachnospira pectinoschiza and
75,76
267 Methanomassiliicoccales abundance increases with age . Moreover,
268 Methanomethylophilaceae sp. Mx06 is the dominant archaeon in the gut of Yanomami
269 Amerindians 18,77, whose diet is largely composed of fruits 78.270 As Methanomassiliicoccales and Methanimicrococcus may also grow on other methyl-
271 compounds than methanol, such as trimethylamine, they might be influenced by other types
272 of diet. Methanomethylophilaceae OTUarc_11 is also correlated with an OTUs closely related
79
273 to Sarcina sp. (OTUbac_4310; Table S3) that can produce trimethylamine . A similar
274 correlation between Methanomethylophilaceae and Sarcina was previously reported in the
275 human gut 80. Precursors of trimethylamine (i.e. glycine-betaine, carnitine and choline) are
276 present in various diets 81–83 and pectin is not limited to fruit but is also a constituent of the
84
277 plant cell wall , which therefore do not limit the presence of hydrogenotrophic methyl-
278 reducing methanogens to frugivorous animals. In our dataset, hydrogenotrophic methyl-
279 reducing methanogens constitute almost 40% of the overall methanogen reads (Figure 7a;
280 Table S4) and represent a large fraction of the methanogens in many animals (Figure 3e;
281 Supplementary text). This contrasts with many non-host environments (e.g. sediments, peat
Figure 7: Main methanogenesis pathways in the animal gut. a) Proportion of the total archaeal reads that are
assigned to taxa with a predicted CO2-dependent hydrogenotrophic methanogenesis (H2 + CO2; blue) or
methyl-dependent hydrogenotrophic methanogenesis (CH3-R + H2; orange) pathway. Methanosarcina spp.
can have diverse methanogenesis pathways (the two above-mentioned pathways and the methyl-dismutation
(or methylotrophic) and acetoclastic pathways. b) Diagram of the most favourable methanogenic metabolisms
depending on methanol concentration (C(methanol) in mol/l) and hydrogen partial pressure (p(H2) in bar).
Coloured area in the map indicate ranges of C(methanol) and p(H2) for which either CH3-R dismutation, CH3-R
+ CO2 or CO2 + H2 is the most favourable pathway, i.e. concentrations and pressure ranges for which the
associated ∆Gcat expressed in kJ/mol CH4 is the most negative. ∆Gcat values were calculated for T = 298 K, pH
= 7 and p(CO2) = p(CH4) = 10-1 bar, when the difference in ∆Gcat between two or three catabolisms was less
than 10 kJ/mol CH4, catabolisms were then considered to be equally favourable. This corresponds to central
coloured areas in the diagram where either two or three metabolisms are shown as equally favourable. The
dotted line indicates particular values of C(methanol) and p(H2) for which all three catabolisms have exactly
the same ∆Gcat. Ranges of C(methanol) and p(H2) found in the literature for either gut or marine sediments
environments were also mapped on the graph: dots correspond to mean values and bars indicate minimal and
maximal values. See Material and Methods section for the references on the studies providing the
concentrations.282 bog), where hydrogenotrophic methyl-reducing methanogens constitute a minor fraction of
39,85
283 the overall methanogens . It also reinforces the hypothesis that the gut environment is
284 particularly propitious for this kind of methanogenesis, which could have led to the transition
285 from methylotrophic and CO2-reducing methanogenesis to methyl-reducing methanogenesis
35
286 in Methanimicrococcus and Methanosphaera, respectively . Other methane metabolisms
287 (based on dismutation of methyl-compounds or acetate) are almost absent from the animal
288 gut and may occur in the few Methanosarcina members (0.6 % of the total reads) identified
289 in our dataset (Figure 7a). The few data on methanol concentration and H2 partial pressure in
290 the gut highly contrast with those observed in marine sediments where dismutation of
291 methyl-compounds is prevalent (Figure 7b). Gut conditions with relatively high partial
292 pressure of hydrogen are generally more favourable for CO2-reducing hydrogenotrophic
293 methanogenesis but can vary to be equally favourable for methyl-reducing hydrogenotrophic
294 methanogenesis or even for dismutation of methyl-compounds (Figure 7b). Why
295 methanogens having this latter metabolism are not more prevalent in the gut is unclear, it
296 might be related to the conditions generally favouring other metabolisms but this could also
297 be related to the lower affinity of their enzymes for methanol and H2 than methyl-reducing
298 methanogens 46.
299 The influence of diet is further substantiated by the link between the archaea present
300 in the gut microbiota of both predators and their preys. Indeed, within Methanobrevibacter,
301 sequences of insectivorous mammals from distinct orders (Carnivora, Pilosa, Pholidota,
302 Cingulata, Afrotheria) are clustered with sequences from insect clades (Figure 4) reported in
303 the literature 20. Except for cane toad (Urodela), no sequences from non-mammal insectivores
304 are present in these clades. Moreover, a similar phylogenetic clustering of insectivores and
305 insect-derived archaeal sequences was not observed for other known insect clades outside of
306 Methanobrevibacter (even if a few non-mammal insectivores are present in the
307 Methanimicrococcus insect clade). This suggests that Methanobrevibacter may also develop
308 in the gut of insectivorous mammals while other insect-associated methanogens are mostly
309 transients.
310
311 Impact of digestive tract physiology
312 Both the coefficient of gut differentiation 86 (i.e., proportion of the gut dedicated to
313 fermentation) and where the fermentation takes place (e.g. foregut, hindgut, caecum) explain314 part of the variance in of the beta-diversity (Table 1). In addition, many ASVs are almost
315 ubiquitous in the ruminant Cetartiodactyla (paraphyletic, Ruminantia and Tylopoda), but
316 mostly absent from non-ruminant Cetartiodactyla or other animals, highlighting possible cross
317 influence of gut physiology and host-phylogeny (Figure S12). Whether these archaea found in
318 faeces originate from the rumen compartment or can colonize more largely the gut of these
319 animal is currently unknown. The total abundance of methanogens is positively correlated
320 with gut differentiation coefficient in mammals (R2 = 0.33, p = 0.0036, n = 25), while there was
321 no correlation with abundance of Thaumarchaeota and Bacteria (Figure S13).
322 It was previously reported that digesta mean retention time (MRT) is positively
323 correlated with methane emission in herbivorous mammals 87. Also, a positive relationships
324 between methanogen abundance and MRT was reported in humans 88. When considering only
325 Primate species, we also highlight a positive correlation between MRT and methanogen (or
326 total archaea) abundance (Figure 6h). However, we found only a weak positive correlation
327 between MRT and methanogen (or total archaea) abundance in all animals (R2 = 0.11; p = 0.02,
328 n = 69). However, the distribution of the values suggests that the abundance of methanogens
329 is mostly influenced by the lower range of MRT values. Indeed, there is a stronger positive
330 correlation (R2 = 0.33; p = 4.3e-06, n = 54) for MRT values ranging from 0.5 to 50 h and
331 significantly less archaea in animals with an MRT < 20h than animals with an MRT > 20h
332 (Kruskal-Wallis p = 0.0008, n = 69). Diet type and MRT are generally related since digestion of
333 fibre-rich diet relies on microbial fermentation (“allo-enzymatic” digestion) which requires
334 longer MRT than digestion of protein/soluble carbohydrate-rich diets that are processed at
335 high rate by animal enzymes (“auto-enzymatic” digestion) 89,90. An exception is the extreme
336 case of the giant panda, an herbivore with a short MRT (8 h) that is a clear outlier in the
337 relationships between fibre content and both methanogen absolute/relative abundance
338 (Figure S10). Conversely, carnivorous reptiles have a long MRT, which can exceed a week for
91
339 some large snakes . Among them, boa constrictor and reticulated python have a high
340 abundance of methanogens compared to other carnivorous animals which suggests that a
341 long MRT can allow a substantial development of methanogens on meat diet. An increase in
342 the relative abundance of Firmicutes, potential partners of methanogens, has also previously
92
343 been recorded in Burmese pythons during digestion . However, while long MRT may
344 facilitate methanogen development on meat-diet, it should be stressed that most carnivorous
345 reptiles have a low abundance of methanogens. Outside of Mammals and Reptiles, most birds,346 fish, amphibian, and invertebrates have generally a low concentration of archaea and
347 especially of methanogens (Figure 5). Many flying birds feeding on plant materials use only
348 readily digestible components of their diet, and rapidly expel recalcitrant cell-wall constituent
93
349 without significant microbial fermentation . This was suggested to be an adaptation to
350 improve flight power by decreasing the body mass 93. It is thus likely that the short transit time
351 and the low level of plant fermentation have a negative impact on methanogen abundance in
352 birds. In addition to low concentrations of methanogens in Carnivora, bird and fish, we found
353 no clear archaeal clades associated with these animals (with few exceptions, like a small
354 Carnivora-associated clade in Methanosphaera; Figure 4), suggesting that no lineage of
355 methanogens developed strong adaptations to these hosts.
356 It was proposed that some animals, including birds, rely relatively little on their gut
357 microbiota 94. In addition, bacteria recovered from birds show little host specificity and do not
358 display phylosymbiotic patterns with their host or correlation with diet, differently from what
359 has been generally observed in most mammals gut microbiota 9. In our dataset, the low
360 abundance of bacteria in the gut microbiota of bird supports the hypothesis of Hammer et al.,
94
361 and extend the observations of Song et al., 9 on the particularity of the gut microbiota of
362 these animals. However, we found that concentrations of faecal bacteria in other animals
363 proposed to rely less on their gut microbiota, such as Carnivora species 94, are as high as in
364 other mammals (Figure 5b).
365
366 Conclusions
367 Our work provides first key insights into the lifestyle and role of intestinal archaea across a
368 diverse range of animal hosts. Increased sampling efforts, time-series analyses, and
369 metagenomic investigation will help to answer standing questions about the impact of
370 geography, captivity, residency, and adaptations of intestinal archaea throughout the animal
371 phylogeny.
372
373 Material and Methods
374 Sample collection and DNA extraction
375 A majority of animal faecal samples were donated from various zoological institutions in
376 France (Table S1). Fresh faecal samples (n = 392) were stored at -20°C until DNA extraction.
377 Total DNA was extracted using a modified QIAamp PowerFecal DNA Kit (Hilden, Germany)378 protocol. Cells were lysed using the Fastprep (MP Biomedicals) cell homogenizer ‘faecal
379 sample’ default setting in the lysis buffer provided in the PowerfFecal DNA kit. For subsequent
380 analyses, genomic DNA was diluted ten times, to limit the effect of PCR inhibitors.
381
382 Quantitative PCR
383 Total bacteria, total archaea, and specific archaeal lineages (Methanobacteriales,
384 Methanomassiliicoccales, Methanomicrobiales, Methanimicrococcus, Thaumarchaeota) were
385 quantified using quantitative PCR with lineage specific primers (Table S5). qPCR was
386 performed on a qTower3 Touch device (Analytik Jena GmbH) using SensiFAST SYBR® &
387 Fluorescein Kit (Bioline, Paris, France). For each run, a standard curve was prepared using a
388 10-fold serial dilution (109 to 101 copies/µl) of a plasmid containing a 16S rRNA. Plasmids
389 containing a partial archaeal or bacterial 16S rRNA gene were generated through cloning PCR
390 amplified 16S rRNA gene of the groups into E. coli. Bacterial 16S rRNA genes were amplified
391 from a faeces sample using the B-27F-YM/B-1492R primer set 95,96. Archaeal 16S rRNA genes
392 were amplified from Methanimicrococcus blatticola, Methanocorpusculum aggregans,
393 Methanomethylophilus alvus, Methanosphaera stadtmanae and Nitrososphaera viennensis
97,98
394 using the A-21F/A-1386R primer set . PCR products were cloned with a pGEM-T vector
395 according to the manufacturer’s instructions (Promega, Charbonnières-les-Bains, France). The
396 accuracy of the plasmid construction was confirmed through sequencing and all plasmids
397 were diluted to 109 copies/µl, aliquoted and stored at -20°C. The accuracy of the qPCR assay
398 was confirmed through melting curve analysis. All quantifications were performed twice in
399 independent runs. The final concentration of all the microbial was averaged between
400 replicates and normalized as copies of 16S rRNA gene per gram of faeces.
401
402 16S rRNA gene amplicon sequencing
403 Archaeal 16S rRNA genes were amplified in two steps (Nested-PCR; Table S6) to allow the
404 inclusion of a larger range of samples. Prokaryotic 16S rRNA genes were directly amplified
405 with Illumina tagged primer pairs (Table S6). Sequencing was performed on an Illumina MiSeq
406 platform (Biofidal, Vaulx-en-Velin, France) according to the Illumina protocols for PE 2x300 bp,
407 and resulted in more than 21 million reads and more than 16.7 million reads for the
408 prokaryotic and archaea specific sequencing, respectively.
409410 Microbial Diversity Analyses
411 Reads were processed and assigned to amplicon sequence variants (ASVs) using the DADA2
412 software (v1.12.1) in R (v3.6.0). Briefly, reads were trimmed and quality-filtered using the
413 standard parameters - maximum expected errors for forward and reverse reads = 2, quality
414 score = 2, and trimming length = 273 and 170 base pairs for forward and reverse reads,
415 respectively. Forward and reverse reads were merged with a 20 base pair overlap, ASVs were
416 generated, and chimeras were discarded. ASV annotation was performed using the Silva 16S
417 rRNA database (v132). Assignment of ASVs to a main type of methane metabolism
418 (hydrogenotrophic CO2-reducing, hydrogenotrophic CH3-reducing, acetoclastic and
419 methylotrophic (methyl-dismutation)), was done based on their taxonomic affiliation, since
420 all members of almost all methanogen genera/families have the same dominant type of
421 methane metabolism (Table S4). Methanosarcina is the main exception, as species from this
422 group can have one or several types of methane metabolisms. All ASVs that were not
423 annotated as archaea were removed from the archaeal-specific primer generated sequences,
424 and ASVs annotated as archaea or bacteria were kept from the universal primer generated
425 sequences. Samples from the same species were merged by summing ASV abundances. These
426 approaches resulted in 1307 archaeal ASVs from the archaea specific primers, as well as 140
427 archaeal ASVs and 19,145 bacterial ASVs from the universal primers. To estimate the novelty
428 of the archaeal ASVs (obtained with the archaea-specific primers), we compared them using
429 BLAST to 16S rRNA genes of isolated archaea retrieved from the SILVA Living Tree Project LTP
99
430 database plus additional sequences of candidate species belonging to
431 Methanomassiliicoccales and Thaumarchaeota. For diversity analyses, rarefaction was
432 performed to normalize sequencing depth to 3,000 reads, leading to 1,253 archaeal ASVs.
433 Bacterial ASVs were normalized to a sequencing depth of 12,000 reads per sample. Observed
434 richness (alpha diversity) was estimated and all beta diversity analyses were performed using
435 the ‘phyloseq’ package in R (v1.30.0). Subsequent statistical analyses were performed using
436 the base Rstudio ‘stats' package (v3.6.0) as well as the R package ‘vegan’ (v2.5-6). To test for
437 significant differences using the various beta diversity metrics (Table 1) a permutational
438 multivariate analysis of variation (PERMANOVA) from the R package ‘vegan’ (function adonis)
439 was used. A pairwise Wilcoxon rank sum test with continuity correction from the R package
440 ‘stats’ (function pairwise.wilcox.test) was used to determine differences between the
441 absolute abundance of archaea and bacteria in animal diet types, as well as between animal442 classes. Linear regressions from the R package ‘stats’ (function lm) were used to determine
443 the relationships between the abundance (log-transformed) of methanogens,
444 thaumarchaeota and bacteria, and mean retention time (MRT) and dietary fibre consumption.
445 Significance cut-off was p < 0.05 for all analyses.
446
447 Placement of ASVs within Reference 16S rRNA gene trees
448 All archaeal ASVs were filtered on a per sample basis, to keep only ASVs representing at least
449 1% of the total number of reads of the sample. Reference sequences > 1200 bp with a quality
450 >95% were obtained from the Silva SSU 138 database 100, RDP database 101, and an in-house
451 dataset. Redundancy was removed from reference sequences with a 98% or 97% sequence
102
452 identity threshold using the VSEARCH software . For each archaeal order, long reference
453 sequences were combined with the ASV sequences and were aligned using the G-IN-SI
454 algorithm in MAFFT 103. Phylogenetic trees were generated using the GTR+G4+I model in the
104 105
455 IQTREE software . The distribution of ASVs host orders were mapped using ITOL .
456 Reference sequences were ultimately removed from the tree to only keep the ASVs
457 sequences.
458
459 Co-occurrence of Archaea and Bacteria
460 To identify co-occurrence signal between archaea and bacteria across Mammalia, Reptilia,
461 and Aves, we integrated the sequences from both the Universal and Archaea specific 16S rRNA
462 gene amplicon sequencing. Only bacterial reads were selected from the Universal 16S rRNA
463 gene amplicon sequencing for this analysis. We used VSEARCH 102 to cluster ASVs into OTUs
464 at 97% in order to reduce the size of the dataset and to filter out truly low abundance lineages
465 of microbes. Then, to merge these datasets in a way that accurately represented the microbial
466 community in terms of relative abundance between archaea and bacteria, we normalized the
467 two datasets both in terms of sequence depth and in terms of archaea-bacterial ratios -
468 information which was gathered through qPCR data. OTUs that were present in less than 10%
469 of the animal classes – Mammalia, Aves, and Reptilia independently- were removed. Following
106
470 this, we implemented both the SPIEC-EASI (Spiec.Easi package v1.1.0, ) and the SparCC
107
471 algorithms (part of the Spiec.Easi package (v1.1.0)) in Rstudio (v3.6.0) to determine co-
472 occurrence trends between archaea and bacteria. Networks were calculated with 1000
473 iterations. The output from these analyses were filtered using a 0.5 minimum threshold of474 edge stability (SPIEC-EASI) (Table S3) and a p-value < 0.05 (SparCC), independently. Only the
475 co-occurrence patterns identified by both algorithms were further analysed.
476
477 Investigation of archaea distribution in the gut and other environment
99
478 All archaeal 16S rRNA gene sequences from Silva database longer than 800 bp and with
479 more than 80% sequence quality, alignment quality and pintail quality were downloaded.
480 Sequences from metagenomes were removed because their environmental origin was not
481 clearly indicated. The annotation of each sequence was retrieved from GenBank and used to
482 classify them as “Gut”, “Environmental” or “Human built” origin. Sequences from sponge,
483 animal environments (e.g. nest) or polluted sites (e.g. dump) were not included. The relative
484 abundance of each category was mapped on a tree of archaea built with genomic sequences
485 used in Borrel et al., 36 as well as additional DPANN sequences not present in this study.
486
487 Gibbs free energies of methanogenic pathways
488 The following chemical reactions were considered for methanogenic catabolisms:
489 CH3-R dismutation:
490 4/3 methanol → CH4 + 1/3 CO2 + 2/3 H2O
491 CH3-R + CO2:
492 methanol + H2 → CH4 + H2O
493 CO2 + H2:
494 CO2 + 4 H2 → CH4 + 2 H2O
495 For each catabolism Gibbs free energy (∆Gcat) calculations were performed using the R
496 package CHNOSZ108 considering C(methanol) between 10-3 and 10-7 mol/l, p(H2) between 1
497 and 10-7 bar, T = 298 K, pH = 7 and p(CO2) = p(CH4) = 10-1 bar.
498
499 Origin of the metadata
500 Animal metadata were collected from various literature sources and online databases. Diet
501 information for mammals and birds were downloaded from the EltonTraits database 109, and
502 information for other animal diets were annotated using the Animal Diversity Web database
503 (Museum of Zoology, University of Michigan, https://animaldiversity.org/). Information on
504 body weight were also gathered on this website. Information about coefficients of gut
505 differentiation, pH, diet fibre content, and intestinal tract structure and mean retention time506 were gather from 3,86,110–114. Information on methanol, H2 CO2 and CH4 in the gut and in marine 507 sediments originate from 18,46,115–123. 508 509 Data Availability 510 Data have been deposited in GenBank under the bioproject PRJNAXXXX. 511 512 Acknowledgments 513 C.T. is supported by a PhD fellowship from Paris Sorbonne Université Science and by funds 514 from the doctoral school Bio Sorbonne Paris Cité “BioSPC”. G.B. acknowledges funding from 515 the French National Agency for Research Grant Methevol (ANR-19-CE02-0005-01) and S.G. 516 acknowledges Archaevol (ANR-16-CE02-0005-01). This study has received funding from the 517 French Government's Investissement d'Avenir program, Laboratoire d'Excellence "Integrative 518 Biology of Emerging Infectious Diseases" (grant n°ANR-10-LABX-62-IBEID). We thank the 519 computational and storage services (TARS cluster) provided by the IT department at Institut 520 Pasteur, Paris. We also thank all people who generously collected and provided samples (or 521 made it possible to do so) for this study: Jérôme Fuchs from the Museum National d’Histoire 522 Naturelle (MNHN), Frédéric Delsuc (Institut des Sciences de l'Evolution, UMR5554), Alexis 523 Lécu and Olivier Marquis from Parc Zoologique de Paris, Baptiste Mulot and Hanae Pouillevet 524 from Zoo de Beauval, Paola Dvihally and Dominique Gitton from Parc des Mammelles, Antoine 525 Talarmin, Yann Reynaud, Stéphanie Guyomard, Matthieu Pot, Gaëlle Gruel, Séverine 526 Ferdinand from Institut Pasteur de Guadeloupe, Thomas Godoc from Aquarium de 527 Guadeloupe, Patrick Buisson and Sabine Collin at Palais de la Découverte, Jérôme Contignac 528 and David Luis Garcias Warner from Nabau Projects/Grupo Atrox, Aude Bourgeois from Jardin 529 des Plantes de Paris, Jérémy Sauvanet, Gaspard, Anaïs Tibi and Johnatan Aparicio. We thank 530 Christa Schleper for providing a plasmid with a Thaumarchaeota 16S rRNA gene for qPCR 531 standard, Jérôme Mathieu for data on gastrointestinal tract types and Marcus Clauss for 532 helping us collecting the MRT data from an abundant literature. 533 534 Author contributions
535   C.M.T., G.B. and S.G. conceived the study. C.M.T. did the experiments and E.D. the
536   thermodynamic calculations. C.M.T. and G.B. analyzed the data and wrote the manuscript
537   with the input of S.G.
538
539   Competing interests
540   The authors declare no competing interests.
541
542   References
543   1.    Blaut, M. & Clavel, T. Metabolic diversity of the intestinal microbiota: implications for health and
544         disease. J. Nutr. 137, (2007).
545   2.    Lozupone, C. A., Stombaugh, J. I., Gordon, J. I., Jansson, J. K. & Knight, R. Diversity, stability and
546         resilience of the human gut microbiota. Nature 489, 220–230 (2012).
547   3.    Stevens, C. E. & Hume, I. D. Contributions of microbes in vertebrate gastrointestinal tract to production
548         and conservation of nutrients. Physiol. Rev. 78, 393–427 (1998).
549   4.    Kapitan, M., Niemiec, M. J., Steimle, A., FrickIlse, J. S. & Jacobsen, D. Fungi as Part of the Microbiota
550         and Interactions with Intestinal Bacteria. in Fungal Physiology and Immunopathogenesis 422, (Springer,
551         Cham, 2018).
552   5.    Borrel, G., Gribaldo, S., Brugère, J.-F., Schmitz, R. & Moissl-Eichinger, C. The host-associated
553         archaeome. Nat. Rev. Microbiol. 18, 622–636 (2020).
554   6.    Gordon, J. I., Dewey, K. G., Mills, D. A. & Medzhitov, R. M. The human gut microbiota and
555         undernutrition. Sci Transl Med 4, 137ps12 (2012).
556   7.    Barko, P. C., McMichael, M. A., Swanson, K. S. & Williams, D. A. The Gastrointestinal Microbiome: A
557         Review. J. Vet. Intern. Med. 32, 9–25 (2018).
558   8.    Arrieta, M.-C., Stiemsma, L. T., Amenyogbe, N., Brown, E. M. & Finlay, B. The Intestinal Microbiome in
559         Early Life: Health and Disease. Front. Immunol. 5, 1–18 (2014).
560   9.    Song, S. J. et al. Comparative analyses of vertebrate gut microbiomes reveal convergence between
561         birds and bats. MBio 11, (2020).
562   10.   Youngblut, N. D. et al. Host diet and evolutionary history explain different aspects of gut microbiome
563         diversity among vertebrate clades. Nat. Commun. 10, 1–15 (2019).
564   11.   Delsuc, F. et al. Convergence of gut microbiomes in myrmecophagous mammals. Mol. Ecol. 23, 1301–
565         1317 (2014).
566   12.   Groussin, M. et al. Unraveling the processes shaping mammalian gut microbiomes over evolutionary
567         time. Nat. Commun. 8, 14319 (2017).
568   13.   Liu, Y. & Whitman, W. B. Metabolic, phylogenetic, and ecological diversity of the methanogenic
569         archaea. Ann. N. Y. Acad. Sci. 1125, 171–189 (2008).
570   14.   Deevong, P. et al. Isolation and Detection of Methanogens from the Gut of Higher Termites. Microbes
571         Environ. 19, 221–226 (2004).
572   15.   St-Pierre, B. & Wright, A.-D. G. Diversity of gut methanogens in herbivorous animals. animal 7, 49–56
573         (2013).
574   16.   Raymann, K., Moeller, A. H., Goodman, A. L. & Ochman, H. Unexplored Archaeal Diversity in the Great
575         Ape Gut Microbiome. mSphere 2, e00026-17 (2017).
576   17.   Danielsson, R. et al. Methane production in dairy cows correlates with rumen methanogenic and
577         bacterial community structure. Front. Microbiol. 8, 1–15 (2017).
578   18.   Borrel, G. et al. Genomics and metagenomics of trimethylamine-utilizing Archaea in the human gut
579         microbiome. ISME J. 11, 2059–2074 (2017).
580   19.   Koskinen, K. et al. First Insights into the Diverse Human Archaeome : Specific Detection of Archaea in
581         the Gastrointestinal Tract ... crossm First Insights into the Diverse Human Archaeome : Specific
582         Detection of Archaea in the Gastrointestinal Tract ,. MBio 8, 1–17 (2017).
583   20.   Brune, A. Methanogens in the Digestive Tract of Termites. in (Endo)symbiotic Methanogenic Archaea
584         (ed. Hackstein, J. H. P.) 81–101 (2018). doi:10.1007/978-3-642-13615-3_6
You can also read