Homologs of Circadian Clock Proteins Impact the Metabolic Switch Between Light and Dark Growth in the Cyanobacterium Synechocystis sp. PCC 6803
←
→
Page content transcription
If your browser does not render page correctly, please read the page content below
ORIGINAL RESEARCH
                                                                                                                                                   published: 22 June 2021
                                                                                                                                            doi: 10.3389/fpls.2021.675227

                                             Homologs of Circadian Clock
                                             Proteins Impact the Metabolic Switch
                                             Between Light and Dark Growth in
                                             the Cyanobacterium Synechocystis
                                             sp. PCC 6803
                              Edited by:
                                             Nina M. Scheurer 1† , Yogeswari Rajarathinam 2† , Stefan Timm 3 , Christin Köbler 1 ,
                    Alistair McCormick,      Joachim Kopka 2 , Martin Hagemann 3 and Annegret Wilde 1*
                University of Edinburgh,     1
                                               Institute of Biology III, University of Freiburg, Freiburg, Germany, 2 Applied Metabolome Analysis, Department of Molecular
                        United Kingdom
                                             Physiology, Max Planck Institute of Molecular Plant Physiology, Potsdam, Germany, 3 Department of Plant Physiology,
                         Reviewed by:        University of Rostock, Rostock, Germany
                          Michael Rust,
  University of Chicago, United States
                        Takashi Osanai,      The putative circadian clock system of the facultative heterotrophic cyanobacterial
                 Meiji University, Japan     strain Synechocystis sp. PCC 6803 comprises the following three Kai-based systems:
                    *Correspondence:         a KaiABC-based potential oscillator that is linked to the SasA-RpaA two-component
                         Annegret Wilde
                        annegret.wilde@      output pathway and two additional KaiBC systems without a cognate KaiA component.
                 biologie.uni-freiburg.de    Mutants lacking the genes encoding the KaiAB1C1 components or the response
 † These   authors share first authorship    regulator RpaA show reduced growth in light/dark cycles and do not show heterotrophic
                                             growth in the dark. In the present study, the effect of these mutations on central
                     Specialty section:      metabolism was analyzed by targeted and non-targeted metabolite profiling. The
           This article was submitted to
                        Plant Physiology,
                                             strongest metabolic changes were observed in the dark in 1rpaA and, to a lesser
                 a section of the journal    extent, in the 1kaiAB1C1 mutant. These observations included the overaccumulation
              Frontiers in Plant Science
                                             of 2-phosphoglycolate, which correlated with the overaccumulation of the RbcL subunit
             Received: 02 March 2021
                                             in the mutants, and taken together, these data suggest enhanced RubisCO activity in the
              Accepted: 26 May 2021
             Published: 22 June 2021         dark. The imbalanced carbon metabolism in the 1rpaA mutant extended to the pyruvate
                             Citation:       family of amino acids, which showed increased accumulation in the dark. Hence, the
        Scheurer NM, Rajarathinam Y,         deletion of the response regulator rpaA had a more pronounced effect on metabolism
          Timm S, Köbler C, Kopka J,
    Hagemann M and Wilde A (2021)
                                             than the deletion of the kai genes. The larger impact of the rpaA mutation is in agreement
Homologs of Circadian Clock Proteins         with previous transcriptomic analyses and likely relates to a KaiAB1C1-independent
Impact the Metabolic Switch Between
                                             function as a transcription factor. Collectively, our data demonstrate an important role
         Light and Dark Growth in the
  Cyanobacterium Synechocystis sp.           of homologs of clock proteins in Synechocystis for balanced carbon and nitrogen
                           PCC 6803.         metabolism during light-to-dark transitions.
         Front. Plant Sci. 12:675227.
      doi: 10.3389/fpls.2021.675227          Keywords: circadian clock, Synechocystis, carbon metabolism, RpaA, diurnal metabolic switch

Frontiers in Plant Science | www.frontiersin.org                                     1                                             June 2021 | Volume 12 | Article 675227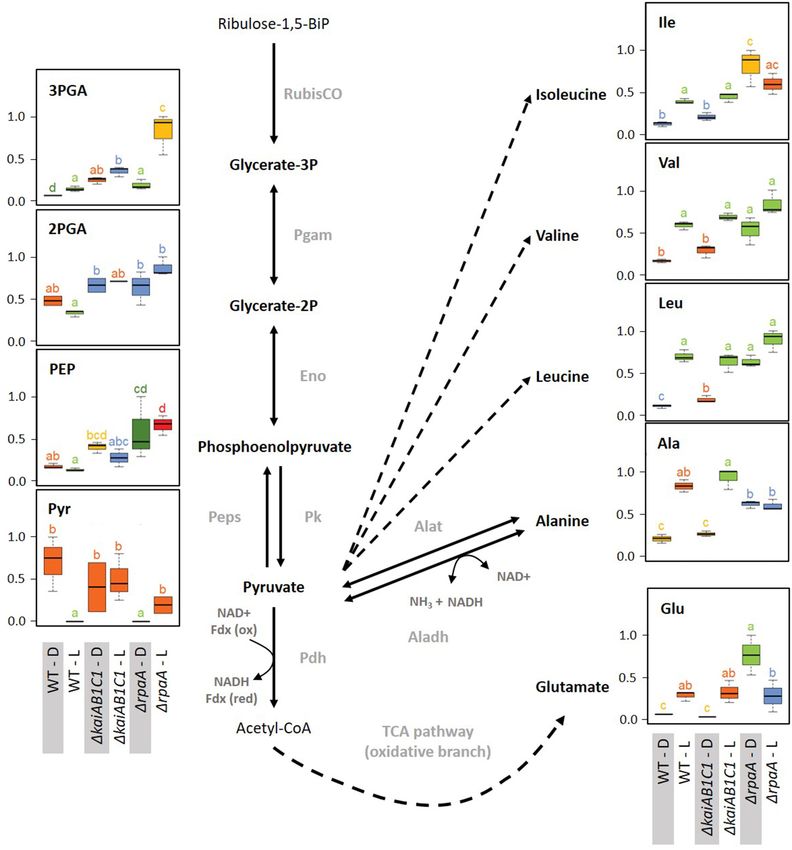
Scheurer et al.                                                                                                      Synechocystis Diurnal Metabolism

INTRODUCTION                                                                 response regulator gene rpaA, caused defects in cell viability in
                                                                             a 12-h L/12-h D cycle, especially under mixotrophic conditions.
Most organisms on Earth experience daily environmental                       Furthermore, in complete D, neither mutant strain was able to
changes. Similar to eukaryotic organisms, photosynthetic                     grow heterotrophically, whereas wild-type growth was slow but
cyanobacteria evolved a circadian clock system to respond                    observable (Dörrich et al., 2014; Köbler et al., 2018). Surprisingly,
to predictable fluctuations of light (L) and darkness (D) in                 DNA microarray analyses of both mutant strains demonstrated
a day-night cycle. The freshwater obligate photoautotrophic                  a considerable difference in their transcriptome responses to a
cyanobacterium Synechococcus elongatus PCC 7942 is a model                   switch from D to L. The overlap in the transcriptional responses
strain used in cyanobacterial circadian research (Cohen                      between the mutants was only 50% in studies performed
and Golden, 2015). Research based on this cyanobacterium                     under identical conditions with a similar microarray design
established the proteins KaiA, KaiB, and KaiC as the core                    (Dörrich et al., 2014; Köbler et al., 2018). The overlap in the
oscillators of the clock system (Ishiura et al., 1998; Iwasaki et al.,       transcriptional changes contained mRNAs encoding regulatory
1999). KaiC performs autokinase, autophosphatase and ATPase                  proteins, such as ribonuclease E (rne), phytochrome 1 (cph1),
functions that are modulated by interaction with KaiA and                    and the sigma factor SigE (sigE). Furthermore, the 1kaiAB1C1
KaiB. The rhythmic phosphorylation pattern of KaiC functions                 and 1rpaA mutations affected mRNAs of both gnd encoding
as a marker of the clock phase and controls rhythmic gene                    the 6-phosphogluconate dehydrogenase and talB encoding the
expression. To transfer time information to cellular functions,              transaldolase. These enzymes are a part of the oxidative
the oscillator is linked to a two-component regulatory system                pentose phosphate pathway (OPPP), which is activated during
consisting of the histidine kinase SasA and the DNA-binding                  the night and converts glucose-6-phosphate (glucose-6P) into
response regulator RpaA (Gutu and O’Shea, 2013). During                      pentose- and other sugar phosphates, thereby providing NADPH
the day, KaiC is progressively phosphorylated. In its highly                 reduction equivalents (Makowka et al., 2020). In contrast to
phosphorylated state, KaiC activates SasA autophosphorylation                Gnd, TalB is also active in the Calvin-Benson-Bassham (CBB)
activity, resulting in the subsequent phosphorylation of RpaA. In            cycle during the L phase. In addition to the common effects
Synechococcus elongatus PCC 7942, phosphorylated RpaA acts as                of the two mutants, the 1rpaA mutant activates in L the
a repressor of dawn-peaking genes and activator of dusk-peaking              transcription of many genes known to be involved in acclimation
genes, and the deletion of rpaA leads to the arrest of cells in a            to low inorganic carbon (Ci ) concentrations, i.e., bicarbonate
dawn-like state (Markson et al., 2013). Although mutations in                and CO2 . In D, in 1rpaA, but not 1kaiAB1C1, we observed a
the KaiABC circadian oscillator do not strongly impair the L/D               decreased transcript accumulation of two enzymes (PhaC/PhaE)
growth of Synechococcus elongatus PCC 7942, the 1rpaA strain is              involved in NADPH-consuming synthesis (via acetoacetyl-CoA
unable to grow in a L/D cycle because it loses viability in D. The           reductase PhaB) of the storage compound polyhydroxybutyrate
described phenotypes of the Synechococcus rpaA mutant strain                 (PHB), which is produced from glycogen under unbalanced
include imbalances in redox regulation and the accumulation                  nutrient conditions in response to nitrogen starvation (Koch
of carbon storage compounds (Diamond et al., 2017; Puszynska                 et al., 2019, 2020a). Werner et al. (2019) performed very detailed
and O’Shea, 2017).                                                           metabolite profiling during a sinusoidal diurnal cycle with a
   Synechocystis sp. PCC 6803 (hereafter Synechocystis) is another           light intensity peak in the middle of the day. These authors
frequently used model strain that, in contrast to Synechococcus              found highly concerted oscillations of metabolites across the
elongatus PCC 7942, can use glucose for mixotrophic and                      cycle, verifying that Synechocystis performs carbon fixation and
heterotrophic growth and can tolerate high salinities (Rippka                protein and nucleotide synthesis during the day. Surprisingly,
et al., 1979; Kirsch et al., 2019). It contains the KaiA, KaiB1,             the authors reported a sharp oscillation in the amount of
and KaiC1 proteins with high similarity to the Synechococcus                 insoluble carbohydrates at approximately the L-to-D switch.
oscillator proteins. Moreover, the Synechocystis genome encodes              Cyanobacteria store fixed carbon mainly as glycogen, which is
two additional copies of the kaiC (kaiC2 and kaiC3) and kaiB                 then degraded at night using OPPP. Further glycolytic routes,
(kaiB2 and kaiB3) genes (Wiegard et al., 2013). Köbler et al.                including the Entner-Douderoff (ED) pathway, which branches
(2018) showed that the homologous SasA-RpaA two-component                    off the OPPP, and the Embden-Meyerhof-Parnas (EMP) pathway,
system of Synechocystis interacts only with KaiC1 but not KaiC2              have been identified (Chen et al., 2016).
or KaiC3. This specificity of the SasA-RpaA system for KaiC1                     The current study aims to investigate the role of the
suggests that the additional Kai components of Synechocystis may             main homologs of circadian clock proteins on the L and D
use different output elements (Figure 1).                                    metabolism in Synechocystis. Though Synechocystis mutants
   True circadian oscillations, which continue after shifting                lacking the kaiAB1C1 operon or the rpaA gene show a
the cells into a constant environment, may not be active in                  similar growth defect in a L/D cycle and in heterotrophic
Synechocystis, but robust transcriptional rhythmicity in a diurnal           growth in D, previous transcriptomic analyses suggest major
light regime has been described (Beck et al., 2014). Diurnal                 differences in gene expression between these two mutants.
oscillations depend on daily recurring external stimuli sustaining           To better understand the specific impact of the putative
a 24 h period. While a Synechocystis 1kaiC3 mutant shows                     KaiA1BC1 oscillator in comparison to the output regulator
no growth defect in a L/D cycle, the deletion of the kaiB2C2                 RpaA on metabolism, we measured primary metabolites
operon is lethal even in constant light (Dörrich et al., 2014).              in the middle of the D and L phases by targeted and
In contrast, the deletion of the kaiAB1C1 gene cluster and the               untargeted metabolic profiling. These are the same time

Frontiers in Plant Science | www.frontiersin.org                         2                                      June 2021 | Volume 12 | Article 675227
Scheurer et al.                                                                                                                   Synechocystis Diurnal Metabolism

 FIGURE 1 | Model of the Synechocystis Kai system. In Synechocystis, the KaiAB1C1 system is the closest homolog to the well-known circadian clock system from
 Synechococcus elongatus PCC 7942. The output signaling response of KaiC1 relies on the SasA-RpaA two-component system. The transcription factor RpaA
 controls gene expression in L and D conditions. RpaA can interact with other regulators (e.g., PixG and RpaB) and partially targets the same genes as the
 transcription factor RpaB. The KaiAB1C1 complex is intertwined with the non-standard KaiB3C3 system in Synechocystis, but the direction of signaling between the
 two systems remains unclear. The red circles represent phosphorylation sites.

points which were investigated in the previous transcriptome                        RNA Isolation and Northern Blot
analyses of the 1kaiAB1C1 and 1rpaA mutants. The                                    Hybridization
identified differences in the metabolic responses clearly                           The RNA isolation was performed following Pinto et al. (2009).
indicate that mainly the lack of the RpaA regulator impacts                         For sampling, 20 ml of culture were filtered through a Supor-
primary metabolism and the metabolic switch between                                 800 membrane filter (0.8 mm, Pall), vortexed in 1.6 ml PGTX
L and D growth.                                                                     for 30 s and immediately frozen in liquid nitrogen. The samples
                                                                                    were stored at −80◦ C. After thawing the samples on ice, the
                                                                                    samples were heated at 95◦ C for 5 min. The lysis was supported
MATERIALS AND METHODS                                                               by vortexing during the incubation. After cooling the samples on
                                                                                    ice for 5 min, the samples were incubated at room temperature
Cyanobacterial Strains, Culture, and                                                (RT) for 10 min. Then, 200 µl of cold bromchloropropane (BCP)
Sampling Conditions                                                                 were added, vortexed for 30 s and stored at RT for 15 min. Next,
For standard cultivation, the Synechocystis sp. PCC 6803                            the phases were separated by centrifugation at 3,100 ×g for
wild-type (PCC-M, resequenced, Trautmann et al., 2012) and                          15 min at 4◦ C. The aqueous phase was transferred into a new
mutant strains were grown photoautotrophically under constant                       reaction tube, and the reaction was repeated once more with 1
illumination with 75 µmol photons m−2 s−1 white light at                            volume of cold BCP. The samples were centrifuged at 21,130
30◦ C in BG11 medium (Rippka et al., 1979) supplemented with                        ×g for 15 min at 4◦ C, followed by precipitation with 1 volume
10 mM TES buffer (pH 8) in flasks. For the L/D experiments, the                     of isopropanol and storage of the sample overnight at −20◦ C.
precultures were grown in constant light and diluted to OD750                       The samples were centrifuged at 21,130 ×g for 1 h at 4◦ C, the
0.4–0.6 before transfer to alternating 12-h L/12-h D cycles with                    resulting pellet was washed with 75% EtOH, and centrifugation
75 µmol photons m−2 s−1 during the L phase. Depending on the                        was repeated for 10 min. The pellet was air-dried for 15 min and
experimental setup, air was supplemented with CO2 (1%, v/v),                        resuspended in 40 µl ddH2 O.
and illumination was increased to 150 µmol photons m−2 s−1                             To separate the RNA, 10 µg were used for electrophoresis
after the liquid cultures reached an OD750 of ∼1. The wild-type                     on a 1.5% denaturing agarose-formaldehyde gel. The gel
and mutant strains were cultured in triplicate. The samples were                    was blotted onto a Roti-Nylon plus membrane (Roth). The
collected in the middle of the first D phase and the following L                    DNA fragment used for probe generation was amplified
phase 5.5 h after each transition in the exponential growth phase                   from wild-type DNA using the oligonucleotides sbtA-
                                                                                            ′                                                      ′
if not described otherwise.                                                         fw (5 CAATCCCCATAAATTTCAACCAAGGAGAC 3 )

Frontiers in Plant Science | www.frontiersin.org                                3                                            June 2021 | Volume 12 | Article 675227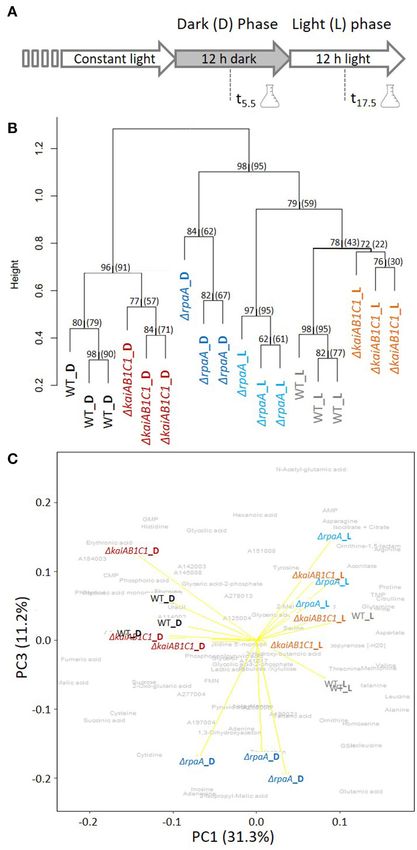
Scheurer et al.                                                                                                                 Synechocystis Diurnal Metabolism

                         ′
and sbtA-rev (5 TAATACGACTCACTATAGGGAGAGC-                                microcentrifuge. The top liquid phase, ∼700 µl, was dried by
                                   ′
CAAGGGCGGCAATAACCATC 3 ). The probe was produced                          vacuum centrifugation overnight in 1.5-mL microcentrifugation
with a Rediprime II labeling kit (GE Healthcare). Hybridization           tubes and stored at −20◦ C.
was performed as described by Dienst et al. (2008), and the signals           The chemical derivatization for the GC analysis, GC–MS-
were detected using a Typhoon FLA 9500 (GE Healthcare).                   based metabolite profiling and retention index standardization
                                                                          were performed as described by Erban et al. (2020) using
Immunoblot Analysis of RubisCO                                            electron impact ionization time-of-flight mass spectrometry
The wild-type and mutant cultures of Synechocystis were diluted           (GC/EI-TOF–MS). The GC/EI-TOF–MS system was an Agilent
to OD750 0.6 and cultivated in an L/D cycle. Five milliliter of           6890N24 (Agilent Technologies, Waldbronn, Germany) gas
WT and mutant cultures of Synechocystis were harvested by                 chromatograph hyphenated to a LECO Pegasus III time-
centrifugation at 4,000 ×g for 2 min at 4◦ C. After the pellet was        of-flight mass spectrometer (LECO Instrumente GmbH,
resuspended in PBS buffer (8.6 mM Na2 PO4 , 1.8 mM KH2 PO4 ,              Mönchengladbach, Germany). The chromatograms were
137 mM NaCl, 2.7 mM KCl, pH 7.5), the cells were disrupted                acquired, and the baseline was corrected by ChromaTOF
in a cell mill using glass beads. The crude extract was obtained          software (LECO Instrumente GmbH, Mönchengladbach,
by centrifugation at 500 ×g for 5 min at 4◦ C, and different              Germany). The metabolites were annotated by manual
protein amounts of the crude extract were subjected to SDS-               supervision using TagFinder software (Luedemann et al., 2008),
PAGE. The immunodetection was performed using anti-RbcL                   NIST2017 version 2.31 and the mass spectral and retention time
(Agrisera, Sweden) and secondary anti-rabbit (Thermo Fisher               index (RI) reference data of the Golm Metabolome Database
Scientific Inc., USA) antibodies.                                         (Kopka et al., 2005). GC/EI-TOF–MS was normalized to the
                                                                          internal standard 13 C6 -sorbitol, OD750 of the culture and volume
Quantification of the PHB Content                                         of the sample.
The intracellular PHB content was measured as described by
Taroncher-Oldenburg et al. (2000). The wild-type and mutant
cultures were adjusted to OD750 0.2 and then grown in L/D cycles          Targeted Metabolome Analysis by Liquid
supplemented with CO2 as described above. The samples were                Chromatography-Mass Spectrometry
collected in the 7th L/D cycle 1 h before the L or D transitions.
Approximately 15–35 ml of cell culture were harvested by                  (LC-MS)
centrifugation (4,000 ×g, 10 min, 4◦ C), washed once with H2 O            The sampling of the cells was performed precisely as described
and dried overnight at 85◦ C. To break the cells and convert PHB,         in the previous paragraph. Low molecular mass compounds
the pellet was boiled in 1 ml concentrated H2 SO4 for 1 h. Then,          were extracted from the cells with 2 ml of ethanol (80%, HPLC
100 µl were transferred to 900 µl of 0.014 M H2 SO4 . To pellet           grade, Roth, Germany) at 65◦ C for 2 h. One microgram of
the cell debris, the sample was centrifuged at 17,000 ×g for 5 min        carnitine was added to each sample as an internal standard to
before 500 µl of the supernatant were diluted in 500 µl of 0.014 M        correct for losses during the extraction and sample preparation.
H2 SO4 . The centrifugation was repeated, and the supernatant             After centrifugation, the supernatants were collected and freeze-
was analyzed via Acquity UPLC BEH (WATERS) with a reversed-               dried. The dry extracts were dissolved in 1 ml MS-grade
phase C18 column (Eurosphere II, 100 by 2.1 mm, Knauer). The              water and filtered through 0.2 µm filters (Omnifix R -F, Braun,
separation was performed using increasing concentrations of               Germany). The cleared supernatants were analyzed using a high-
acetonitrile in 0.1% formic acid. Commercially available crotonic         performance liquid chromatograph mass spectrometer system
acid was used as a standard in parallel with a conversion ratio of        (LCMS-8050, Shimadzu, Japan). In brief, 1 µl of each extract
0.893 (Koch et al., 2019).                                                was separated on a pentafluorophenylpropyl (PFPP) column
                                                                          (Supelco Discovery HS FS, 3 µm, 150 × 2.1 mm) with a
Non-targeted Metabolome Profiling                                         mobile phase containing 0.1% formic acid. The compounds were
                                                                          eluted at a rate of 0.25 ml min-1 using the following gradient:
Analysis by Gas Chromatography-Mass
                                                                          1 min 0.1% formic acid, 95% distilled water, 5% acetonitrile,
Spectrometry (GC-MS)                                                      within 15 min linear gradient to 0.1% formic acid, 5% distilled
The metabolome profiling of the metabolite fraction enriched              water, 95% acetonitrile, 10 min 0.1% formic acid, 5% distilled
with primary metabolites was performed as previously described            water, and 95% acetonitrile. Aliquots were continuously injected
(Kopka et al., 2017). Twenty milliliter of the cultures were              into the MS/MS part and ionized via electrospray ionization
sampled by fast filtration onto 47 mm diameter glass microfiber           (ESI). The compounds were identified and quantified using the
filters of a 1.2 µm pore size (GE Healthcare, Little Chalfont,            multiple reaction monitoring (MRM) values given in the LC-
England), followed by immediate shock freezing. The complete              MS/MS method package and the LabSolutions software package
process was < 30 s. Samples equivalent to ∼20 ml of OD750                 (Shimadzu, Japan). Defined standard mixes of amino acids and
= 0.7–1.0 cultures were extracted for 15 min at 37◦ C by                  organic acids (usually 1 ng of the specific metabolite was injected)
1 ml methanol:chloroform:diethylamine 2.5:1.0:1.0 (v/v/v). The            were analyzed in the same run to calculate the absolute contents
extraction mixture contained 0.02 mgml−1 13 C6 -sorbitol, which           per sample. Then, the metabolite levels were normalized to
was used as an internal standard (Erban et al., 2020). A polar
liquid phase was obtained by adding 400 µl distilled water and
centrifuging for 5 min at 14,000 rpm in an Eppendorf 5,417                1 Available   online at: http://chemdata.nist.gov/.

Frontiers in Plant Science | www.frontiersin.org                      4                                                 June 2021 | Volume 12 | Article 675227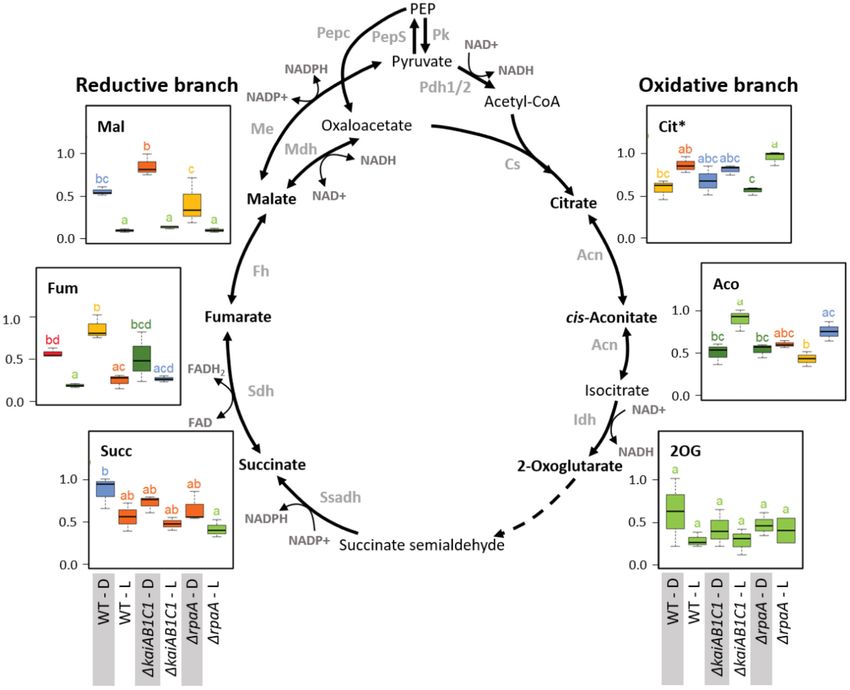
Scheurer et al.                                                                                                 Synechocystis Diurnal Metabolism

the detected amount of the internal standard carnitine, sample           autoscaled. For the statistical data analyses, the data matrices
volume and OD750 .                                                       were log10 -transformed after the missing data replacement by a
                                                                         small value, i.e., 10−9 . The statistical analyses were performed
NAD(P) and NAD(P)H Analyses                                              using the log-transformed data. The relative concentration
NAD(P) and NAD(P)H were extracted from ∼8 ml of OD750                    changes are reported as fold changes (FCs). The FCs of
= 0.7–1.0 cultures sampled onto 47 mm diameter glass                     the metabolites that were detectable under one condition
microfiber filters of a 1.2 µm pore size (GE Healthcare, Little          and undetectable under the compared condition, e.g., FCs
Chalfont, England), followed by immediate shock freezing. The            comparing L to D responses or FCs comparing mutant to wild
quantification of NAD, NADP and NADPH was performed as                   type (Supplementary Tables 1, 2), are reported. The significance
previously described using enzymatic cycling assays (Zhang et al.,       analyses were replaced by presence and absence calls, and the FCs
2020). The samples used for the NAD and NADP analyses were               were scored as either significant increases or decreases.
extracted by 500 µL extraction solution containing 0.1 M HClO4              For the analyses comparing the data to previous studies, the
in 50% ethanol; the NADPH extraction was performed by 0.1 M              data were merged according to the technology platform, namely,
KOH in 50% ethanol (Tamoi et al., 2005). The samples were                GC-MS profiling and LC-MS quantification. Merging across
thoroughly vortexed with intermittent sonication in an ice bath          technology platforms was only performed if data from the same
3 times for 45 s each, followed by a final incubation on ice for         technology platform were not available. The replicate data were
10 min. After centrifugation for 10 min at 14,000 rpm at 4◦ C, 100       averaged per study maximum-scaled, and the missing values were
µL of extract were transferred to a microcentrifuge vial and heat        replaced by the k-NN method. The final data matrices were log
inactivated at 95◦ C for 2 min. Then, the samples were cooled on         transformed and autoscaled prior to the subsequent PCA.
ice and neutralized either by 100 µL of 0.1 M KOH in 0.2 M Tris
HCl pH 8.4 for the NAD and NADP quantitation or 100 µL of
0.1 HClO4 in 0.2 M Tris HCl pH 8.4 for the NADPH analyses.               RESULTS
The quantitation was performed using 25 or 40 µL volumes
of the neutralized extracts used for the previously described
                                                                         CO2 Availability Can Compensate for the
cycling assays (Zhang et al., 2020). Care was taken to adjust the        Growth Defects of 1kaiAB1C1 and 1rpaA
samples and quantitative calibration standards to identical final        Mutants in L/D Cycles
ethanol concentrations (Supplementary Table 3). In this study,           Previous analyses revealed the essential role of the clock
the quantities of NAD, NADP and NADPH in the biological                  homologs KaiAB1C1 and RpaA in the viability of Synechocystis in
samples were sufficient for the quantitation. NADH quantitation          L/D cycles and in the D under heterotrophic conditions (Dörrich
was attempted but failed due to low concentrations in the                et al., 2014; Köbler et al., 2018). Although the phenotypes of the
biological samples. The analyses were biologically replicated            corresponding mutants were very similar, microarray analyses
using 3 independent cultures. The cultures were probed by 1              revealed substantial differences in gene expression between these
(NADPH) or 2 (NAD and NADP) analytical repeats, i.e., parallel           strains, such as an accelerated Ci response that was detected
samplings from the same culture. The quantitative data of the            only in the 1rpaA mutant (Köbler et al., 2018). To determine
analytical repeats were averaged prior to the statistical analysis       whether Ci -responsive genes are still upregulated in 1rpaA even
of the 3 independent biological replications.                            under high CO2 conditions, we analyzed the expression of sbtA,
                                                                         which encodes a sodium-dependent bicarbonate transporter.
Metabolomic Data Analysis                                                Using Northern blot analysis, we did not detect a difference
All metabolomics data analyses, the hierarchical cluster                 in the sbtA mRNA levels between the wild-type and mutant
analysis (HCA) by Pearson’s correlation and average linkage,             strains under elevated CO2 concentrations, suggesting that Ci -
the principal component analysis (PCA), the two factorial                responsive genes are not a direct target of the RpaA transcription
analyses of variance (ANOVA), the statistical testing, e.g.,             factor (Supplementary Figure 1). Furthermore, we examined the
Tukey tests, and the data visualization, were performed                  response of the mutant strains to CO2 availability by growing
using RStudio statistical programming2 and the program                   cells under low (ambient) and high CO2 (1%) conditions in liquid
packages “impute,” “multcompView,” “ggplot2,” “eulerr,”                  cultures (Figure 2). Similar to previous studies in which viability
and      “https://github.com/MSeidelFed/RandodiStats_package.            assays were performed using agar plates, the 1kaiAB1C1 and
git.” The bootstrapping analysis of the HCA tree was performed           1rpaA strains showed a pronounced growth defect in L/D cycles
using the “pvclust” R package, and the node confidence                   (Figure 2A). The curves also revealed that growth arrest mainly
was evaluated by “approximately unbiased” and “ordinary”                 appeared when the mutant cultures left the exponential growth
bootstrap probabilities.                                                 phase (Figure 2A). As an organic carbon source, glucose had an
    The relative quantification data from the GC-MS profiling            additional inhibitory effect on the viability of the mutant cells
analyses and quantitative data from the LC-MS analyses were              (Dörrich et al., 2014; Köbler et al., 2018), whereas an increase
maximum scaled per metabolite prior to further analyses. For             in CO2 availability could largely align the growth of the mutant
the global data analyses, the missing values in the data set             cultures with the wild-type cultures in an L/D cycle (Figure 2B).
were replaced by the k-nearest neighbors algorithm (k-NN) and            Our previous viability analyses under mixotrophic/heterotrophic
                                                                         conditions and the growth assays under elevated CO2 availability
2 Available online   at: https://rstudio.com/.                           in this study indicate that defects in the Synechocystis Kai system

Frontiers in Plant Science | www.frontiersin.org                     5                                     June 2021 | Volume 12 | Article 675227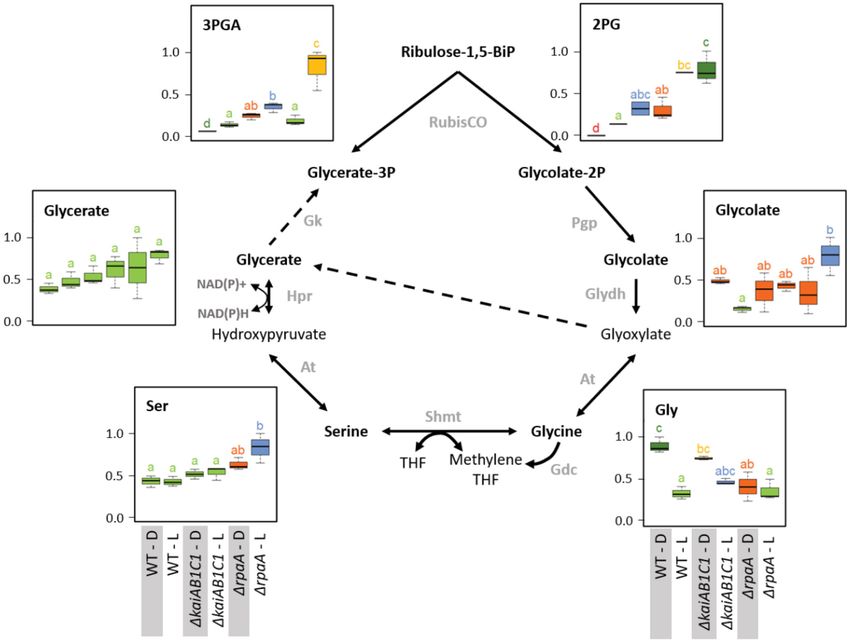
Scheurer et al.                                                                                                                  Synechocystis Diurnal Metabolism

 FIGURE 2 | Growth of Synechocystis mutants. Wild type (WT), 1rpaA, and 1kaiAB1C1 deletion mutants were grown in a 12-h L/12-h D cycle with ambient air (A)
 and 1% CO2 (B). The light intensity during cultivation was 75 µmol photons m−2 s−1, which was increased to 150 µmol photons m−2 s−1 in (B) after the cultures
 reached an OD750 of ∼1. Each point represents the mean of three biological replicates (± standard deviation).

led to an imbalance in carbon acquisition and changes in central                    et al., 2020; Koch et al., 2020b). Therefore, the transcriptomic
carbon metabolism.                                                                  changes might not fully represent the effects of KaiAB1C1
                                                                                    and RpaA deficiency for cellular night- and daytime functions,
PHB Accumulation Is Reduced in                                                      which led us to analyze the metabolic changes in the two
Synechocystis 6803 1kaiAB1C1 and 1rpaA                                              corresponding mutants.
Mutants
In addition to the altered Ci acclimation response, the expression
                                                                                    Global Metabolic Analysis of the 1rpaA
of two genes encoding PHB synthase subunits (phaC and                               and 1kaiAB1C1 Mutants After L/D
phaE) was highly decreased in the 1rpaA strain in D                                 Entrainment
(Köbler et al., 2018). A similar tendency in phaCE transcript                       The previous investigations and data presented above suggest
accumulation was also detected in a microarray analysis of                          that the KaiAB1C1 proteins along with the RpaA regulator
the 1kaiAB1C1 strain; this tendency was less pronounced and                         impact primary metabolism in Synechocystis and growth
did not match our significance criteria (Dörrich et al., 2014).                     specifically under low Ci conditions in an L/D cycle (Figure 2A).
In the previous microarray analyses, the cells were collected                       Therefore, the metabolome of the two mutants was analyzed after
during the exponential growth phase and were grown under                            an L-to-D transition under ambient CO2 supply. Independent,
low CO2 conditions, where PHB synthesis is very low, and                            exponentially grown precultures in ambient air were adjusted
the amount of this storage compound was not measurable.                             to similar optical densities of ∼0.6 and sampled either in the
Therefore, we evaluated the impact of KaiAB1C1 and RpaA                             middle of the first D phase at 5.5 h of the diurnal cycle or in
on PHB production under high CO2 conditions during the                              the middle of the following L phase at 17.5 h (Figure 4A). The
stationary growth phase. Under these conditions, the 1kaiAB1C1                      mutants and wild type exhibited similar growth rates during this
and 1rpaA strains did not show growth arrest in an L/D cycle                        precultivation under continuous L (Supplementary Figure 2).
and exhibited only a slightly lower growth rate than the wild type                  The time points were selected to avoid the expected rapid changes
(Figure 2B). Consistent with the lowered pha gene expression,                       in metabolism directly after illumination shifts (Werner et al.,
both strains showed a strong reduction in PHB accumulation in                       2019), to minimize the secondary effects of the growth arrest of
the D and L phases, suggesting that the high CO2 availability                       the mutants in L/D cycles and to correlate the metabolic data of
was unable to compensate for the defect in PHB production                           this study to previously reported transcriptomic data (Dörrich
(Figure 3). Cyanobacteria produce PHB mainly under nutrient                         et al., 2014; Köbler et al., 2018) and to metabolic data published
limitation. Furthermore, growth in L/D cycles increases PHB                         for Synechococcus elongatus PCC 7942 (Diamond et al., 2017).
accumulation in comparison to cultivation under continuous                             We analyzed 80 metabolites from central metabolism by
illumination (Panda et al., 2006; Koch et al., 2020a). This indicates               relative quantification of a metabolite fraction enriched for
a diurnal regulation of PHB synthesis and a role of the D phase                     primary metabolites via gas chromatography-mass spectrometry
for its accumulation. Though the physiological role of PHB is                       (GC-MS)-based profiling or absolute quantification via
still largely unclear, recent studies suggest a function of PHB                     LC-MS (Supplementary Table 1). In addition to the identified
as an electron sink during unbalanced conditions and as an                          metabolite information, the non-targeted metabolite profiling
additional carbon storage to prevent a metabolic spillover (Koch                    yielded a set of yet unidentified metabolites and mass features that
and Forchhammer, 2021). This complex relationship links PHB                         contributed to the global analyses of the metabolic phenotypes
synthesis and utilization to central metabolic pathways (Ciebiada                   in this study. The hierarchical cluster and principal component

Frontiers in Plant Science | www.frontiersin.org                                6                                           June 2021 | Volume 12 | Article 675227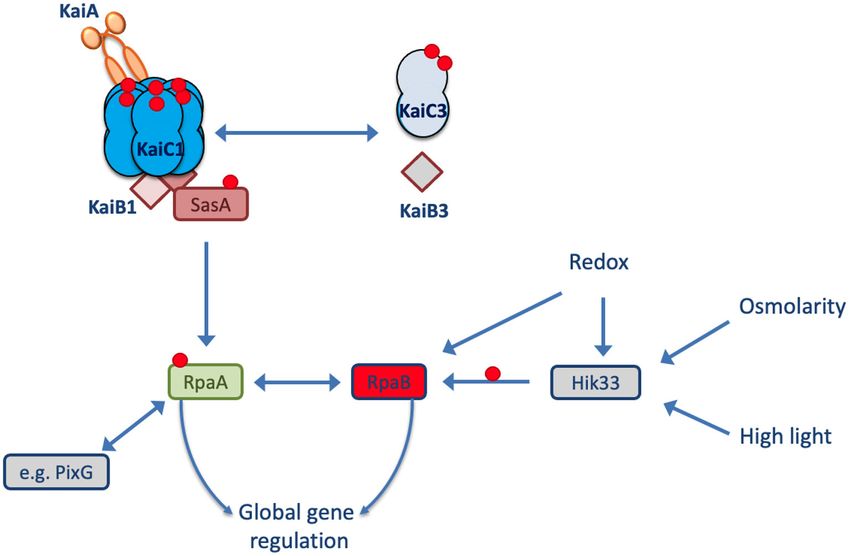
Scheurer et al. Synechocystis Diurnal Metabolism
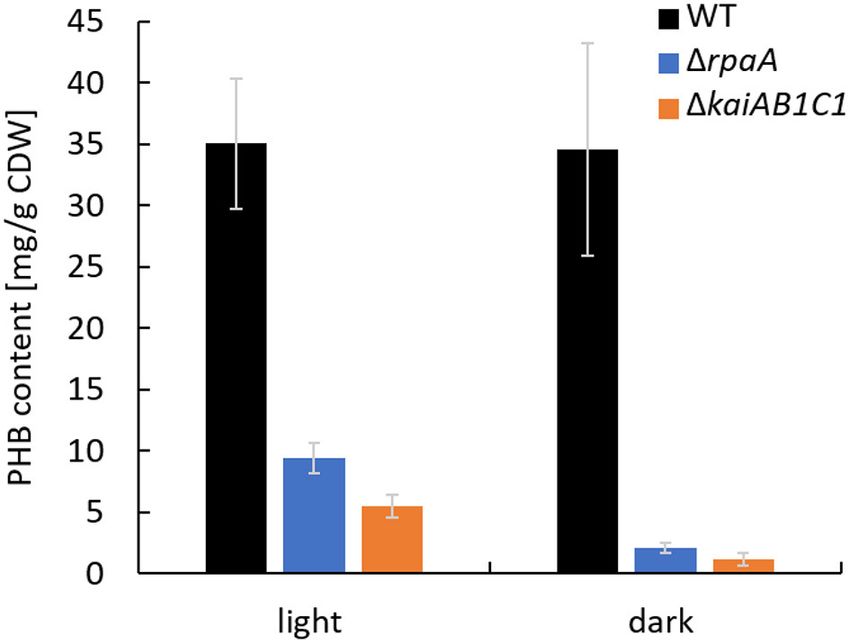
FIGURE 3 | The 1rpaA and 1kaiAB1C1 strains show lower PHB
accumulation at high CO2 concentrations. PHB was quantified in cells
cultivated in a 12-h L/12-h D cycle and 1% CO2 . The samples used for the
PHB measurements were collected in the stationary phase at an OD750 of ∼7
in the L and D phases of the 7th L/D cycle 1 h before switching. Each bar
displays the mean of three technical replicates (± standard deviation).
analyses (PCA) indicated that the switch between D and L was the
major experimental factor affecting the metabolite phenotypes
(Figure 4B) with a contribution of 31.3% to the total variance
according to PC1 (Figure 4C, Supplementary Figure 3). The
wild type and two mutants clustered with high bootstrapping
confidence of their independent replicate profiles (Figure 4B).
The metabolic profiles of the 1kaiAB1C1 and 1rpaA mutants
differed from those of the wild type in the D and L phases
(Figures 4B,C). However, the metabolic phenotype of the 1rpaA
mutant differed more, especially in D, when the deviations were
stronger and amounted to a distinct PC3. PC3 differentiated
1rpaA D metabolism from all other sample profiles by
11.2% of the total variance (Figure 4C). The D metabolism
of 1rpaA appeared to be between that of the wild type D
and L states (Figure 4C) with a tendency toward wild type
in L (Figure 4B).
Molecular studies have suggested that the 1rpaA mutant
of Synechococcus elongatus PCC 7942 may be arrested in a FIGURE 4 | Global analysis of the metabolic L/D switch in the 1kaiAB1C1 and
dawn-like expression state (Markson et al., 2013). In wild- 1rpaA mutants. (A) Design of the two-factorial entrainment experiment.
type Synechocystis cells, a set of metabolites accumulates Wild-type and mutant cells, i.e., the first experimental factor (genotype), were
precultivated under continuous light, divided into independent cultures of
rapidly following the onset of illumination after dawn and OD750 = 0.6 in ambient air, and sampled in the middle of the first 12-h D
declines in the course of the L phase, which may indicate phase and first 12- h L phase after entrainment, i.e., the second experimental
a morning state of metabolism (Werner et al., 2019). These factor (illumination). Three independent replicate cultures in each phase were
“morning metabolites” include malate, fumarate, amino acids, analyzed by a quantitative targeted LC-MS analysis and non-targeted GC-MS
metabolome profiling of the primary metabolome. (B) Hierarchical cluster
serine, valine, isoleucine, glutamine, aspartate, arginine, and
analysis (HCA) of mutant and wild-type metabolomes. Annotated LC- and
nucleotide-related metabolites, such as cytidine, cytidine GC-MS metabolite data separately maximum scaled and then combined,
monophosphate (CMP), cytidine triphosphate (CTP), uridine log-transformed, autoscaled, and clustered using Pearson’s correlation
monophosphate (UMP), guanosine monophosphate (GMP), distance metric and average linkage. HCA includes a scale of the node height
guanosine triphosphate (GTP), hypoxanthine, inosine, and and bootstrap-support analysis by 1,000 iterations. The values represent the
“approximately unbiased” bootstrap probability, and in brackets, the
inosine monophosphate (IMP) (Werner et al., 2019). Although
conventional bootstrap probability obtained using the “pvclust” R package is
our study investigated the metabolome in the middle of the shown. Values of 100 represent the highest node probability. (C) Principal
L phase, two “morning metabolites,” namely, aspartate and component analysis (PCA) of the same data. PC1 and PC3 demonstrate the
serine, significantly accumulated (Tukey test, P < 0.05) in the (Continued)
Frontiers in Plant Science | www.frontiersin.org 7 June 2021 | Volume 12 | Article 675227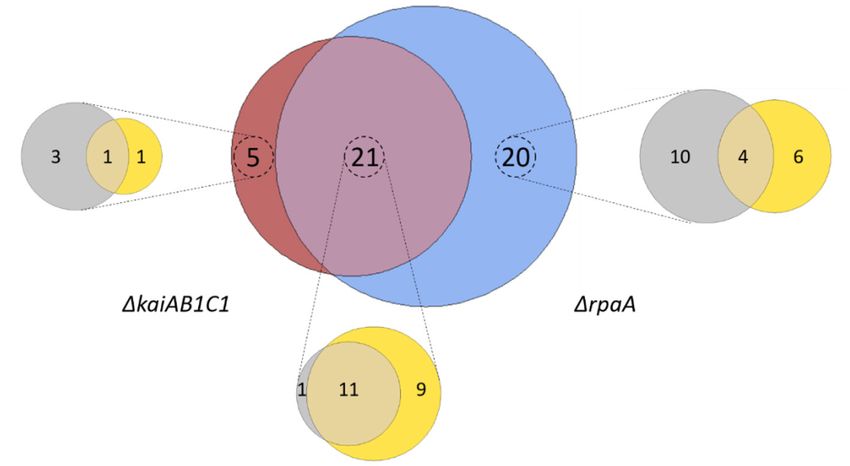
Scheurer et al.                                                                                                             Synechocystis Diurnal Metabolism

                                                                                     supported the hypothesis that the KaiAB1C1 system contributes
                                                                                     to the diurnal control of central metabolism mostly via RpaA-
 FIGURE 4 | variance contribution of illumination (PC1) and the 1rpaA samples
 collected in the D phase (PC3) to the metabolomics data set. Yellow arrows
                                                                                     mediated output signaling (Figure 1). Most of the common
 represent the score biplot of the samples. The gray underlay indicates the          metabolic defects were apparent in both phases (12), except for
 loading contributions of the metabolites. A corresponding supplement                one defect, which was limited to the L phase (9). Deviations
 contains a biplot of PC1 and PC2 and a scree plot of the variance represented       specific to only one mutant suggested a small RpaA-independent
 by the top 10 PCs (Supplementary Figure 3).
                                                                                     metabolic signaling component in the KaiAB1C1 system, with
                                                                                     three metabolic changes in D, one metabolic change in L and
                                                                                     one metabolic change in both. In contrast, the KaiAB1C1-
                                                                                     independent changes in the 1rpaA mutant (20) exhibited
illuminated 1rpaA mutant of Synechocystis, whereas many
                                                                                     a preference for RpaA-specific metabolic defects in D (10)
more metabolites shifted to higher values in the wild-type cells.
                                                                                     (Figure 6), which is consistent with the closer clustering of
In contrast, isoleucine and valine significantly accumulated
                                                                                     1rpaA D with the L samples of all strains (see Figure 4). The
during D in 1rpaA (Figure 5). For a global comparison of
                                                                                     larger impact of the RpaA deficiency may be explained by
our metabolite profiles and a previous diurnal characterization
                                                                                     its functionality as a transcription factor with partly retained
of Synechocystis central metabolism (Werner et al., 2019),
                                                                                     functions in the absence of Kai-based control and the KaiAB1C1-
we aligned the 47 commonly monitored metabolites. The
                                                                                     independent additional functions of RpaA that are established
PCA of the combined and separately scaled data sets revealed
                                                                                     via protein-protein interactions (Köbler et al., 2018). For
PC1, which had a high percentage of shared total variance,
                                                                                     example, RpaA interacts with RpaB, which is the transcriptional
i.e., 45.8%. PC1 separated the wild-type L metabolomes
                                                                                     regulator responding to environmental changes, including L/D
from the D metabolomes of the two studies in a non-linear
                                                                                     transitions, via concomitant redox regulation (Riediger et al.,
manner (Supplementary Figure 4). Colinearity indicated high
                                                                                     2019) (Figure 1).
agreement in the L/D-induced metabolome changes between
                                                                                         The set of 46 mutant-dependent metabolites included
the two studies. However, PC2, which accounted for 16.8% of
                                                                                     unidentified compounds and metabolites with small but
the total variance, rendered a more precise alignment, and a
                                                                                     significant pool size changes (Supplementary Table 1). To focus
comparison of the sampled time points between the two studies
                                                                                     our data analysis, for the following analysis, we selected only
is impossible. Further comparative meta-analysis was abandoned
                                                                                     identified metabolites that were significantly (Tukey test, P ≤
because the studies clearly used different growth conditions. For
                                                                                     0.05) responsive to the L/D change (Figure 5). From this subset,
example, high peaking light intensity at 1,600 µmol photons
                                                                                     we distinguished five groups of L/D-responsive metabolites
m−2 s−1 and high 5% CO2 were applied in a previous study
                                                                                     (L/D groups) according to their relative changes in the wild
(Werner et al., 2019), whereas low light of 50 µmol photons m−2
                                                                                     type compared to the mutant defects. L/D group I contained
s−1 and ambient CO2 were applied in this study.
                                                                                     17 metabolites (mostly amino acids) that accumulated in the
    A global correlation analysis of the metabolites was performed
                                                                                     wild type in L compared to D (Figure 5). A second set of 11
using all mutant and wild-type data in the current study. We
                                                                                     metabolites, i.e., L/D group II, exhibited inverse changes in the
present this analysis as a Pearson’s correlation matrix that
                                                                                     wild type compared to group I and contained metabolites, e.g.,
analyzes the relative concentration changes in all monitored
                                                                                     organic acids, that decreased in L compared to D. Only a small
metabolites (Supplementary Figure 5). This analysis indicates a
                                                                                     set of metabolites from these two groups, namely, arginine,
central group of highly correlated metabolites that contained
                                                                                     aspartate, proline (L/D group I) and malate (L/D group II),
metabolites of lower glycolysis, 3-phosphoglycerate (3PGA),
                                                                                     maintained L/D responsiveness in the mutants. KaiAB1C1 and
2-phosphoglycerate (2PGA), phosphoenolpyruvate (PEP), and
                                                                                     especially the RpaA deficiency attenuated the L/D responsiveness
of photorespiration, 2-phosphoglycolate (2PG), serine and
                                                                                     of a large fraction of L/D-responsive metabolites in both groups.
glycerate. Two additional large groups contained metabolites
                                                                                     Many attenuated changes were shared between the 1rpaA and
that were inversely correlated between the groups but partially
                                                                                     1kaiAB1C1 mutants. However, the 1rpaA mutant clearly had
formed highly correlated subsets within each group. The first
                                                                                     more metabolites with attenuated L/D responsiveness (Figure 5).
group comprised most amino acids and the oxidative (C6-C5)
                                                                                         Furthermore, we discovered additional but rarer metabolite
branch of tricarboxylic acid (TCA) metabolism. The second
                                                                                     response patterns supporting the hypothesis that central
group contained predominantly metabolites of nucleic acid
                                                                                     metabolic responses to a switch between photoautotrophy and
metabolism and the reductive (C4) branch of TCA metabolism
                                                                                     D-induced heterotrophy are all but passive. These metabolic
(Supplementary Figure 5).
                                                                                     responses are enhanced and modulated by KaiAB1C1 and/or
                                                                                     RpaA. Glutamate (L/D group III) represented one of these
1kaiAB1C1 and 1rpaA Mutations                                                        rarer patterns as it accumulated in the wild type in the L
Attenuate Metabolic L/D Responses                                                    phase and had an inverted L/D response only in the 1rpaA
Our study revealed that 46 metabolites, i.e., more than half                         mutant. Similarly, pyruvate and histidine (L/D group IV) were
of all monitored compounds, significantly (Tukey test, P <                           depleted in the wild type in the L and accumulated in the
0.05) differed between the mutants and wild type. A large                            1rpaA mutant (Figure 5). Some metabolites (L/D-group V),
overlap of 21 metabolic changes during the L/D cycle was                             e.g., N-acetyl-glutamate, glutamine, ornithine-1,5-lactam, lysine,
observed between the two mutants (Figure 6). This finding                            citrate/isocitrate, TMP and CMP, even gained significant L/D

Frontiers in Plant Science | www.frontiersin.org                                 8                                     June 2021 | Volume 12 | Article 675227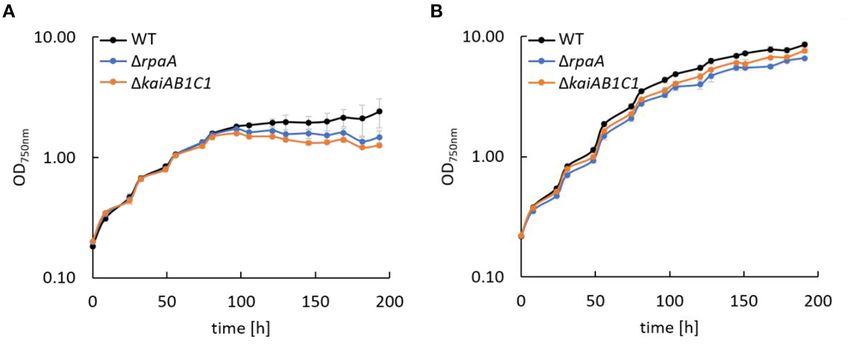
Scheurer et al.                                                                                                                     Synechocystis Diurnal Metabolism

 FIGURE 5 | Relative abundances and fold changes (FC) of metabolite concentrations in the L phase compared to the D phase. The figure includes identified
 metabolites that exhibited significant changes in L metabolism compared to D metabolism (Tukey test P < 0.05). Fold changes are color-coded as follows: significant
 increases, red (>2-FC), light red (
Scheurer et al. Synechocystis Diurnal Metabolism
FIGURE 5 | Supplementary Table 1. The grouping of the metabolites into the L/D response groups (L/D groups) was performed according to the changes in the
wild type (L/D group I-II) and considered inverted (L/D group III-IV) changes in the mutants or emergent changes (L/D group V). Heat map: light yellow, low abundance;
dark yellow, high abundance; gray, undetectable.
FIGURE 6 | Summary of the metabolic changes in the mutants of Synechocystis. Venn diagram analysis of all significant (Tukey test, P < 0.05) metabolic changes
among the set of identified and yet unidentified metabolites. Intersections show significant changes in the metabolite pools shared between the 1kaiAB1C1 (brown)
and 1rpaA (blue) mutants. Zoom-ins show the contribution of the two diurnal phases to the respective sets, D phase (gray) and L phase (yellow). Note the large
overlap between the mutants and the more frequent specific responses of the 1rpaA cells.
responsiveness in one or both mutants (Figure 5). Further that contain metabolites with large concentration changes to
central metabolites, e.g., 2PGA and PEP, exhibited response identify the fundamental metabolic aspects associated with the
patterns similar to those of L/D group IV but had only mutant defects.
small effect sizes and failed to pass the significance threshold
(Supplementary Table 1). Lower Glycolysis
The two products of RubisCO, namely, the carboxylation product
1kaiAB1C1 and 1rpaA Mutations Affect 3PGA and the oxygenation product 2PG, were highly elevated
Central Metabolic Pathways in the L samples of the 1rpaA mutant and, to a lesser extent,
The preceding part of our metabolic analysis highlighted only in the 1kaiAB1C1 mutant (Figure 7). These increases suggested
one factor of our two-factorial study, namely, the change in enhanced RubisCO activity. To support this hypothesis, we
illumination and the respective photoautotrophy to heterotrophy analyzed the amount of RubisCO in the mutants by a Western
transitions of metabolism. However, the attenuation of the L/D blot analysis (Figure 8). Compared to the wild type, the
response ratios compared to those of the wild type can have 1kaiAB1C1 and 1rpaA cells accumulated more of the RbcL
multiple alternative causes. Among other causes, the loss of L/D subunit in L and D, suggesting that the higher amounts of 3PGA
responsiveness can be explained by a deficiency to accumulate and 2PG could indeed be based on a cellular increase in the
a metabolite pool that should increase upon illumination or a RubisCO concentration. The higher amounts of 3PGA in the
failure to decrease metabolites upon D transition that are high 1rpaA mutant were consistently associated with lower glycolysis
in L. The latter explanation applied in the analysis of the 1rpaA with accumulating 2PGA and PEP concentrations in this strain.
mutant to a large set of metabolites from L/D-group I (Figure 5, These findings suggest an activation of carbon utilization from
relative-abundance section). Specifically, a set of amino acids, the CBB cycle in the direction of lower glycolysis and toward the
including alanine and the branched chain amino acids valine, oxidative branch of the TCA cycle in the absence of RpaA.
isoleucine, or leucine, retained high concentrations upon the D The assumption of the preferred use of 3PGA in the
transition (Figure 5). Similarly, 2PG lost L/D responsiveness in illuminated 1rpaA mutant by lower glycolysis and not by
both the 1rpaA and the 1kaiAB1C1 mutants, but 1kaiAB1C1 gluconeogenesis was supported by the L levels of soluble
showed a non-significant illumination-independent increase carbohydrates, such as sucrose, which were not significantly
compared to the extreme and highly significant accumulation of changed in the 1rpaA cells (Supplementary Table 1). Similar
2PG in the 1rpaA mutant (Figure 7). In the following section, changes in lower glycolysis and carbohydrate metabolism occur
we specifically compared the mutant defects with the wild- in Synechocystis cells shifted from high- to low-CO2 -supply
type (Supplementary Table 2), thereby focusing on pathways (Orf et al., 2015). The imbalance of carbon use in favor of
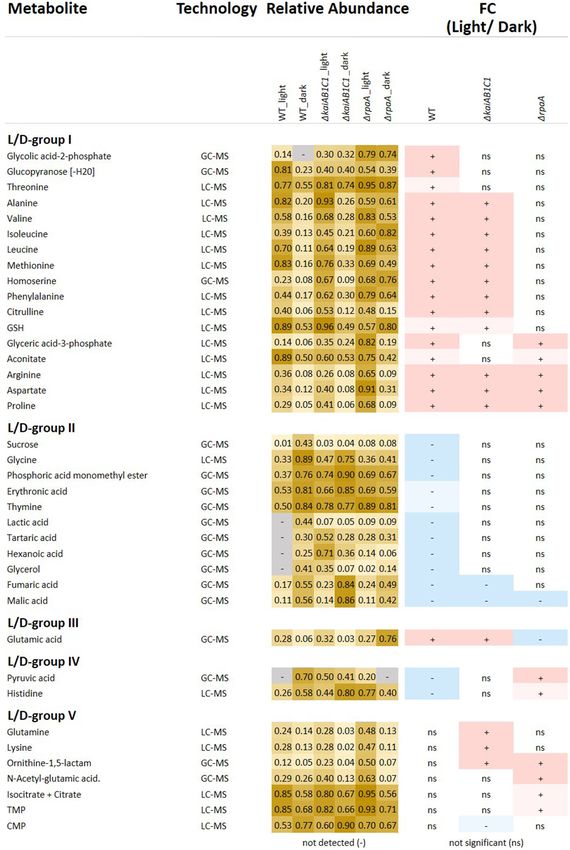
Frontiers in Plant Science | www.frontiersin.org 10 June 2021 | Volume 12 | Article 675227Scheurer et al. Synechocystis Diurnal Metabolism FIGURE 7 | Photorespiration. Box plots showing the maximum normalized relative changes in the metabolite concentrations and Tukey test results (P < 0.05, n = 3). Metabolite levels that significantly differ are indicated by lowercase letters and color coding. Note the moderate and strong increases in the RubisCO products 3PGA and 2PG in the 1kaiAB1C1 mutant and the 1rpaA mutant, respectively. High 2PG accumulation in the 1rpaA mutant continues in the D phase and is associated with glycolate accumulation in the L phase. Serine and glycine respond inversely to RpaA deficiency. Glycine fails to accumulate in the D, while serine accumulates in the L. Dashed arrows indicate multiple reaction steps. Relevant enzymes and complexes include (gray) glycolate-2P phosphatase (Pgp), glycolate dehydrogenase (Glydh), aminotransferase (At), glycine decarboxylase complex (Gdc), serine hydroxymethyltransferase (Shmt), tetrahydrofolate (THF), hydroxypyruvate reductase (Hpr), and glycerate kinase (Gk). FIGURE 8 | Increased RubisCO abundance in mutants compared to wild type (WT). Comparison of the RubisCO levels via immunoblot analysis using anti-RbcL. Ten or fifteen microgram of crude cell extract were used for SDS-PAGE. The samples were collected 5.5 h after the transition to D or L as shown in Figure 4A. lower glycolysis may be controlled via the newly discovered studies implied that PirC (sll0944) is downregulated in the 1rpaA PII-regulated switch of phosphoglycerate mutase (PGAM) mutant under L conditions but not in D, although these data did activity via PirC (Orthwein et al., 2021). Previous gene expression not meet our significance criteria (Köbler et al., 2018). Hence, the Frontiers in Plant Science | www.frontiersin.org 11 June 2021 | Volume 12 | Article 675227
Scheurer et al.                                                                                                  Synechocystis Diurnal Metabolism

lower PGAM inhibition in the 1rpaA mutant likely stimulates               be substantial overaccumulation of this enzyme in these cells
the higher flux to 2PGA, PEP, and pyruvate compared to the                (Figure 8). RubisCO which is not completely inactivated may
wild type.                                                                then preferentially perform oxygenation during the D phase
   The disbalanced carbon utilization in the 1rpaA cells                  due to the low Ci /high O2 intracellular environment. This
extended to the pyruvate family of amino acids, i.e., alanine,            explanation not only applies to the mutant cells but also seems to
and the branched chain amino acids leucine, isoleucine and                apply to the wild type, which fully detoxifies 2PG in D but still
valine. Hence, pyruvate is crucial for metabolism and cannot              contains significantly higher amounts of glycolate and glycine
be depleted without affecting cyanobacterial growth (Kopka                in D compared to the L (Figure 7). An alternative explanation
et al., 2017). According to its high demand during growth                 of elevated 2PG in D may be a potential carry-over of the high
in the L, the pyruvate levels declined in the wild type upon              concentration from the preceding L phase. Such an assumption
transition from D to L. The pyruvate decrease was consistent with         could imply D inhibition of the 2PG dephosphorylation step in
associated increases in the pyruvate amino acid family in the L           the 1rpaA mutant. However, regulation of the 2PG phosphatase
(Supplementary Table 1). These amino acid responses remained              step seems unlikely because of the presence of up to four partially
unaltered in the 1kaiAB1C1 cells, but alanine, leucine, isoleucine        highly promiscuous 2-PG phosphatases within the Synechocystis
and valine consistently overaccumulated in the darkened 1rpaA             genome (Rai et al., 2018).
cells (Figure 9). The deregulation of amino acid biosynthesis
in the 1rpaA mutant can contribute to the observed pyruvate               TCA Pathways
depletion and may ultimately affect growth.                               Our metabolome analysis covered most metabolites of the non-
                                                                          canonical TCA cycle (Figure 10) and associated amino acid
Photorespiration                                                          biosynthesis pathways that receive carbon building blocks from
The      previously     mentioned     increased    amounts     of         this cycle (Figure 11). Among cyanobacteria, the TCA cycle is not
photorespiratory 2PG extended within the pathway toward                   closed because the 2-oxoglutarate (2OG) dehydrogenase complex
higher amounts of glycolate and serine but not glycine in                 is missing. Two shunts have been described that can circumvent
the illuminated 1rpaA cells (Figure 7). Glycine lost L/D                  the missing 2OG dehydrogenase toward succinate, however,
responsiveness in the 1rpaA cells, and the balance of the                 the flux through these shunts seem to be minor under most
NADH-producing glycine decarboxylase complex (GDC) and                    growth conditions (Zhang and Bryant, 2011; Xiong et al., 2014).
serine hydroxymethyltransferase (SHMT) reaction favored                   The predominant open nature of the TCA pathways is clearly
serine. Photorespiratory metabolism was not significantly                 reflected in our current study by the inverted L/D responses
changed in the 1kaiAB1C1 mutant, which is consistent with                 of the TCA cycle metabolites from its reductive (C4) and
the only marginal increase in 2PG in this mutant. The increased           oxidative (C6 and C5) branches. Malate, fumarate and succinate
2PG and glycolate levels indicate an increased flux into the              of the reductive branch decreased in L with large decreases in
Synechocystis photorespiratory pathway (Eisenhut et al., 2008;            the malate and fumarate pools in all strains but only minor
Huege et al., 2011) that detoxifies the critical substrate 2PG.           changes in succinate. This consistent L/D response indicates
The growth defect of the 1rpaA cells in the L/D cycle is                  carbon utilization by respiration via the succinate dehydrogenase
clearly associated with constitutively elevated 2PG levels. This          complex in D and the inactivation or reversion of this process in
observation is consistent with the finding that 2PG inhibits              L. In contrast, the intermediates of the oxidative branch, such as
several key enzymes in plant primary carbon metabolism                    citrate and aconitate, accumulated in L and reflected enhanced
(e.g., Flügel et al., 2017). Furthermore, Synechocystis uses 2PG          use of photosynthetically fixed organic carbon by ammonia
accumulation as a metabolic signal that activates the expression          assimilation via glutamine synthetase/glutamine:2-oxoglutarate
of cyanobacterial carbon-concentrating metabolism (CCM)                   aminotransferase (GS/GOGAT cycle). However, the amount of
because 2PG stimulates the activator CmpR and inactivates the             2OG did not significantly differ between the L and D samples of
repressor protein NdhR (Nishimura et al., 2008; Jiang et al.,             all strains, ruling out the possibility that 2OG-mediated signaling
2018). CCM components, such as sbtB, ndhD3, ndhF3, cupA,                  was responsible for the observed expression changes in the
cmpA, and cmpB (Shibata et al., 2001, 2002; Xu et al., 2008; Orf          CCM-related genes. The deficiency of the KaiAB1C1 system and
et al., 2015), are consistently expressed at higher mRNA levels           the RpaA regulator did not affect the TCA pathways, but the
during the L phase in 1rpaA cells (Köbler et al., 2018).                  utilization of carbon in the associated nitrogen assimilation is
   Consistent with the previously reported deregulation of                reported in the following section.
photosystem I and phycobilisome gene expression in the D
phase (Köbler et al., 2018), the 2PG levels largely remained              Nitrogen Assimilation and Amino Acid Biosynthesis
at increased levels in the non-illuminated 1rpaA mutant cells.            In addition to 2OG, the products of the GS/GOGAT cycle, i.e.,
In contrast, the amount of 3PGA consistently decreased in                 glutamine and glutamate, and the subsequent aminotransferase
the D phase because inorganic carbon assimilation halted.                 product aspartate accumulate in illuminated wild-type
RubisCO is assumed to be inactive during the night, but other             cells (Figure 11). The accumulation of these amino acids
sources of 2PG synthesis seem unlikely. An explanation of                 paralleled the changes in the oxidative TCA branch. These
mistimed 2PG accumulation is proposed by the hypothesis                   concentration changes are consistent with the operation of
that RubisCO may not be fully inactivated in 1rpaA mutant                 ammonia assimilation in the L. Nitrogen (N)-assimilation
cells during the D-phase, especially because there seems to               requires the products of photosynthetic light reactions,

Frontiers in Plant Science | www.frontiersin.org                     12                                     June 2021 | Volume 12 | Article 675227
Scheurer et al. Synechocystis Diurnal Metabolism FIGURE 9 | Lower glycolysis, glutamate, and the pyruvate family of amino acids. Box plots showing the maximum normalized relative changes in the metabolite concentrations and Tukey test results (P < 0.05, n = 3). Metabolite levels that significantly differ are indicated by lowercase letters and color coding. Note the subtle changes in the 1kaiAB1C1 mutant, while the 1rpaA mutant exhibited significantly increased pyruvate family amino acids, 3PGA, PEP, and glutamate in D. These changes are accompanied by pyruvate depletion in the D phase relative to the wild type. In the L, 3PGA accumulates in the 1kaiAB1C1 mutant relative to the wild type. In the 1rpaA mutant, 3PGA accumulates to even higher levels, and the 2PGA and PEP increases become significant. Dashed arrows indicate multiple reaction steps. Relevant enzymes and complexes include (gray) ribulose-1,5-bisphosphate carboxylase-oxygenase (RubisCO), phosphoglycerate mutase (Pgam), enolase (Eno), phosphoenolpyruvate synthase (Peps), pyruvate kinase (Pk), pyruvate dehydrogenase (Pdh), alanine dehydrogenase (Aladh), and alanine transaminase (Alat). such as ATP and reduced ferredoxin. Similar to the TCA metabolism. The 1rpaA mutant, however, differed in the L/D pathways, the deficiency of KaiAB1C1 proteins did not affect responses of glutamate but not of glutamine; specifically, the ammonium assimilation or the associated glutamate/aspartate glutamate concentrations increased in D (Figure 11). This Frontiers in Plant Science | www.frontiersin.org 13 June 2021 | Volume 12 | Article 675227
Scheurer et al.                                                                                                                     Synechocystis Diurnal Metabolism

 FIGURE 10 | Tricarboxylic acid pathways. Box plots showing the maximum normalized relative changes in the metabolite concentrations and Tukey test results (P <
 0.05, n = 3). Metabolite levels that significantly differ are indicated by lowercase letters and color coding. Note the inverse accumulation of metabolites from the
 oxidative and reductive branches of the TCA pathways. The concentrations of the intermediates of the TCA reactions were largely unchanged in the 1kaiAB1C1 and
 1rpaA cells. Dashed arrows indicate multiple reaction steps. Relevant enzymes and complexes included (gray) phosphoenolpyruvate synthase (PepS), pyruvate
 kinase (Pk), pyruvate dehydrogenase (Pdh), phosphoenolpyruvate carboxylase (Pepc), citrate synthase (Cs), aconitase (Acn), isocitrate dehydrogenase (Idh), succinate
 semialdehyde dehydrogenase (Ssadh), succinate dehydrogenase (Sdh), fumarase (Fh), malate dehydrogenase (Mdh), and malic enzyme (Me). *Citrate and Isocitrate.

increase was associated with a significant accumulation                               proteinogenic amino acid pools (Figure 5). Furthermore,
of aspartate in the D and consistent with the supply                                  in both diurnal phases, the amounts of non-proteinogenic
directly from glutamate via the aspartate aminotransferase                            amino acids, such as β-alanine and homoserine, increased,
reaction, while the carbon backbone, oxaloacetate, may                                while nucleobases, such as thymine and uracil, increased in L
be supplied by phosphoenolpyruvate carboxylase (PEPC),                                (Figure 11, Supplementary Table 2). We hypothesize that the
malate dehydrogenase and the intermediates of the reductive                           1rpaA mutant may not stop N-assimilation during the D phase
TCA branch. The lack of a concomitant accumulation of                                 for an unknown reason.
2OG indicated active reuse by the GS/GOGAT cycle. Upon
illumination, the 1rpaA cells overaccumulated Asp and                                 Metabolic Cofactors
N-acetylglutamate, which is an additional direct product                              The set of nucleotides and nucleosides monitored in the current
of glutamate in the pathway toward arginine biosynthesis                              study mostly exhibited minor pool changes that did not pass the
(Figure 11). Collectively, our observations indicate overly active                    significance threshold (Supplementary Tables 1, 2). The lack of
N assimilation in 1rpaA cells that extends in D to multiple                           significance in our study likely results from the high variation

Frontiers in Plant Science | www.frontiersin.org                                 14                                            June 2021 | Volume 12 | Article 675227
You can also read