Tropospheric Ozone A Growing Threat
←
→
Page content transcription
If your browser does not render page correctly, please read the page content below
Tropospheric Ozone
 A Growing Threat
  Acid Deposition and Oxidant Research Center
Foreword
Decreasing concentrations of ozone in the stratosphere are causing a serious problem of
depletion of the ozone layer. Meanwhile, ozone concentrations are increasing in the
troposphere—the ozone within about ten kilometers from the Earth’s surface. A strong
oxidant, tropospheric ozone is harmful to humans and ecosystems. It is also a powerful
greenhouse gas. Average concentrations of ozone are increasing in Japan and other
countries. Even in remote places like the Oki islands in the Sea of Japan, far from any
urban center, ozone concentrations in air transported from far away sometimes exceed
environmental standards in Japan.
Ozone is produced from the photochemical reaction of nitrogen oxides (NOx) and volatile
organic compounds (VOCs) under sunlight. Those pollutants are emitted from automobiles
and industries. Since the emission of nitrogen oxides in East Asia is rapidly increasing due
to a rapid rise in the use of automobiles, the concentrations of tropospheric ozone are
predicted to increase in the future.
Experiments in Europe, the United States and Japan indicate that yield losses of
agricultural crops and suppression of tree growth may occur even in under current ozone
concentrations. It is projected that if concentrations continue to rise in East Asia,
vegetation will be exposed to higher levels of ozone stress, and economic losses will affect
not only Japan but also China, the Republic of Korea and other countries in this region.
During the summer seasons in the 1970s, Japan experienced serious problems from
pollution by photochemical oxidants, which are composed mainly of ozone. After
concentrations gradually decreased, the problems were generally considered to be
resolved. However, since around 1980, average ozone concentrations have again been on
an increasing trend year-round. This problem is beginning to appear as a global
environmental issue, not simply a local one.
Meanwhile, noticing that humans and plants may be affected by long-term exposure to
ozone, even in comparatively low concentrations, European and North American countries
have developed new environmental standards and indexes. Cooperation among
contracting parties in the Convention on Long-Range Transboundary Air Pollution is
another example of efforts to reduce precursor pollutants. Some voices are starting to call
for efforts to address ozone exposure as a hemispheric issue. Today’s issue of
tropospheric ozone deserves to be recognized as a transboundary environmental issue. In
that context, an appropriate framework is needed so that East Asian countries can also
cooperate to tackle this problem.
References
Akimoto, H., Impacts of ozone pollution from East Asia on Japan (in Japanese), Measures of Resources and
the Environment, pp. 90-96, Vol.39, No.11, 2003.
Tropospheric Ozone: A Growing Threat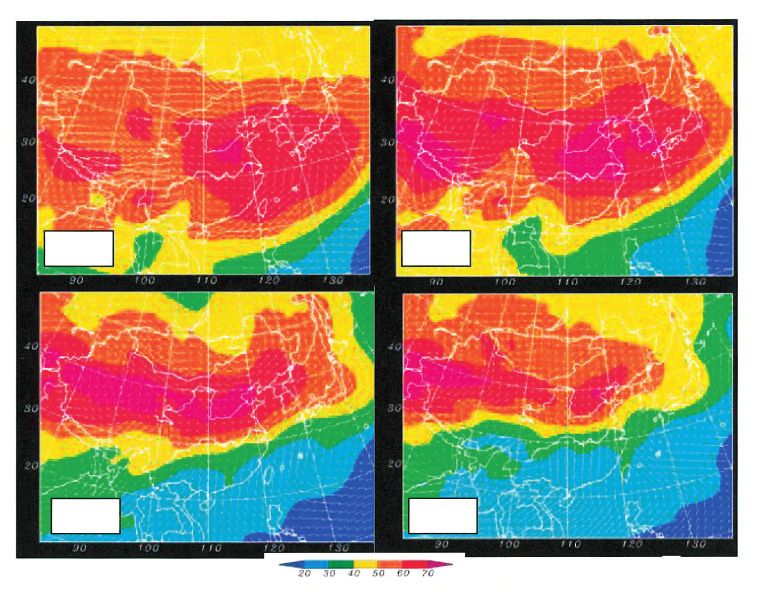
Ozone and photochemical oxidants
Ozone (O3, a molecule formed by three atoms of oxygen) is a gas that is harmful to human health.
Oxidant is a general term for oxidizing substances in the atmosphere. With the exception of nitrogen
dioxide, these oxidants are known as photochemical oxidants. Ozone is the main component of
photochemical oxidants, which also contain peroxyacetylnitrate (PAN) and other substances. Damage to
plants is expressed differently by ozone and PAN. With lettuce, for example, ozone causes spots to appear
on the tips of leaves, while PAN discolors the leaf joints.
Japan has established environmental quality standards for photochemical oxidants, treating it as a
major air pollutant. The standards defined photochemical oxidants as all oxidizing substances that free
iodine from neutral potassium iodide solution, and originally required measurement by spectrophotometry
and that solution. However, it was later clarified that concentrations of PAN are generally much lower than
those of ozone and that PAN is less sensitive to spectrophotometry using neutral potassium iodide than
ozone. Meanwhile, it was found that other measurement methods of ozone concentrations, such as by
photometric method using ultraviolet, are advantageous in terms of procedures and maintenance.
Considering these facts and developments overseas, on 25 October 1996 the then-Environment Agency
(later promoted to Ministry of the Environment) notified the governors of Japan s prefectures and mayors
of the country s major cities that photometric methods using ultraviolet light can be used to measure
photochemical oxidant levels.
ppm and ppb
Both ppm and ppb are units used to indicate the presence or concentration of a substance.
ppm means parts per million and ppb parts per billion. Therefore, 1 ppm is equivalent to 1,000 ppb.
The relation between ppm・h and ppb・h ( h means hour) is similar: 1ppm・h is equivalent to 1,000
ppb・h. This booklet uses whichever unit is appropriate in the discussion, depending on the number of
significant figures.
Photochemical oxidant warnings and serious warnings in Japan
Photochemical Oxidant Warnings are issued to prevent damage to human health and the
environment when hourly concentrations of photochemical oxidants exceed 0.12 ppm and such conditions
are expected to continue, based on meteorological conditions. Governors of prefectures inform the general
public of the warnings through the media, including television and radio, and seek cooperation to mitigate the
problem, for example by asking factories to take measures to reduce the emissions from stationary sources,
and drivers to refrain from using automobiles (Paragraph 1, Article 23 in the Air Pollution Control Act).
On the other hand, regulations concerning Photochemical Oxidant Serious Warnings are stipulated
in guidelines issued by prefectures and other local authorities. These warnings are generally issued when
the hourly concentrations of photochemical oxidants exceed 0.24 ppm and such conditions are expected to
continue, based on meteorological conditions.
Many municipalities also use the terminology of Photochemical Smog Warnings and Photochemical
Smog Serious Warnings.
Tropospheric Ozone: A Growing Threat 
1. Increasing Tropospheric Ozone
■Stratospheric ozone and tropospheric ozone
Many people know about ozone in the atmosphere, but while they are most likely thinking about
stratospheric ozone, tropospheric ozone is not so well known. However, considering the
importance of its direct effects on humans and vegetation, the environmental issue of tropospheric
ozone is likely to become a greater concern in the future. About 90 percent of ozone in the atmosphere
on the Earth is found in the stratosphere, with approximately the remaining 10 percent in the
troposphere. Although both are ozone, its effects on the global environment are quite different
depending on where it is found.
With regard to physical properties, ozone has bands of absorption in both the ultraviolet and
infrared spectra. Stratospheric ozone absorbs ultraviolet rays in sunlight and prevents them from
reaching the surface of the Earth. The ultraviolet light blocked by stratospheric ozone is harmful for living
things, and it is commonly known as good ozone. The loss of this ozone, caused by
chlorofluorocarbons (CFCs) and other substances, constitutes a serious problem for the global
environment.
In contrast, tropospheric ozone absorbs infrared rays emanating from the Earth and works as a
powerful greenhouse gas. The greenhouse effect of this ozone is more significant in the upper
troposphere than in other layers. According to the Intergovernmental Panel on Climate Change (IPCC
2001), tropospheric ozone is regarded as the third most powerful greenhouse gas in the atmosphere,
after carbon dioxide and methane. Meanwhile, in terms of chemical properties, ozone is a strong
oxidant. At the ground level, it is a major air pollutant, and one of the main oxidants. It is also known to
cause photochemical smog, which disturbs human respiratory functions and plant photosynthesis. Due
to its greenhouse effect and toxicity, tropospheric
ozone is known as bad ozone.
The sources of tropospheric ozone are (1)
influx from the stratosphere and (2) generation by
photochemical reactions in the troposphere. The
influx of ozone from the stratosphere takes place
mainly in middle and high latitudes and is most
active in early spring. The generation of ozone in
the troposphere is most active in summer, since it
is caused by photochemical reactions involving
nitrogen oxides (NOx), carbon monoxide (CO)
and volatile organic compounds (VOCs).
Meanwhile, ozone disappears as a result of
photochemical reactions with HOx (OH + HO2)
Figure 1-1. Global distribution of ground-level ozone
radicals, etc., over the ocean, where NOx concentrations based on computer model (May-August
concentrations are generally low, and through 1993). (Lelieveld and Dentener 2000)
decomposition by contact with the ground. The
amount of ozone generated by photochemical reactions in the troposphere is much greater than the
influx from the stratosphere, although the global average net amount of ozone supplied by both sources
is about the same, after counting the amount removed by decomposition in the troposphere. Figure 1-1
shows the results of computer modeling of the distribution of ozone concentrations at ground level in a
recent year. It reveals that ground-level ozone concentrations are high in middle and high latitudes of
the northern hemisphere, especially in regions where air pollutant emissions from human activities are
large in volume.
References
IPCC, Climate Change 2001, P. 7, 2001.
Lelieveld, J. and F. Dentener, Journal of Geophysical Research, 105, 3531-3551, 2000.
Note: Radicals -In atoms and molecules, electrons generally exist in the orbit in pairs. If one of the two is lost,
the atom or molecule becomes extremely unstable and chemically active. A radical is an atom or molecule in
this condition.
Tropospheric Ozone: A Growing Threat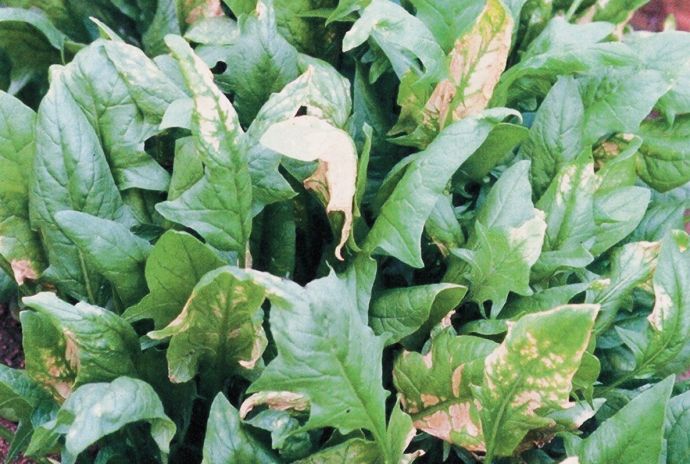
■Rising tropospheric ozone
concentrations worldwide
As shown on the preceding page,
because the amount of ozone generated by
photochemical reaction of air pollutants is
much larger than the inflow from the
stratosphere, the concentrations of ozone
are strongly affected by human activities.
How did tropospheric ozone
concentrations increase globally as societies
became more industrialized? Figure 1-2
plots springtime ozone concentrations at
ground level in middle and high latitudes,
Figure 1-2. Trend of springtime ground-level ozone
using data from Europe and Japan from the concentrations in middle and high latitudes of the northern
end of nineteenth century to the present. The hemisphere from the nineteenth century to the present.
figure shows that the concentrations of (Akimoto 2002)
ground-level ozone were around 10 ppb in
Europe at the end of nineteenth century. By
contrast, ozone concentrations in rural areas
of Europe and Japan in the recent years
have reached averages of 40 to 50 ppb from
spring to summer. These facts mean that
ground-level ozone concentrations have
increased to four to five times the levels in
the preindustrial era. On the other hand,
some argue that data suggesting
concentrations of 10 ppb at the end of
nineteenth century may have some faults in
measurement, because the modeling
suggests that ground-level ozone
concentrations exceeded 20 ppb even if the Figure 1-3. Modeling prediction on geographical distribution
anthropogenic emissions of ozone of ground-level ozone concentrations in 2025 (average from
May to August). (Lelieveld and Dentener 2000)
precursors like NOx and VOCs are set at
zero, as they would have been in the
preindustrial era. Nevertheless, even if ozone concentrations were as high as 20 ppb at the time, recent
ozone concentrations at remote and rural sites in the northern hemisphere have at least doubled since
the preindustrial era.
If human activities continue to cause emissions of pollutants that generate ozone, what will happen
to ground-level ozone concentrations in the future? Figure 1-3 is one example of modeling predictions
for tropospheric ozone. It shows that the average concentration of ozone in North America, Europe and
East Asia, including Japan, from May to August will likely exceed 60 ppb, which would exceed accepted
levels under Japan s current environmental quality standards. To avoid such a situation, it is urgent to
consider countermeasures.
References
Akimoto, H., Chemistry of the troposphere and global environment (in Japanese) (edited by Akimoto H.,
Kawamura K., Nakazawa T. and N. Washida, p. 97, Gakkai Shuppan Center, 2002.
Lelieveld, J. and F. Dentener, Journal of Geophysical Research, 105, 3531.
Tropospheric Ozone: A Growing Threat 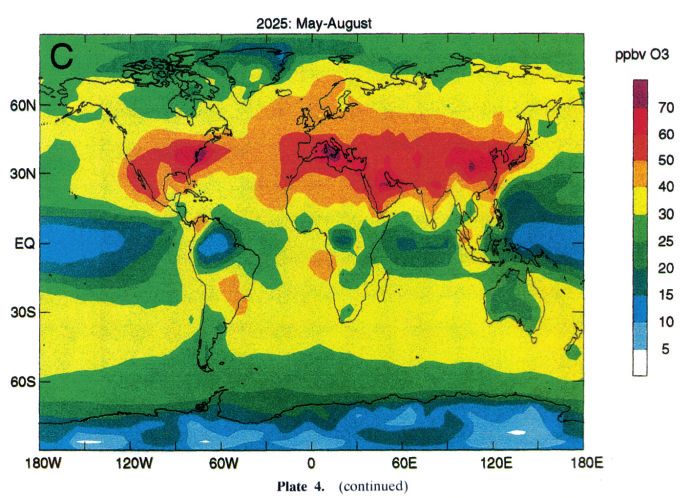
■Rising concentrations of ground-level ozone in Japan
As mentioned above, tropospheric ozone concentrations have been increasing globally and there
are concerns that they may continue to increase in the future. What is the situation in Japan? Figure 1-4
shows the trend of photochemical oxidant
concentrations measured at air pollution
monitoring stations in Japan, mostly in urban
areas. Ozone is considered the primary
photochemical oxidant. A comparison of
average concentrations between 1985 to 1990
and 1994 to 2002 shows an increase of about
3.5 ppb, which has been observed all over
Japan. Ozone concentrations monitored at
remote sites in Japan also show an upward
trend since 1990. The increases in average
ozone concentrations for the ten years from
1992 to 2002 in Happo (a mountainous area) year
and Ryouri (a coastal area) were 9.0 ppb and Figure 1-4. Yearly average daytime concentrations of
7.3 ppb, representing annual increases of 2.0 photochemical oxidants in Japan (326 continuous ambient
and 2.1 percent, respectively. air pollution monitoring stations nationwide). Vertical bars
show standard deviation. (Based on Ohara and Sakata
In the Tokyo metropolitan area as well,
2003)
concentrations of photochemical oxidants are
increasing. According to a survey by the Bureau
of Environment of the Tokyo Metropolitan
Government (2005), daytime concentrations of
photochemical oxidants increased by 5.6 ppb
(about a 0.5 ppb increase per year) from 1990
to 2002. Since 2000, the number of days of
photochemical smog warnings per year has
been increasing, as has the number of days
when photochemical oxidant concentrations
were 120 ppb or higher. Today, photochemical
oxidants reach high levels more often than in
the late 1970s (Figure 1-5). In fact, in July 2002,
Chiba Prefecture, also located in the Tokyo year
metropolitan area, issued a photochemical
Figure 1-5. Photochemical smog warnings and days with
smog serious warning for the first time since photochemical oxidant concentrations of 0.12 ppm or higher
1984. In September 2005, Saitama Prefecture in Tokyo. (Bureau of Environment, Tokyo Metropolitan
issued a similar serious warning and some Government 2005)
damage was reported from the smog
conditions. Possible causes of these increases
in photochemical oxidant concentrations include (1) meteorological changes, including changes in
temperature and solar radiation, (2) an increase in the ratio of VOCs to NOx, and (3) an increase of
transboundary air pollution. However, it is not yet clear which factors are actually at work and how they
are doing so. Quantitative analysis is therefore urgently needed in order to develop effective
countermeasures.
References
Bureau of Environment, Tokyo Metropolitan Government, Report of the Committee on Measures about
Photochemical Oxidants, 2005.
Ohara , T. and T. Sakata, Journal of Japan Society for Atmospheric Environment (in Japanese), 38, 47-54, 2003.
Tropospheric Ozone: A Growing Threat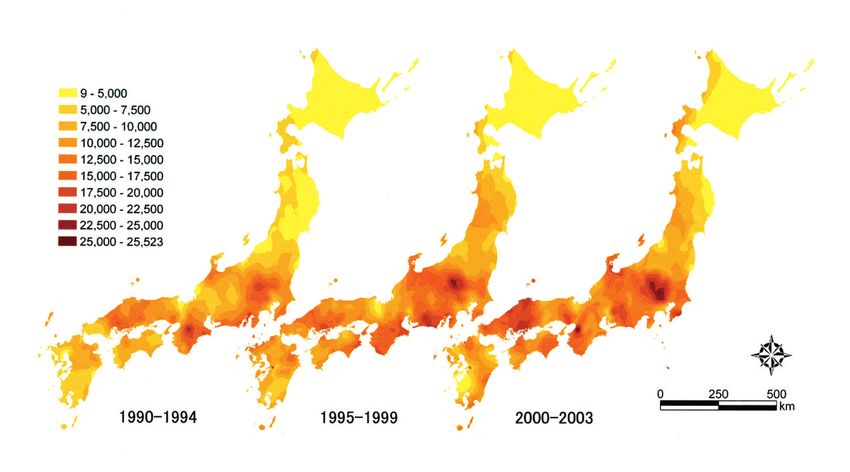
■How is tropospheric ozone formed?
HO2 CH4
Tropospheric ozone (O3) is principally generated RO2 CO
through photochemical reactions involving nitrogen RCO3 VOC
dioxide (NO2) (Figure 1-6). It is formed by a reaction
between oxygen molecules (O2) and oxygen atoms
(O) released when NO2 reverts to nitrogen monoxide OH,RO
NO + O3 NO2 HNO3
(NO) through photolysis under the influence of
ultraviolet light from the sun.
In a chamber containing clean air and nitrogen hν
oxides (NOx), after O3 decomposition (O3 + NO → O2 + RCO3
NO 2→NO+O
PAN
NO2), an equilibrium of generation and decomposition
reactions will be reached when the ozone concentration O+O2+M→O3+M(M:N2 or O2)
reaches 10 to 20 ppb at most. However, if volatile Figure 1-6. Generation and transformation process of
organic compounds (VOCs) are added to that chamber, ozone and nitrogen compounds.
O3 is formed through the photolysis of NO2. The
VOCs react with atoms of oxygen (O), O3 and OH production of NO2 is caused by O3 and peroxide
radicals in the oxidation process under sunlight, to radicals. NO2, reacts again to become HNO3 and PAN.
generate oxide radicals (RO) and peroxide radicals Note: R indicates alkyl group, aryl group, etc. PAN
indicates peroxyacetylnitrate.
(HO2, RO2, RCO3), which play a role in re-producing
NO2 from NO. Among various types of VOCs, olefins
(one group of hydrocarbons) generally have strong
photochemical activity, followed by alkyl benzene and
paraffin (another group of hydrocarbons). The two latter
substances contribute significantly to the regeneration
of NO2, since they exist in high concentrations in the
atmosphere.
The formation of NO through photolysis and the
regeneration of NO2 from the newly produced NO by (Time)
peroxide radicals constitute one cycle, in which one
molecule of ozone is produced. The peroxide radical
functions as a kind of catalyst, since it reverts to its Figure 1-7. Behavior of ozone and its precursors in a polluted
air mass over a long distance. (Carmichael et al. 1994).
original form quickly after reduction.
Ozone concentrations increase in proportion to differences in the rates of formation and
decomposition (i.e., the net rate of formation). One study monitored polluted air masses moving from the
Tokyo metropolitan area to the Chubu mountain area in Japan on a sunny day in summer (Figure 1-7).
In the early morning, NO was in high concentrations in a polluted air mass above Tokyo Bay and the
coastal area. It began to be transformed to NO2 at sunrise. After further photochemical reactions, the
NOx concentrations (the total of both substances) declined rapidly after about nine o clock in the
morning, and they were transformed into HNOx, nitrate aerosols and PAN. At that time, the ratio of
ethylene/acethylene concentrations (an indicator of photochemical activity) also declined rapidly while
ozone concentrations increased sharply. At around 2 o clock in the afternoon, when the air mass
reached Urawa and Fukaya, dozens of kilometers downwind from the emission sources, ozone
concentrations peaked and the air mass continued traveling to the Chubu mountain area with those high
ozone concentrations.
Initial concentrations and the ratio of NOx and VOCs near the emission sources have a great
influence on the amount of photochemical ozone production as well as its geographical distribution.
When the NOx/VOC ratio is higher than around 0.1 ppb/ppbC, the amount of ozone produced depends
largely on VOC concentrations, and not so much on NOx concentrations (and vice versa). This means
that measures to reduce NOx and VOC emissions will have different results, depending on the
NOx/VOC ratio in the vicinity of emissions sources. In addition, when the proportion of VOCs is large,
ozone concentrations will increase in early hours of the day, with the result that high ozone
concentrations will be observed near the emission sources.
Tropospheric Ozone: A Growing Threat 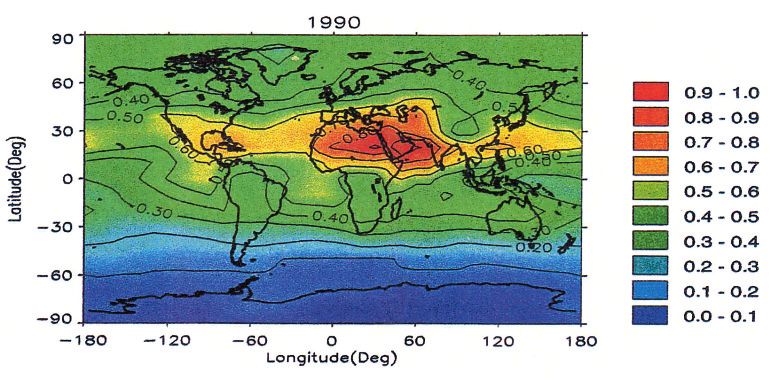
2. NOx and VOCs Increasing in Asia
■Rising NO2 concentrations
(evidence by satellite data)
It is thought that emissions of NOx, which
lead to the formation of ozone, are increasing
dramatically in Asia as the region experiences
rapid industrialization. The Global Ozone
Monitoring Experiment (GOME), which
observed the distribution of NO2 column
concentrations in the troposphere, provided
evidence of this trend (Richter et al. 2005).
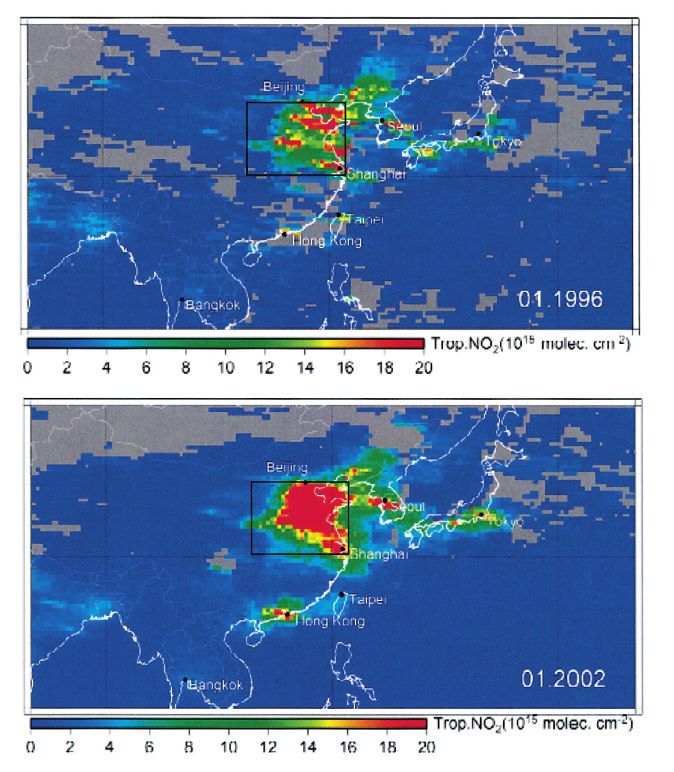
Figure 2-1 shows the distribution of NO2
concentrations in the troposphere of East Asia
in January 1996 and 2002 (Irie et al. 2005;
JAMSTEC 2005). It reveals that NO 2
concentrations are extremely high above the
northern plain in eastern China and that the
region of high-concentrations expanded
between 1996 and 2002. Figure 2-2 shows the
changes in winter concentrations (November to
January) from 1996 to 2002 (difference
obtained by subtracting values in 1996 from Figure 2-1. Distribution of NO2 concentrations in the
troposphere of East Asia, measured by the Global Ozone
values in 2002). Areas where the increase Monitoring Experiment. Shown here are average January
during that period is most noticeable include concentrations in 1996 (top) and 2002 (bottom). Gray zones
Beijing, Shanghai, and Henan Province. indicate lack of data. (JAMSTEC 2005)
Analysis of changes in average NO2
concentrations by season inside the square
drawn around the northern plain shows that
NO2 concentrations are highest in winter, and
are increasing by eight percent per year. The
same trend is evident in other seasons, with an
annual rate of increase of 7 percent (±1
percent). Such increases of NO2 concentrations
in China result from increases in NOx
emissions, which not only raise ozone
concentrations at the ground level in China but
also lead to an increase in ozone
concentrations over Japan through long- Figure 2-2. Changes in NO2 concentrations in the
distance transport of air pollution. troposphere in winter (November-January) between 1996
and 2002. (JAMSTEC 2005)
References
Irie, H. et al., Geophysical Research Letters, 32, L11810, 2005.
Japan Agency for Marine-Earth Science and Technology (JAMSTEC),
, 2005.
Richter, A. et al., Nature, 32, 129-132, 2005.
Tropospheric Ozone: A Growing Threat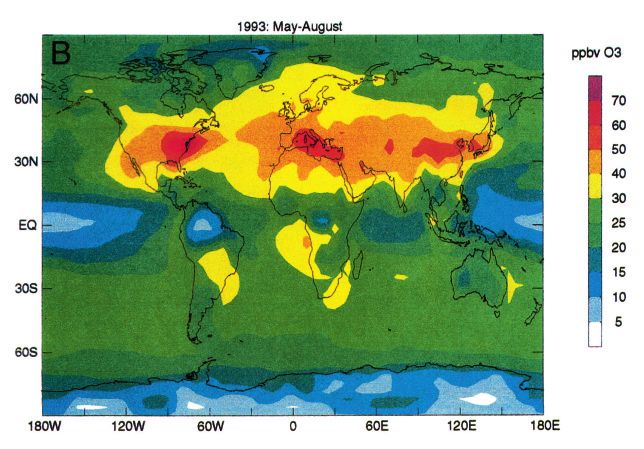
■Rising NOx and VOC emissions
In this section, we discuss trends in NOx and VOC emissions, precursors for the formation of ozone,
based on estimates of emissions in Asia. Figure 2-3 shows the trend of NOx and VOC emissions in
Asia, estimated by the Frontier Research Center for Global Change (FRCGC) and the Research
Institute for Humanity and Nature (RIHN) (Ohara et al. 2005). NOx emissions in Asia increased by about
2.5 times over the twenty years from 1980 to
2000. China showed a dramatic increase of
3.1 times, a trend that has likely continued
after 2000. Figure 2-4 compares distributions
of NOx emissions in 1980 and 2000, showing
that increases are large in the northern plain
and the southern coastal area of China,
similar to the findings of the GOME study
mentioned above. Increases over Indochina
and India are also dramatic. A large part of
these increases in emissions is due to the
rising combustion of coal in power plants and
the growing popularity of the automobile.
Similarly, the increase of VOC emissions
is large. VOC emissions in Asia increased 1.9
times in Asia and 2.4 times in China from
1980 to 2000. The main causes of these
increases are increasing emissions from
automobiles and evaporation from the use of
solvents.
As mentioned above, both NOx and VOC
emissions, which lead to ozone formation,
Figure 2-3. NOx (top) and VOC (bottom) emissions in Asia
have been increasing dramatically in Asia from 1980 to 2000. Units: Kilotons per year. (Ohara et al.
over the past quarter of a century. Unless 2005)
drastic measures are taken to address
energy and environmental issues, NOx and VOC emissions will continue increasing. Such a scenario
will mean the elevation of tropospheric ozone concentrations over a wide area, with serious
consequences. Urgent action is therefore needed to reduce emissions, through international
cooperation in the Asian region.
1980 2000
Figure 2-4. Distribution of NOx emissions in Asia in 1980 (left) and 2000 (right). Units: Tons year-1 per grid cell.
Cells are 0.5 degrees longitude by 0.5 degrees latitude. (Ohara et al. 2005)
References
Ohara, T. et al., Proceedings of the 46th Annual Meeting of Japan Society for Atmospheric Environment
(in Japanese), 511, 2005.
Tropospheric Ozone: A Growing Threat 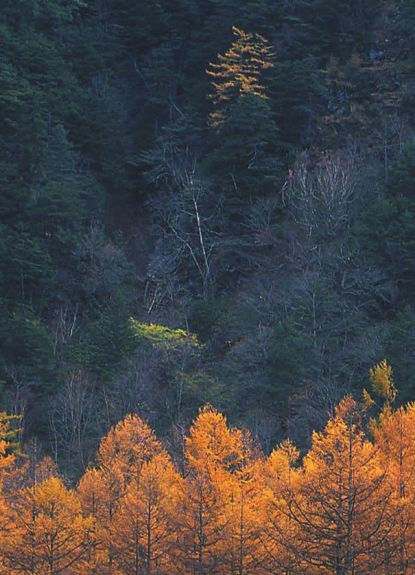
3. Tropospheric Ozone: A powerful Greenhouse Gas
■Greenhouse effect by ozone
Ozone has a powerful capacity to absorb infrared light with a wavelength of around 10 microns.
Since these wavelengths do not overlap those of water vapor (H2O) and carbon dioxide (CO2), ozone in
the atmosphere efficiently absorbs the infrared rays radiated from the Earth and thereby has powerful
greenhouse effect. Because ozone has a relatively short lifetime in the atmosphere―from about a week
to a few months, depending on the season, altitude and region―the spatial distribution of ozone is
extremely uneven compared to greenhouse gases such as CO2 that have a long lifetime. As a result,
when considering the greenhouse effect caused by
ozone, it is important to know how it differs
depending on its location in the atmosphere.
First, let us examine the relationship between
altitude and the greenhouse effect efficiency of
REGION À
ozone. Figure 3-1 shows the rate of change of (Ozone increases cause
Altitude (km)
ground-level temperature caused by increased cooling)
ozone concentrations at different altitudes. As REGION ¿
shown by the figure, the effect of warming is small (Ozone increases cause
warming)
at ground level. As we approach the upper
troposphere, the effect becomes stronger, reaching
the maximum around the tropopause, which divides
the stratosphere and the troposphere, about ten
kilometers above the Earth. In the lower layer of the
stratosphere as well, ozone has a positive Degree/DU Ozone change (° C/m atm-cm)
greenhouse effect. However, at an altitude above
about 30 kilometers, an increase in ozone Figure 3-1. Relation between altitudes and changes of ground
―level temperature caused by increase in ozone column
concentrations lowers the temperature at the density (DU, Dobson Units) (Based on Lacis et al. 1990)
ground level.
The reason why the effect at ground level is nearly zero is that the ozone s absorption and
radiation of infrared rays (from the Earth) is balanced, since the air temperature is almost the same as
that of the Earth s surface and there is no net absorption. At higher altitudes, where the temperature is
lower, the net of infrared absorption by ozone is larger, making the greenhouse effect more efficient.
Similarly, near the tropopause where the temperature of the atmosphere is at its lowest, the greenhouse
effect of ozone is at its highest. In contrast, at higher altitudes in the stratosphere where the temperature
is also higher, the net absorption of infrared rays by ozone is reduced, making the greenhouse effect
negative above the middle layer of the stratosphere.
In short, ozone in the troposphere and the lower layer of the stratosphere has a positive
greenhouse effect. Ozone has its strongest greenhouse effect in the upper troposphere.
■Geographical distribution of global warming effect by ozone
Here, we examine the global distribution of the effects of ozone on global warming. Figure 3-2 is a
scenario simulated by a chemical-climate model showing the global distribution of the effects of
tropospheric ozone concentrations that increased between the Industrial Revolution and 1990. It shows
that the effects on global warming are the largest in the southern region of the Mediterranean Sea, the
northern part of Africa and the Middle East. These are followed by the southern parts of North America
and Europe and the southeastern part of Asia. The effects of tropospheric ozone on global warming
extend to Japan as well, from the main island of Honshu southwards. The reason why the regions
feeling the greatest effects are shifted south from the areas where ozone is highest in concentration
(Figures 1-1 and 1-3) is that greenhouse effect of ozone is largest in the regions with more solar
radiation and fewer clouds.
Tropospheric Ozone: A Growing ThreatSince the increase of
tropospheric ozone in the northern
hemisphere is larger than in the
southern hemisphere due to the
higher intensity of human activities
in the North, in the past the global
warming effects of ozone have been
much greater in the northern
hemisphere. In addition, even within
the northern hemisphere, there are
large differences in the size of the
effects depending on location. Figure 3-2. Annual average climate forcings in 1990 caused by the
increase of tropospheric ozone since 1850, with normalized relative
These are special features of the values by annual average maximum value in 1990. (Bernsten et al.
greenhouse effect of tropospheric 2000)
ozone.
■Ozone, the third most powerful greenhouse gas
We have shown that the greenhouse effect of ozone differs largely by region. In this section, we
compare the average global warming effect of ozone on the entire Earth with those of other greenhouse
gases. For the purpose of comparing effects on global warming, an indicator called climate forcing is
generally used. This index (in Watts per square meter, or W/m2) is obtained by assessing to what extent
infrared light passing through the tropopause is reduced as the concentration of a given greenhouse gas
increases in the atmosphere. Figure 3-3 describes the effects on global warming that several kinds of
greenhouse gases have caused since immediately before the Industrial Revolution to the present. CO2
has had the largest effect on global warming, followed by methane and tropospheric ozone. This is why
the IPCC calls tropospheric ozone the third greenhouse gas. It should be noted that the figure
compares the average global warming effects on the entire planet. As shown above, the increase of
tropospheric ozone in the northern hemisphere is larger than in the southern hemisphere, and the past
effects on global warming are also much larger in the northern hemisphere. In addition, because of the
localization of effects even in the northern hemisphere, the effects of ozone on global warming may be
much larger in some regions than in
others. Figure 3-3 also shows that the
climate forcings of aerosols, which like Aerosols・Clouds
ozone are also air pollutants with short
lifetimes, are very large (both positive and
negative), and differ greatly depending on Trop.
ozone
the chemical components.
Greenhouse gases with long lifetimes Air pollutants with short lifetimes
Figure 3-3. Global climate forcings of different greenhouse gases
from 1850 to 2000. (Based on Hansen and Sato 2001)
References
Berntsen, T. K. et al., Journal of Geophysical Research, 105, 8915-8930, 2000.
Hansen, J. and M. Sato, Proceedings of National Academy of Science, 98, 14778-14783, 2001.
Lacis, A. et al., Journal of Geophysical Research, 95, 9971-9981, 1990.
Tropospheric Ozone: A Growing Threat 4. New Concerns about Health Effects of Ozone
■Health effects of ozone
Photochemical oxidants are substances such as ozone and peroxyacetylnitrate (PAN), formed
secondarily through photochemical reactions. They cause what is known as photochemical smog.
Approximately 90 percent of the components are ozone (O3), which is the main cause for the health
effects of photochemical oxidants. Since ozone is not very soluble in water, if ozone is inhaled, it goes
through the trachea unabsorbed before going deeply into the lungs and reaching the alveoli. The strong
oxidizing action causes a variety of damage to living cells. Most common symptoms are acute effects,
including stinging of the eyes, tears, sore throat and coughing, due to irritation of the mucous
membranes of eyes, nose and throat.
In animal experiments, with concentrations more than about 0.12 ppm, type I alveoli cells are
destroyed quickly, while type II cells, alveolar macrophages and polynuclear white blood cells increase.
Next, cilia drop out or disappear. As a result, hypertrophy of the epidermis is observed in the bronchial
tube and alveolar walls. As for biochemical changes, it is reported that, due to oxidation stress, products
from the decomposition of lipid peroxide increase and the anti-oxidation activity of enzymes is amplified.
With regard to changes of respiratory functions, at concentrations of 0.3 to 0.4 ppm or higher, studies
have reported increases of tracheal resistance, decreases of dynamic lung compliance, and, in guinea
pigs exposed to low concentrations for long periods, hypersensitiveness of the trachea. In human
asthmatics exposed to concentrations of 0.08 ppm or higher the forced expiratory volume (FEV) is
reduced during physical exercise.
■Collective health damage from photochemical oxidants in Japan
In 1970 for the first time in Japan, a group of people suffered negative health impacts apparently
caused by photochemical oxidants. The incident took place at a senior high school in the Suginami
Ward of Tokyo. Female students exercising in the schoolyard and people living in the neighborhood
complained of stinging eyes and throats as well as other non-respiratory symptoms like nausea,
dizziness and fainting. Some students were hospitalized.
Respiratory impacts had been considered the main health effects of air pollutants before that
incident. The atmospheric ozone concentrations at that time were estimated to be about 0.2 ppm―not
considered to be high enough to cause acute respiratory symptoms. The mechanisms causing
neurological symptoms like nausea and dizziness are not entirely clear. However, subsequent animal
experiments suggested that they could be caused by ozone stimulation leading to irritation of
parasympathetic nerves, and suppression of sympathetic nerves, which cause decreases in heart rate
and blood pressure, and irregular pulse (Figure 4-1).
As a result of such incidents of negative health impacts, the government established an air quality
standard for photochemical oxidants in 1973. Unlike the other
air pollutants, it was set at a level to prevent acute rather than
Blood pressure Clean air
chronic effects, at 0.06 ppm or lower as an hourly value.
■Attainment of environmental standards, Cardiogram
complaints of health damage
In 2004, the attainment rate of the air quality standard for Blood pressure
Average hourly heart rate (/minute)
photochemical oxidants was extremely low in Japan. Only two
stations attained the daytime standard (5 a.m. to 8 p.m.) and
never exceeded the hourly maximum of 0.12 ppm. This Cardiogram
represents only 0.2 percent of all the stations in Japan, P-wave
including ambient and roadside monitoring stations. Although
the total number of days having photochemical oxidant
warnings had been decreasing since a peak in 1973, this Figure 4-1. Blood pressure decrease and
number has been fluctuating since the 1980s. In 2004, irregular pulse in rats exposed to 1 ppm-ozone
photochemical oxidant warnings were issued in 22 for three hours. (Uchiyama 2003)
Tropospheric Ozone: A Growing Threatprefectures, with a cumulative total 189 days
of warnings in all prefectures, and 393
Average hourly heart rate (/minute)
reported victims apparently affected by
photochemical oxidants.
Although incidences of health impacts are
less common than in the past, they are still
reported periodically. Once a photochemical
Clean air
oxidant warning is issued, people are advised
to avoid outdoor exercise, and any physical
education being conducted outdoors at
schools must be moved indoors.
Under repeated ozone exposure,
Figure 4-2. Changes in heart rate when exposed to ozone for
reactions such as the decline of respiratory three consecutive days. (Arito et al. 1990)
functions in humans and decreased heart rate
in animal experiments are most evident on the first day, but in about three days, they no longer occur
under the same atmospheric concentrations (Figure 4-2). Likewise, health damage caused by
photochemical oxidants is more likely to occur when the concentration of oxidants rises suddenly, for
example, on a sunny day in Japan s rainy season, rather than when the concentration of oxidants has
risen gradually with a series of hot days in midsummer.
People sometimes complain or question the need to change their behavior after an warning is
issued, for example when they are told they must stop swimming in an outdoor pool. However, it is
important to follow the actions required when warnings are issued, as high oxidant levels may induce
the acute symptoms mentioned above, as well as other impacts such as asthma attacks in children
suffering from asthma.
■Standards in Europe and the United States
The United States Environmental Protection Agency (USEPA), during a standards review process
in 1996, considered that (1) even with hourly concentrations of 0.12 ppm or lower, acute health effects
can be observed if people are exposed to ozone for a long period while doing a medium level of
exercise; (2) pulmonary damage observed as chronic effects in animal experiments with ozone are
almost the same regardless of species; and (3) repeated inflammation by ozone exposure during life
may damage pulmonary tissues and reduce the quality of life in old age. Since most regions in the
United States had attained existing standards for hourly concentrations, the USEPA felt that an eight-
hour value would now be more appropriate than a one-hour value, for properly controlling exposure
levels and preventing harmful effects. Thus, an eight-hour mean value of 0.08 ppm was judged as
appropriate, based on risk assessments, especially on the proportion of children who suffer from
medium or high level decline in pulmonary functions through outdoor activities, and the proportion of
children who experience chest pains when breathing deeply.
In the United Kingdom, the provisional target of ozone concentrations to be achieved by the end of
2005 was set at 100μg/m3 (0.05 ppm) as a daily maximum running eight-hour mean not to be exceeded
more than ten times a year. Similarly, the European Union set the eight-hour value (calculated four
times a day) of 110μg/m3 (0.055ppm) as a target to be achieved by 2010. Both were established as a
permissible range of concentrations, from the public health perspective, based on risk assessments of
health effects such as aggravation of symptoms and respiratory functions of asthmatics and the
increased hospitalization of patients with respiratory disease. Other thresholds, such as a yearly mean
value, have not yet been established, however, since chronic effects have not yet been adequately
determined in epidemiological studies.
References
Arito, H., I. Uchiyama et al., Toxicology Letters, 52. 169-178, 1990.
Uchiyama, I., Journal of Japan Society for Atmospheric Environment (in Japanese), 38, 347-357, 2003.
Tropospheric Ozone: A Growing Threat5. Ozone Damage to Agricultural Crops
■Discoveries of ozone damage in plants
In 1944, photochemical smog damage was observed for the first time on plants near Los Angeles in
the United States. Later, ozone was identified as the primary causal agent of the damage. Since then,
many studies conducted on the effects of ozone on plants have shown that ozone is damaging plants in
various regions across Japan, Europe and North America. When a high-concentration of ozone diffuses
into a plant, the strong oxidizing power injures the plant tissues, resulting in visible damage, such as
white, yellow, or reddish spots in the leaves.
The leaf damage in leafy vegetables like
spinach reduces the commercial value
significantly (Photo 5-1). Even if the ozone
concentration is less than a level that causes
visible damage, the elevated level of ozone
concentrations reduces the photosynthesis
function and accelerates aging in plant
leaves. Plant growth is hence retarded, and,
in agricultural crops, the harvest is reduced.
Photo 5-1. Ozone damage to spinach leaves. (Photo courtesy by
Dr. Isamu Nouchi, National Institute for Agro-Environmental
Sciences)
■Agricultural production losses caused by ozone
To estimate the amount of crop harvest lost to ozone, researchers have studied crop plants grown
in greenhouses where ozone concentrations were raised compared to the ambient air. The observed
changes in the crop yield were related to average ozone concentrations during the daytime for major
crop species (Figure 5-1). The relationships for corn, winter wheat, cotton and soybean have been
derived from the experiments in the United States (Lesser et al. 1990), for spring wheat from
experiments in Europe (Skarby et al. 1993), and for rice from an experiment in Japan (Kobayashi et al.
1995). The relationship between ozone and yield loss differs with crop species: rice, corn and winter
wheat are less sensitive to ozone than cotton and soybean, whereas spring wheat in Europe is,
interestingly, as sensitive as soybean in the United States. In addition, even the same species can show
different sensitivity among different varieties and under different environments. Therefore, it would be
more realistic to consider the relationships in Figure 5-1 as a collection of wide bands rather than as
lines. We do not yet know exactly how the width of the bands is determined, however.
Using the relationships shown in Figure 5-1, crop yield losses due to ozone were estimated for
soybean and winter wheat across the United States, except for the middle and western regions. The
result showed a 14 percent loss on average over the six years from 1982 to 1987 (Tingey et al. 1994).
As for Japanese rice, the yield loss in the Kanto region was estimated to be around three percent on
average over the five years from 1981 to 1985 with the highest loss of up to seven percent in the middle
of the region (Figure 5-2). Takagi and Ohara (2003) also estimated a yield loss of rice about 3.5 percent
in the Kanto region using more recent data of ozone from 1996.
¡ Tropospheric Ozone: A Growing ThreatYield
loss(%)
No rice
Figure 5-1. Relationships between ozone Figure 5-2. Yield loss of rice caused by ozone in
concentrations and yield losses in major the Kanto region of Japan. Relative yield loss (%)
agricultural crops. (Lesser et al. 1990; Skarby et al. was compared to yields at a reference ozone
1993; Kobayashi et al. 1995) concentration (20 ppb), and averaged over five
years from 1981 to 1985. (Kobayashi 1999)
■Rising impacts of ozone across Asia
As in other industrialized regions of the world, surface ozone concentrations are increasing in Asia,
and their impacts on agricultural crops and natural vegetation have become a matter of concern among
scientists. Wang et al. (2005) estimated that the yield of winter wheat was reduced by about 25 percent
in the lower Yangtze River basin in 2000, with the mean daytime ozone concentration from April to June
being around 60 ppb. For rice, Wang et al. (2005) estimated the average daytime ozone concentration
to be 45 to 50 ppb during the growing season (June to October). The yield loss of rice could therefore be
about seven percent using the relationship shown in Figure 5-1. With rapid economic growth occurring
in China, there is strong reason to expect further increases in ozone concentrations in the future. Wang
and Mauzerall (2004) predicted that daytime surface ozone concentrations in July will exceed 55 ppb in
most parts of China in 2020, using a global-scale model of atmospheric chemistry and transport. They
also predicted that the total production of soybean, corn and winter wheat in China will be reduced by
about 40 to 60 percent in 2020. Since Chinese crop production is the world s largest for wheat, second-
largest for corn, and fourth-largest for soybean, the Wang-Mauzerall predictions on the crop losses to
ozone have very strong implications for the global food supply in the future. Admittedly, there are many
uncertainties in their predictions, and future studies may lead to more moderate estimates of crop
losses. Nevertheless, considering that we now have less than 15 years remaining before 2020, and that
the implications of ozone impacts are so significant, it will be important to launch further studies as soon
as possible to minimize the uncertainties in crop loss predictions.
References
Kobayashi K., Journal of Japan Society for Atmospheric Environment (in Japanese), 34, 162-175, 1999.
Kobayashi, K. et al., Agriculture Ecosystems and Environment, 53, 109-122, 1995.
Lesser, V.M. et al., Crop Science, 30, 148-155, 1990.
Skarby, L. et al., Effects of Air Pollution on Agricultural Crops in Europe, 241-259, Commission of the European
Communities, Brussels, 1993.
Takagi, T. and T. Ohara, Journal of Japan Society for Atmospheric Environment (in Japanese), 38, 205-216,
2003.
Tingey, D. T. et al., Tropospheric Ozone: Human Health and Agricultural Impacts, 175-206, Lewis Publishers,
Boca Raton, 1994.
Wang H. et al., Atmospheric Environment 39, 3843-3850, 2005.
Wang X. and D. L. Mauzerall, Atmospheric Environment 38, 4383-4402, 2004.
Tropospheric Ozone: A Growing Threat ¢6. Ozone Threat to Japan s Forests
■Tree damage in Japan
Forests act as a life-support system on the Earth.
Through photosynthesis, trees, a main component of
forest ecosystems, supply the oxygen that is
indispensable to support life. Forests also preserve our
environment by fixing carbon dioxide, a major cause of
the global warming, and by absorbing air pollutants.
Unfortunately, forest decline and tree dieback are being
observed in many areas of Japan (Izuta 2001).
In the Tanzawa Mountains of Kanagawa Prefecture,
the decline and dieback of Japanese beech (Fagus
crenata) have been observed at Mt. Hinokiboramaru and
Mt. Hirugatake (Photo 6-1 top), and decline of Japanese
fir (Abies firma) has been observed at Mt. Ohyama. In the
Oku-Nikko area of Tochigi Prefecture, Veitch s fir (Abies
veitchii), Maries fir (Abies mariesii) and Erman's birch
(Betula ermanii) are in a state of decline (Photo 6-1
bottom). In the Sanyo Region, which includes Hiroshima
Prefecture, the decline of Japanese red pine (Pinus
densiflora) has been observed. In some areas along the
Sea of Japan, including Ishikawa, Tottori and Shimane
Prefectures, the decline and dieback of konara oak
(Quercus serrata) and mizunara oak (Quercus
mongolica) have also been observed. Photo 6-1. Decline of Japanese beech at Mt.
Hirugatake, Kanagawa Prefecture in 1995 (top
photo). Veitch s fir and Maries fir in Oku-Nikko,
Tochigi Prefecture in 1994 (bottom photo).
Photos: Dr. Yoshihisa Kohno.
■Suspected causes of forest damage elsewhere
Several hypotheses have been presented on the causes of forest decline or tree dieback in Europe
and North America. Possible causes differ with each site. Ozone, soil acidification due to acid deposition
and excess nitrogen deposition from the atmosphere have been suggested as causes in northern
Europe; ozone, acid deposition such as acid mist and fog and sulfur dioxide have been suggested in
western Europe; and sulfur dioxide, nitrogen dioxide, ozone and acid deposition such as acid mist/fog
have been suggested in eastern Europe. In North America, meanwhile, ozone is thought to be closely
related to the forest decline and tree dieback. For example, in the Sierra Nevada-San Bernardino
Mountains, ozone is regarded as the main cause of the decline of pine species such as ponderosa pine
(Pinus ponderosa) and Jeffrey Pine (Pinus jeffreyi). In the northern Appalachian Mountains, where the
decline of red spruce (Picea rubens) has been observed, relatively high concentrations of ozone have
been recorded. In the southeastern part of the United States, it has also been suggested that ozone is a
factor in the decline of eastern white pine (Pinus strobus).
In Japan, tropospheric ozone concentrations have been increasing in recent years, and
concentrations of ozone high enough to cause harmful effects on forest tree species have been
recorded. Based on these facts, ozone is considered to be one of the main factors relating to forest
decline and tree dieback in Japan. In fact, relatively high concentrations of ozone over 100 ppb have
been recorded in the Oku-Nikko area and at Mt. Hinokiboramaru in the Tanzawa Mountains, where the
decline and dieback of Japanese beech (Fagus crenata) have been observed. Thus, adverse impacts of
ambient ozone on growth and physiological functions such as photosynthesis of forest tree species are
matters of concern.
£ Tropospheric Ozone: A Growing ThreatFigure 6-1. Relationship between
the whole-plant dry mass forest tree
species and AOT40 of ozone (Izuta
and Matsumura 1997). The
horizontal axis shows AOT40 of
ozone calculated for six months,
and the vertical axis indicates
relative value of the whole-plant dry
mass of the seedlings exposed to
ozone to that of the seedlings
exposed to charcoal-filtered air.
Legend for species: Pd, Pinus densiflora (Japanese red pine); Pt, Pinus thunbergii (Japanese black pine); Ps, Pinus
strobus (eastern white pine); Lk, Larix kaempferi (Japanese larch); Pa, Picea abies (Norway spruce); Ah, Abies
homolepis (Nikko fir); Co, Chamaecyparis obtusa (Japanese cypress); Cj, Cryptomeria japonica (Japanese cedar); Pm,
Populus maximowiczii (Japanese poplar); Bp, Betula platyphylla (Japanese white birch); Qs, Quercus serrata (konara
oak); Qm, Quercus mongolica (mizunara oak); Fc, Fagus crenata (Japanese beech); Lt, Liriodendron tulipifera (yellow
poplar); Ab, Acer buergerianum (trident maple); Fj, Fraxinus japonica (Japanese ash).
■Effects of ozone on Japanese tree species
Ozone in the atmosphere is absorbed into the leaf tissues of trees through the stomata, and causes
visible damage on the leaves, as well as a reduction of growth and suppression of physiological
functions such as photosynthesis. Based on the results obtained from several studies conducted in
Japan, there are great differences in ozone sensitivity among Japanese forest tree species, in terms of
growth and net photosynthesis. To clarify the sensitivity of growth of forest tree species to ozone, in one
study, seedlings of 16 tree species were exposed to either charcoal-filtered air or ozone for several
years (Figure 6-1). The study ranked various species for ozone sensitivity of the whole-plant dry mass
with accumulated ozone exposure over a threshold of 40 ppb (AOT40; see page 17 for details) at 20
ppm・h [from high to low sensitivity: Japanese poplar (Populus maximowiczii) > trident maple (Acer
buergerianum) > Japanese beech (Fagus crenata) and eastern white pine (Pinus strobus) > Japanese
ash (Fraxinus japonica) > Japanese red pine (Pinus densiflora) > Nikko fir (Abies homolepis) > yellow
poplar (Liriodendron tulipifera) > Japanese larch (Larix kaempferi) > Japanese white birch (Betula
platyphylla var. japonica) and mizunara oak (Quercus mongolica) > konara oak (Quercus serrata) >
Japanese cedar (Cryptomeria japonica) and Norway spruce (Picea abies) > Japanese black pine (Pinus
thunbergii) > Japanese cypress (Chamaecyparis obtuse)]. The AOT40 values corresponding to a 10
percent reduction in the whole-plant dry mass were approximately 8 ppm・h for Japanese popular, the
most sensitive species, and 12-21 ppm・h for Japanese red pine, eastern white pine, Japanese beech,
trident maple and Japanese ash.
In Maebashi City of Gunma Prefecture, the site of the study described above, AOT40 values for six
months were 10-24 ppm・h. At Inukoeji in the Tanzawa Mountains of Kanagawa Prefecture, relatively
high concentrations of ozone over 0.12 ppm were observed, and the AOT40 value from March to June
in 1997 was approximately 30 ppm・h (Aso 1999). Taking these observations and results of
experimental studies into account, it can be deduced that ozone causes harmful effects on relatively
sensitive tree species such as Japanese beech. Since tropospheric ozone concentrations are expected
to increase steadily in Japan, ozone has the potential to adversely affect many Japanese forest tree
species in the future.
References
Aso, T., Annual Report of the Center for Environmental Science (in Japanese), Kanagawa Prefecture, 31, pp. 32, 1999.
Izuta, T., Plant Responses to Atmospheric Change (in Japanese) (edited and written by Nouchi I.), pp. 168-208,
Youken-dou, 2001.
Izuta, T. and Matsumura H., Journal of Japan Society for Atmospheric Environment (in Japanese), 32(6), A73-A81,
1997.
Tropospheric Ozone: A Growing Threat ¤7. Environmental Standards and Other Indexes for Ozone Exposure
Terms such as standards and criteria are commonly used to describe indicators. The World
Health Organization (WHO) uses the term guidelines. The values of environmental standards for air
pollutants are expressed in terms of concentrations or doses. Several expressions are used as
units of measure for concentrations, such as hourly average, daily average, daily maximum of hourly
values, monthly average, annual average. The environmental standard of photochemical oxidants in
Japan is stated, for example, as the one-hour value must be 0.06 ppm or lower. Units of dose such
as ppm・h express concentrations multiplied by time. The same concentration will result in a different
dose if the period of exposure is different. Conversely, it is important to note that, for example, a 20-hour
exposure to 0.05 ppm amounts to the same 1 ppm・h dose that would result from a 1-hour exposure to 1
ppm. Even if the dose is the same, long-term exposure to low concentrations, or short-term exposure to
high concentrations, may cause different reactions in organisms. These examples show that actual
exposure conditions should be fully considered when evaluating the results of experiments.
Standards in concentration or dose are decided based on reviews of the latest scientific knowledge
from monitoring results, epidemiological studies, and exposure experiments for human beings, animals,
and plants. Since the methods of setting standards differ with each country, region, and affected subject,
no common standard is used worldwide (see table on pages 25 and 26).
■Standards for plants (crops, forests, and ecosystems, etc.)
In general, national environmental standards are set mainly for the protection of human health in
each country, and most of them are based on concentrations. However, European and other countries
have begun to apply the concept of critical levels that incorporate the idea of doses.
A critical level is defined as the concentrations of pollutants in the atmosphere above which direct
adverse effects on receptors (such as human beings, plants, ecosystems or materials) may occur,
based on current knowledge. A related term, critical load, is defined as a quantitative estimate of
an exposure to one or more pollutants below which significant harmful effects on specified sensitive
elements of the environment do not occur, based on current knowledge.
■AOT40 and SUM60
Europe originally used concentration-based
standards for ozone, but it has been replaced by a
new index called AOT40, which refers to cumulative
ozone exposure above a threshold of 40 ppb (Fuhrer
et al. 1997) (Figure 7-1). By definition, AOT40 drops
to zero when ozone concentrations stay below 40
ppb for a certain period.
In Europe, 3 ppm・h has been proposed as the
AOT40 for three months corresponding to a 5
percent yield reduction of crops, based on open-top
Figure 7-1. Calculation of AOT40. (Redrawn from
chamber experiments with wheat cultivars for 10 Fuhrer et al. 1997)
growing seasons in six countries. The AOT40 of 3 Cumulative dose over 40 ppb (concentration × time)
ppm・h was also suggested as the critical level (Level
I standard) for 10 percent growth reduction on grassland and pasture (natural and semi-natural
vegetation). As for forests, the AOT40 of 10 ppm・h was suggested as the critical level (Level I standard)
for 10 percent growth reduction based on experiments of ozone exposure to beech trees. Since growth
conditions, such as temperature and soil moisture, have not been reflected in those critical levels,
discussions on Level II critical levels were necessary to consider effects of those factors. In this context,
¥ Tropospheric Ozone: A Growing Threatdiscussions were started on flux-based critical levels, with the result that a flux threshold of 1.6
nmol/m2/s (about 0.077μg/m2/s) was proposed as a preliminary value for forests (Karlsson et al. 2003).
While European countries discuss the AOT40 as the critical level of ozone, the United States and
Canada are discussing another index, known as SUM60. This is the sum of hourly ozone concentrations
equal to or greater than 60 ppb over a given period. As with AOT40, ppm・h is also used as the units
for SUM60. While the AOT40 is the sum of the differences between hourly ozone concentrations and 40
ppb for each hour, SUM60 is the sum of concentrations that exceed 60 ppb.
■Mapping of areas exceeding critical levels
Mapping of monitoring data on the atmosphere in
relation to those critical levels makes it possible to study
where the ozone concentrations exceed the critical level, to
what extent, and which areas have high risk of ozone
effects. Yield of agricultural crops can also be evaluated and
discussed based on the mapping. Figure 7-2 is a map
available on the Internet showing the spatial distribution of
SUM60 in the United States.
In Japan, estimates were also made in recent years
regarding the effects on rice yield and growth, but the area
studied was limited to the Kanto region (Takagi and Ohara
2003; Yonekura et al. 2005).
Japan's nation-wide monitoring system observes
photochemical oxidants, rather than ozone concentrations.
Published data include the number of hours when Figure 7-2. Five-year average (1999-2003) of
ambient ozone exposures using SUM60 in the
concentrations exceed 0.06 ppm and exceed 0.12 ppm at United States. (USFS-FIA)
each monitoring station, only during the daytime, so 24-hour Period: June 1-August 31
statistical data are not available except for limited sites. Time: 8 a.m.-8 p.m.
Contour lines: Increments of 5 ppm・h. (Area
Thus, in one study, the AOT40s at each station were near California exceeds 30 ppm・h.)
estimated in detail based on the relationship between the
number of hours exceeding the standards and hourly
concentrations. This analysis showed that the AOT40 in
Japan was approximately 5 ppm・h in the early 1980s, then
gradually increased year by year, to the point that it
exceeded 10 ppm・h after the year 2000 (Figure 7-3).
Analysis on the nation-wide spatial distribution shows that
the AOT40 is high in suburban areas of large cities, for
example, in the Kanto region, Osaka, and Hiroshima. In the
Kanto region, the AOT40 is extremely high in Saitama and
Gunma Prefectures (Figure 7-4).
Figure 7-3. Trend of mean AOT40 for
photochemical oxidants (Ox) in Japan.
AOT40 was estimated by calculating from sum
of numbers of hours exceeding 0.06 and 0.12
ppm. (Kohno 2005)
Tropospheric Ozone: A Growing Threat ¦You can also read