MLG: multilayer graph clustering for multi-condition scRNA-seq data
←
→
Page content transcription
If your browser does not render page correctly, please read the page content below
Nucleic Acids Research, 2021 1
                                                                                                              https://doi.org/10.1093/nar/gkab823

MLG: multilayer graph clustering for multi-condition
scRNA-seq data
Shan Lu1 , Daniel J. Conn2 , Shuyang Chen1 , Kirby D. Johnson3 , Emery H. Bresnick                                                            3
                                                                                                                                                  and
Sündüz Keleş 1,2,*
1
  Department of Statistics, University of Wisconsin, Madison, WI 53706, USA, 2 Department of Biostatistics and

                                                                                                                                                              Downloaded from https://academic.oup.com/nar/advance-article/doi/10.1093/nar/gkab823/6377404 by guest on 26 October 2021
Medical Informatics, University of Wisconsin School of Medicine and Public Health, Madison, WI 53792, USA and
3
  Wisconsin Blood Cancer Research Institute, Department of Cell and Regenerative Biology, University of Wisconsin
School of Medicine and Public Health, Madison, WI 53705, USA

Received December 10, 2020; Revised August 13, 2021; Editorial Decision September 06, 2021; Accepted September 21, 2021

ABSTRACT                                                                        conditions (6), clustering of scRNA-seq data from multiple
                                                                                biological conditions (e.g. different treatments, time points,
Single-cell transcriptome sequencing (scRNA-seq)                                tissues) to elucidate cell types and subpopulation of cells has
enabled investigations of cellular heterogeneity at                             not been a major focus.
exceedingly higher resolutions. Identification of                                  Joint clustering of scRNA-seq datasets across multiple
novel cell types or transient developmental stages                              conditions entails, in addition to standard normalization,
across multiple experimental conditions is one of its                           feature selection, and dimension reduction, a considera-
key applications. Linear and non-linear dimension-                              tion of whether or not data from cells across multiple stim-
ality reduction for data integration became a foun-                             uli need to be ‘integrated’ before the downstream analy-
dational tool in inference from scRNA-seq data. We                              sis of clustering. This is because cell type-specific response
present multilayer graph clustering (MLG) as an inte-                           to experimental conditions may challenge a joint analysis
grative approach for combining multiple dimension-                              by separating cells both by experimental condition and cell
                                                                                type. Most notably, Seurat (v3) (7) uses canonical compo-
ality reduction of multi-condition scRNA-seq data.
                                                                                nent analysis (CCA) (8) to perform data integration for
MLG generates a multilayer shared nearest neigh-                                high dimensional gene expression across conditions. Liger
bor cell graph with higher signal-to-noise ratio and                            (9) achieves dimension reduction and data integration si-
outperforms current best practices in terms of clus-                            multaneously by using penalized nonnegative matrix fac-
tering accuracy across large-scale benchmarking ex-                             torization (NMF) to estimate factors shared across condi-
periments. Application of MLG to a wide variety of                              tions and specific to conditions. ScVI (10) and scAlign (11)
datasets from multiple conditions highlights how                                both use deep neural networks to infer a shared nonlin-
MLG boosts signal-to-noise ratio for fine-grained                               ear low-dimensional embedding for gene expression across
sub-population identification. MLG is widely appli-                             conditions. Harmony (12) iteratively performs soft k-means
cable to settings with single cell data integration via                         clustering and condition effect removal based on cluster-
dimension reduction.                                                            ing assignments. A common theme of these approaches is
                                                                                that majority of them (Liger, scAlign, scVI and Harmony)
                                                                                directly yield low-dimensional integrated data for down-
INTRODUCTION                                                                    stream visualization and clustering.
                                                                                   While existing methods for joint analysis of scRNA-seq
High-throughput single-cell RNA sequencing (scRNA-seq)                          data (e.g. Seurat, scAlign, and Liger among others) reg-
captures transcriptomes at the individual cell level. While                     ularly adapt modularity maximization algoritms such as
scRNA-seq is powerful for a wide range of biological infer-                     Louvain graph clustering (13) with shared nearest neigh-
ence problems, perhaps, its most common application thus                        bor (SNN) graph or shared factor neighborhood (SFN)
far is cell type/stage identification. Specifically, clustering                 graph built with their low-dimensional embeddings of the
analysis of scRNA-seq enables identification of cell types                      data, they vastly differ in their dimension reduction tech-
in tissues (1–3), or discrete stages in cell differentiation and                niques as we outlined above. This leads to documented no-
development (4,5) by leveraging similarities in the transcrip-                  table differences among these methods (14). To leverage
tomes of cells. Although a plethora of methods, some of                         strengths of different dimensionality reduction approaches,
which repurpose existing k-means and Louvain algorithms                         we develop an integrative framework named multilayer
for clustering, exist for cell type identification from single

* To   whom correspondence should be addressed. Tel: +1 608 265 4384; Email: keles@stat.wisc.edu


C The Author(s) 2021. Published by Oxford University Press on behalf of Nucleic Acids Research.
This is an Open Access article distributed under the terms of the Creative Commons Attribution License (http://creativecommons.org/licenses/by/4.0/), which
permits unrestricted reuse, distribution, and reproduction in any medium, provided the original work is properly cited.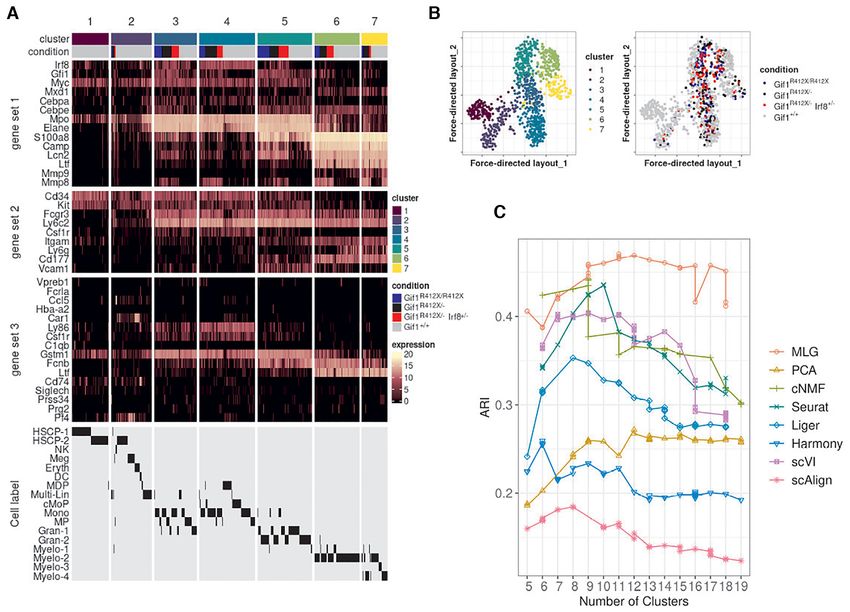
2 Nucleic Acids Research, 2021
graph (MLG) clustering as a general approach that borrows to scRNA-seq count matrices. For each cell i, let Lk (i) de-
strength among a variety of dimension reduction methods note the set of k nearest neighbors based on Euclidean dis-
instead of focusing on a single one that best preserves the tance across the d0 latent factor vectors. An edge is added
cell-type specific signal. MLG takes as input a set of low- to the undirected SNN graph (i.e. Aij is set to 1 in the corre-
dimensional embeddings of all the cells, integrates them into sponding adjacency matrix A) between cells i and j if their
a shared nearest neighbor graph with analytically provable number of common neighbors is larger than k, where is
improved signal-to-noise ratio, and clusters them with the a filtering threshold. The parameters k and determine the
Louvain algorithm, which has recorded outstanding per- sparsity level of the SNN graph. A large k and small lead
formances in benchmarks (15,16) and is also the default to a denser graph. While there is no optimal criteria to pick
these parameters, Von Luxburg (23) suggests k = O(n) to
Downloaded from https://academic.oup.com/nar/advance-article/doi/10.1093/nar/gkab823/6377404 by guest on 26 October 2021
clustering algorithm in many scRNA-seq analysis packages
such as Scanpy (17), Seurat (v2, v3) (7,18) and Liger (9). guarantee a connected graph. In the analyses provided in
MLG framework leverages a key observation that the near- this paper, we used k = 20 and = 1/5. We also showed
est neighbor graphs constructed from different dimension- with our simulation study that clustering accuracy is rela-
ality reductions of scRNA-seq data tend to have low depen- tively robust to the choice of k.
dence. A consequence of this observation, supported by an- Next, given G adjacency matrices {A(g) }, g = 1, ···, G, each
alytical calculations, is that the resulting multilayer integra- corresponding to an SNN from a low-dimensional embed-
tive scheme yields a combined cell graph with higher signal- ding, we aggregate them into a union adjacency matrix B as
to-noise ratio. We further corroborate this result with com- follows:
putational experiments using benchmark data and illustrate (g)
1 if Ai j = 1 for any g,
that MLG clustering outperforms current best practices for Bi j = (1)
jointly clustering cells from multiple stimuli and preserves 0 otherwise.
salient structures of scRNA-seq data from multiple condi- MLG then uses this resulting adjacency matrix B for clus-
tions. We illustrate this property of MLG clustering with tering with the Louvain modularity (13) maximization al-
an application to scRNA-seq data from mouse hematopoi- gorithm.
etic stem and progenitor cells (HSPCs) under two con-
ditions (with or without a Gata2 enhancer deletion)(19),
and from mouse HSPCs under four conditions (Gif1+/+ , Benchmark datasets
Gif1R412X/R412X , Gif1R412X/− , Gif1R412X/− Irf8+/− ) (20). Fi- We leveraged three public scRNA-seq datasets, summarized
nally, we showcase how MLG enables robust analysis of re- as (log-normalized) counts and with complementary char-
cent SNARE-seq (21) data which generates two data modal- acteristics, to benchmark MLG (Supplementary Tables S1
ities, accessible chromatin and RNA, within the same cells. and S2). The first dataset, that we refer to as Kowalczyk 1,
profiled transcriptomes of HSPCs among mice of differ-
MATERIALS AND METHODS ent ages (young at 2-3 months and old at 22 months) and
Overview of multilayer graph clustering (MLG) harbored cells from three hematopoietic stages: long-term
(LT)-HSC, short-term (ST)-HSC and multi-potent progen-
The MLG clustering algorithm is a general frame- itor (MPP) (24). We used this dataset for explicitly illus-
work that aggregates shared nearest neighborhood graphs trating how different dimension reduction algorithms op-
constructed from different linear and non-linear low- erate on scRNA-seq data across multiple conditions. An
dimensional embeddings of scRNA-seq data (Figure 1A). extended version of this dataset, labelled as Kowalczyk 2,
It takes as input G sets of low-dimensional embeddings of included additional LT-HSC and ST-HSC cells from inde-
the same dataset generated by different dimensionality re- pendent mice that were profiled months apart from the orig-
duction methods, with and/or without data integration for inal dataset. A third dataset from the HSPC system (25) in-
datasets across multiple conditions. Consequently, it con- cluded the same cell types (LT-HSC, ST-HCS and MPP)
structs and then aggregates SNNs from each of the G em- from young and old mice and with and without LPS+PAM
beddings and leverages Louvain modularity (13) maximiza- stimuli. This dataset (referred to as Mann) is an example
tion algorithm for the final clustering. Figure 1A depicts the with two factors at two levels and represents a setting with
workflow of the MLG with four existing scRNA-seq low- four experimental conditions. The third dataset, labelled as
dimensional embedding methods as inputs. Here, we con- Cellbench (26), included scRNA-seq data of 636 synthetic
sidered dimension reduction with PCA and consensus non- cells created from three human lung adenocarcinoma cell
negative matrix factorization (cNMF) (22) as representa- lines HCC827, H1975 and H2228. RNA was extracted in
tives of low-dimensional embeddings without data integra- bulk for each cell line. Then each cell line’s RNA was mixed
tion across multiple conditions, and Seurat (7) and Liger (9) in at seven different proportions and diluted to single cell
as representatives with data integration. Next, we describe equivalent amounts ranging from 3.75 to 30 pg.
the construction of the SNN graphs in detail.
Let D ∈ Rn×d0 , where n and d0 represent the number of
Aggregation of multiple SNNs boosts signal-to-noise ratio
cells and the dimension of latent factors, respectively, de-
note a low-dimensional embedding matrix. As in Figure 1 Next, we define a notion of signal-to-noise ratio for graphs
A, the matrix D can be obtained from principal compo- and show that MLG aggregation of SNNs boosts the
nent analysis (PCA), consensus nonnegative matrix factor- signal-to-noise ratio of the sparse graphs typically found in
ization (cNMF) (22) or low-dimensional embeddings from scRNA-seq analyses. We base our theoretical analysis on
scRNA-seq analysis packages such as scVI, Liger applied stochastic block models (SBMs) (27), which are generative
Nucleic Acids Research, 2021 3
Downloaded from https://academic.oup.com/nar/advance-article/doi/10.1093/nar/gkab823/6377404 by guest on 26 October 2021
Figure 1. Multilayer graph (MLG) clustering workflow with an illustration on the Kowalczyk 1 dataset. (A) MLG takes as input G different low-
dimensional embeddings to construct SNN graphs, aggregates the resulting graphs, and applies Louvain algorithm for clustering the aggregated graph.
The two scatter plots on the right visualize the MLG clustering results with a force-directed layout where the cells are labeled with their true labels (left) and
MLG clustering labels (right). (B) Visualization of the PCA, cNMF, Seurat integration and Liger factors with t-SNE coordinates. Cells are labeled accord-
ing to underlying experimental conditions (top row), cell types (middle row), and Louvain clustering assignments from SNN graphs constructed with each
dimension reduction method (bottom row). (C) Adjusted Rand Index (ARI) between true cell type labels and labels from clustering/knn classification.
random graph models that serve as canonical models for another. Furthermore, this intuition is supported by theory,
investigating graph clustering and community detection. In as Zhang et al. (28) prove that the performance of an op-
the view of SBMs, cells are represented as vertices in a bi- timal SBM estimator depends heavily on Ĩ. We provide a
nary graph with edges representing similarity between cells. rigorous explication of this theoretical result in the Supple-
The cells are assumed to reside in distinct communities de- mentary Materials Section 1.1.
termined by cell-type, and this community structure deter- We utilize this specific notion of signal-to-noise ratio to
mines the probability of an edge between cells. We denote investigate the impact of aggregation. Given adjacency ma-
the total number of cells (vertices) by n and the number trices A1 and A2 of two independent SBM graphs on the
of communities (clusters) by K. Let be a cluster assign- same set of cells and their union adjacency matrix B, we use
ment function where (i) corresponds to the cluster label superscripts to indicate parameters of each graph, e.g., θk A1
for cell i, and (i)(j) denotes the connectivity probability represents the connectivity probability of cells in cluster k
(i.e. edge probability) between cells i and j. Furthermore, and cells in cluster in graph A1 . In the realm of scRNA-seq
let in and out denote the minimum in-cluster and maxi- data A1 and A2 are usually quite sparse, i.e., with small θinA1
mum out-of-cluster connectivity probability. We define the
signal-to-noise ratio of the SBM as and θinA2 . If we further assume that θinA1 = θinA2 and θout
A1 A2
= θout ,
we arrive at the primary result of this section
(θin − θout )2
Ĩ := . (2) (2 − θinA1 − θout
A1 2
)
θin Ĩ B ≥ Ĩ A1 × , (3)
2 − θinA1
Intuitively, if the difference between the minimum in-cluster
and maximum out-of-cluster connectivity probabilities is which implies that the signal-to-noise ratio of the aggre-
large, it will be easier to distinguish communities from one gated SBM is nearly twice that of either of the base graphs,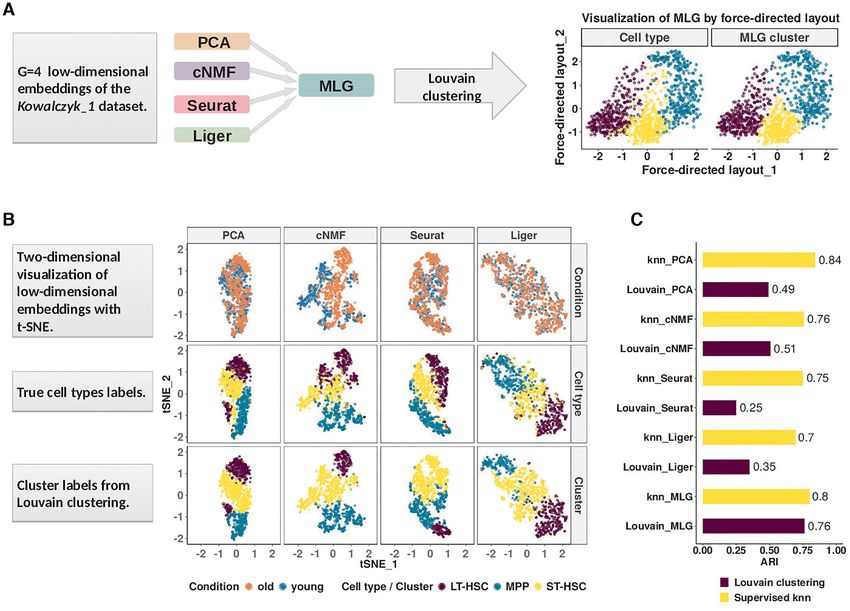
4 Nucleic Acids Research, 2021

A1 and A2 . We provide a detailed derivation of this result in                     cNMF. cNMF is applied through the code provided by
the Supplementary Materials Section 1.1.                                           (22) on Github https://github.com/dylkot/cNMF. Count
   This result on improved signal-to-noise ratio due to ag-                        matrices were provided as input for cNMF. Normalization
gregation is foundational for establishing operational char-                       and feature selection were carried out within the cNMF
acteristics of MLG. It assumes that the SBMs are both                              pipeline. The consensus analysis used 50 NMF runs.
sparse and independent of one another. As we show in the
Results section, empirical observation also supports this as-                      Seurat-integration. Following the Seurat tutorial, func-
sumption as SNN graphs are sparse, and we see only small                           tion SplitObject was used to split each dataset by
proportions of overlapping edges between SNN graphs of                             conditions, then FindIntegrationAnchors and In-

                                                                                                                                                    Downloaded from https://academic.oup.com/nar/advance-article/doi/10.1093/nar/gkab823/6377404 by guest on 26 October 2021
different low-dimensional projections. In the Supplemen-                           tegrateData were applied to integrate gene expression
tary Materials Section 1.2, we further show that dimen-                            across conditions. The integrated gene expression matrix
sion reduction leads to perturbation in the local neighbor-                        was scaled with function ScaleData. RunPCA was used
hood structure of the full-data (e.g. data prior to dimen-                         to reduce the dimensionality of the scaled and integrated
sion reduction) SNN graph. This, in turn, indicates that                           gene expression matrices.
the dependence between SNNs derived from different low-
dimensional projections is weak, and thus the overall as-                          Liger. Gene expression count matrices were normalized
sumptions of our result on the benefits of aggregation are                         with the R package rliger(1.0.0) function normal-
approximately met. This result also explains the empirical                         ize. Highly variable genes were chosen with select-
behavior concerning low proportions of overlapping edges                           Genes. Functions scaleNotCenter, optimizeALS,
between SNN graphs that we observe across our bench-                               quantile norm and louvainCluster were utilized to
marking datasets in the Results section.                                           scale gene expression, integrate data and cluster cells. We
                                                                                   used the low-dimensional embedding in data slot @H by
Signal-to-noise ratio estimation                                                   scaling it to have row sum of 1 in SNN graph construction
                                                                                   for MLG.
For benchmark datasets with true cell type labels, an em-
pirical version of signal-to-noise ratio for a given cell graph                    scAlign. Our application followed the tutorial of
can be calculated as:                                                              scAlign on Github https://github.com/quon-titative-
                                   (θ̂in − θ̂out )2                                biology/scAlign. To reduce computation time, we used
                       SNR =                              ,                        PCA factors as input for encoder neural networks.
                                            θ̂in
where θ̂in stands for the estimated minimum ‘within cell                           Harmony. We applied Harmony through the Seurat work-
type’ connectivity probability and θ̂out stands for the esti-                      flow with the RunHarmony function. nclust parameter
mated maximum ‘out-of-cell type’ connectivity probability.                         was set to the true numbers of clusters for both the simu-
Let A ∈ {0, 1}n × n denote the adjacency matrix of a cell                          lated and benchmark datasets.
graph with n cells from K cell types and let Ck denote the
set of cells in cell type k. Then, θ̂in and θ̂out are given by                     scVI. ScVI is implemented through the scVI python
                                                                                  package, available at https://scvi.readthedocs.io/en/stable/.
                                2 × i, j ∈Ck ,i < j Ai j                           We followed its ‘basic tutorial’ for model training, and used
              θ̂in = min                             ,                           sample latent factors as input for k-means or Louvain clus-
                     k∈{1,...,K} |Ck | × (|Ck | − 1)
                                                                                   tering.

                                       2×          i ∈C , j ∈C ,i < j   Ai j       Parameters common to all methods. We kept 3000 genes
        θ̂out =        max                        k
                                                                              .
                  k=,k,∈{1,...,K}         |Ck | × (|C |)                       for all the benchmark scRNA-seq datasets and 2500 genes
                                                                                   for the simulated datasets. We kept 15 latent factors from
                                                                                   all dimension reduction or data integration methods for the
Details on the execution of different scRNA-seq analysis
                                                                                   analysis of the benchmark scRNA-seq datasets. We applied
methods
                                                                                   k-means with the R function kmeans and set the numbers
PCA. PCA is implemented through the Seurat (ver-                                   of clusters to the true number of clusters for all the simu-
sion 3.1.4) package. Specifically, we used Seurat                                  lated and benchmark datasets. Louvain clustering was ap-
function NormalizeData to scale counts with a size fac-                            plied through Seurat::FindClusters. The resolution
tor of 10,000 and then performed log-transformation while                          was chosen through grid search until the target number of
adding a count of 1 to avoid taking log of 0. The functions                        clusters was met. The target number of clusters were set to
FindVariableFeatures and ScaleData were used to                                    the true numbers of clusters for the benchmark datasets.
find highly variable features and adjust for technical and bi-                     The numbers of clusters for Johnson20 and Muench20 was
ological effects, respectively. The condition labels and to-                       chosen by the eigengap heuristic (23).
tal gene counts were regressed out with ScaleData for all
simulated, benchmark, and application datasets. The per-
                                                                                   Differential expression analysis
centage of mitochondrial gene counts were also regressed
out for the dataset Johnson20. Each gene is scaled by its                          Differential expression analysis was carried out with func-
standard error of counts across cells before performing                            tion Seurat::FindMarkers using the ‘MAST’ algo-
PCA with the RunPCA function.                                                      rithm. In the case of multiple conditions per dataset, cluster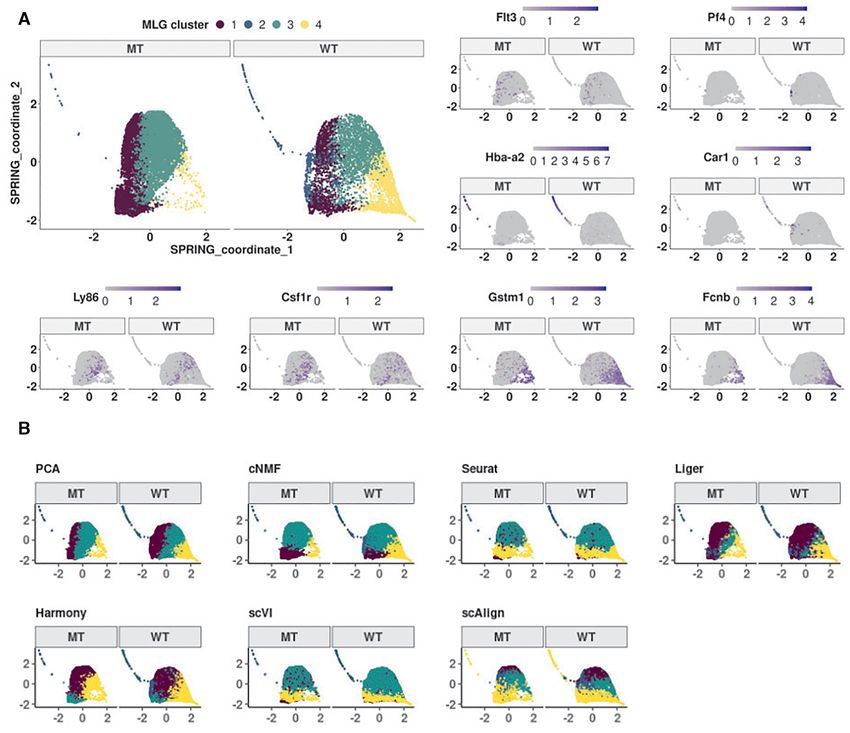
Nucleic Acids Research, 2021 5
markers were identified with a differential expression analy- Simulations
sis of cells from the same condition across different clusters
Our two main simulation set-ups are based on the com-
and the P-value was set to be the smallest among all condi-
monly used R package Splatter (31) for simulating
tions.
scRNA-seq data and an adaptation of the simulation setting
The precision-recall analysis was performed based on
of (22) which takes advantage of Splatter and allows dif-
gold standard cell type marker genes and cell type-specific
ferential expression across conditions. In the latter set-up,
DE genes across conditions, defined as having Bonferroni
the mean gene-expression profile for each cell is a weighted
corrected P-values 1} + ψ1w 1{ψw ≤1} . The DE ratio for gene w is
defined as δw := (1 − pw ) + pw pwd ψ̃1 + pw (1 − pwd )ψ̃w .
Metric for evaluating how well clusters delineate established W
w
lineage markers The GEP is given by G := λw × δw w=1 , where W is the
total number of genes. Here, λw and δw denote the base
In order to evaluate how well different clustering results de-
gene mean and DE ratio of gene w, respectively. This
lineate known lineage-specific marker gene expression, we
procedure can be used to simulate identity and activity
considered established lineage marker gene sets {gi }iM=1 and
GEPs, with slightly different set of parameters (, d , ,
cluster labels of the genes for clusters {1, 2, . . . , K}. For each
).
gene gi , we denoted the cluster in which gi is the most highly
3. Simulate mean gene expression for cell type t and condi-
expressed as Kgi . We then performed a two-sample differen-
tion c (t = 1, . . . , T, c = 1···C). Following the procedure
tial expression test with null hypothesis that the expression i denti ty i denti ty
of gi in and out of cluster Kgi are the same, and denoted in step 2, simulate identity GEP G1 , . . . , GT
acti vi ty acti vi ty
the resulting gene-level p-value as pgi . Next, we combined and activity GEP G1 , . . . , GA . Given activ-
the gene-level p-values using Fisher’s combined probability ity GEP weights {u atc }a=1 A
for cell type t and condi-
test. The Chi-squared test statistic for this combined test is tion c, the cell type and condition specific mean gene
defined as A tc acti vi ty
expression is defined as tc := a=1 u a Ga + (1 −
A tc i denti ty
M u
a=1 a )G t . Activity GEP weights control the
−2 ln ( pgi ) ∼ χ2M
2
. magnitude of condition effects.
i =1 4. Correct for library size. For cell k in cell type t and
condition c, sample the library size for cell k Lk ∼
Clustering methods resulting in larger Chi-squared test Lognormal(l , l ). The mean gene expression of cell k
statistic were considered as delineating the lineage markers after correction for the library size is kL := ( tc )T 1 × Lk .
tc
better. Specifically, we used the R package scran (ver-
sion 1.20.1) (29) to conduct the differential expression 5. Correct for biological coefficient of variation (BCV). Let
test instead of the R package Seurat to avoid truncation be the BCV dispersion parameter, df be the degrees
of the small P-values into 0 by Seurat. of freedom of the BCV inverse 2 distribution. The
BCV for gene w of cell k is sampled through the for-
mula Bk,w = (φ + 1/ L
k,w )(df/χdf )
2 1/2
. The BCV cor-
Gene set enrichment analysis rected mean for gene w of cell k is sampled by ∗k,w ∼
Gene set enrichment analysis was carried out with the R Gamma(1/Bk,w 2
, k,w
L 2
Bk,w ).
package topGO(version 2.36.0) using the Fisher’s 6. Generate counts. Sample counts for gene w of cell k
exact test and elim (30) algorithm. Yk,w ∼ Pois( ∗k,w ).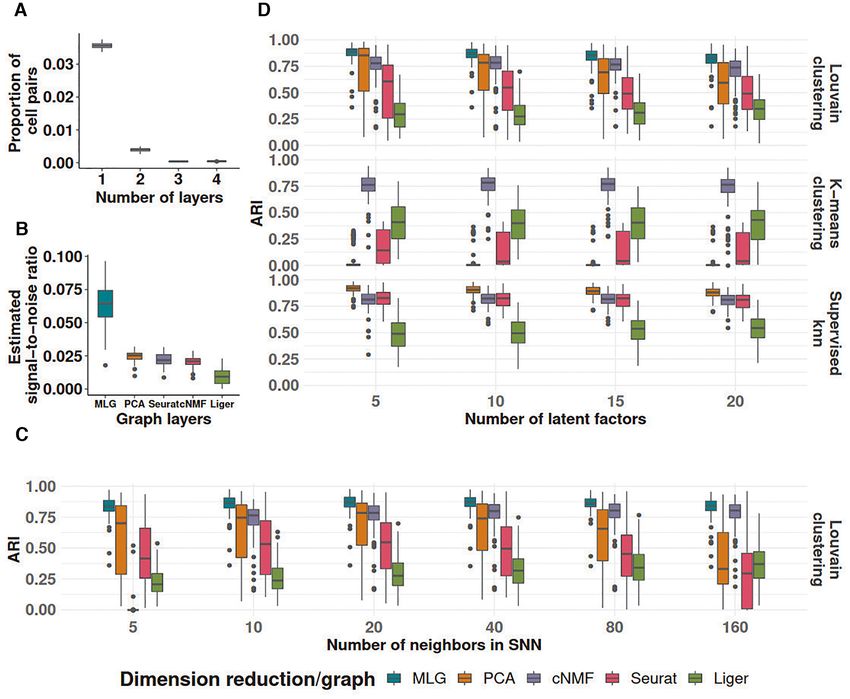
6 Nucleic Acids Research, 2021

   In order to make these simulations realistic, we                methods have an ARI higher than 0.51 when these low-
set the parameters in a data-driven way. Specif-                   dimensional embeddings are clustered (Figure 1C). In the
ically, the parameters of the simulation setting                   context of graph clustering, cells are partitioned so that cells
(α = 1.46, β = 1.48, π o = 0.091, μo = 2.82, σ o =                 within the same cluster are densely connected, while cells in
0.84, μl = 8.95, σ l = 0.45, φ = 0.11, df = 36.57)          are    different clusters are loosely connected. We observe for this
estimated from the Johnson20 dataset with the Splat-               dataset that, with dimension reduction without data inte-
ter package. We considered four settings to explore the            gration, the clustering algorithm tends to separate cells un-
robustness of MLG to different magnitude of condition              der different conditions, e.g., old and young LT-HSCs with
effects and its ability to identify rare cell types (condition     cNMF factors. However, after Seurat and Liger data inte-

                                                                                                                                      Downloaded from https://academic.oup.com/nar/advance-article/doi/10.1093/nar/gkab823/6377404 by guest on 26 October 2021
specific parameters are summarized in the Supplementary            gration, graph clustering tends to separate MPP cells into
Table S3). By varying the magnitudes of the stimulus               different clusters. To leverage strengths of different dimen-
effect with the weight of the activity GEPs, we evaluated          sion reduction strategies, MLG clustering first constructs
operating characteristics in the the cases with large (settings    shared nearest neighbor graphs (SNNs) from each of the
1, 3) and small (settings 2, 4) condition effects. Similarly,      low-dimensional embeddings. Then, it aggregates the adja-
by varying the proportions of cells in simulated cell types,       cency matrix of the resulting graphs with a union operation
we assessed performances in cases with both balanced cell          and employs modularity maximization (13) to cluster the re-
proportions (settings 1, 2) and rare cell types (settings 3, 4).   sulting graph. By aggregating the SNNs obtained from each
   An additional set of simulations, settings 5-8, are gen-        dimension reduction approach, MLG boosts the signal-to-
erated by Splatter, with designs similar to settings 1-4           noise ratio and improves the ARI from individual methods
(Supplementary Table S4). However, the advantage of the            by 25% to 0.76.
set-up with settings 1-4 is its ability to generate more nu-          In the following sections, we first provide explicit ex-
anced condition effects than the Splatter simulated ‘batch         amples supporting the analytical underpinnings of MLG
effects’. Splatter enables generation of multiple conditions       clustering as outlined in the Methods section and demon-
in the form of batch effects by multiplying gene expression        strate how different low-dimensional embeddings can com-
with a ‘differential expression ratio’. Such an effect tends to    plement each other. We then evaluate MLG clustering on
be easy to remove by regressing out the batch labels in the        both simulated and benchmark datasets and compare it
preprocessing step (Supplementary Figures S5 and S7).              with state-of-the-art methods. Next, we discuss a weight-
                                                                   ing scheme to enable incorporation of additional low-
                                                                   dimensional embeddings into MLG and illustrate how this
RESULTS                                                            weighting scheme provides robustness. We showcase MLG
                                                                   in two separate scRNA-seq applications involving cells
The multilayer graph (MLG) clustering algorithm
                                                                   from two (19) and four different conditions (20), respec-
We first present a detailed illustration of MLG on the             tively. We further discuss how MLG can also be adapted be-
Kowalczyk 1 dataset (hemotapoitic stem and progenitor              yond the analysis of scRNA-seq to SNARE-seq (21) which
cells from young and old mice). The first and second rows in       profiles transcriptome and chromatin accessibility from the
Figure 1B depict the two-dimensional visualizations of the         same cells simultaneously.
low-dimensional embeddings of the Kowalczyk 1 dataset
with t-SNE (32) labeled by condition and cell types, re-
                                                                   Aggregating signal from shared nearest neighbor graphs of
spectively. The third row presents the Louvain clustering
                                                                   multiple low-dimensional embeddings boosts the ‘signal-to-
labels for each embedding. A direct comparison of the
                                                                   noise’ ratio
second and third rows illustrates the inaccuracies of each
method for cell type identification. A similar visual illus-       A challenging aspect of generating low-dimensional em-
tration of the MLG results is provided in the right most           beddings of scRNA-seq data across multiple conditions
panel of Figure 1A. To evaluate the performances of these          is that, different dimensionality reduction methods might
low-dimensional embeddings independent of clustering, we           capture different aspects of the data. As a result, graph
followed a supervised approach. We leveraged a k-nearest           representations of the data constructed for downstream
neighbor (knn) classifier to classify the cells, and computed      clustering might vary significantly between different lower-
the commonly used metric adjusted Rand index (ARI, (33))           dimensional embeddings. In the HSCs of old and young
between predicted class labels and the true labels. The ARI        mice (Kowalczyk 1 from Figure 1), SNN graphs constructed
values from the knn classification represent the best achiev-      from PCA and cNMF factors of the gene expression count
able performances with these low-dimensional embeddings.           matrix (with and without data integration across condi-
In addition to this, we also quantified the clustering perfor-     tions) have small proportions of overlapping edges (Fig-
mance of each method by ARI (Figure 1C).                           ure 2A). Specifically, SNN graphs from any two low-
   The ARIs of the knn classifier with PCA and cNMF fac-           dimensional embeddings, except the pair PCA and Seurat-
tors are 0.84 and 0.76, whereas the ARI of knn classifier          integration, which also performs PCA as the final dimen-
with Seurat and Liger integrated data are 0.75 and 0.70,           sion reduction, have at most 30% of their edges overlap-
respectively. While PCA and cNMF keep cells from the               ping, indicating low dependence between these construc-
same cell type close to each other in their respective low-        tions. One possible reason for this, as we argue analytically
dimensional spaces, Seurat and Liger perform similarly well        in the Supplementary Materials Section 1.2, is that dimen-
in aligning data across conditions. However, all four meth-        sion reduction alters neighbors of cells. Furthermore, we
ods exhibit cell type mix-up and, as a result, none of the         also observe that all of the constructions tend to be sparse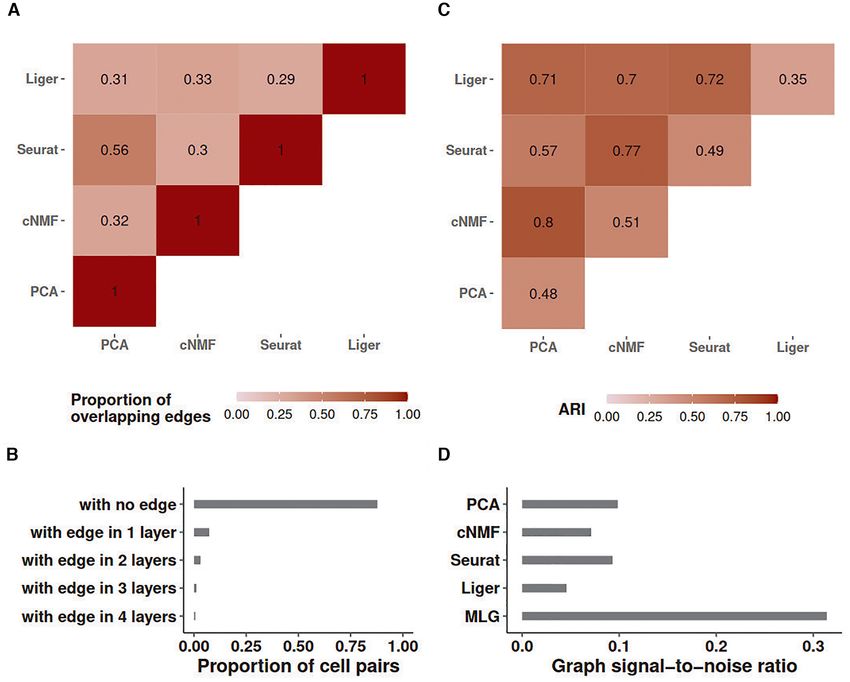
Nucleic Acids Research, 2021 7

                                                                                                                                                        Downloaded from https://academic.oup.com/nar/advance-article/doi/10.1093/nar/gkab823/6377404 by guest on 26 October 2021
Figure 2. Graph characteristics of SNN graphs and the multilayer graph of the Kowalczyk 1 dataset. (A) Heatmap of the proportion of overlapping edges
between pairs of SNN graphs from different low-dimensional embeddings. (B) Proportion of cell pairs with edges across aggregation of individual SNN
graphs from PCA, cNMF, Seurat and Liger low-dimensional embeddings. The number of layers represents the total number of individual SNN graphs
that harbor edges between the cell pairs. (C) ARI of MLG clustering constructed by pairs of SNN graphs from the low-dimensional embeddings indicated
as the rows and columns. Diagonal entries represent ARIs of SNN graph clustering from individual low-dimensional embeddings. (D) Estimated graph
signal-to-noise ratios of individual SNN graphs and their multilayer graph.

as indicated by the proportion of cell pairs with no edges in                dings (e.g. Liger alone achieves an ARI of 0.35 whereas
the individual SNN graphs (bar labelled as ‘with no edge’                    MLG with Liger and PCA low-dimensional embeddings as
in Figure 2B).                                                               its two layers achieves 0.71). As expected, since the SNN
   Leveraging these empirical observations and recent ad-                    graphs constructed with PCA and Seurat have more over-
vancements in stochastic block models, we show in the Sup-                   lapping edges (56%), their 2-layer MLG results in the least
plementary Materials Section 1.1 that aggregating two suf-                   improvement in ARI with a value of 0.57 compared to 0.48
ficiently sparse graphs with independent edges by taking                     and 0.49 with PCA and Seurat alone.
union of their edges leads to a graph with amplified ‘signal-                   A majority of cell pairs (88%) do not have edges in any of
to-noise’ ratio. Here, as we presented in the Methods sec-                   the four layers of the SNN graph constructed from aggre-
tion, we are using a notion of ‘signal-to-noise’ that refers                 gation of PCA, cNMF, Seurat-integration, and Liger SNN
to difference in connectivity of cells that are within the                   graphs (Figure 2B). This is due to sparsity of individual
same cluster (i.e. cell type/stage) versus that are in differ-               SNN graphs. Furthermore, about 67% percent of the cell
ent clusters. Figure 2C presents ARI values of MLG clus-                     pairs with edges, have edges in only one layer, suggesting
tering based on pairs of SNN graphs (off-diagonal entries)                   that different dimension reduction methods are capturing
and those of clusterings based on individual SNN graphs                      distinct features of the data. Aggregating the four layers
(diagonal entries). We observe that all the 2-layer MLG                      with union operation increases the signal-to-noise ratio to
applications have improved clustering performance com-                       three times of any single SNN graph layer (Figure 2D). A di-
pared to SNNs from individual low-dimensional embed-                         rect impact of this is increased clustering accuracy by MLG
8 Nucleic Acids Research, 2021
compared to clustering of SNN graphs from individual low- mension reduction methods and SNN graph construction
dimensional embeddings. In fact, MLG clustering almost depend on key parameters such as the numbers of latent
achieves the accuracy of supervised knn classifiers (0.76 ver- factors and numbers of neighbors, we varied these param-
sus 0.80, Figure 1C). eters in a wide range and observed robustness of MLG to
the choice of these two parameters (Figure 3C, D).
Simulation setting 2 explores the case when the condition
Increased ‘signal-to-noise-ratio’ by MLG aggregation trans-
effect is relatively small (Supplementary Figure S2, with
lates into significant improvements in clustering accuracy and
an average between conditions mixing metric of 13.4) and,
stability in computational experiments
therefore, data integration is not required. The MLG re-
Downloaded from https://academic.oup.com/nar/advance-article/doi/10.1093/nar/gkab823/6377404 by guest on 26 October 2021
To systematically evaluate the ability of MLG in improv- sult with only two layers (PCA and cNMF) is presented
ing clustering performance over clustering with individual in Supplementary Figure S1. There is an average of 15%
graphs from specific low-dimensional embeddings, we con- and 11% increase in ARI over Louvain clustering using
ducted simulations from the settings described in Materials only PCA and cNMF factors (Supplementary Figure S1D).
and Methods. We present here detailed results from setting The clustering performance is also robust over a wide range
1 which is an adaptation of the general simulation setting of numbers of latent factors and numbers of neighbors
from (22) where cell types exhibited condition specific ef- (Supplementary Figure S1C, D). Simulation settings 5 & 6,
fects. We generated multiple simulation replicates (100 for with similar designs to settings 1 & 2, are generated using
simulation settings 1 & 2 and 50 for settings 3-8), where each Splatter (Supplementary Figure S5) and include con-
replicate included a total of 2500 cells from three cell types dition effects that can be captured and removed by PCA.
and across two conditions. In these settings, MLG and PCA have better performances
We considered four different dimension reduction pro- than cNMF, Seurat and Liger (Supplementary Figure S6).
cedures for MLG: PCA and cNMF, which do not per- In addition to simulations investigating large and small con-
form comprehensive data integration, Seurat and Liger dition effects (settings 1, 2, 5 and 6), we also assessed the
both of which perform data integration for cells from dif- impact of rare cell types (settings 3 & 4, Supplementary Fig-
ferent conditions. We varied the apparent parameters of ure S3; settings 7 & 8, Supplementary Figure S7). We used
each method such as the numbers of PCA and NMF com- both the Adjusted Rand Index (ARI) and probability of
ponents and numbers of neighbors in the construction of identifying rare cell types as performance metrics. For each
SNN graphs. To compare with the MLG clustering, we ap- simulated dataset, a method is deemed to successfully iden-
plied both k-means and Louvain clustering on the SNN tify the rare cell type if the corresponding results included
graphs constructed by the individual low-dimensional em- a cluster with more than 80% of its cells coming from the
beddings from these methods. Furthermore, we employed a rare cell type. Then, the probability of identifying a rare cell
supervised k-nearest neighbor classifier to establish the best type for a method is the average rate of rare cell type identi-
achievable clustering performance for each graph in terms fication across all simulated datasets. As depicted in Supple-
of ARI. mentary Figures S4 and S8, MLG presents advantages over
We first assessed the level of dependence between the other methods in ARI and yields a rare cell types identifi-
SNN graphs constructed from these four low-dimensional cation probability comparable to its best composite layer.
embeddings across the simulation replicates and observed
that the majority of the cell pairs were connected only in
MLG clustering outperforms other methods in recovering
one of the SNN graphs. Specifically, only 3.6% of the pairs
known biological signal
connected in at least one layer were common to all 4-layers
(Figure 3A), a level comparable to 5.7% in the Kowalczyk 1 We next compared MLG clustering to state-of-the-art
benchmark dataset (5.7% is calculated by ‘with edge in four scRNA-seq dimension reduction and data integration
layers’ as a percentage of all pairs with edge in at least one methods on the benchmark datasets with cells from mul-
layer in Figure 2B). Furthermore, the estimated signal-to- tiple conditions and ground truth cell type labels, namely
noise ratios of each graph supported the signal boost by Kowalczyk 1, Kowalczyk 2, Mann and Cellbench (Figure 4).
MLG (Figure 3B). Figure 3D summarizes the ARI values of These datasets exhibit different levels of difficulty for clus-
supervised knn, Louivan and k-means clustering with each tering based on the average mixing metric (7), which ranges
individual low-dimensional embedding as a function of the from 5 to 300 and quantifies how mixed different group of
numbers of PCA/cNMF components across the simula- cells are (Figure 4 A). The separations between conditions
tion replicates. We observe that MLG provides a median in- are relatively small in datasets Kowalczyk 1, Kowalczyk 2,
crease of 13%, 9%, 34% and 55% in ARI compared to Lou- Cellbench, indicating that condition specific responses of
vain clustering of individual PCA, cNMF, Seurat and Liger- cells do not dominate over their cell type-specific expres-
based low-dimensional embeddings, respectively (first row sion programs, and are markedly large in Mann with av-
of Figure 3D). Improvement in ARI by the MLG cluster- erage mixing metrics of 10.3, 12.0, 13.7 and 27.0, respec-
ing with the Louivan algorithm is even higher (median levels tively. In contrast, separations between cell types are low
of 85%, 9%, 80% and 45%) compared to k-means cluster- in Mann and high in Cellbench, with average mixing met-
ing of the low-dimensional embeddings by each of the four rics of 41.8 and 278.7, respectively. This exposition of con-
methods (first versus second rows of Figure 3C). Further- dition and cell type separation levels indicate that Cell-
more, MLG yields accuracy levels that are comparable to bench is the easiest to cluster and Mann is the hardest. In
those of best knn accuracy in a supervised setting by these these benchmarking experiments, we extended the set of
four methods (third row of Figure 3D). Since both the di- methods we considered to include Harmony integration,Nucleic Acids Research, 2021 9
Downloaded from https://academic.oup.com/nar/advance-article/doi/10.1093/nar/gkab823/6377404 by guest on 26 October 2021
Figure 3. Simulation results for the ‘large-condition-effect’ setting. (A) Proportions of cell pairs with edges across different numbers of layers of MLG
constructed from SNN graphs of PCA and cNMF, Seurat, and Liger (with 20 neighbors in SNN graphs and 10 latent factors in low-dimensional em-
beddings). The boxplots depict the proportions across all the simulation replicates. (B) Estimated signal-to-noise ratios of SNN graphs constructed from
different low-dimensional embeddings and their multilayer graph across all the simulation replicates (with 20 neighbors in SNNs and 10 latent factors in
low-dimensional embeddings). (C) Louvain clustering accuracy of SNN graphs as a function of numbers of neighbors in SNN graph construction (with
10 latent factors in low-dimensional embeddings). (D) Adjusted Rand index comparison of Louvain and k-means clustering of SNN graphs from different
low-dimensional embeddings and their MLG as a function of number of latent factors in the low-dimensional projections (with 20 neighbors in SNN
graphs). ARI values of supervised knn classifiers for individual SNN graphs are provided as reference.
scVI batch correction, and scAlign integration in addition Kowalczyk 1, Kowalczyk 2, and Mann. Harmony, Seurat
to PCA and cNMF dimension reduction, Seurat integra- and PCA perform well for Cellbench which is an easier
tion, Liger integration. We performed both k-means cluster- dataset in terms of clustering since the separation between
ing with the latent factors estimated from these dimension the cell types is large (Figure 4A). MLG clustering outper-
reduction/data integration methods and also Louvain clus- forms the alternatives across all datasets with a minimum
tering with graphs constructed from their low-dimensional of 13% and a maximum of 64% increase in ARI. Each clus-
embeddings (with package default weighted SNN for Seu- ter identified by MLG has a dominating cell type, as de-
rat, package default SFN graph for Liger, unweighted SNN picted in Supplementary Figure S12. Furthermore, as ap-
graphs for all other methods). As an overall measurement parent from the Louvain clustering results of individual
of the difficulty of the clustering task, we performed super- low-dimensional embeddings in Figure 4B, MLG does not
vised knn classification using SNN/SFN graphs and ob- require each individual SNN graph it aggregates over to
served largely similar supervised knn accuracy from differ- perform well. For example, while Seurat, Liger, PCA and
ent low-dimensional embeddings (Figure 4B) (with scAlign cNMF have individual ARIs of 0.35, 0.11, 0.10, 0.00, re-
on Cellbench and Mann datasets as notable exceptions). The spectively, by combining SNN graphs resulting from these,
accuracies of k-means and Louvain clustering with graphs and boosting signal-noise-ratio, MLG outperforms their in-
from individual low-dimensional embeddings are markedly dividual performances with an ARI of 0.51 for the Mann
lower than their corresponding knn classifiers for datasets dataset that appears to be the most challenging to cluster.10 Nucleic Acids Research, 2021
Downloaded from https://academic.oup.com/nar/advance-article/doi/10.1093/nar/gkab823/6377404 by guest on 26 October 2021
Figure 4. Evaluation with benchmark datasets. (A) Average mixing metric between cell types (x-axis) and conditions (y-axis) for the four benchmark
datasets. The mixing metric ranges between 5 and 300, with larger values indicating large separation between the groups (e.g. cell types or conditions).
(B) Louvain and k-means clustering accuracy of different methods across the benchmark datasets. Supervised knn classification for SNN graphs from
each low-dimensional embedding is provided as a measure of the difficulty of the clustering task. (C) Comparison of the 4-layer MLG (PCA, cNMF,
Seurat-integration, Liger) with the 2-layer MLG (PCA, cNMF) across the benchmark datasets.Nucleic Acids Research, 2021 11
We leveraged these benchmark datasets to further in- balanced case (labeled as 1 in Figure 5A), 4-layer MLG suf-
vestigate the impact of different low-dimensional meth- fers from accuracy loss because of mis-aligned cells in inte-
ods aggregated by MLG. Figure 4C displays the ARI val- gration; however, it still performs better than using just one
ues of 2-layer MLG which aggregates over only PCA and layer of integrated data.
cNMF and 4-layer MLG which also aggregates over low-
dimensional embeddings from data integration with Seurat
MLG clustering across multiple stimuli leads to more power-
and Liger. Empirically, when condition separation, as mea-
ful downstream differential expression analysis
sured by the average mixing metric and also visualized by
tSNE or UMAP visualizations of the data prior to integra- We evaluated the impact of improvement in clustering ac-
Downloaded from https://academic.oup.com/nar/advance-article/doi/10.1093/nar/gkab823/6377404 by guest on 26 October 2021
tion, is low as in Kowalczyk 1, Kowalczyk 2 and Cellbench curacy by MLG clustering on the downstream analysis of
datasets, the two MLG strategies perform similarly; how- identifying marker genes of individual cell types and cell
ever, for datasets with larger separation between conditions type-specific differentially expressed (DE) genes across con-
(Mann), MLG benefits significantly from aggregating over ditions. We first generated ‘gold standard’ marker genes and
low-dimensional embeddings from data integration. lists of differentially expressed genes using the true labels of
the cells in the benchmark datasets (Materials and Meth-
ods). Next, we identified cluster-specific marker genes and
MLG strategy is robust to imbalanced cell type representa-
lists of DE genes across conditions using the cluster as-
tions across conditions
signments obtained with MLG clustering and the alterna-
When considering scRNA-seq datasets across multiple con- tive methods used for the benchmark datasets. We eval-
ditions, a key challenge is the ability to identify distinct cell uated whether more accurate separation of the cell types
types in cases with varying levels of representation of cell by MLG leads to marker and DE gene identification that
types under different conditions. Among the benchmark aligns better with the gold standard sets with precision-
datasets we considered, Kowalczyk 1 and Mann have rel- recall (PR) curves (Figure 5B for the Kowalczyk 1 datasets,
atively balanced cell types in different conditions. Specif- Supplementary Figures S10, S11 for the Kowalczyk 2 and
ically, in the Kowalczyk 1 dataset, the three different cell Mann datasets). Overall, MLG exhibits better PR values for
types (LT-HSC, MPP, ST-HSC) vary at proportions of both cell type marker and condition DE gene identification
(0.17, 0.18, 0.18) and (0.16, 0.16, 0.15) among the old and across multiple datasets. More specifically, MLG is the only
young mice, respectively. Similarly, in the Mann dataset, the method with moderate to high precision-recall in identify-
three different cell types (LT-HSC, MPP, ST-HSC) vary at ing cell type marker genes for ST-HSC, whereas all other
proportions of (0.11, 0.02, 0.09), (0.12, 0.05, 0.12), (0.04, methods perform poorly in identifying marker genes spe-
0.03, 0.07) and (0.10, 0.10, 0.14) among the old-no-stimuli, cific to this cell type (Figure 5B).
old-stimuli, young-no-stimuli and young-stimuli mice con-
ditions, respectively. Taking advantage of these balanced
A weighting scheme enables robust incorporation of addi-
datasets, we conducted a computational experiment to in-
tional composite layers to MLG
vestigate performance under imbalanced cell type represen-
tations across the conditions. Specifically, we subsampled We have considered four scRNA-seq dimension reduction
‘old MPP’ cells in Kowalczyk 1, and ‘old-stimuli-MPP’ cells methods to provide composite layers for MLG based on
in Mann, at proportions 0, 0.10, 0.25, 0.50, 0.75 and 1 of the (i) how well they are already adapted by the community
original size, where 1 corresponded to the original dataset. (PCA, Seurat); (ii) the type of dimension reduction they em-
Figure 5A reports the mean, 5, and 95 percentiles of the ploy (NMF based cNMF and Liger in addition to PCA);
ARI values across 20 sub-sampling replications for the 2- and (iii) whether or not they have built in data integration
layer MLG (PCA and cNMF), 4-layer MLG (PCA, cNMF, (Seurat, Liger). The second reasoning is based on our an-
Seurat, Liger) and Louvain and k-means clustering with alytical result (Supplementary Materials Sections 1.1, 1.2)
PCA, cNMF, Seurat, Liger, Harmony latent factors. For that aggregating results from different dimension reduction
Kowalczyk 1, 2-layer MLG outperforms other methods and methods that lead to sparse and independent shared nearest
is robust to the imbalance of the cell types between condi- neighbor graphs improves the signal-to-noise ratio. We also
tions. PCA and cNMF can accommodate the small sepa- evaluated construction of MLG with scVI, Harmony, and
ration between conditions of this dataset without any ex- scAlign, and decided not to utilize these methods in con-
plicit data integration (Figure 4B). However, methods uti- structing MLG. Harmony and scVI both show moderate
lizing data integration are affected by the misalignment of dependencies with PCA in multiple datasets (their average
cells, which in turn reduces their clustering accuracy (Seu- proportion of overlapping edges with PCA-SNN graph are
rat, Liger). The 4-layer MLG is also relatively robust to 63% and 45%, respectively, in the benchmark datasets), and
cell type imbalance despite its aggregation over Seurat and are therefore excluded to ensure low dependence between
Liger, and outperforms clustering with all individual low- the dimension reduction methods as required by the analyt-
dimensional embeddings in accuracy and stability. Since the ical calculations that support improved signal-to-noise ratio
Mann dataset has larger separation between conditions, ag- (Supplementary Materials Section 1.1). scAlign using PCA,
gregation over only methods without data integration (2- or CCA as input are correlated with PCA and Seurat results.
layer MLG) results in similarly poor performance as PCA While scAlign allows using gene expression without initial
and cNMF. In contrast, the 4-layer MLG, by aggregating dimension reduction as input, such an execution is compu-
over data integration methods Seurat and Liger in addition tationally expensive (55 min of elapsed time, 25 h of CPU
to PCA and cNMF, has the highest ARI. Compared to the time for a dataset of 1000 cells).12 Nucleic Acids Research, 2021
Downloaded from https://academic.oup.com/nar/advance-article/doi/10.1093/nar/gkab823/6377404 by guest on 26 October 2021
Figure 5. Robustness analysis of clustering over imbalanced samples and downstream impact of MLG clustering on marker gene identification. (A)
Adjusted Rand index from Louvain and k-means clustering of low-dimensional embeddings with varying levels of imbalance in the proportion of cells
from different cell types. For the Kowalczyk 1 and Mann datasets, varying proportions of MPP cells from the ‘old’ and ‘old, stimulated’ conditions were
subsampled for the respective analysis. Reported ARI values correspond to mean, 5 and 95 percentiles across 20 subsampling experiments. (B) Differential
expression analysis for cell type/cluster marker gene identification and condition (young versus old) DE gene identification in the Kowalczyk 1 dataset.
The precision-recall (PR) values in the top panel evaluate inferred cluster (i.e. cell type) marker genes of each method against cell type marker genes defined
with ground truth cell type labels as gold standard. The bottom panel evaluates the inferred condition (i.e. age) DE genes of each cell type against the
gold standard. Gold standard cell type marker and age DE genes are defined as genes with Bonferroni corrected P-values less than 0.01 in the differential
expression analysis with ground truth cell labels. The PR values are reported at cutoffs of 0.2, 0.1, 0.05, 0.01 and 0.001 for Bonferroni adjusted p-values in
the cluster marker gene and age DE gene identification analysis.Nucleic Acids Research, 2021 13
In extending our benchmarking experiments to include neutrophils, and Pf4 for megakaryocytes (Figure 6A). Over-
additional layers, we observed that the improvement in ac- all, cells in different clusters exhibited expression patterns of
curacy of MLG starts to get ‘saturated’ after adding four documented lineage markers (37) consistent with their in-
layers with PCA, cNMF, Seurat, and Liger (Supplemen- ferred cluster labels (Supplementary Figure S15). Further-
tary Figure S27). To enable potential integration of addi- more, an unbiased marker gene analysis of each MLG clus-
tional dimension reduction methods by users, we developed ter with MAST (38) (Supplementary Figure S14) yielded
and evaluated a weighting scheme (Supplementary Mate- marker genes. A gene set enrichment analysis with top 50
rials Section 1.3). Weighted MLG evaluates each dimen- marker genes of each cluster agreed with the MLG clus-
sion reduction result using their knn graph’s ability of incor- ter labels based on known lineage markers (Supplementary
Downloaded from https://academic.oup.com/nar/advance-article/doi/10.1093/nar/gkab823/6377404 by guest on 26 October 2021
porating cells from different conditions and predicting the Figure S23).
gene expression profiles of neighboring cells. In simulation Next, we compared MLG clusters with Louvain cluster-
settings 3, 4, 7, and 8, it yields higher rare cell type iden- ing of the cell graphs constructed from PCA, cNMF fac-
tification probability (with an average improvement of 9% tors, Seurat-integration, Liger, Harmony, scVI and scAlign
over MLG across all the rare cell type simulation settings) (Figure 6B). cNMF, Seurat-integration, Liger, Harmony,
and better protection over irrelevant layers (Supplementary scVI and scAlign tended to partition the cells based on
Figure S9). Collectively, this suggests that weighted MLG their mitochondrial gene expression. Specifically, the clus-
provides a robust way of incorporating additional layers to ters in cNMF, Seurat-integration, Liger, Harmony, scVI
MLG beyond the four core methods (PCA, cNMF, Seu- and scAlign are driven by the mitochondrial gene expres-
rat and Liger) we have extensively utilized and evaluated. sion patterns apparent in the SPRING plot (Supplementary
Figure S13). Concordant with these partitions, the top 10
marker genes for cNMF cluster 1, Seurat-integration clus-
MLG clustering confirms disrupted differentiation patterns
ter 4, Liger cluster 2, Harmony cluster 3, scVI cluster 4
in HSPCs lacking the murine Gata2 -77 enhancer
and scAlign cluster 4 have 5, 7, 7, 2, 7 and 7 mitochon-
We utilized MLG clustering to analyze scRNA-seq data of drial genes, respectively. While it is possible to adjust for
hematopoietic progenitor cells sorted from E14.5 fetal liv- mitocondrial gene expression of the cells for some settings
ers of −77+/ + (wild type, WT) and −77−/ − (mutant, MT) such as PCA, the Seurat-integration framework does not
murine embryos (dataset Johnson20 from (19)). The mu- enable adjustment for biological variables in its CCA fac-
tant condition corresponded to homozygous deletion of the tors. Methods including cNMF, Liger, scVI, scAlign do not
murine Gata2 −77 enhancer, located −77 kb upstream of encompass mechanisms to adjust for potential continuous
the Gata2 transcription start site, as described in (19). The confounders. While the clustering of the low-dimensional
samples from both WT and MT mice included a complex embedding from PCA is similar to the MLG clustering, it
mixture of progenitors with diverse transcriptional profiles merges cells expressing Gata2 and erythroid specific-gene
(34) from a pool of common myeloid progenitor (CMP) and Car1 with cluster 1 that represents early progenitors (Sup-
granulocyte-monocyte progenitor (GMP) cells and resulted plementary Figures S15, S16) and results in a markedly
in 14,370 cells after pre-processing (19). Exploratory analy- smaller cluster of erythroid cells. In addition to these dif-
sis with the data visualization tools t-SNE (32), UMAP and ferences, established lineage markers do not delineate clus-
SPRING (35) revealed a small separation between the cells ters from cNMF, Seurat-integration, Harmony, scVI and
from the wild type and mutant conditions and an average scAlign as expressing cell type specific marker genes as
mixing metric of 15.25. Furthermore, Johnson et al. (36) clearly as MLG clustering (Supplementary Figures S16,
previously showed that −77+/ + fetal liver CMPs have the S17, S18, S19, S20, S21, S22). As a quantitative measure of
potential to differentiate into erythroid and myeloid cells how well lineage marker genes delineate clusters obtained
ex vivo. In contrast, the mutant −77−/ − CMPs and GMPs with different methods, we provide the Chi-squared statis-
generate predominantly macrophage progeny. This insti- tic of Fisher’s combined probability test for these genes in
gated us to proceed with clustering of the cells without data Supplementary Table S7, which further highlights the better
integration since the subsampling experiments with bench- performance of MLG. Collectively, this analysis illustrates
mark datasets highlighted that data integration may cause the power of MLG in identifying cell types/stages with low
misalignment of cells in this setting with potentially imbal- signal by its aggregation strategy.
anced cell types.
We constructed a multilayer graph from PCA (after re-
MLG uncovers cell stages in mouse HSPC under four exper-
gressing out total counts, mouse batch effects, and percent-
imental conditions
age count of mitochondrial transcripts) and cNMF fac-
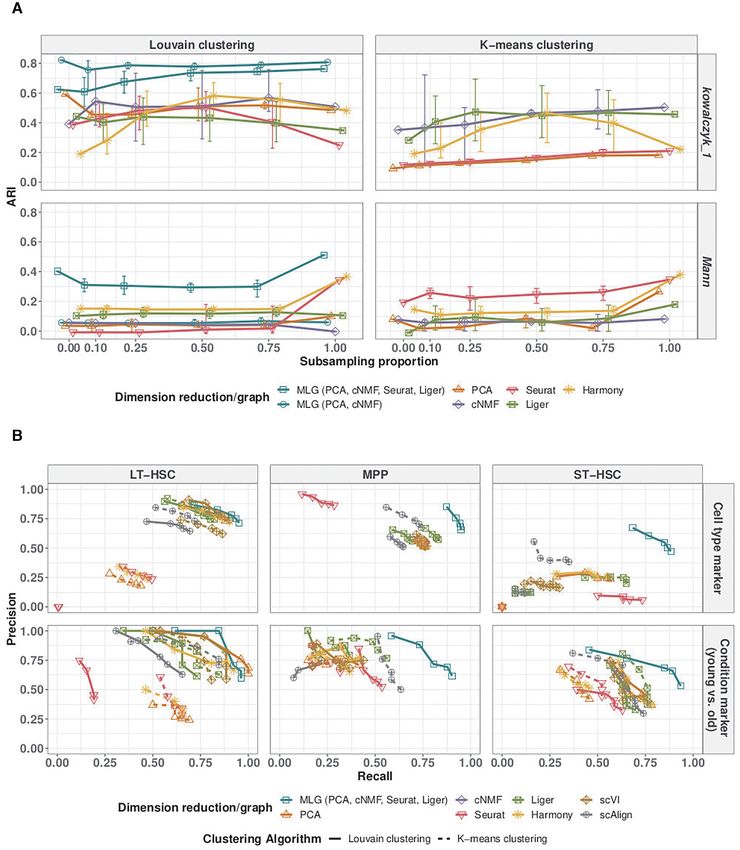
tors. Figure 6A displays the SPRING visualization of the Dataset Muench20 (20) contains scRNA-seq of 813
MLG clustering with four optimally chosen clusters based mouse hematopoietic progenitor cells under 4 condi-
on the eigengap heuristic (23), and also highlights pseudo- tions: wild type (Gif1+/ + ), heterozyous Gfi1 R412X mu-
time trajectories of the wild type and mutant cells. We tation (Gif1R412X/ − ), homozygous Gfi1 R412X mutation
linked these clusters to established cell populations as (i) (Gif1R412X/R412X ), heterozygous Gfi1 R412X mutation and
CMP, (ii) erythroid/megakaryocyte, (iii) bipotential GMP one silenced Irf8 allele (Gif1R412X/ − Irf8+/ − ). Joint di-
and monocyte, (iv) neutrophils, by leveraging established mension reduction was conducted on all the cells, with
lineage defining markers of these HSPC populations (37), PCA, cNMF, Seurat integration, Liger, Harmony, scVI and
i.e., Flt3 and Hlf for CMPs, Hba-a2 and Car1 for erythro- scAlign, followed by SNN graph construction with each in-
cytes; Ly86 and Csf1r for monocytes; Gstm1 and Fcnb for dividual dimension reduction results. Louvain graph clus-You can also read