Open-access quantitative MRI data of the spinal cord and reproducibility across participants, sites and manufacturers
←
→
Page content transcription
If your browser does not render page correctly, please read the page content below

www.nature.com/scientificdata

               OPEN           Open-access quantitative MRI
Data Descriptor               data of the spinal cord and
                              reproducibility across participants,
                              sites and manufacturers
                              Julien Cohen-Adad et al.#

                              In a companion paper by Cohen-Adad et al. we introduce the spine generic quantitative
                              MRI protocol that provides valuable metrics for assessing spinal cord macrostructural and
                              microstructural integrity. This protocol was used to acquire a single subject dataset across
                              19 centers and a multi-subject dataset across 42 centers (for a total of 260 participants),
                              spanning the three main MRI manufacturers: GE, Philips and Siemens. Both datasets
                              are publicly available via git-annex. Data were analysed using the Spinal Cord Toolbox to
                              produce normative values as well as inter/intra-site and inter/intra-manufacturer statistics.
                              Reproducibility for the spine generic protocol was high across sites and manufacturers,
                              with an average inter-site coefficient of variation of less than 5% for all the metrics. Full
                              documentation and results can be found at https://spine-generic.rtfd.io/. The datasets and
                              analysis pipeline will help pave the way towards accessible and reproducible quantitative MRI
                              in the spinal cord.

                              Background & Summary
                              Quantitative MRI (qMRI) aims at providing objective continuous metrics that specifically reflect the morphology,
                              microstructure and/or chemical composition of tissues1,2, thereby enabling deeper insight and understanding of
                              disease pathophysiology. While qMRI techniques have been successfully implemented in the brain for several
                              decades, they remain largely underutilized for spinal cord (SC) imaging in both clinical and research settings,
                              mostly as a direct consequence of the many challenges that need to be overcome in order to acquire good quality
                              data3,4. In a companion paper5, we introduce the spine generic protocol for acquiring high-quality qMRI of the
                              human SC at 3 Tesla (T). The spine generic protocol includes relevant sequences and contrasts for calculating
                              metrics sensitive to macrostructural and microstructural integrity: T1w and T2w imaging for SC cross-sectional
                              area (CSA) computation, multi-echo gradient echo for gray matter CSA, as well as magnetization transfer and
                              diffusion weighted imaging for assessing white matter microstructure.
                                  To demonstrate the practical implementation and reproducibility of the spine generic protocol, single subject
                              and multi-subject datasets were acquired across multiple centers. Relevant qMRI metrics were calculated using
                              a fully-automatic analysis pipeline, and those metrics were compared within site, across sites (within manufac-
                              turer), and across different manufacturers. The generated normative values will be useful as reference for future
                              clinical studies.

                              Methods
                              Data acquisition. Single-participant and multi-participant datasets were acquired across multiple centers
                              (see details below). The scan operator (researcher or MR technician) was instructed to follow the spine-generic
                              protocol5. Briefly, each participant was positioned in the head-first supine position. The following sequences were
                              run: localizer, 3D sagittal T1w, 3D sagittal T2w, 2D axial diffusion weighted echo planar imaging (30 directions at
                              a b-value of 800 s/mm2), 3D axial gradient echo with/without an MT pulse and an additional T1w scan, 2D axial

                              #
                                A full list of authors and their affiliations appears at the end of the paper.

  Scientific Data |   (2021) 8:219 | https://doi.org/10.1038/s41597-021-00941-8                                                                1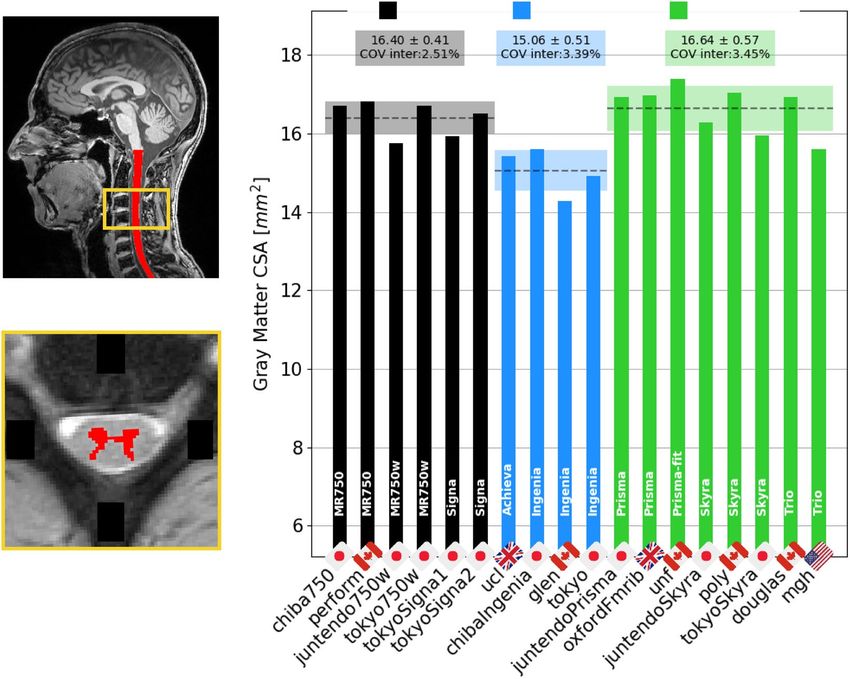
www.nature.com/scientificdata/                                                                      www.nature.com/scientificdata

                            multi-echo gradient echo. Data were collected, organized and analyzed according to a fully-documented proce-
                            dure available at https://spine-generic.rtfd.io.

                            Ethical compliance. We have complied with all relevant ethical regulations. Local ethics committees of the
                            participating institutions listed in Online-only Table 1 approved the study protocol. Signed informed consent
                            was obtained from all participants under the compliance of the corresponding local ethics committee and stored
                            in the corresponding local research center under responsibility of the local principal investigator/s (listed as
                            “Contact” in the Online-only Table 1).

                            Single subject.      The same participant (JCA, 38 y.o., male) was scanned at 19 different centers within 77 days.
                            This represents a “best case scenario” in terms of reproducibility because the participant was very familiar with
                            being scanned, knew how to position himself in the scanner and how to breathe, directly interacted with the MR
                            technician at each site to ensure the standard operating procedure (SOP) was understood, and was able to adapt
                            the sequence parameters on the scanner if the protocol was not imported properly (e.g., hardware or software
                            version incompatibility).

                            Multiple subjects.          In order to evaluate a more realistic (routine) scenario, 42 different groups worldwide
                            with varying levels of expertise each scanned six different healthy participants (3 males, 3 females), aged between
                            19 and 56 y.o., median age 28 y.o., resulting in 260 data sets. Participant-specific list of age and sex distribution
                            is available at https://github.com/spine-generic/data-multi-subject/blob/r20201130/participants.tsv. Each group
                            used the spine generic protocol and SOP, and obtained consent to scan and upload participants’ anonymized data
                            onto a publicly-available repository. Anatomical scans (T1w, T2w) where facial features are visible were “defaced”
                            before being released to the public domain using pydeface6. Some centers equipped with more than one system
                            were asked to scan 6 different participants on each scanner, although they were also given the possibility to scan
                            the same 6 participants across systems for convenience. In the latter case, this could slightly bias the inter-site
                            coefficient of variation (COV), however it would not affect the inter-manufacturer COV. The list of centers and
                            scanner models is shown in Online-only Table 1.
                                Data from each participant was then entered into the processing pipeline described in the next section. COVs
                            were computed within site and manufacturers, and compared across manufacturers.

                            Data processing. Data were processed using Spinal Cord Toolbox (SCT) v5.0.17 and spine-generic v2.6
                            (https://github.com/spine-generic/spine-generic/releases/tag/v2.6). The processing pipeline is illustrated in Fig. 1
                            and is fully documented at https://spine-generic.rtfd.io. Briefly, for the T1w scan, the SC was segmented using
                            deep-learning8, vertebral levels were identified9 and the SC was registered to the PAM50 template10 using the C3
                            and C5 vertebrae as labels. Then, the SC CSA was computed slice-wise (corrected for angulation between the SC
                            and the slice) and averaged between the C2 and C3 vertebral levels. For the T2w scan, the SC was segmented8,
                            registered with the PAM50 template using the transformation from the T1w scan and the CSA was computed and
                            averaged between C2 and C3. For the ME-GRE (T2*w) scan, the SC8 and gray matter (GM)11 were segmented
                            and registered with the PAM50 template using the transformation from the T1w scan. Then, GM CSA was com-
                            puted and averaged between C3 and C4. For the magnetization transfer (MT) protocol, the SC on the GRE-T1w
                            scan was segmented8 and registered with the PAM50 template using the initial transformation from the T1w
                            scan. GRE-MT1 and GRE-MT0 scans were registered to the GRE-T1w scans using an automatically-generated
                            mask tightly fitting the SC for more accurate registration. Magnetization transfer ratio (MTR) and MTsat12 were
                            computed and their values extracted for the white matter (WM) between C2 and C5 using the WM probabilistic
                            atlas13. For the diffusion weighted imaging (DWI) scan, the time series of diffusion-weighted scans were averaged
                            and the SC was segmented so that a mask could be created around it. The time series were motion-corrected
                            using slice-wise 2D transformations regularized along z7, with time-adjacent volumes grouped together for
                            increased robustness14. The PAM50 template was then registered to the DWI dataset using the initial transfor-
                            mation from the T1w scan and diffusion tensor imaging (DTI) metrics were computed using the weighted least
                            squares fitting algorithm implemented in Dipy15 and wrapped in SCT’s function sct_dmri_compute_dti.
                            No post-processing was performed. Lastly, DTI metrics were extracted within the WM between C2 and C5.
                                Processing was run on a supercomputer cluster (https://docs.computecanada.ca/wiki/Graham), by distrib-
                            uting 32x OpenMP jobs across 9 nodes in parallel (each node equipped with 2 x Intel E5-2683 v4 Broadwell
                            @ 2.1 GHz, with 128GB reserved RAM), enabling us to process all 260 participants in parallel (one participant
                            per CPU core). Software parallelization was achieved using Python’s multiprocessing package available in SCT’s
                            sct_run_batch. Total processing times were 37 min (single subject) and 40 min (multi-subject).

                            Statistics.     Intra- and inter-manufacturer differences were tested using a one-way ANOVA. Post-hoc anal-
                            yses testing pairwise differences across manufacturers were performed using the Tukey Honestly Significant
                            Difference (HSD) using the family-wise error rate to account for multiple comparisons. Significance level was set
                            to p = 0.05. Interactive plots available online were generated with Plotly (https://plotly.com/).

                            Data Records
                            The two datasets associated with this publication are:

                            •    The Spine Generic Public Database (Single Subject)16
                            •    The Spine Generic Public Database (Multi-Subject)17

Scientific Data |   (2021) 8:219 | https://doi.org/10.1038/s41597-021-00941-8                                                                  2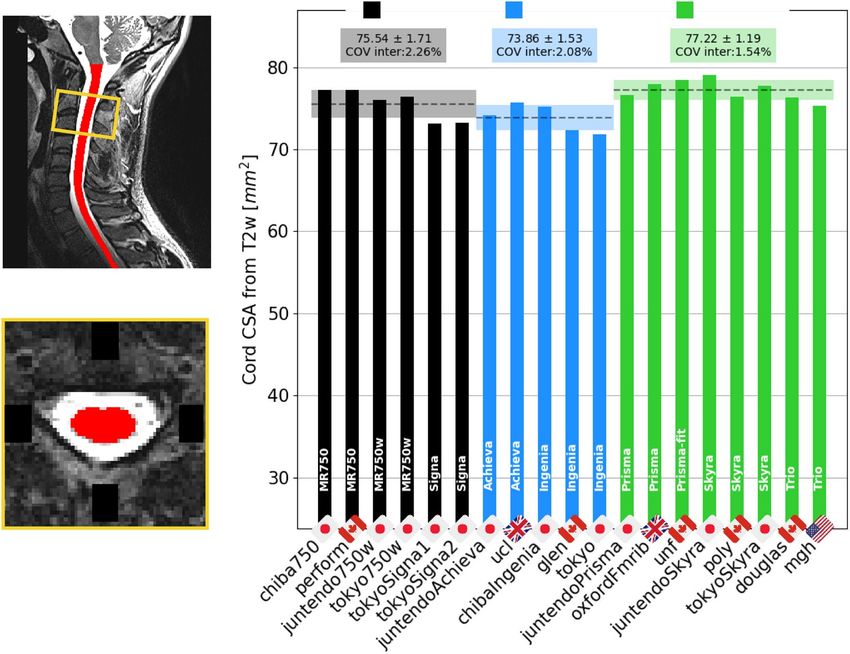
www.nature.com/scientificdata/                                                                                www.nature.com/scientificdata

                                                                                            Vert. labeling
                                                                                                                                                                    (*)
                     T1w                  Seg

                                                                       Cord CSA                                         (*) Powered by multiple open-source libraries,
                                                                                                                        incl. ANTs, dipy, nibabel, numpy, scipy, etc.
                     T2w                  Seg

                                                                                                             Warping
                                                                       Cord CSA
                                                                                                                                 PAM50
                                                                                                                               Template
                                                                                                                                                              T1w
                    ME-GRE               GM Seg

                                                                GM CSA
                                                                                                                                                              T2w

                    MTon                 Coregistration
                           MToff                                                                                                                          Cord & CSF
                                   T1w                    Seg            WM
                                                                                        MTR
                                                                                        MTsat
                                                                                         T1
                                                                                                                                                           WM & GM

                                          Motion
                                         correction
                                                                                                                                                           WM atlas
                                                                                  Seg                   WM             FA
                               DWI
                                                                 DWI                                                   MD
                                                                                                                       RD

                                   Fig. 1 Overview of the processing pipeline based on SCT. Briefly, for each participant, the SC is automatically
                                   segmented on the T1w, T2w, GRE-T1w, and mean DWI scans, while the gray matter is segmented on the ME-
                                   GRE scan (after averaging across echoes). Vertebral labeling is run on the T1w scan, followed by registration of
                                   the PAM50 template to each contrast. Estimated metrics are shown in red.

                                   Dataset management. Figure 2 illustrates the data management workflow. Datasets are managed using
                                   git-annex (https://git-annex.branchable.com/); git-annex is built on git technology and enables the separation of
                                   large files (NIfTI images, hosted on Amazon Web Services, AWS) from small files (metadata and documentation,
                                   hosted on GitHub). This decision was based on the modularity of git-annex (multiple mirrors can be added)
                                   and its compatibility with Datalad18. The documentation for contributing to the repositories is hosted on a wiki
                                   (https://github.com/spine-generic/spine-generic/wiki).
                                       To facilitate data aggregation across centers, we used the Brain Imaging Data Structure (BIDS) convention19.
                                   BIDS notably features JSON metadata files as a sidecar for each NIfTI file, which includes relevant acquisition
                                   parameters, making it easy to assess how well each site followed the generic protocol and which parameters
                                   were modified. Parameter verification (within a specified tolerance) as well as file and folder naming is auto-
                                   mated (https://spine-generic.rtfd.io/en/latest/data-acquisition.html#checking-acquisition-parameters) such that,
                                   every time new participants are added to the database, a notification is sent to a continuous integration sys-
                                   tem (e.g., https://github.com/spine-generic/data-multi-subject/runs/2730553396?check_suite_focus=true) that
                                   downloads the dataset and runs custom scripts to verify the validity of the dataset. For example, if a flip angle for a
                                   particular volume exceeded the tolerance range, the BIDS validator would fail and the data would not be merged.
                                   In that case, the management team would reach out to the data contributors asking if they can reacquire the data.
                                   If not, the data would not be added to the dataset. Another (less problematic) example: if a file was incorrectly
                                   named (sub_amu01_T2w.nii.gz instead of sub-amu01_T2w.nii.gz), the BIDS validator would fail.
                                   In that case, the management team would manually correct the file name, commit and push the change to the
                                   working branch and wait for the BIDS validator to pass before being able to merge the new data on the main
                                   (master) branch. Below is an example of the “BIDS Validator” script output (only showing part of it):

                                   WARNING: Incorrect FlipAngle: sub-amu01_T2w.nii.gz; FA=180 instead of 120
                                   WARNING: Incorrect RepetitionTime: sub-amu02_T2w.nii.gz; TR=2 instead of 1.5
                                   WARNING: Incorrect FlipAngle: sub-amu02_T2w.nii.gz; FA=180 instead of 120
                                   WARNING: Incorrect RepetitionTime: sub-amu03_T2w.nii.gz; TR=2 instead of 1.5
                                   WARNING: Incorrect FlipAngle: sub-amu03_T2w.nii.gz; FA=135 instead of 120
                                   Missing jsonSidecar:./derivatives/labels/sub-oxfordOhba05/anat/
                                   sub-oxfordOhba05_acq-T1w_MTS_seg-manual.json
                                   Missing jsonSidecar:./derivatives/labels/sub-oxfordOhba05/anat/
                                   sub-oxfordOhba05_T1w_labels-disc-manual.json
                                   Missing jsonSidecar:./derivatives/labels/sub-oxfordOhba05/anat/
                                   sub-oxfordOhba05_T1w_RPI_r_labels-manual.json

Scientific Data |      (2021) 8:219 | https://doi.org/10.1038/s41597-021-00941-8                                                                                         3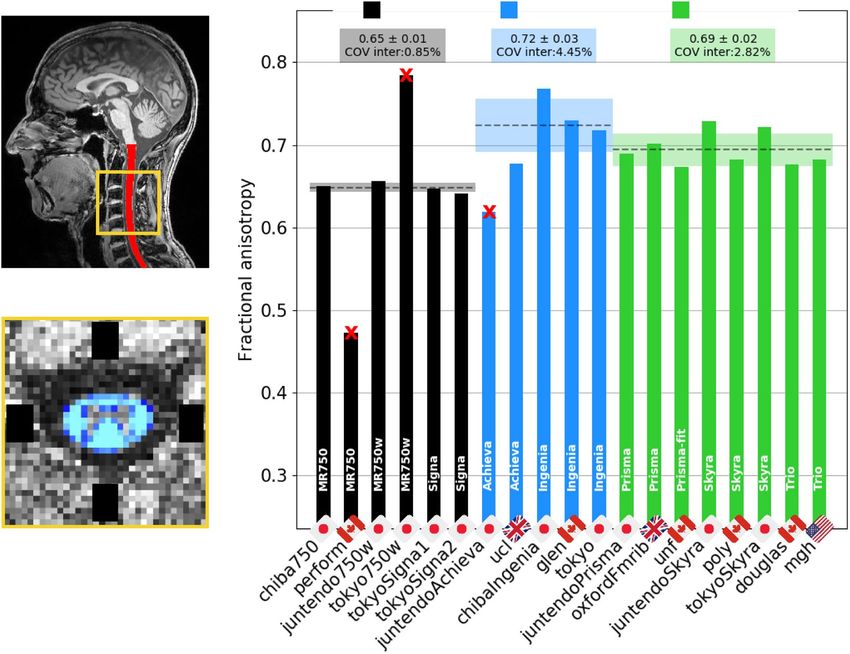
www.nature.com/scientificdata/                                                                                          www.nature.com/scientificdata

                                                                                                        single-subject database
                             contributor                                 managing team
                                                                                                           multi-subject database
                                                                                                                                       SSH protocol
                                                    Secured connection                      SSH protocol                                (git-annex)
                                                      (SFTP, SSL/TLS)                        (git-annex)                                                     user

                                    DICOM to BIDS-NIfTI                   Quality Control
                                    Anonymize data                        Process data
                                                                                                                    metadata &
                                                                                             Validate            participant details                         user

                                                                                                                                                      user

                                 Fig. 2 Illustration of the dataset management, from acquisition to end-user consumption.

                         A

              T1w    L       R
                         P

              T2w

              T2*w

              MT0

              MT1

              T1w

              DWI

                                 Fig. 3 Axial views of good quality data for all sequences in the spine generic protocol across various slices (the
                                 exact coverage along the SC varies because the slice thickness varies across sequences). DWI corresponds to the
                                 mean DWI data after motion correction. The images are from different participants. T1w: vuiisAchieva02; T2w:
                                 milan01; T2*w (ME-GRE): brnoCeitec01; MT0, MT1, T1w (for the MTS protocol) and DWI : barcelona04.
                                 Axial views were automatically generated by SCT’s QC report.

                                 Technical Validation
                                 Data quality. Overall, data quality was satisfactory based on qualitative visual inspection. Criteria included
                                 the correctness of field of view prescription, proper selection of receive coils, quality of shimming (assessed by
                                 looking at fat saturation performance and the presence of susceptibility distortions), and the presence and sever-
                                 ity of motion artifacts. Figure 3 shows examples of good quality data for all sequences. A few operator errors
                                 occurred, including: mis-labeled MT0 for MT1 and MT1 for MT0, shim parameters changed between MT0 and
                                 MT1 scans (causing different signal intensities, and hence not suitable for MT-based metrics), change of FFT scal-
                                 ing factor between the MT1/MT0 scans and the T1w scan used to compute MTsat and T1 maps (causing different
                                 signal quantization and hence not suitable for MT-based metrics unless corrected for), and repositioning of the
                                 participants, causing mis-alignment between the images before/after repositioning and violation of the analysis
                                 pipeline assumptions (all images are supposed to be acquired with the patient in the same position). These errors
                                 were not caught by the BIDS validator, but by the managing team during visual inspection of the data and inter-
                                 pretation of the qMRI metrics results. In future work, the data validator could be made sensitive to these issues.
                                 For example, the FFT scaling factor and shim coefficient are sometimes retrievable from the DICOM data and
                                 could be checked. Also, the qform (affine matrix present in the NIfTI header) could be checked to ensure con-
                                 sistency across data from the same series, e.g. MT1, MT0, GRE-T1w. Regarding the mis-labeling of MT1/MT0,
                                 training a deep learning model to recognize image contrast could address this issue.
                                     Figure 4 illustrates some of the image artifacts encountered during QC. A list of poor data quality scans is
                                 available on the Github’s issues of the dataset under the label “data-quality” (https://github.com/spine-generic/
                                 data-multi-subject/labels/data-quality); most of these were caused by patient motion. Mosaics of images for every
                                 contrast and every participant are available in the supplementary materials (Figures S1–S5). Additional exam-
                                 ples of good quality data are also available in the spine generic website (https://spine-generic.rtfd.io/en/latest/
                                 data-acquisition.html#example-of-datasets).

Scientific Data |    (2021) 8:219 | https://doi.org/10.1038/s41597-021-00941-8                                                                                      4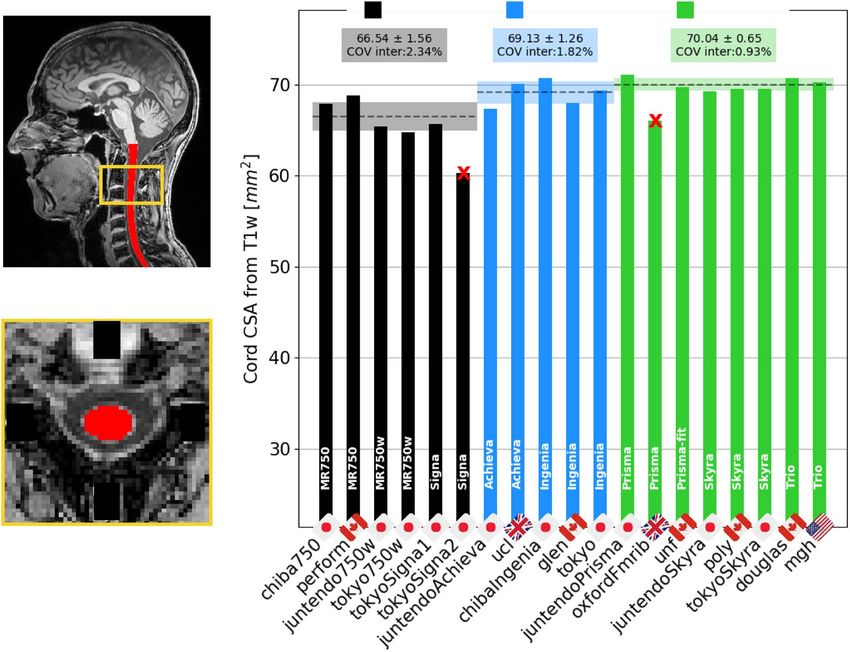
www.nature.com/scientificdata/                                                                          www.nature.com/scientificdata

               a                                                                                                b

               c                       d
                                               S             S
                                                                     e
                                                                                        S
                                                                                                f
                                                                                                                    S
                                                                                                                            g
                                                                                                                                    S

                                                                     L          R

                                         P           A   P       A                  P       A               P           A   P              A

                                                                         A                          A

                                                                     L          R               L       R

                                               I             I           P              I           P               I           volume 9       volume 11   volume 23

                            Fig. 4 Axial views of good quality data for all sequences in the spine generic protocol across various slices (the
                            exact coverage along the SC varies because the slice thickness varies across sequences). DWI corresponds to the
                            mean DWI data after motion correction. The images are from different participants. T1w: vuiisAchieva02; T2w:
                            milan01; T2*w (ME-GRE): brnoCeitec01; MT0, MT1, T1w (for the MTS protocol) and DWI : barcelona04.
                            Axial views were automatically generated by SCT’s QC report.

                            Quantitative results: Single subject. Overall, data quality was satisfactory. All images were visually
                            inspected to ensure that there were no significant errors in the masks used to average the signals in the SC,
                            WM or GM, and any errors were manually corrected. A list of poor quality scans is available on Github in the
                            issues for the dataset, under the label “data-quality” (https://github.com/spine-generic/data-single-subject/labels/
                            data-quality). Complete metrics and statistical tests are available in the r20201130 release assets (https://github.
                            com/spine-generic/data-single-subject/releases/download/r20201130/results.zip).
                                Figure 5 shows the SC CSA data from the T1w scan, averaged between cervical levels 2 and 3 (C2 and C3), for
                            the single participant across the 19 centers. Within each manufacturer, the inter-site standard deviation ranges
                            from 0.65 mm2 (Siemens) to 1.56 mm2 (GE), which is remarkably small considering that the size of a pixel is 1
                            mm2. The inter-site COVs were 2.3% for GE, 1.8% for Philips and 0.9% for Siemens. The inter-manufacturer
                            difference was significant (p < 0.01), with the Tukey test showing significant differences between GE and Philips
                            (p-adjusted = 0.03) and between GE and Siemens (p-adjusted < 0.01).
                                Figure 6 shows the SC CSA for the T2w scan, again averaged between cervical levels 2 and 3 (C2 and C3).
                            The inter-site COVs were 2.3% for GE, 2.1% for Philips and 1.5% for Siemens. The inter-manufacturer differ-
                            ence was significant (p < 0.01), with the Tukey test showing significant differences between Philips and Siemens
                            (p-adjusted < 0.01).
                                Figure 7 shows the gray matter CSA for the ME-GRE scan, averaged between cervical levels C3 and C4.
                            The inter-site COVs were 2.5% for GE, 3.4% for Philips and 3.4% for Siemens. The inter-manufacturer differ-
                            ence was significant (p < 0.01), with the Tukey test showing significant differences between GE and Philips
                            (p-adjusted < 0.01) and between Philips and Siemens (p-adjusted < 0.01).
                                Figure 8a shows the MTR average for the WM between C2 and C5. The inter-site COVs were 8.0% for GE,
                            4.2% for Philips and 3.6% for Siemens. The inter-manufacturer difference was significant (p < 0.01), but the Tukey
                            test showed no significant difference across pairwised manufacturers.
                                Figure 8b shows the MTsat results. The inter-site COVs were 11.3% for GE, 2.9% for Philips and 5.2% for
                            Siemens. The inter-manufacturer difference was significant (p < 0.01), with the Tukey test showing significant dif-
                            ferences between GE and Philips (p-adjusted = 0.03), between GE and Siemens (p-adjusted < 0.01), and between
                            Philips and Siemens (p-adjusted < 0.01).
                                Sites perform and juntendo750w were excluded from the MTR statistics because the TR for the GRE-MT0 and
                            GRE-MT1 was set to 62 ms (vs. 35 ms for the other GE sites), causing a drastic decrease in MTR values. These
                            sites were not excluded from MTsat, because this metric is supposed to account for the T1 recovery effect12 as
                            was indeed observed, with those sites now falling inside the 1σ interval. The site tokyoSigna1 fell outside the 1σ
                            interval because of issues related to image registration.
                                Figure 9 shows the average fractional anisotropy (FA) in WM across C2 and C5. The inter-site COVs
                            were 0.8% for GE, 4.5% for Philips and 2.8% for Siemens. The inter-manufacturer difference was significant
                            (p < 0.01), but the Tukey test showed no significant difference across pairwised manufacturers. One of the outliers

Scientific Data |   (2021) 8:219 | https://doi.org/10.1038/s41597-021-00941-8                                                                                          5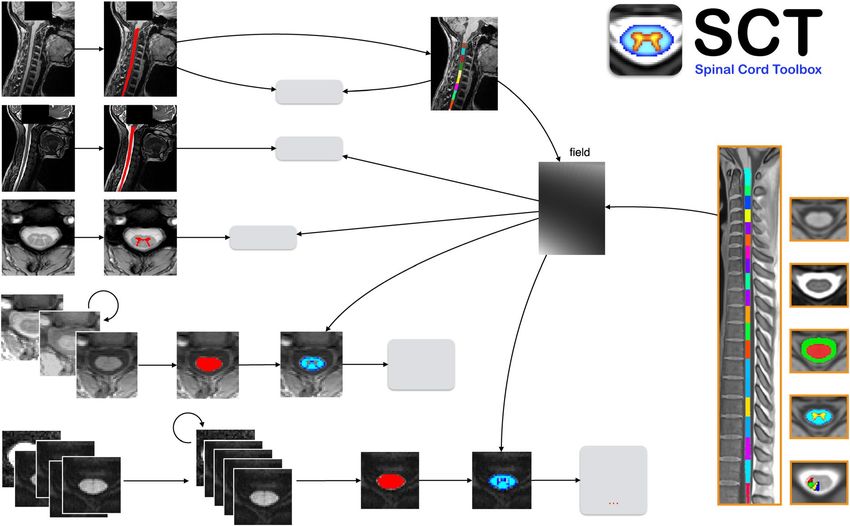
www.nature.com/scientificdata/                                                                     www.nature.com/scientificdata

                                                                                GE                 Philips                Siemens

                                    1 mm isotropic

                                          A

                              R                       L

                                          P
                             Spinal cord cross-sectional
                               area (CSA) averaged
                                  between C2-C3

                            Fig. 5 Results of the single subject study for the T1w scan. The cross-sectional area (CSA) of the SC was averaged
                            between the C2 and C3 vertebral levels. Sites tokyoSigna2 and oxfordFmrib were excluded from the statistics due
                            to excessive motion.

                            (tokyo750w) was due to the absence of the FOCUS license, which led us to rely on saturation bands to prevent
                            aliasing. However, those were not efficient (likely due to poor shimming in the region), with poor fat saturation
                            efficiency that yielded spurious diffusion tensor fits (e.g. FA >1 or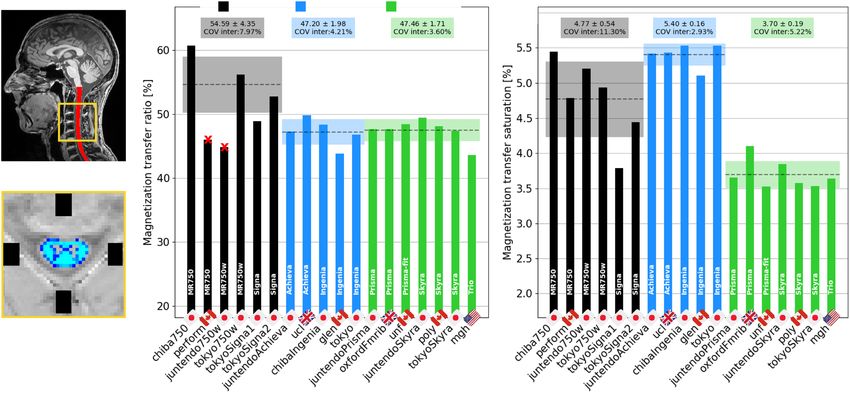
www.nature.com/scientificdata/                                                                      www.nature.com/scientificdata

                                                                                GE                 Philips                Siemens

                                  0.8 mm isotropic

                                          A

                              R                       L

                                          P
                             Spinal cord cross-sectional
                               area (CSA) averaged
                                  between C2-C3

                            Fig. 6 Results of the single subject study for the T2w scan. The cross-sectional area (CSA) of the SC was
                            averaged between the C2 and C3 vertebral levels.

                            lower values are likely due to the fact that some Philips sites used older versions of the consensus protocol, which
                            produced lower contrast between white and gray matter and, as a result, less reliable gray matter segmentations.
                                Figure 14 shows MTR results averaged between C2 and C5. The intra-site COVs were averaged for each
                            manufacturer and found to be all under 3.6%. The inter-site COVs (and inter-site ANOVA p-values) were 2.0%
                            (p = 0.03) for GE, 1.8% (p = 0.17) for Philips, and 2.3% (p < 0.01) for Siemens. The inter-manufacturer differ-
                            ence was significant (p < 0.01), with the Tukey test showing significant differences between GE and Philips
                            (p-adjusted = 0.02), and between GE and Siemens (p-adjusted = 0.01).
                                Figure 15 shows MTsat results, also averaged between C2 and C5. The intra-site COVs were all under 11%.
                            The inter-site COVs (and inter-site ANOVA p-values) were 7.5% (p < 0.01) for GE, 4.9% (p = 0.11) for Philips,
                            and 9.0% (p = 0.09) for Siemens. The inter-manufacturer difference was significant (p < 0.01), with the Tukey test
                            showing significant differences between GE and Philips (p-adjusted = 0.04), between GE and Siemens (p-adjusted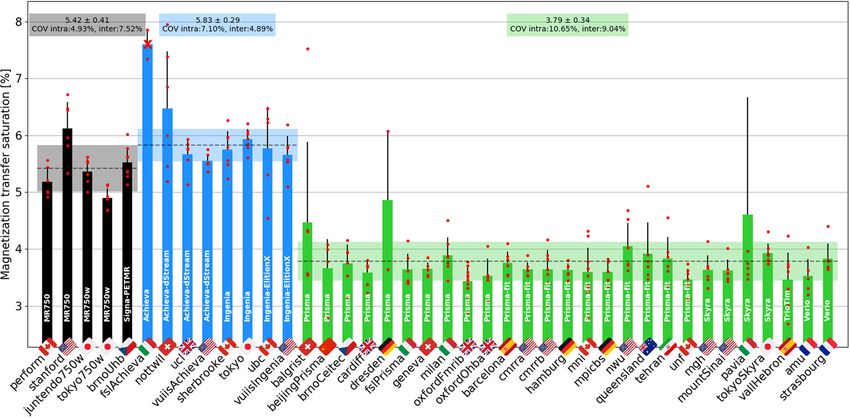
www.nature.com/scientificdata/                                                                         www.nature.com/scientificdata

                                                                                        GE              Philips             Siemens

                                        0.5 x 0.5 x 5 mm3

                                               A

                                   R                        L

                                               P
                                     Gray matter CSA was
                                   averaged between C3-C4

                                 Fig. 7 Results of the single subject study for the ME-GRE scan. Gray matter CSA was computed after automatic
                                 gray matter segmentation and averaged between C3 and C4 vertebral levels.

                                         a           GE         Philips       Siemens
                                                                                                b

                         A

               R                  L

                         P
               MTR was averaged in WM
                   between C2-C5

                                 Fig. 8 Results of the single subject study for the MT protocol. The mean MTR (a) and MTsat (b) were computed
                                 in the white matter between C2 and C5. Sites perform and juntendo750w were excluded from the statistics
                                 because the TR for the GRE-MT0 and GRE-MT1 was set to 62 ms (vs. 35ms for the other GE sites), causing
                                 drastic decrease of MTR values. These sites were not excluded from MTsat.

                                 as for any neuroimaging analysis pipeline, the algorithms evolve. Moreover, visual QC and manual corrections are
                                 prone to human error. We therefore encourage users of this living database to provide feedback. As it is an open
                                 source project, contributions are welcome. Also, as future participants are added, the statistics will be updated.

Scientific Data |     (2021) 8:219 | https://doi.org/10.1038/s41597-021-00941-8                                                                  8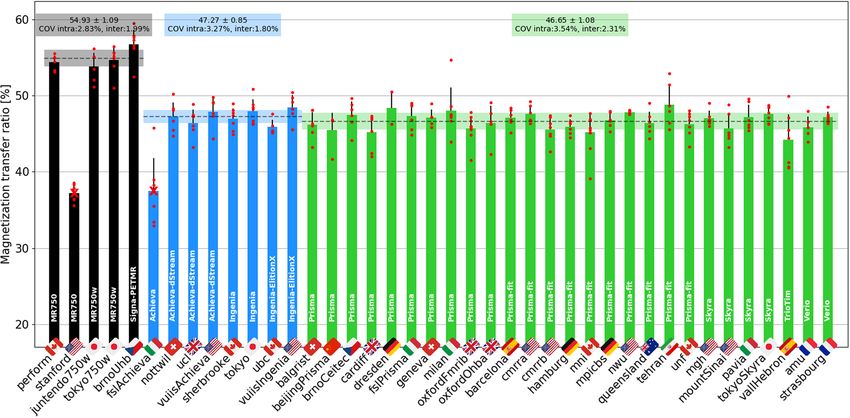
www.nature.com/scientificdata/                                                                     www.nature.com/scientificdata

                                                                                GE                Philips                Siemens

                                  0.9 x 0.9 x 5 mm3

                                          A

                              R                       L

                                          P
                               FA was averaged in WM
                                   between C2-C5

                            Fig. 9 Results of the single subject study for the DWI protocol. The FA in the SC WM was averaged between the
                            C2 and C5 vertebral levels. The following sites were excluded: perform (strong fat aliasing artifact), tokyo750w
                            (poor shimming) and juntendoAchieva (no cardiac gating).

                            Fig. 10 Results of multi-subject study for the T1w scan. As in the single subject study, the cross-sectional area of
                            the SC was averaged between the C2 and C3 vertebral levels. Black, blue and green bars respectively correspond
                            to GE, Philips and Siemens, with the manufacturer’s model indicated in white letters on each bar. The following
                            participants were excluded from the statistics: balgrist01 (motion), beijingGE04 (motion), mniS06 (motion),
                            mountSinai03 (participant repositioning), oxfordFmrib04 (participant repositioning), pavia04 (motion) and
                            perform06 (motion).

Scientific Data |   (2021) 8:219 | https://doi.org/10.1038/s41597-021-00941-8                                                                 9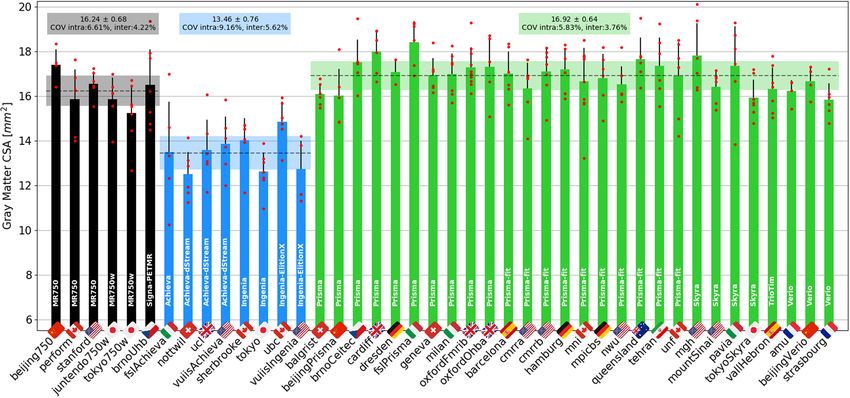
www.nature.com/scientificdata/                                                                    www.nature.com/scientificdata

                            Fig. 11 Results of multi-subject study for the T2w scan. The cross-sectional area of the SC was averaged
                            between the C2 and C3 vertebral levels. The Siemens site beijingVerio was excluded from statistics (red cross)
                            due to different TR and FA causing biases in the segmentation volume. The following participants were
                            excluded: oxfordFmrib04 (T1w scan was not aligned with other contrasts due to participant repositioning),
                            pavia04 (motion) and mountSinai03 (participant repositioning).

                            Fig. 12 Relationship between CSA calculated from the T1w vs. T2w scans. The same site and participants
                            excluded in Figs 10 and 11 were also excluded here.

                            Spinal cord CSA. Within manufacturers, SC CSAs showed a maximum inter-site COV of 2.4% for the single
                            subject study and 5% for the multi-subject study, for both T1w and T2w contrasts, which is highly encouraging.
                            Overall, intra-site COVs were higher than inter-site COVs, which is expected because CSAs are known to vary
                            substantially across individuals20. Hence, taking the mean within each site and comparing it across sites some-
                            what smooths this inherent inter-individual variability, putting aside geographical differences. This could be the
                            goal of follow-up investigations.
                               Regardless of the manufacturer, intra-site COVs were about two-fold higher for SC CSAs (8%) compared to
                            MTR and DTI-FA (4–5%). This result is not surprising, considering that, as noted above, SC size is known to vary
                            across healthy adults, while white matter microstructure (which MTR and DTI-FA measure) is not expected to
                            vary much between healthy individuals21. Note that there is no conclusive evidence of a correlation of SC CSA
                            with age22, although some studies do report smaller cord area in older participants23,24. There is currently no
                            accepted consensus on an effective and reliable normalization method for SC CSA20. Given that CSA is a widely
                            used biomarker for neurodegenerative diseases such as MS, reducing that inter-subject variance is a much needed
                            goal for the research community.
                               T1w scans showed slightly better intra- and inter-site COVs compared to T2w scans. This is rather surprising,
                            given that T2w scans look visually cleaner, with a sharper SC/CSF border, and the fact that they are less prone to
                            participant or SC motion artifacts. The SC CSAs obtained from the T1w scans were significantly lower for GE
                            scanners, compared to both Philips and Siemens, whereas for T2w scans, the CSA was comparable across all three

Scientific Data |   (2021) 8:219 | https://doi.org/10.1038/s41597-021-00941-8                                                                10
www.nature.com/scientificdata/ www.nature.com/scientificdata
Fig. 13 Gray matter CSA computed after automatic gray matter segmentation on the ME-GRE scan and
averaged between C3 and C4 vertebral levels. The following participants were excluded due to motion artifacts:
amu03, fslAchieva04, vuiisIngenia04 and vuiisIngenia05.
Fig. 14 MTR results computed from the GRE-MT0 and GRE-MT1 scans and averaged in the SC WM between
the C2 and C5 vertebral levels. The following sites were removed from the statistics: stanford (large difference
in the TR), fslAchieva (wrong field of view (FOV) placement). The following participants were also removed:
beijingPrisma04 (different coil selection, shim value and FOV placement between MT1 and MT0), geneva02
(FOV positioning changed between MT1 and MT0), oxfordFmrib04 (T1w scan was not aligned with other
contrasts due to participant repositioning).
manufacturers. Variability of CSA across manufacturers could be due to (i) sequence parameters and/or recon-
struction filters (e.g. smoothing) that alter the boundary definition, and/or (ii) differing field-strength between
manufacturers (2.89 T for Siemens, 3.00 T for GE and Philips MRI) that change the apparent tissue contrasts25.
Interestingly, the SC CSA was overall higher on T2w vs. T1w sequences (see Fig. 12). The sensitivity of image
contrast to CSA measurements has already been reported in a study comparing T2w SPACE and T1w MPRAGE
sequences26, and in another study comparing T1w MPRAGE (3D-TFE) and 3D phase sensitive inversion recovery
(PSIR) sequences27. As discussed elsewhere28, discrepancies in measurements across MR sequences and parame-
ters could be caused by the slightly darker contour of the T2w image, accentuating partial volume effects with the
surrounding CSF, T2* blurring, Gibbs ringing, motion and flow artifacts. These differences would thus change
Scientific Data | (2021) 8:219 | https://doi.org/10.1038/s41597-021-00941-8 11www.nature.com/scientificdata/ www.nature.com/scientificdata
Fig. 15 MTsat results computed from the GRE-MT0, GRE-MT1 and GRE-T1w scans and averaged in the SC
WM between the C2 and C5 vertebral levels. The following site was removed from the statistics: fslAchieva
(wrong FOV placement). The following participants were also removed: beijingPrisma04 (different coil
selection, shim value and FOV placement between MT1 and MT0), geneva02 (FOV positioning changed
between MT1 and MT0), oxfordFmrib04 (T1w scan was not aligned with other contrasts due to participant
repositioning).
Fig. 16 Results of multi-subject study for the MT scan. The MTR of the SC WM was averaged between the C2
and C5 vertebral levels. The following participants were excluded: beijingPrisma03 (wrong FOV placement),
mountSinai03 (T2w was re-acquired, causing wrong T2w to DWI registration), oxfordFmrib04 (participant
repositioning) and oxfordFmrib01 (registration issue).
the identification of the SC boundaries by either the user (in case of manual segmentation) or an algorithm (in
case of automated segmentation). It is worth noting that the type of MRI contrast can also impact the physical
appearance of the boundaries. For example, the dura mater has a relatively short T2* value and hence its apparent
location varies with the choice of TE in gradient echo sequences29. Age-related increases in iron deposition in the
dura mater can also lead to CSA under-estimation, due to T2* reduction, which can be a confounding factor in
longitudinal studies.
In order to measure CSA in retrospective or longitudinal studies, we therefore recommend sticking to exactly
the same sequence and parameters. Users of our proposed protocols have the option of deriving the SC CSA
Scientific Data | (2021) 8:219 | https://doi.org/10.1038/s41597-021-00941-8 12www.nature.com/scientificdata/ www.nature.com/scientificdata
from T1w or T2w images. While the two contrasts did lead to different SC CSA values, these have been modeled
for each manufacturer. This means that when users compare SC CSA values that were obtained from different
contrasts, they can account for differences between them by either acquiring sufficient data themselves, using
our protocol and modeling the relationship between T1w and T2w SC CSA, or by using our estimated regression
coefficients linking T1w CSA with T2w CSA (Fig. 12).
Gray matter CSA. In terms of the GM CSA, for the multi-subject dataset, GM CSAs showed a maximum
inter-site COV of 5.6% (3.5% for the single subject dataset), which is highly encouraging, especially considering
the small size of the GM, making CSA measures very sensitive to segmentation errors. Also worth mentioning
is the inter-site standard deviation ranging from 0.64 to 0.76 mm2 (0.41 to 0.57 mm2 for single subject), which is
remarkable considering that the effective in-plane spatial resolution of the image is 0.5 × 0.5 mm2, i.e., the preci-
sion is roughly the size of the pixel.
Philips scanners led to significantly lower CSA values here and also larger intra-site COVs, which is likely
due to the fact that some Philips sites used older versions of the consensus protocol that produced lower con-
trast between white and gray matter and, as a result, less reliable gray matter segmentations. The current Philips
protocol has different echo times and an increased saturation band power. The latter has the effect of generating
a greater MT effect and, consequently, improved WM/GM contrast. The only site benefiting from these changes
was ubc, which explains the GM CSA values being slightly closer here to those of the Siemens and GE sites.
Magnetization transfer. The MT protocol includes MTR and MTsat metrics, both of which are sensitive to mye-
lin loss30,31. Owing to the use of GRE-T1w images (in addition to the MT1 and MT0 scans), MTsat is less sensi-
tive to T1 recovery effects12,32, as has been confirmed by results from both the single- and multi-subject studies.
However, this benefit is largely outweighed by it being noisier than MTR with maximum intra- and inter-site
COVs of 11% and 9%, respectively, versus 4% and 2.3% for MTR. On the other hand, the higher COVs may be
compensated by a higher sensitivity to myelin loss, given that myelin content appears to be more closely related
to MTsat than to MTR30. This warrants further investigation in a patient population exhibiting abnormal myeli-
nation. Despite these somewhat discouraging results for the MTsat and T1 metrics, the GRE-T1w scan could still
be kept in the spine generic protocol because it is short (~1 min) and could be useful for detecting hypointense
lesions.
We otherwise noticed larger differences for the GE site compared to Philips and Siemens, which is likely attrib-
uted to the different MT pulse shape (Fermi for GE vs. sinc for Philips, and Gaussian for Siemens), and possibly
different offset frequencies and energy. Another potential source of difference is that the acquisition matrix for
the GE sites had to be reduced to 192 (instead of 256 for Philips/Siemens) because older software versions did not
have ASSET (parallel imaging technique used by GE) on the GRE sequence that features the MT pulse.
Diffusion weighted imaging. As with MTR, DTI metrics showed very little intra- and inter-site variabilities. FA
values were similar between Siemens and Philips, but significantly lower for GE. One possible explanation may
lie in the different noise properties, which are known to impact DTI metrics33. Differences in noise properties
could be related to receive coil properties, reconstruction of the images (GE data are reconstructed on a finer
grid) or filters applied by the image reconstructor, among other factors. Another possible cause for the lower FA
observed on the GE sites is the diffusion pulse sequence and the way diffusion gradients are played out (slew rate,
mixing time, maximum gradient strength). For Siemens, the lower FA for the vallHebron (Tim Trio, within the
2σ-3σ interval) and strasbourg (Verio, within the 1σ-2σ interval) sites compared to other Siemens sites is likely
caused by a much longer TE (99 ms for Trio and 95 ms for Verio, versus 55–60 ms for Skyra and Prisma), increas-
ing noise amplitude with an impact in the DTI metrics. That said, amu and beijingVerio sites were also Verio, but
their FA values were within the 1σ interval. Other DTI metrics followed the same trends in terms of intra- and
inter-manufacturer variability, although COVs were higher, which could be explained by the less forgiving behav-
iour of these DTI metrics with respect to image quality (motion, ghosting, low signal-to-noise ratio).
Another factor which likely impacted the variability was the non-use/misuse of cardiac gating. As observed in
the single subject study, DTI metrics were abnormal for sites that did not use cardiac gating, as this led to a sud-
den drop in signal not related to microscopic water diffusion (see Fig. 4g). The present study reiterates the benefits
of cardiac gating in SC DWI experiments.
Usage Notes
BIDS convention. We recommend that researchers planning to contribute to the spine generic database or
creating other databases check the validity of the json sidecars associated with BIDS datasets. This will help
assess how well protocols are followed by different centers. For json files to contain the relevant information, it is
necessary that (i) DICOM fields include the relevant fields themselves, including the obvious (TR, TE, flip angle)
as well as lesser known parameters that can have a strong impact on the computed metrics (water excitation, fat
saturation, monopolar vs. bipolar readout, etc.), and (ii) that these fields are populated in the json files. Checking
these parameters as well as the files and folder names can be automatized via continuous integration (e.g., GitHub
Actions, as used in the present study).
Another advantage of the BIDS convention is that it enables the standardization of the inputs/outputs of com-
plex analysis pipelines, or so-called “BIDS Apps” (https://bids-apps.neuroimaging.io/). For example, the proposed
analysis pipeline for the spine generic project can be applied ‘as is’ to another dataset organized according to BIDS.
Concluding remarks and future directions. To the best of our knowledge, this study features the first
“large-scale” multi-center SC qMRI datasets ever acquired and made public. These datasets are shared according
Scientific Data | (2021) 8:219 | https://doi.org/10.1038/s41597-021-00941-8 13www.nature.com/scientificdata/ www.nature.com/scientificdata
to the ‘Findable, Accessible, Interoperable and Reusable’ (FAIR) principles34. The normative values from the
multi-subject dataset could serve as age-matched healthy control references. More generally, these datasets will
be useful for developing new image processing tools dedicated to the SC, and the fact that they are public and
version-tracked with git-annex technology makes it possible for researchers to compare tools with the same data.
Lastly, important efforts were deployed to make the data analysis methods fully transparent and the results
reproducible. The analysis is fully automated - aside from minor manual corrections when necessary-, minimiz-
ing user bias and facilitating large multi-center studies. We hope this analysis framework can serve as an example
for future studies and we encourage researchers to use it. The SC MRI community has initiated a forum (https://
forum.spinalcordmri.org/) to encourage discussions about these open-access datasets, and to pitch new ideas for
subsequent analyses and acquisitions.
In a time where reproducibility of scientific results is a major concern35, we believe a consensus acquisition
protocol along with publicly-shared datasets and a transparent analysis pipeline provide a solid foundation for the
field of SC qMRI so that, in the future, inclusion of the SC in neuroimaging protocols will become a “no-brainer”.
Code availability
Data were processed using Python and shell scripts contained in the spine-generic package (https://github.com/
spine-generic/spine-generic/releases/tag/v2.6), which is distributed under the MIT license. A comprehensive
procedure is described in the “Analysis pipeline” section of the spine generic website (https://spine-generic.rtfd.io/).
This procedure includes the list of dependent software packages to install, a step-by-step analysis procedure
with a list of commands to run, a procedure for quality control and for manual correction of intermediate
outputs (e.g. cord segmentation and vertebral labeling). The procedure includes embedded video tutorials and
has been tested by external users. The analysis documentation also includes a section on how to generate the
static figures that are shown in this article (in PNG format) as well as the interactive figures embedded in the
spine-generic website. Notable software used in this study include: the Spinal Cord Toolbox v5.0.1 (https://
spinalcordtoolbox.com) to analyse the MRI data, pandas36 to perform statistics, plotly v4.12.0 (https://plotly.com)
to display the interactive plots, brainsprite v0.13.3 (https://brainsprite.github.io/) for embedding in the online
documentation an interactive visualization of example datasets, pybids37 for checking the acquisition parameters
on the BIDS datasets, FSLeyes v0.34.0 (https://fsl.fmrib.ox.ac.uk/fsl/fslwiki/FSLeyes) for manually-correcting the
segmentations.
Received: 9 December 2020; Accepted: 26 March 2021;
Published: xx xx xxxx
References
1. Cercignani, M., Dowell, N. G. & Tofts, P. S. Quantitative MRI of the Brain: Principles of Physical Measurement, Second edition. (CRC
Press, 2018).
2. Cohen-Adad, J. & Wheeler-Kingshott, C. Quantitative MRI of the Spinal Cord. (2014).
3. Wheeler-Kingshott, C. A. et al. The current state-of-the-art of spinal cord imaging: applications. Neuroimage 84, 1082–1093 (2014).
4. Stroman, P. W. et al. The current state-of-the-art of spinal cord imaging: methods. Neuroimage 84, 1070–1081 (2014).
5. Cohen-Adad, J. et al. Generic acquisition protocol for quantitative MRI of the spinal cord. Nature Protocols https://doi.org/10.1038/
s41596-021-00588-0 (2021).
6. Gulban, O. F. et al. poldracklab/pydeface: v2.0.0. Zenodo https://doi.org/10.5281/zenodo.3524401 (2019).
7. De Leener, B. et al. SCT: Spinal Cord Toolbox, an open-source software for processing spinal cord MRI data. Neuroimage 145, 24–43
(2017).
8. Gros, C. et al. Automatic segmentation of the spinal cord and intramedullary multiple sclerosis lesions with convolutional neural
networks. Neuroimage 184, 901–915 (2019).
9. Ullmann, E., Paquette, P. J. F., Thong, W. E. & Cohen-Adad, J. Automatic labeling of vertebral levels using a robust template-based
approach. Int. J. Biomed. Imaging 2014, 719520 (2014).
10. De Leener, B. et al. PAM50: Unbiased multimodal template of the brainstem and spinal cord aligned with the ICBM152 space.
Neuroimage 165, 170–179 (2018).
11. Perone, C. S., Calabrese, E. & Cohen-Adad, J. Spinal cord gray matter segmentation using deep dilated convolutions. Sci. Rep. 8, 5966
(2018).
12. Helms, G., Dathe, H., Kallenberg, K. & Dechent, P. High-resolution maps of magnetization transfer with inherent correction for RF
inhomogeneity and T1 relaxation obtained from 3D FLASH MRI. Magn. Reson. Med. 60, 1396–1407 (2008).
13. Levy, S. et al. White matter atlas of the human spinal cord with estimation of partial volume effect. Neuroimage 119, 262–271 (2015).
14. Xu, J. et al. Improved in vivo diffusion tensor imaging of human cervical spinal cord. Neuroimage 67, 64–76 (2013).
15. Garyfallidis, E. et al. Dipy, a library for the analysis of diffusion MRI data. Front. Neuroinform. 8, 8 (2014).
16. Cohen-Adad, J. Spine Generic Public Database (Single Subject). Zenodo https://doi.org/10.5281/zenodo.4299148 (2020).
17. Cohen-Adad, J. et al. Spine Generic Public Database (Multi-Subject). Zenodo https://doi.org/10.5281/zenodo.4299140 (2020).
18. Halchenko, Y. O. et al. datalad/datalad 0.12.0rc6. Zenodo https://doi.org/10.5281/zenodo.3512712 (2019).
19. Gorgolewski, K. J. et al. The brain imaging data structure, a format for organizing and describing outputs of neuroimaging
experiments. Sci Data 3, 160044 (2016).
20. Papinutto, N. et al. Intersubject Variability and Normalization Strategies for Spinal Cord Total Cross‐Sectional and Gray Matter
Areas. J. Neuroimaging 30, 110–118 (2020).
21. Smith, S. A. et al. Reproducibility of tract-specific magnetization transfer and diffusion tensor imaging in the cervical spinal cord at
3 tesla. NMR Biomed. 23, 207–217 (2010).
22. Agosta, F. et al. Evidence for cervical cord tissue disorganisation with aging by diffusion tensor MRI. Neuroimage 36, 728–735 (2007).
23. Kameyama, T., Hashizume, Y. & Sobue, G. Morphologic features of the normal human cadaveric spinal cord. Spine 21, 1285–1290
(1996).
24. Papinutto, N. et al. Age, Gender and Normalization Covariates for Spinal Cord Gray Matter and Total Cross-Sectional Areas at
Cervical and Thoracic Levels: A 2D Phase Sensitive Inversion Recovery Imaging Study. PLoS One 10, e0118576 (2015).
25. Rooney, W. D. et al. Magnetic field and tissue dependencies of human brain longitudinal 1H2O relaxation in vivo. Magn. Reson.
Med. 57, 308–318 (2007).
26. De Leener, B., Kadoury, S. & Cohen-Adad, J. Robust, accurate and fast automatic segmentation of the spinal cord. Neuroimage 98,
528–536 (2014).
Scientific Data | (2021) 8:219 | https://doi.org/10.1038/s41597-021-00941-8 14www.nature.com/scientificdata/ www.nature.com/scientificdata
27. Kearney, H. et al. Improved MRI quantification of spinal cord atrophy in multiple sclerosis. J. Magn. Reson. Imaging 39, 617–623
(2014).
28. Fonov, V. S. et al. Framework for integrated MRI average of the spinal cord white and gray matter: The MNI-Poly-AMU template.
Neuroimage 102P2, 817–827 (2014).
29. Fujimoto, K. et al. Quantitative comparison of cortical surface reconstructions from MP2RAGE and multi-echo MPRAGE data at 3
and 7 T. Neuroimage 90, 60–73 (2014).
30. Campbell, J. S. W. et al. Promise and pitfalls of g-ratio estimation with MRI. Neuroimage 182, 80–96 (2018).
31. Schmierer, K., Scaravilli, F., Altmann, D. R., Barker, G. J. & Miller, D. H. Magnetization transfer ratio and myelin in postmortem
multiple sclerosis brain. Ann. Neurol. 56, 407–415 (2004).
32. Callaghan, M. F., Helms, G., Lutti, A., Mohammadi, S. & Weiskopf, N. A general linear relaxometry model of R1 using imaging data.
Magn. Reson. Med. 73, 1309–1314 (2015).
33. Jones, D. K. & Basser, P. J. Squashing peanuts and smashing pumpkins: how noise distorts diffusion-weighted MR data. Magn. Reson.
Med. 52, 979–993 (2004).
34. Wilkinson, M. D. et al. The FAIR Guiding Principles for scientific data management and stewardship. Sci Data 3, 160018 (2016).
35. Stikov, N., Trzasko, J. D. & Bernstein, M. A. Reproducibility and the future of MRI research. Magn. Reson. Med. 82, 1981–1983
(2019).
36. Reback, J. et al. pandas-dev/pandas: Pandas 1.2.2. Zenodo https://doi.org/10.5281/zenodo.3509134 (2021).
37. Yarkoni, T. et al. PyBIDS: Python tools for BIDS datasets. J Open Source Softw. 4 (2019).
Acknowledgements
We thank Gerald Moran and Bart Schraa (Siemens Healthcare), Suchandrima Banerjee and Naoyuki Takei (GE
Healthcare) for sharing proprietary information and helping with setting up manufacturer-specific protocols,
Nicholas Guenther and Alexandru Jora for setting up the git-annex server and procedure for hosting the public
database, Charley Gros for helping with the analysis script, Paul Bautin for helping with manual corrections,
Noémie Roberge for helping with the interactive plots, Carollyn Hurst, André Cyr, Arnaud Boré and Pierre
Bellec (Functional Neuroimaging Unit), Charles Tremblay (Polytechnique Montreal), Antonys Melek and Habib
Benali (PERFORM center, Concordia University), Ives Levesque (McGill University), Carol Lien (University of
Minnesota) for helping with data acquisitions, Compute Ontario (https://computeontario.ca/) and Compute
Canada (www.computecanada.ca) for providing the supercomputer infrastructure and all the volunteers who
participated in the Spinal Cord MRI Public Database. This work was funded by the Canada Research Chair
in Quantitative Magnetic Resonance Imaging [950-230815], the Canadian Institute of Health Research [CIHR
FDN-143263], the Canada Foundation for Innovation [32454, 34824], the Fonds de Recherche du Québec -
Santé [28826], the Fonds de Recherche du Québec - Nature et Technologies [2015-PR-182754], the Natural
Sciences and Engineering Research Council of Canada [435897-2013], the Canada First Research Excellence
Fund (IVADO and TransMedTech), the Quebec BioImaging Network [5886], Spinal Research (UK), Wings for
Life (Austria, #169111) and Craig H. Neilsen Foundation (USA) for the INSPIRED project, the National Institutes
of Health (NIH) through grants R00EB016689 and R01EB027779 (R.L.B.), the Instituto Investigación Carlos III
(Spain, PI18/00823), the Czech Health Research Council grant n. NV18-04-00159, the Ministry of Health, Czech
Republic - conceptual development of research organization (FNBr, 65269705), the National Imaging Facility
and Queensland NMR Network (UQ), and SpinalCure Australia (M.J.R.), the European Research Council under
the European Union’s Seventh Framework Programme (FP7/2007–2013)/ERC grant agreement n° 616905; Max
Planck Society and European Research Council (ERC StG 758974); European Union’s Horizon 2020 research
and innovation programme under the grant agreement No 681094, and the Swiss State Secretariat for Education,
Research and Innovation (SERI) under contract number 15.0137; BMBF (01EW1711A & B) in the framework
of ERA-NET NEURON, the European Union’s Horizon 2020 research and innovation programme under grant
agreement No. 634541, the Engineering and Physical Sciences Research Council (R006032/1, M020533/1)
and Rosetrees Trust (UK), UK Multiple Sclerosis Society (892/08, 77/2017), NIHR Biomedical Research
Centres, UCLH, the Italian Ministry of Health Young Researcher Grant 2013 (GR-2013-02358177), the FISR
Project “Tecnopolo di nanotecnologia e fotonica per la medicina di precisione”(funded by MIUR/CNR, CUP
B83B17000010001), TECNOMED project (funded by Regione Puglia, CUP B84I18000540002), Million Dollar
Bike Ride from the University of Pennsylvania (MDBR-17-123-MPS), investigator-initiated PREdICT study
at the Vall d’Hebron Institute of Oncology (Barcelona) funded by AstraZeneca and CRIS Cancer Foundation,
the Wellcome Trust (UK) (203139/Z/16/Z), Systems, Technologies and Applications for Radiofrequency and
Communications (STARaCOM) and Swiss National Science Foundation (PCEFP3_181362/1). The content is
solely the responsibility of the authors and does not necessarily represent the official views of the NIH.
Author contributions
J. Cohen-Adad: study design and conceptualisation; data acquisition and formal data analysis; manuscript
preparation and revision; data curation; management of online repositories; coordination of the multi-centre
consortium. A. Foias, E. Alonso-Ortiz: study design and conceptualisation; data acquisition and formal data
analysis; manuscript preparation and revision; data curation; management of online repositories. M. Abramovic,
C. Arneitz, N. Atcheson, L. Barlow, R.L. Barry, M. Barth, M. Battiston, C. Büchel, M. Budde, V.Callot, A. Combes,
B. De Leener, M. Descoteaux, P. L. De Sousa, M. Dostal, J. Doyon, A. Dvorak, F. Eippert, K.R. Epperson, K.S.
Epperson, P. Freund, J. Finsterbusch, M. Fratini, I. Fukunaga, C.A.M. Gandini Wheeler-Kingshott, G. Germani,
G. Gilbert, F. Giove, C. Gros, F. Grussu, A. Hagiwara, P-G. Henry, T. Horák, M. Hori, J. Joers, K. Kamiya, H.
Karbasforoushan, M. Kerkovsky, A. Khatibi, J.-W. Kim, N. Kinany, H.H. Kitzler, S. Kolind, Y. Kong, P. Kudlička, P.
Kuntke, N.D. Kurniawan, S. Kusmia, R. Labounek, M.M. Laganà, C. Laule, C.S. Law, C. Lenglet, T. Leutritz, Y. Liu,
S. Llufriu, S. Mackey, E. Martinez-Heras, L. Mattera, I. Nestrasil, K.P. O’Grady, N. Papinutto, D. Papp, D. Pareto,
T.B. Parrish, A. Pichiecchio, F. Prados, À. Rovira, M.J. Ruitenberg, R.S. Samson, G. Savini, M. Seif, A.C. Seifert,
A.K. Smith, S.A. Smith, Z.A. Smith, E. Solana, Y. Suzuki, G. Tackley, A. Tinnermann, J. Valošek, D. Van De Ville,
M.C. Yiannakas, K.A. Weber II, N. Weiskopf, R.G. Wise, P. O. Wyss, J. Xu: study design and conceptualisation;
and data acquisition; manuscript editing and revision.
Scientific Data | (2021) 8:219 | https://doi.org/10.1038/s41597-021-00941-8 15www.nature.com/scientificdata/ www.nature.com/scientificdata
Competing interests
Guillaume Gilbert is an employee of Philips Healthcare.
Additional information
Supplementary information The online version contains supplementary material available at https://doi.
org/10.1038/s41597-021-00941-8.
Correspondence and requests for materials should be addressed to J.C.-A.
Reprints and permissions information is available at www.nature.com/reprints.
Publisher’s note Springer Nature remains neutral with regard to jurisdictional claims in published maps and
institutional affiliations.
Open Access This article is licensed under a Creative Commons Attribution 4.0 International
License, which permits use, sharing, adaptation, distribution and reproduction in any medium or
format, as long as you give appropriate credit to the original author(s) and the source, provide a link to the Cre-
ative Commons license, and indicate if changes were made. The images or other third party material in this
article are included in the article’s Creative Commons license, unless indicated otherwise in a credit line to the
material. If material is not included in the article’s Creative Commons license and your intended use is not per-
mitted by statutory regulation or exceeds the permitted use, you will need to obtain permission directly from the
copyright holder. To view a copy of this license, visit http://creativecommons.org/licenses/by/4.0/.
The Creative Commons Public Domain Dedication waiver http://creativecommons.org/publicdomain/zero/1.0/
applies to the metadata files associated with this article.
© The Author(s) 2021
Julien Cohen-Adad 1,2,3 ✉, Eva Alonso-Ortiz1, Mihael Abramovic4, Carina Arneitz4,
Nicole Atcheson 5, Laura Barlow6, Robert L. Barry7,8,9, Markus Barth 10, Marco Battiston11,
Christian Büchel 12, Matthew Budde13, Virginie Callot 14,15, Anna J. E. Combes16,
Benjamin De Leener17,18, Maxime Descoteaux19,20, Paulo Loureiro de Sousa 21,
Marek Dostál 22, Julien Doyon23, Adam Dvorak 24, Falk Eippert25, Karla R. Epperson26,
Kevin S. Epperson26, Patrick Freund 27, Jürgen Finsterbusch12, Alexandru Foias1,
Michela Fratini28,29, Issei Fukunaga30, Claudia A. M. Gandini Wheeler-Kingshott11,31,32,
Giancarlo Germani32, Guillaume Gilbert33, Federico Giove 34,29, Charley Gros 1,5,
Francesco Grussu11,35, Akifumi Hagiwara30, Pierre-Gilles Henry36, Tomáš Horák37,
Masaaki Hori 38, James Joers 36, Kouhei Kamiya39, Haleh Karbasforoushan 40,41,
Miloš Keřkovský22, Ali Khatibi 23,42, Joo-Won Kim43, Nawal Kinany44,45, Hagen H. Kitzler 46,
Shannon Kolind6,24,47, Yazhuo Kong 48,49,50, Petr Kudlička 37, Paul Kuntke46,
Nyoman D. Kurniawan 5, Slawomir Kusmia51,52,53, René Labounek 54,55,
Maria Marcella Laganà 56, Cornelia Laule57, Christine S. Law 58, Christophe Lenglet 36,
Tobias Leutritz 59, Yaou Liu60,61, Sara Llufriu62, Sean Mackey58, Eloy Martinez-Heras 62,
Loan Mattera63, Igor Nestrasil 36,54, Kristin P. O’Grady 16,64, Nico Papinutto65,
Daniel Papp1,50, Deborah Pareto66, Todd B. Parrish40, Anna Pichiecchio31,32,
Ferran Prados 11,52,67, Àlex Rovira66, Marc J. Ruitenberg 68, Rebecca S. Samson11,
Giovanni Savini 32, Maryam Seif27,59, Alan C. Seifert43, Alex K. Smith50, Seth A. Smith16,64,
Zachary A. Smith69, Elisabeth Solana62, Y. Suzuki39, George Tackley 51,
Alexandra Tinnermann12, Jan Valošek 70, Dimitri Van De Ville 44,45, Marios C. Yiannakas11,
Kenneth A. Weber II 58, Nikolaus Weiskopf 59,71, Richard G. Wise51,72, Patrik O. Wyss4 &
Junqian Xu43
1
NeuroPoly Lab, Institute of Biomedical Engineering, Polytechnique Montreal, Montreal, QC, Canada. 2Functional
Neuroimaging Unit, CRIUGM, Université de Montréal, Montreal, QC, Canada. 3Mila - Quebec AI Institute, Montreal,
QC, Canada. 4Department of Radiology, Swiss Paraplegic Centre, Nottwil, Switzerland. 5Centre for Advanced
Imaging, The University of Queensland, Brisbane, Australia. 6Department of Radiology, University of British
Columbia, Vancouver, BC, Canada. 7Athinoula A. Martinos Center for Biomedical Imaging, Department of Radiology,
Massachusetts General Hospital, Charlestown, MA, USA. 8Department of Radiology, Harvard Medical School,
Boston, MA, USA. 9Harvard–Massachusetts Institute of Technology Health Sciences & Technology, Cambridge, MA,
USA. 10School of Information Technology and Electrical Engineering, The University of Queensland, Brisbane,
Australia. 11NMR Research Unit, Queen Square MS Centre, UCL Queen Square Institute of Neurology, Faculty of
Brain Sciences, University College London, London, UK. 12Department of Systems Neuroscience, University Medical
Scientific Data | (2021) 8:219 | https://doi.org/10.1038/s41597-021-00941-8 16You can also read