A World Equilibrium Model of the Oil Market - Kellogg School ...
←
→
Page content transcription
If your browser does not render page correctly, please read the page content below
A World Equilibrium Model of the Oil Market∗
                           Gideon Bornstein†, Per Krusell‡ and Sergio Rebelo§

                                                  January 2021

                                                      Abstract

            We use new, comprehensive micro data on oil fields to build and estimate a structural model
        of the oil industry embedded in a general equilibrium model of the world economy. In the
        model, firms that belong to OPEC act as a cartel. The remaining firms are a competitive fringe.
        We use the model to study the macroeconomic impact of the advent of fracking. Fracking
        weakens the OPEC cartel, leading to a large long-run decline in oil prices. Fracking also reduces
        the volatility of oil prices in the long run because fracking firms can respond more quickly to
        changes in oil demand.

        J.E.L. Classification: Q4
        Keywords: oil, fracking, commodities, volatility.

  ∗
      An earlier version of this paper was circulated under the title "Lags, Costs, and Shocks: An Equilibrium Model
of the Oil Industry." We thank Hilde Bjornland, Craig Burnside, Mario Crucini, Wei Cui, Jésus Fernández-Villaverde,
Matteo Iacoviello, Ravi Jaganathan, Ryan Kellogg, Lutz Kilian, Markus Kirchner, Laura Murphy, Valerie Ramey, and
Rob Vigfusson for their comments.
  †
    Wharton School, University of Pennsylvania.
  ‡
    Institute for International Economic Studies, NBER, and CEPR.
  §
    Northwestern University, NBER, and CEPR.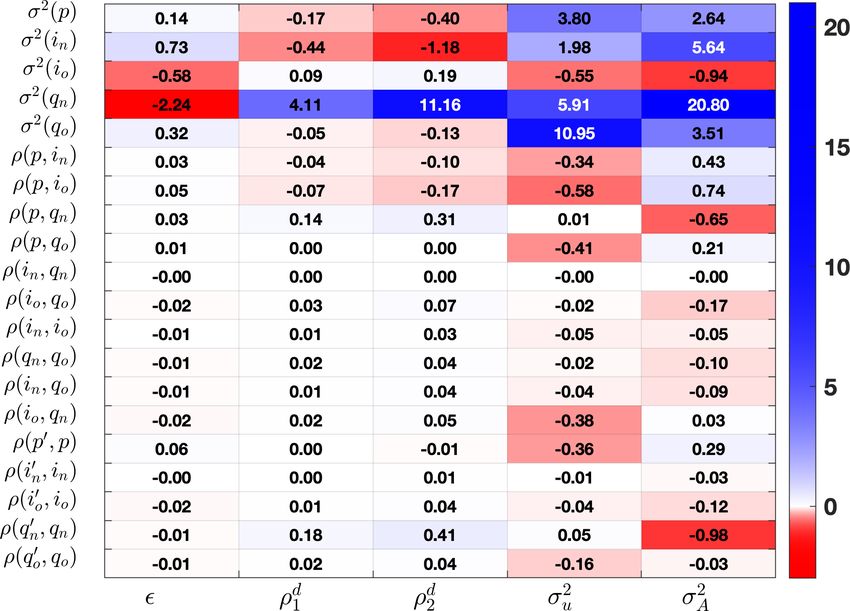
1   Introduction

In this paper, we build and estimate a structural model of the oil industry embedded in a gen-
eral equilibrium model of the world economy. Our modeling of production and investment in
the oil industry relies heavily on a new proprietary data set compiled by Rystad Energy that con-
tains information on production, reserves, operational costs, and investment for all oil fields. The
data include information about roughly 14,000 oil fields operated by 3,200 companies across 109
countries.
    These data guide the construction of our model in two ways. First, we use it to obtain micro
estimates of two key model parameters: the average lag between investment and production and
the elasticity of extraction costs with respect to production. Second, we employ the data to obtain
a set of second moments for oil-related aggregate variables. We use the generalized method of
moments (GMM) to estimate the remaining model parameters, targeting these moments.
    We use our model to study the macroeconomic consequences of the ongoing large structural
changes in the oil industry associated with the advent of hydraulic fracturing (fracking). This
production technique involves pumping a mixture of water, sand, and chemicals at high pressure
into shale rock formations to open up small fissures that release oil and gas. Combined with the
ability to drill horizontally through shale layers over long distances, fracking has transformed the
U.S. from a top oil importer to a top oil exporter. The expansion of fracking continues, not just in
the U.S. but also in countries such as Argentina, China, Mexico, and Russia.
    We document two important differences between fracking and conventional oil production.
First, adjusting production in the short run is cheaper for fracking firms, so these firms are more
responsive to changes in oil prices. The elasticity of operational costs with respect to the extrac-
tion rate is about five times lower in fracking than in conventional oil production. Second, the
average lag between investment and production is much shorter in fracking (one year) than in
conventional oil production (12 years).
    Our model features two types of firms: those that belong to the Organization of the Petroleum
Exporting Countries (OPEC) and those that do not. OPEC firms act as a cartel. Non-OPEC firms
are a competitive fringe.
    This structural model implies that the expansion of fracking results in large long-run declines
in the level and volatility of oil prices. The main reason for the decline in the level of oil prices
is that fracking weakens OPEC’s market power. Even though OPEC manages to retain its market
share, it does so by expanding production, contributing to the fall in oil prices. The main reason

                                                 1
for the decline in the volatility of oil prices is that fracking firms can respond more quickly to
changes in oil demand.
       Our model’s implication that OPEC’s market share remains relatively stable after the advent
of fracking is consistent with the data. Most of the rise in the market share of fracking firms has
been compensated by a fall in the market share of non-OPEC conventional oil producers.
       Our estimated model has three key features. First, demand is relatively inelastic. Second,
supply is elastic in the long run because firms can invest in the discovery of new oil fields.1 Third,
supply is inelastic in the short run. This property results from three model features: a lag between
investment and production, convex costs of adjusting extraction rates, and decreasing returns to
oil investment.
       One interesting property of our model is that it accounts for the high correlation between real
oil prices and real investment in the oil industry. In the literature on the cattle and hog cycles
(e.g., Ezekiel (1938) and Nerlove (1958)), this positive correlation is often interpreted as resulting
from backward-looking expectations. Under this interpretation, when prices rise, firms expect
prices to remain high, so they increase their investments. This rise in investment expands supply
and causes prices to fall, so the expectation of high prices is irrational. In our model, the high
correlation between the price of oil and investment follows naturally from the rational response of
forward-looking firms. A persistent, positive demand shock raises the price of oil above its steady-
state level. As a result, it is profitable to invest in oil to expand production and take advantage of
the high oil prices. So, over time, the resulting supply expansion brings the oil price back to its
steady state level.
       Our work relates to four strands of research. The first strand studies the relation between oil
price fluctuations and business cycles. Examples include Backus and Crucini (2000), Leduc and
Sill (2004), Blanchard and Gali (2007), Kilian (2009), Bodenstein, Erceg, and Guerrieri (2011), Lippi
and Nobili (2012), and Arezki, Ramey, and Sheng (2016).2 Relative to this literature, our main
contribution is to construct a model of the world economy in which OPEC acts as a cartel with the
oil production technology parameters estimated using micro data.
   1
       While the amount of oil is ultimately finite, we can think about this investment process as including new ways of
extracting oil as well as the development of oil substitutes, as in Adao, Narajabad, and Temzelides (2017) and Stuermer
and Schwerhoff (2020). A large expansion of oil reserves took place during our sample period. According to the U.S.
Energy Information Administration, proved oil reserves measured in years of production have increased from roughly
30 years in 1980 to 52 years in 2015.
   2
     Earlier work on the impact of oil shocks on the economy generally treats oil prices as exogenous (see, e.g., Kim,
and Loungani 1992, Rotemberg and Woodford 1996, and Finn 2000).

                                                            2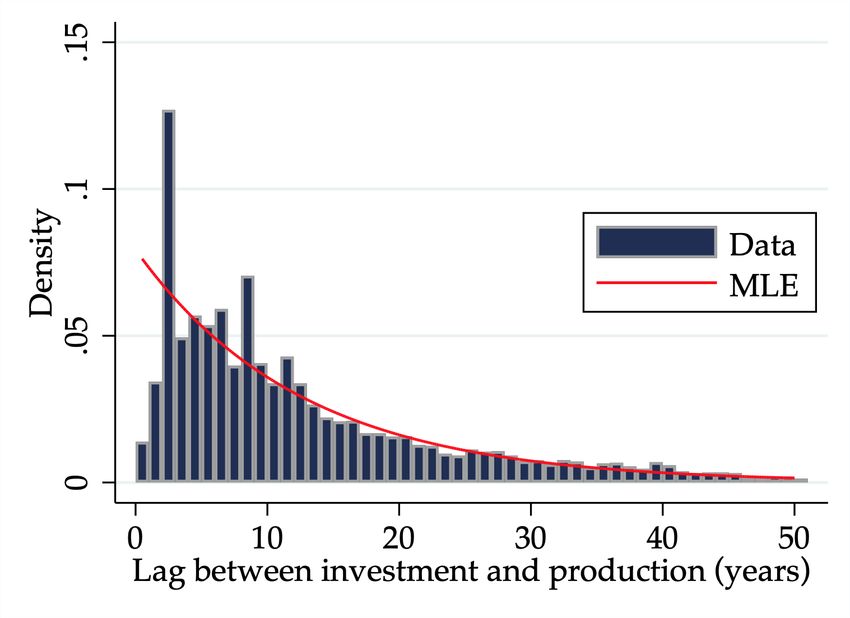
The second strand is a new, emerging literature that uses micro data to shed new light on
key aspects of the oil industry. Examples include Kellogg (2014), Anderson, Kellogg, and Salant
(2017), Bjornland, Nordvik, and Rohrer (2017), Asker, Collard-Wexler, and De Loecker (2019), and
Newell and Prest (2019). Relative to this literature, our main contribution is to construct a general
equilibrium model of oil and output production.
      The third strand is a literature that relies on structural vector autoregressions to estimate the
importance of demand and supply shocks on oil prices and oil production. Examples include
Kilian (2009), Kilian and Murphy (2014), Baumeister and Hamilton (2019), Herrera and Rangaraju
(2020), and Zhou (2020). These analyses generally apply to stationary environments. Our con-
tribution relative to this literature is to provide a structural model that can be used to study an
important structural change in the oil industry: the advent of fracking.
      The fourth strand consists of papers that study the impact of fracking on aspects of the U.S. eco-
nomy, such as stock market valuations (Gilje, Ready, and Roussanov 2016) and real GDP (Melek,
Plante, and Yücel 2017). Relative to this literature, our contribution is to study how the advent of
fracking shapes the dynamics of oil prices and world economic activity.
      This paper is organized as follows. We describe our model in Section 2. In Section 3, we present
our parameter estimates obtained using both micro data and moments of key aggregate variables
for the oil industry. In Section 4, we use our model to study the impact of the advent of fracking
on the economy. Section 5 includes different robustness analyses. Section 6 concludes.

2     The oil market in a general equilibrium model

In this section, we describe a model of the oil industry embedded in a general equilibrium model
of the world economy.

2.1     Representative Household

The economy is populated by a representative household who owns the oil companies, supplies
labor (Nt ), invests in physical capital (Kt ), and consumes a final good (Ct ). The household problem
is
                                                     ∞                           1−γ
                                                                           Nt1+ν

                                                     X
                                                           t  1
                                   max          E0         β        Ct − ϕ            ,
                           {Ct ,Kt+1 ,Lt }∞
                                          t=0                1−γ           1+ν
                                                     t=0

                            s.t.    Ct + Kt+1 ≤ (1 + rt − δ)Kt + wt Nt + ΠO
                                                                          t ,                        (1)

                                                               3
where ΠO
t is the total profit from oil companies. The variables rt and wt denote the rental rate of
capital and the real wage rate, respectively. The parameter δ denotes the rate of depreciation of
physical capital.
The first-order conditions of the household problem are
1 1
Nt = ϕ− ν wtν , (2)
h i
1 = Et β̃ t+1 (1 + rt+1 − δ) , (3)
where
Mt+1
β̃ t+1 ≡ β .
Mt
The variable Mt denotes the marginal utility of consumption:
−γ
Nt1+ν
Mt ≡ C t − ϕ .
1+ν
2.2 Final goods producers
There is a continuum with measure one of competitive final goods producers. Their output (Yt ) is
produced according to a CES production function that combines oil (Ot ) and value added. Value
added is produced with a Cobb-Douglas production function that combines physical capital and
labor. We normalize the price of the final good to one.
The problem of a final-good producer is
max Yt − wt Nt − rt Kt − pt Ot ,
{Lt ,Kt ,Ot ,Yt }
−1 −1
−1
α 1−α
s.t. Yt = (1 − so )At Kt Nt + so Ot
, (4)
where pt is the price of oil. The variable At denotes the exogenous level of total factor productivity,
which follows an AR(2) in logarithms:
ln At = ρA A a
1 ln At−1 + ρ2 ln At−2 + t .
The disturbance at is normally distributed with mean zero and variance σa2 . Throughout the pa-
per, we refer to at as shocks to oil demand. The AR(2) specification allows the model to fit the
data much better than an AR(1) specification. Demand shocks need to be very persistent to in-
duce a large response in oil investment. This response allows the model to be consistent with the
positive correlation between oil prices and oil investment, as well as with the high volatility of oil
investment.
4The first-order conditions for the firm’s problem are
1
−1
pt = so Yt Ot , (5)
1 − 1
wt = (1 − α)(1 − so )At Yt Ktα Nt1−α Ktα Nt−α , (6)
1 − 1
rt = α(1 − so )At Yt Ktα Nt1−α Ktα−1 Nt1−α . (7)
Equation (5) represents the demand for oil. The presence of Yt makes this demand dynamic.
The level of Yt reflects past oil prices that influenced past capital accumulation decisions. In addi-
tion, Yt responds to anticipated movements in future oil prices through changes in physical-capital
investment.
2.3 The oil sector
The oil sector is composed of an OPEC cartel and a non-OPEC competitive fringe. OPEC firms
are all conventional oil producers. The set of non-OPEC firms includes both conventional oil
producers and fracking firms.
2.3.1 Non-OPEC conventional oil producers
There is a continuum with measure one of competitive non-OPEC conventional oil producers.
These firms maximize their value (V N ), which is given by
∞ h i
X η
V N = E0 β t Mt pt θtN RtN − ItN − ψ θtN RtN . (8)
t=0
Here, ItN denotes investment, θtN the extraction rate (the ratio of production to reserves), and
RtN oil reserves. To simplify, we abstract from taxes and royalties for both non-OPEC and other
producers.3
η
The term ψ θtN RtN represents the cost of extracting oil. We assume that this cost is linear in
reserves so that aggregate production and aggregate extraction costs are invariant to the distribu-
tion of oil reserves across firms. This formulation allows us to use a representative firm to study
production and investment decisions. We assume that η > 1, so that extraction costs are convex in
the extraction rate. In addition, we assume that the time t + 1 extraction rate is chosen at time t.
3
η
When taxes or royalties are a fraction of the cash flow, pt θtN RtN − ItN − ψ θtN RtN , they do not affect a firm’s
incentives to produce or invest.
5We adopt a parsimonious way of modeling lags in investment by introducing exploration cap-
ital, which we denote by Xt . The law of motion for Xt is as follows:
N
ξ 1−ξ
Xt+1 = (1 − λ)XtN + ItN LN . (9)
Investment adds to next period’s exploration capital. Only a fraction λ of the exploration capital
materializes into oil reserves in every period. Investment requires land (LN ) and exhibits decreas-
ing returns (ξ < 1). Without this feature, investment would be extremely volatile, rising sharply
when oil prices are high and falling steeply when oil prices are low.
The timing of the realization of shocks and firm decisions is as follows. In the beginning of
the period, the demand and supply shocks are realized, a fraction λ of the exploration capital ma-
terializes into new oil reserves, and production occurs according to the predetermined extraction
rate. At the end of the period, the firm chooses its investment and its extraction rate for the next
period.
One interpretation of equation (9) is as follows. Suppose each firm searches for oil on a con-
tinuum of oil fields containing XtN barrels of oil uniformly distributed across fields. The probabil-
ity of finding oil is independent across oil fields and equal to λ. By the law of large numbers, each
firm finds λXtN oil reserves at time t. This interpretation is consistent with the way in which we
estimate λ using our micro data.
An alternative interpretation is that there is a continuum of identical firms investing in explora-
tion capital, but only a fraction λ discovers oil in every period. Since the representative household
holds a continuum of these firms, the idiosyncratic risk of oil discovery is diversified away. Ag-
gregating the behavior of these individual firms would yield a structure that is equivalent to our
representative-firm model. This interpretation is also consistent with our micro data analysis.
Oil reserves evolve as follows:
N
Rt+1 = (1 − θtN )RtN + λXt+1
N
. (10)
Reserves fall with oil production (θtN RtN ) and rise as exploration capital materializes into new
N ).
reserves (λXt+1
The notion of exploration capital embodied in equations (9) and (10) is a tractable way of
introducing time to build in investment that might be useful in other problems. This formulation
allows us to introduce a lag between investment and production by adding only one state variable.
The parameter λ allows us to smoothly vary the length of this lag.4 When λ = 0 and η > 1, the
4
See Rouwenhorst (1991) for a discussion of the large state space and complex dynamics associated with time-to-
build formulations.
6non-OPEC firm problem is similar to the one in Anderson, Kellogg, and Salant (2017)’s model.
Changes in the extraction rate in our model play a role similar to drilling new wells in their model.
The problem of the representative non-OPEC firm is to choose the stochastic sequences for ItN ,
N , RN , and X N that maximize V N , defined in equation (8), subject to constraints (9) and (10).
θt+1 t+1 t+1
N is
The first-order condition for θt+1
η−1
N
Et β̃ t+1 pt+1 = Et β̃ t+1 ηψ θt+1 + Et β̃ t+1 µ1,N
t+1 , (11)
where µ1,N
t is the Lagrange multiplier corresponding to equation (10). The extraction rate at time
t + 1 is chosen at time t so as to equate the expected value of a barrel of oil, Et β̃ t+1 pt+1 , to the
N
η−1
sum of the expected value of the marginal cost of extraction, Et β̃ t+1 ηψ θt+1 and the expected
value of a barrel of oil reserves at the end of time t + 1, Et β̃ t+1 µ1,N
t+1 .
N is
The first-order condition for Rt+1
n h η io
µ1,N
t = Et β̃ t+1 p θ N
t+1 t+1 + (1 − θ N
)µ 1,N
t+1 t+1 − ψ θ N
t+1 . (12)
N , each extra barrel of oil reserves results in additional revenue with a value
For a given value of θt+1
N and additional extraction costs with a value β̃ N
η N
β̃ t+1 pt+1 θt+1 t+1 ψ θt+1 . A fraction 1 − θt+1 of the
barrel of oil reserves remains in the ground and has a value β̃ t+1 µ1,N
t+1 .
N is
The first-order condition for Xt+1
µ2,N
t = λµ1,N
t + (1 − λ)Et β̃ t+1 µ2,N
t+1 , (13)
where µ2,N
t is the Lagrange multiplier corresponding to equation (9). The value of increasing
exploration capital by one unit, µ2,N
t , has two components. A fraction λ of the exploration capital
materializes into oil reserves and has a value µ1,N
t . A fraction 1 − λ remains as exploration capital
and has an expected value Et β̃ t+1 µ2,N
t+1 .
The first-order condition for ItN is
ξ−1 1−ξ
1 = ξ ItN LN µ2,N
t . (14)
This condition equates the cost of investment (one unit of output) to the marginal product of
ξ−1 N 1−ξ
investment in generating exploration capital, ξ ItN L , evaluated at the value of explor-
ation capital, µ2,N
t .
The four optimality conditions, (11)-(14), together with the law of motion for oil reserves, (10),
and exploration capital, (9), are a subset of the implementability constraints faced by the OPEC
cartel.
72.3.2 Non-OPEC fracking producers
There is a continuum of measure one of non-OPEC fracking firms. The problem of the represent-
ative firm is to maximize its value (V F ):
∞
F
X
t
η F
max V = E0 β Mt pt θtF RtF − ItF −ψ F
θtF RtF , (15)
{ItF ,θtF ,Rt+1 t+1 }
F ,X F
t=0
subject to
F
ξ 1−ξ
Xt+1 = (1 − λF )XtF + ItF LF , (16)
F
Rt+1 = (1 − θtF )RtF + λF Xt+1
F
. (17)
Here, ItF denotes investment, θtF the extraction rate, XtF exploration capital, RtF oil reserves, and
LF the land available to the representative fracking firm. Implicit in this formulation is the as-
sumption that fracking firms can adjust their extraction rate within the period. We provide evid-
ence in favor of this assumption in Section 3.
The first-order condition for θtF is
ηF −1
pt = η F ψ F θtF + µ1,F
t , (18)
where µ1,F
t is the Lagrange multiplier corresponding to equation (17). The optimality conditions
F , F F , I F take the same form as those for non-OPEC firms (12-14).
for Xt+1 t+1 t
2.3.3 The OPEC cartel
We assume that OPEC firms operate as a cartel with commitment, while non-OPEC firms are a
competitive fringe. Stiglitz (1976) and Hassler, Krusell, and Olovsson (2010) solve for an equilib-
rium in which the oil market is controlled by a monopolist that faces a constant elasticity demand.
Our model is much more challenging to solve for two reasons. First, the cartel faces a residual
demand that is endogenous and does not have constant elasticity. Second, in our model, the ex-
traction decision has a dynamic element because the marginal cost of oil at time t is a function of
all past investment decisions.
We assume that all OPEC firms are conventional oil producers. The OPEC cartel maximizes the
discounted utility value of its profits. The cartel takes into account the impact of its decisions on
the price of oil as well as on other aggregate variables such as world output and real interest rates.
We assume that the OPEC cartel can commit to a policy and not deviate from it. Such commitment
is not time consistent. For example, OPEC has an incentive to announce high future production
8levels to deter investment by non-OPEC firms and, in the future, renege on this commitment to
push up oil prices.
The cartel operates a production technology identical to non-OPEC but has imperfect control
over the effective extraction rate. The cartel chooses an extraction rate θtO , but the effective extrac-
tion rate is eut θtO where ut is an i.i.d. shock drawn from a normal distribution with mean zero and
variance σu2 . This process can be thought of as a combination of departures from commitment and
other disruptions, such as wars. A major departure from commitment is represented by a large
positive shock and a significant war by a large negative shock.5
Two natural questions arise about this supply shock specification. The first is: why not model
ut as a persistent process? The answer is that such persistence does not change the properties of
the model because it is optimal for OPEC to adjust its extraction rate to offset predictable move-
ments in ut . Only unpredictable movements in ut have an impact on OPEC production. The
second question is: why assume that supply shocks affect only OPEC producers? In the robust-
ness section, we estimate a version of the model in which non-OPEC producers are also subject to
supply shocks. The estimated variance of these shocks is close to zero. Including supply shocks
to non-OPEC producers does not improve the model’s empirical performance.
The cartel maximizes
∞ h i
X η
E0 β t Mt pt eut θtO RtO − ItO − ψ eut θtO RtO , (19)
t=0
subject to the laws of motion for OPEC oil reserves and exploration capital (XtO ),
O
= 1 − eut θtO RtO + λXt+1
O
Rt+1 , (20)
ξ
O
Xt+1 = (1 − λ)XtO + ItO L1−ξ
O , (21)
as well as the implementability constraints. These constraints can be divided into five sets. The
first set includes the household budget constraint, (1), and the first-order conditions for the house-
hold, (2) and (3). The second set includes the production function for final goods (4) and the
first-order conditions of final goods producers, (5–7). The third set consists of the optimality con-
ditions for non-OPEC conventional oil producers. These conditions include the laws of motion
for exploration capital, (9), and oil reserves, (10), as well as the first-order conditions (11–14). The
fourth set consists of the optimality conditions for non-OPEC fracking producers. These condi-
tions include the laws of motion for oil reserves, (16), and exploration capital, (17), as well as the
5
We abstract from idiosyncratic supply shocks. Since there is a continuum of firms and these firms are owned by
diversified households, these shocks have no impact on the aggregate economy.
9first-order conditions for θtF , (18), and the first-order conditions for Xt+1
F , RF , I F , which take the
t+1 t
same form as those for non-OPEC conventional oil producers, (11–14). The fifth set includes the
equilibrium condition for oil markets:
eut θtO RtO + θtN RtN + θtF RtF = Ot .
We solve the model using the “timeless perspective” approach proposed by Woodford (1999)
and Woodford (2011). This approach can be implemented in two steps. First, we solve for a
non-stochastic steady state where the Lagrange multipliers of the OPEC problem on the imple-
mentability conditions are constant. This steady state is independent of the initial state of the
economy. If the economy converges to a steady state in the long run, it converges to this steady
state. Second, we linearize the model around this non-stochastic steady state in order to obtain a
recursive, time-invariant system.
2.4 The Hotelling rule revisited
The classic Hotelling (1931) rule emerges as a particular case of our model in which there are no
OPEC firms, no new oil reserves can be found (λ = 0), extraction costs are linear (η = 1), and
households are risk neutral (γ = 0). When λ is equal to zero, investment does not result in more
oil reserves, so oil is an exhaustible resource. Equation (13) implies that, in this case, the value of
exploration capital is zero: µ2,N
t = 0. Combining equations (11) and (12), we obtain
Et (pt+1 − ψ) = βEt (pt+2 − ψ).
This equation is the Hotelling rule: the price of oil minus the marginal cost of production is expec-
ted to rise at the rate of interest in order to make oil producers indifferent between extracting oil
at t + 1 and t + 2.
For the case in which λ ≥ 0 and η ≥ 1 and γ = 0, the marginal cost of production is ηψθtη−1
and the difference between the price of oil and the marginal cost of production is given by
η−1 η−1 η
Et pt+1 − ηψθt+1 = βEt pt+2 − ηψθt+2 + βEt (η − 1) ψθt+2 .
η
The term βEt (η − 1) ψθt+2 represents the marginal fall in production costs at time t + 2 from
having an additional barrel of oil reserves. When η = 1, this term is zero and we recover the
Hotelling rule.
When λ = 0 (no more oil can be found), there exists no steady state in which θt and pt are
constant. When the extraction rate is constant, production falls over time, and, since demand is
10downward sloping, the price of oil rises over time. When the price is constant, production must
also be constant, and so the extraction rate must rise.6
In our model, λ > 0 and η > 1. Because finding more oil is feasible, there is a steady state in
which both pt and θt are constant. Oil reserves are constant, and so the quantity produced is also
constant. In the steady state, the marginal decline in production costs from an additional barrel of
oil is such that the difference between price and marginal cost remains constant:
β (η − 1) ψθη = (1 − β) p − ηψθη−1 .
Our model’s implication that pt is constant in the long run is consistent with the fact that
the average annual growth rate in the real price of oil is not statistically different from zero.7
For the period 1900-2010, this average is 0.012 with a standard error of 0.020. For the period
1970-2010, this average is 0.036 with a standard error of 0.041. The property that average growth
rates of real prices estimated over long time periods are close to zero is shared by many other
commodities (see, e.g., Deaton and Laroque 1992, Harvey, Kellard, Madsen, and Wohar 2010,
Chari and Christiano 2014, and Stuermer and Schwerhoff 2020).
3 Estimation and quantitative analysis
In this section, we estimate the structural parameters of our model using both micro and aggregate
data and study the model’s quantitative properties. We start by describing our micro data, which
we use to obtain estimates for two key model parameters: the average lag between investment and
production (1/λ) and the elasticity of extraction costs with respect to production (η). We use the
generalized method of moments (GMM) to estimate the remaining model parameters, targeting a
set of second moments for aggregate oil-related variables constructed using the micro data.
3.1 Data on oil markets
Our empirical work relies on new proprietary data compiled by Rystad Energy that contains an-
nual data on production, reserves, operational costs, and investment for all oil fields. The data
6
One way to try to make the Hotelling model consistent with a constant real oil price is to assume that the marginal
cost of extraction falls over time. However, this marginal cost has to eventually fall below zero for the price to remain
constant.
7
We obtain oil prices for the period 1900-1948 from Harvey, Kellard, Madsen, and Wohar (2010). After 1947, our
measure of oil prices is the price per barrel of West Texas Intermediate. We deflate the price of oil using the U.S.
consumer price index.
11Table 1: Descriptive statistics
Time period 1970–2010 2011–2019
Firms OPEC Non-OPEC Non-OPEC OPEC Non-OPEC Non-OPEC
Technology conv. conv. fracking conv. conv. fracking
Average market share 42% 58% 0% 42% 53% 5%
Average production (Gbbl) 9,227 12,548 41 11,330 14,132 1,454
Average n. of operating oil fields 799 5,653 139 1,220 9,211 1,086
Notes: This table presents descriptive statistics of the three groups of firms in the data: OPEC conventional producers,
non-OPEC conventional producers, and non-OPEC fracking producers. We split the sample into two subperiods:
1970–2010 and 2011–2019. In 2011, fracking producers surpassed for the first time a 1 percent market share in world oil
production. Gbbl stands for billion barrels of oil.
cover roughly 14,000 oil fields operated by 3,200 companies across 109 countries. It includes in-
formation on both conventional and fracking oil fields. The latter include both tight-liquid and
shale fields.
Our sample covers the period 1970-2019. The Rystad sample includes data prior to 1970. We
excluded these data from our sample because it pertains to a period in which U.S. regulatory
agencies sought to keep U.S. oil prices stable by setting production targets (see, e.g., Hamilton
1983, Kilian 2014, and Fernandez-Villaverde 2017).
We construct investment expenditures as the sum of exploration and capital expenditures. Ex-
ploration expenditures include costs from acquiring acreage, doing seismic analysis, and drilling
wildcats or appraisal wells to discover and delineate oil fields. Capital expenditures include the
costs of building facilities and drilling wells.
Production operating expenditures comprise operational expenses directly related to produc-
tion: the lease cost and the fixed and variable costs. The latter include electricity, machinery,
salaries, and tariffs. All expenditures are deflated with the U.S. GDP deflator.
Table 1 reports some key statistics for the periods 1970-2010 and 2011-2019. These statistics
include the average values of production, the market share of OPEC and non-OPEC producers,
the share of production of fracking producers, and the number of oil fields in operation.
3.2 Estimating technological parameters of oil producers
To estimate λ, we compute the lag between the first year of investment and the first year of pro-
duction (Ti ) for every oil field in our data set. If the arrival of production occurs according to
12a Poisson process, the lag between investment and production follows a geometric distribution
with mean λ. The maximum likelihood estimator of λ is the inverse of the average lag between
investment and production
N
λ̂ = PN ,
i=1 Ti
where N denotes the number of oil fields. Our estimates of λ are 0.08 for conventional oil fields
and 0.98 for fracking fields. These estimates imply that the average lag between investment and
production is roughly 12 years for conventional oil fields and one year for fracking fields. These
estimates are consistent with textbook discussions of the lag between investment and oil produc-
tion (see, e.g., chapter 1 of Suicmez, Jing, Polikar, Allain, Pentland, and Dyson 2018 ).
Figure 1 shows the empirical distribution of this lag, together with the implied geometric dis-
tribution for our estimate of λ̂ for conventional and fracking fields.8
Figure 1: Empirical distribution of lags between investment and production
A. Conventional oil fields B. Fracking oil fields
Notes: This figure presents the histogram of the lag between the first year of investment and the first
year of production across conventional (panel A) and fracking (panel B) oil fields. The MLE for λ, the
Poisson arrival rate of production, is 0.08 for conventional oil fields and 0.98 for fracking fields. The red
lines are the implied geometric distribution for the different estimated values of λ.
We also use our micro data to estimate η, the parameter that controls the convexity of extraction
costs (see equation (8)). Since our data are collected at the oil field level, the elasticity of production
costs with respect to the extraction rate is likely to mostly reflect changes in the pace at which
8
Our estimate of the average production lag is higher than that reported in Arezki, Ramey, and Sheng (2016). This
difference occurs because we estimate the lag between initial investment (which includes seismic analysis and drilling
wells to discover and delineate oil fields) and production. Arezki, Ramey, and Sheng (2016) estimate the lag between
oil discovery and production, which is shorter.
13additional wells are drilled.9 As Anderson, Kellogg, and Salant (2017) emphasize, drilling rigs
and crews are a relatively fixed resource in the short run, so drilling faster to raise oil production
increases costs of leasing equipment, hiring personnel, and so on. The parameter η represents
these cost convexities.
Our estimate is based on the following regression:
C(θit , Rit )
ln = γi + η ln (θit ) + εit ,
Rit
where C(θit , Rit ) denotes extraction costs.
The potential presence of cost shocks, either field specific or aggregate, creates an endogeneity
problem. Suppose it becomes more costly to extract oil, so that firms reduce their extraction rates.
This correlation between the cost and the rate of extraction biases downward our estimate of η.
To address this problem, we instrument the extraction rate with the one-year-ahead forecast of
detrended world real GDP. This forecast is correlated with aggregate demand and unaffected by
field-specific cost shocks. Our forecast is computed by linearly detrending the time series for
world real GDP and estimating an AR process for the detrended data. We chose the number of
lags according to the Akaike information criterion. This procedure resulted in the selection of an
AR(2) process.
Our data include all oil fields with positive extraction rates between 1970 and 2019. We exclude
the last year of an oil field’s operation because the cost data for this year include the costs of
shutting down the field, which are not related to the rate of extraction.
Table 2 contains our slope estimates for conventional and fracking oil fields. All specifications
include fixed effects for oil field and operation year (i.e., the age of the oil field). Specification
1 includes all oil fields in our sample. Specification 2 includes only conventional non-OPEC oil
fields. Specification 3 includes only fracking non-OPEC oil fields. Specification 4 includes only
OPEC oil fields.
While our instrument is independent of oil-field-specific cost shocks, it may be correlated with
aggregate supply shocks. The Iran-Iraq war, for example, may have caused a slowdown in world
GDP at the same time as it disrupted the supply of oil in the warring countries. For this reason, we
use specification 2 as our benchmark and set η to the point estimate implied by this specification
(6.1).10
9
Anderson, Kellogg, and Salant (2017) show that production from individual oil wells does not respond to oil price
changes. They also show that, in contrast, the number of wells that are drilled (rig activity) does respond to oil price
changes.
10
As a robustness check, we added royalties to our measure of operational costs and estimated η using this broader
14Table 2: Extraction rate adjustment costs regression
Dep. variable: ln(prod. costs per barrel of oil reserves)
Variable (1) (2) (3) (4)
ln(extraction) 6.04∗∗∗ 6.11∗∗∗ 2.23∗∗∗ 6.79∗∗∗
(0.34) (0.37) (0.75) (1.21)
Oil field FE 3 3 3 3
Operation year FE 3 3 3 3
Sample All Non-OPEC Non-OPEC OPEC
Technology All Conventional Fracking Conventional
IV 3 3 3 3
1st stage F-stat 228 194 3 24
Clusters (oil fields) 13,506 11,103 939 1,464
Observations 303,457 260,552 8,819 36,086
Notes: This table presents the regression results for the adjustment cost coefficient, η. Standard errors
are clustered at the oil field level. The instrument used is the one-year-ahead forecast of detrended world
real GDP. ∗∗∗ - significant at the 1 percent level.
Specification 3 in Table 2 reports our estimates of η F for fracking oil fields. This estimate is
2.23, so fracking oil fields have extraction costs that are significantly and substantially less convex
than conventional oil producers.
Our results are consistent with the findings of Bjornland, Nordvik, and Rohrer (2017) and
Newell and Prest (2019). These authors use U.S. monthly well-level data to show that oil produc-
tion from shale wells is much more flexible than conventional oil production.
Additional evidence that fracking operations are very flexible comes from data compiled by
Baker Hughes on the number of oil rigs in operation in the U.S. Figure 2 displays these data
together with the nominal oil price. Between January 2009 and September 2014, oil prices rose
from 42 dollars to 93 dollars per barrel. During this period, the number of oil rigs in operation in-
creased from 345 to 1,600. Most of the new rigs are likely to have been used in fracking operations.
Between September 2014 and February 2016, oil prices plummeted from 93 dollars to 30 dollars
per barrel. During this period, the number of oil rigs in operation fell from 1,600 to 400.
In sum, there are two important differences between fracking and conventional forms of oil
production. First, the lag between investment and production is much shorter for fracking oper-
ations. Second, it is much less costly to adjust the extraction rate in fracking operations than in
cost measure. We obtain a slightly higher estimate: 7.5 with a standard error of 0.5.
15Figure 2: U.S. oil rigs in operation and the price of oil
Notes: This figure presents the number of oil rigs in operation (blue line, left axis) and the nominal USD
price of a barrel of oil (red line, right axis). Data source: Baker Hughes.
conventional oil operations. Motivated by this evidence, we calibrate fracking firms so that the lag
between investment and production is only one year and the extraction rate, θtF , can be adjusted
contemporaneously.
3.3 Calibrated parameters
We set α, the share of physical capital in value added, to 1/3 and ϕ to 1.91, so that steady-state
hours worked is equal to 1/3. The parameter ψ matters only for the level of oil prices. We nor-
malize it so that the price of oil, measured in units of output, equals one in the steady state. We
set the household’s discount factor, β, to 0.99, the coefficient of relative risk aversion, γ, to 2, and
the Frisch elasticity of labor demand, ν, to 0.5. We set the annual rate of depreciation of physical
capital, δ, to 0.1.
We first calibrate a version of our model with no fracking firms using data for the period 1970-
2010. During this period, fracking represents less than 1 percent of the global oil supply. We choose
the ratio LO /LN so that in the steady state, the market share of OPEC production coincides with
the average market share of OPEC in the data (42 percent). The level of ξ and the total amount of
land (LO + LN ) are calibrated so that the steady-state extraction rates for OPEC and non-OPEC
coincides with the average extraction rate in our data, 1.8 and 3.6 percent, respectively. We choose
16the weight of oil in the production of final output, so , to match the average share of oil revenues
in world GDP, 2.9 percent.
3.4 GMM estimation
We estimate a version of our model without fracking firms using data for the period 1970-2010.
The parameters of the processes for productivity and supply shocks are estimated using GMM.11
The first column of Table 4 presents the moments targeted in our estimation. Before we discuss
the ability of our model to fit the empirical moments, it is useful to highlight some salient facts
about the oil market that are reflected in these moments.
The first fact is that oil prices have been very volatile since the early 1970s. From 1970 to 2010,
the volatility of oil prices is higher than that of returns to the stock market or exchange rates. The
standard deviation of the annual percentage change in oil prices is 27 percent for nominal and real
oil prices. In contrast, the annual standard deviation of nominal returns to the S&P 500 is roughly
16 percent, and the annual standard deviation of changes in exchange rates is roughly 10 percent.
The high volatility of commodity prices in general was aptly summarized by Deaton (1999) with
the statement “What commodity prices lack in trend, they make up for in variance.”
The second fact is that investment in the oil industry is very volatile. The annual standard
deviation of the growth rate of real world investment in the oil industry in the period 1970-2010
is 0.17. To put this number in perspective, this measure of volatility is 0.10 for U.S. manufacturing
investment and 0.07 for U.S. aggregate investment.
The third fact is that investment in the oil industry is positively correlated with oil prices. The
correlation between the growth rate of real oil prices and the growth rate of investment is 0.54.
Table 3 reports this for each of the top 20 firms in the oil industry ranked according to their total
oil production in 2015. This table shows that, with a few exceptions, there is high correlation
between real oil prices and firm-level investment.
Finally, OPEC and non-OPEC firms differ in the volatility and persistence of production and
investment, as well as in the correlation of these variables with real oil prices. The production
of OPEC firms is more volatile and less persistent than that of non-OPEC firms. In addition,
the correlation between investment and prices is higher for non-OPEC firms than for OPEC firms.
These patterns are likely to be the result of supply shocks to OPEC firms, which include deviations
11
Our weighting matrix is a diagonal matrix with diagonal elements equal to the inverse of the variance of the
targeted moments.
17Table 3: Investment and price correlation for top 20 firms
Firm Headquarters OPEC corr(∆pt , ∆it )
Saudi Aramco Saudi Arabia 3 0.31
Rosneft Russia 7 0.34
PetroChina China 7 0.36
Kuwait Petroleum Corp (KPC) Kuwait 3 0.3
NIOC (Iran) Iran 3 0.06
Pemex Mexico 7 0.27
ExxonMobil United States 7 0.35
Lukoil Russia 7 0.41
Petrobras Brazil 7 0.3
PDVSA Venezuela 3 0.28
Abu Dhabi NOC Abu Dhabi 3 0.14
Chevron United States 7 0.43
Shell Netherlands 7 0.34
BP United Kingdom 7 0.35
Surgutneftegas Russia 7 0.26
South Oil Company (Iraq NOC) Iraq 3 0.19
Total France 7 0.04
CNOOC China 7 0.4
Statoil Norway 7 0.34
Eni Italy 7 0.04
Notes: This table presents the correlation between the growth rate of investment and the growth rate
in oil prices for the top-20 oil producers, in descending order of production volume. In the table, xt
represents the logarithm of Xt , ∆xt is equal to xt − xt−1 , and pt and it represent the logarithm of the
real price of oil and the logarithm of the firm’s real investment, respectively.
18Table 4: Data and model moments
Moment Data (s.e.) Model Moment Data (s.e.) Model
(1) std(∆pt ) 0.27 (0.03) 0.22 (11) corr(∆iN N
t , ∆qt ) 0.07 (0.12) 0.10
(2) std(∆iN
t ) 0.18 (0.03) 0.16 (12) corr(∆iN
t , ∆qtO ) 0.04 (0.13) 0.04
(3) std(∆iO
t ) 0.17 (0.03) 0.21 (13) corr(∆iO
t , ∆qtN ) -0.11 (0.18) 0.08
(4) std(∆qtN ) 0.02 (0.003) 0.02 (14) corr(∆iO
t , ∆qtO ) -0.28 (0.13) 0.04
(5) std(∆qtO ) 0.07 (0.01) 0.08 (15) corr(∆qtN , ∆qtO ) -0.07 (0.14) 0.40
(6) corr(∆pt , ∆iN
t ) 0.49 (0.14) 0.61 (16) corr(∆pt ,∆pt−1 ) -0.06 (0.09) -0.31
(7) corr(∆pt , ∆iO
t ) 0.33 (0.11) 0.60 (17) corr(∆iN N
t ,∆it−1 ) 0.13 (0.16) 0.05
(8) corr(∆pt , ∆qtN ) 0.00 (0.09) 0.08 (18) corr(∆iO O
t ,∆it−1 ) 0.29 (0.11) 0.04
(9) corr(∆pt , ∆qtO ) 0.04 (0.14) -0.69 (19) corr(∆qtN ,∆qt−1
N ) 0.67 (0.10) 0.71
(10) corr(∆iN
t , ∆iO
t ) 0.67 (0.12) 1.00 (20) corr(∆qtO ,∆qt−1
O ) 0.25 (0.20) -0.31
Notes: This table presents the targeted moments from the data and the model-implied moments under the benchmark
specification. Newey-West standard errors computed with five-year lags in parentheses. In the table, xt represents the
logarithm of Xt , ∆xt is equal to xt − xt−1 , and the variables qtN and qtO represent the logarithm of oil production for
non-OPEC and OPEC firms, respectively.
of the cartel from perfect commitment and disruptions such as the Iranian revolution and the Iran-
Iraq war.
Table 4 compares the estimated moments targeted by our GMM procedure with the popula-
tion moments implied by our model. We see that the model fit is relatively good given that we
only have five parameters to target 20 moments.12 As discussed in the introduction, the model is
consistent with the high correlation between the real price of oil and real investment.
Table 5 reports our five parameter estimates. Our point estimate for is 0.15 with a standard
error of 0.003. This estimate, which is similar to the ones reported in Caldara, Cavallo, and Iac-
oviello (2017) and Hassler, Krusell, and Olovsson (2019), implies that oil demand is very inelastic.
A 1 percent increase in production reduces oil prices by 7 percent. To see why demand has to
be inelastic to fit the data, it is useful to write the logarithm of the demand for oil by final good
producers:
1 1
ln pt = ln so + ln(Yt ) − ln(Ot ).
Our model embeds two mechanisms that generate price volatility. The first mechanism is a low
value of that makes low oil production volatility consistent with high price volatility. The second
12
In addition, the model is consistent with the ratio of average investment to revenue in the data (10 percent), which
is not targeted by the estimation procedure.
19Table 5: Estimated parameters
Parameter Estimate (s.e.)
0.15 (0.003)
ρa1 1.72 (0.07)
ρa2 -0.74 (0.08)
std(εat ) 0.013 (0.002)
std(ut ) 0.05 (0.005)
Notes: This table presents the benchmark GMM estimates of the structural parameters.
mechanism is changes in the demand for oil associated with changes in final goods production in-
duced by changes in At . The observed volatility and persistence of oil production and investment
help determine the importance of the two channels that generate volatility in pt and therefore
identify . Volatile, persistent shocks to At are important for generating volatility and persistence
in investment. A positive demand shock keeps the price of oil high for an extended period of time,
creating incentives to increase investment.
The parameters of the process for At imply a hump-shaped impulse response function that
peaks six years after the initial shock. This pattern is an important factor in driving investment
volatility. It takes time for investment to increase oil production, so investment does not respond
to short-lived shocks.
3.5 Identification
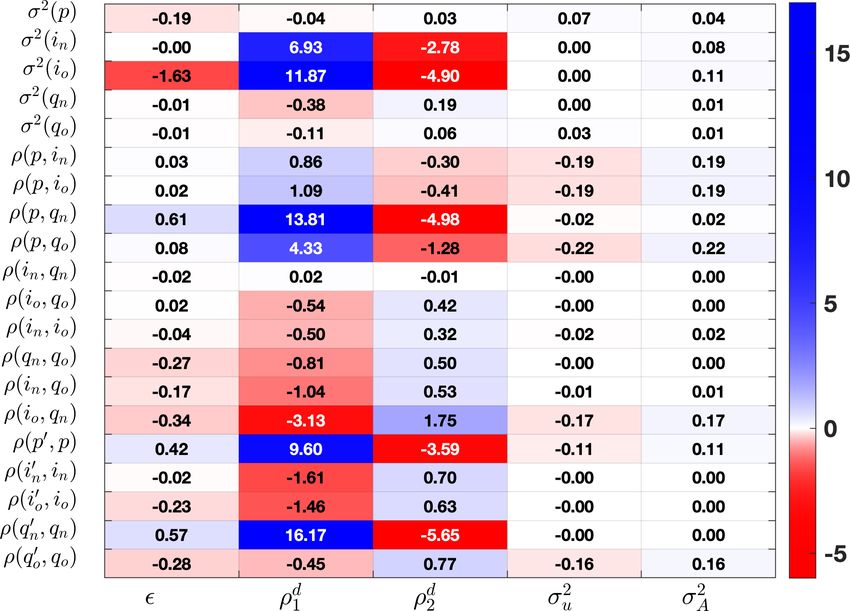
To discuss more formally our sources of identification, we use the method proposed by Andrews,
Gentzkow, and Shapiro (2017). This method involves computing the elasticity of estimated para-
meters with respect to observed data moments. We report these elasticities in panel A of Table 6.
Each row in this table shows how all the estimated model parameters would change if one data
moment increased, holding all the other data moments constant. We also report the elasticities of
model-implied moments with respect to the parameters in panel B of Table 6. Dark blue and red
colors highlight large positive and negative elasticities, respectively.
To see how these tables can help us understand the sources of identification, consider the
following question: why can’t we increase the volatility of the shocks to supply and demand
(σu2 and σA
2 ) to bring the model-implied volatility of oil prices closer to the data? As we can see
in the last two columns of panel B, increasing σu2 and σA
2 at the same time by the same amount
20Table 6: Sources of identification
A. Elasticity of parameters to moments B. Elasticity of moments to parameters
Notes: The left panel presents the elasticity of estimated parameters to the targeted moments, following
the approach of Andrews, Gentzkow, and Shapiro (2017). The right panel presents the elasticity of
model-implied moments to the structural parameters of the model.
raises the volatility of oil prices and the volatility of investment and production in OPEC and non-
OPEC while leaving the other moments basically unchanged. However, raising the volatility of
production in both OPEC and non-OPEC worsens the model fit. Rows 4 and 5 of panel A show
that if production of non-OPEC and OPEC were more volatile in the data, we would be able to
raise σu2 and σa2 to increase the model-implied price volatility, bringing it closer to the data.
Another reason not to increase σu2 is that, as element (ρ(qo0 , qo ), σu2 ) of panel B shows, it would
further reduce the first-order serial correlation of OPEC production, a moment that the model
undershoots. Panel A shows that the serial correlation of OPEC production is indeed important
in identifying σu2 .
A similar argument applies to the identification of the elasticity of oil demand, . Panel B
shows that lowering raises the volatility of oil prices, improving model performance along this
dimension. However, lowering would also raise the volatility of OPEC investment and non-
OPEC production, two moments that the model overshoots relative to the data. Rows 3 and 4 in
the first column of panel A show that the volatility of OPEC investment and non-OPEC production
are indeed important in identifying .
To further examine the forces that identify demand versus supply shocks, we construct a ver-
sion of the last two columns of Table 6 written in terms of two transformed variables, σ̄ 2 and ∆d .
21Table 7: Sources of identification - demand vs. supply shocks
A. Elasticity of parameters to moments B. Elasticity of moments to parameters
Notes: The left panel presents the elasticity of the estimated values of σ̄ 2 and ∆d to the targeted mo-
ments, following the approach of Andrews, Gentzkow, and Shapiro (2017). The right panel presents the
elasticity of model-implied moments with respect to these two structural parameters.
These variables are defined as follows:
σd2 = σ̄ 2 × ∆d ,
σ̄ 2
σu2 = .
∆d
A rise in σ̄ 2 increases the volatility of both demand and supply. A rise in ∆d increases the import-
ance of demand shocks relative to supply shocks.
Panel B of Table 7 displays the elasticity of model-implied moments to a change in either σ̄ 2 or
∆d in isolation. This change affects multiple moments simultaneously. We see that increasing the
importance of demand versus supply shocks (∆d ) increases the volatility of non-OPEC produc-
tion and reduces the volatility of OPEC production. These effects result from the fact that OPEC
production volatility is primarily driven by supply shocks.
Panel A of Table 7 displays the elasticity of the parameters with respect to a change in a given
data moment in isolation. This change affects multiple parameters simultaneously. We see that an
increase in the volatility of OPEC production reduces the relative importance of demand shocks.
In contrast, an increase in the volatility of non-OPEC production increases the relative importance
of demand shocks. In sum, the relative volatility of OPEC and non-OPEC production is key in
identifying the importance of supply versus demand shocks.
223.6 Other performance diagnostics
In this section, we evaluate whether our model is consistent with the estimates of the short-run
elasticity of supply obtained from the micro data. This set of moments was not targeted by our
estimation.
Estimating the short-run elasticity of oil supply. Oil producers can respond to an increase in
the price of oil in two ways. The first is to increase the extraction rate in order to produce more oil
from fields already in operation. The second is to increase the number of oil fields in operation.
We show that the short-run elasticity of the extraction rate with respect to an exogenous change in
the price of oil is positive but small. We also show that the elasticity of the number of oil fields in
operation to an exogenous change in the price of oil is statistically insignificant.
Table 8 reports panel data estimates of the elasticity of the extraction rate for a given oil field
with respect to real oil prices.13 These estimates suggest that a rise in oil prices generates only a
slight increase in the supply of oil from a given oil field.
Our estimates are obtained by running various versions of the following regression:
ln θit = αi + β ln pt + γXit + εit , (22)
where θit denotes the extraction rate of oil field i at time t, pt is the real price of oil, and Xit
represents other controls. These controls include a time trend, an oil field fixed effect, and a fixed
effect for year of operation to control for the life-cycle dynamics of oil fields discussed in Arezki,
Ramey, and Sheng (2016) and Anderson, Kellogg, and Salant (2017).
Specification 1 in Table 8 is a simple OLS regression. The resulting slope coefficient estimate
can be biased downward if there is technical progress that lowers the cost of extraction, raising θit ,
increasing the supply of oil, and lowering pt . To address this problem, we instrument the price of
oil with our forecast of detrended world real GDP.
Specifications 2-4 use this instrument. Specifications 2, 3, and 4 include all oil fields, non-OPEC
oil fields, and OPEC oil fields, respectively. We obtain estimates of β that range from 0.2 to 0.21.
These estimates are broadly comparable to those obtained by Caldara, Cavallo, and Iacoviello
(2017), by combining a narrative analysis of episodes of large drops in oil production with country-
level instrumental variable regressions.
13
Our data pertain to proven reserves, which measure the total amount of oil that can be produced from a given field.
Reserves do not change in response to changes in oil prices, so there is no mechanical impact of oil prices on extraction
rates.
23Table 8: Price elasticity of extraction rates
Dep. variable: ln(extraction rate)
Variable (1) (2) (3) (4)
ln(price) 0.05∗∗∗ 0.20∗∗∗ 0.21∗∗∗ 0.21∗∗∗
(0.005) (0.009) (0.010) (0.027)
IV 7 3 3 3
Sample All All Non-OPEC OPEC
Clusters (oil fields) 11,553 10,958 9,471 1,217
Observations 229,985 229,390 201,386 28,004
Notes: This table presents estimates of the elasticity of extraction rates with respect to the price of oil.
The data used include all oil fields with positive extraction rates in 1970-2010, excluding the last year
of operation. The regression specifications include oil field and operation year fixed effects as well as a
year trend. Standard errors, clustered at the oil field level, are reported in parentheses. The instrument
for price is the one-year-ahead forecast of detrended world real GDP. (∗ ∗ ∗) - significant at a 1 percent
level.
The following calculation is useful for evaluating the magnitude of this elasticity. The average
extraction rate in our sample is 2.8 percent. A one standard deviation (27 percent) increase in the
price of oil raises the extraction rate from 2.8 percent to 2.9 percent, resulting only in a 5 percent
increase in production.
An oil field generally contains many oil rigs. Production increases can come from the intens-
ive margin (higher production from existing rigs) or the extensive margin (drilling new rigs).
Using a sample of Texas oil rigs, Anderson, Kellogg, and Salant (2017) show that the intensive-
margin price elasticity is close to zero, so production increases come from the extensive margin.
We conduct our analysis at the level of the oil field, so our supply elasticity encompasses both the
intensive and the extensive margins.
Table 9 reports our time-series estimates of the elasticity of the number of oil fields in opera-
tion with respect to real oil prices. Specification 1 is a simple OLS regression where the dependent
variable is the logarithm of the number of oil fields in operation worldwide and the independent
variable is the logarithm of real oil prices. Specification 2 uses our forecast of the cyclical compon-
ent of world real GDP as an instrument for the logarithm of real oil prices. Specifications 3 and
4 use as dependent variables the number of non-OPEC fields and OPEC fields, respectively. All
four specifications yield elasticity estimates that are statistically insignificant.
In Table 12, Appendix A, we report estimates of the elasticity with respect to oil prices of the
24Table 9: Price elasticity of oil fields in operation
Dep. variable: ln(number of operating oil fields)
Variable (1) (2) (3) (4)
ln(price) −0.12 −0.50 −0.28 −0.21
(0.06) (0.34) (0.21) (0.14)
Year trend 3 3 3 3
IV 7 3 3 3
Dep. variable All fields All fields Non-OPEC fields OPEC fields
Observations 49 49 49 49
Notes: This table presents estimates of the elasticity of the number of oil fields in operation with respect
to the price of oil. The dependent variable is the number of oil fields with positive extraction rates.
Newey-West standard errors computed with five-year lags are reported in parentheses. The instrument
for price is the one-year-ahead forecast of detrended world real GDP.
number of new oil fields that are producing and the number of oil fields that are retiring. Both
of these elasticities are statistically insignificant. Taken together, these results suggest that the
number of oil fields in operation does not respond in the short run to changes in oil prices.
We now discuss the implications of our model for the regressions reported in Table 8. We
simulate data from our model and run regression 8 using the one-year-ahead forecast of world
real GDP as an instrument for the price of oil. In our model, the elasticity of response of extraction
rates to changes in oil prices is 0.24, which is close to our empirical estimates reported in Table 8.
In estimating the structural parameters of our model, we target the unconditional correlation
between oil prices and oil production. This correlation, which is affected by both demand and
supply shocks, is close to zero in the data. The instrumental variable regression reported above
isolates the impact of demand shocks. For this reason, this regression focuses on an aspect of the
empirical performance of the model that we did not target in our estimation procedure.
4 The impact of fracking
In this section, we study the long-run impact of fracking on the level and volatility of oil prices
and world output. We then discuss the transition dynamics induced by the advent of fracking.
25You can also read