Digital Divide: Mapping the geodemographics of internet accessibility across Great Britain
←
→
Page content transcription
If your browser does not render page correctly, please read the page content below
Digital Divide: Mapping the geodemographics of internet
accessibility across Great Britain

Claire Powell & Luke Burns

University of Leeds, Leeds, United Kingdom

Abstract
Aim: This research proposes the first solely sociodemographic measure of digital accessibility
for Great Britain. Digital inaccessibility affects circa 10 million people who are unable to access
or make full use of the internet, particularly impacting the disadvantaged in society. Method:
A geodemographic classification is developed, analysing literature-guided sociodemographic
variables at the district level. Analysis: Resultant clusters are analysed against their
sociodemographic variables and spatial extent. Findings suggest three at-risk clusters exist,
‘Metropolitan Minority Struggle’, ‘Indian Metropolitan Living’ and ‘Pakistani-Bangladeshi
Inequality’. These are validated through nationwide Ofcom telecommunications performance
data and specific case studies using Office for National Statistics internet usage data.
Conclusion: Using solely contemporary and open-source sociodemographic variables, this
paper enhances previous digital accessibility research. The identification of digitally
inaccessible areas allows focussed local and national government resource and policy
targeting, particularly important as a key data source and methodology post-2021, following
the expected final nationwide census.

Key Words
Digital Accessibility, Geodemographics, Classification, K-means, Spatial Analysis

                                                1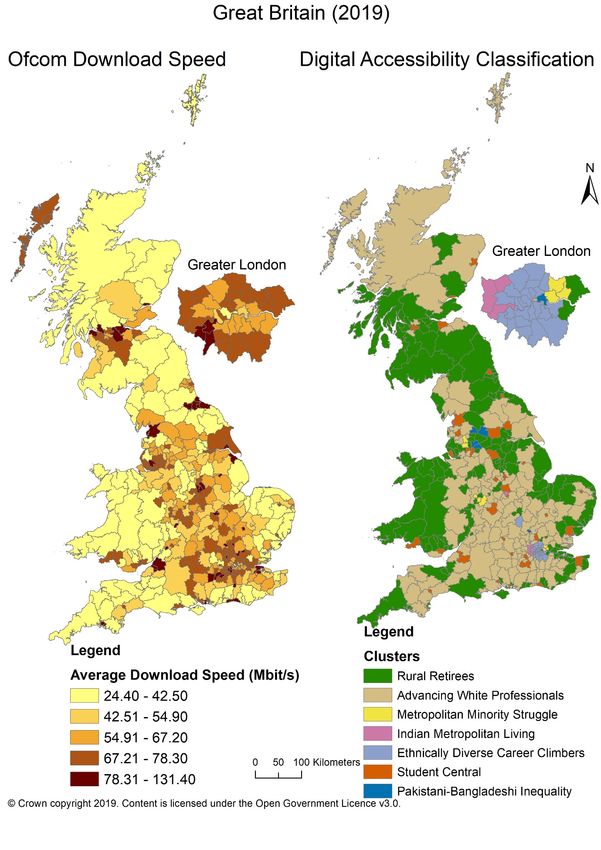
Introduction
Digital accessibility refers to the non-egalitarian divide between those with and those without
internet access (Castells, 2002; Singleton, et al., 2020). Overall, inaccessibility levels have
declined steadily in recent years, but a considerable proportion of the Great Britain population
remain without access (circa 10 million people in 2019 (Blank, et al., 2020) (Dutton & Blank,
2013)). Even with internet access, a minimum speed and connectivity is required to enable
multiple users using the same internet connection to carry out common daily tasks (UK
Government, 2020a), many of which are taken for granted.

According to the Office of Communications (Ofcom) and the UK Government (2020a) under
the Broadband Universal Service Obligation, a ‘decent broadband service’ has an upload
speed of 1 Mbit/s (megabit per second) and download speed of 10 Mbit/s. When compared to
Europe as a whole, the UK ranks 5th in internet services use (European Commission, 2020).

Digital accessibility can be split into three aspects: The first-level digital divide is the ability (or
inability) to access the internet due to physical infrastructure or financial constraints. The
second-level digital divide is how effectively people engage computer skills to exploit internet
benefits (Hargittai, 2002; van Deursen & van Dijk, 2011). The third-level digital divide
addresses internet use consequences (Selwyn, 2004; van Deursen, et al., 2017). This
research crosscuts all aspects, with a key focus on the first and second levels.

Factors influencing nationwide digital accessibility are multidimensional, often interrelated and
are generally directly associated with sociodemographic attributes that vary spatially.
Geodemographics, regularly defined as “the analysis of people according to areas where they
live” (Sleight, 1997, p. 16), takes into account socio-economic and demographic similarities
and differences, and has had considerable public and private sector success (Harris, et al.,
2005; Webber & Burrows, 2018).

In this research, the first solely sociodemographic measure of digital accessibility for Great
Britain will be presented, with findings analysed and validated. The most recent, freely
available administrative data and open-source software will be used, ensuring that the output
is both transparent and easy to replicate and update. Results are likely to aid future policy
recommendations pertaining to internet accessibility (and inclusivity) and influence more
broad internet connectivity debates.

                                                   2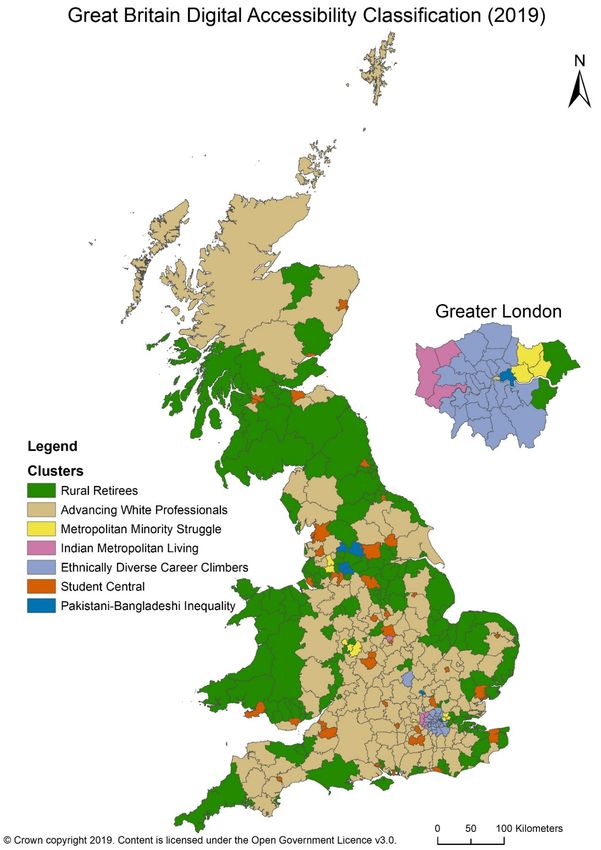
Research Rationale
Geodemographic measures surrounding the topic of digital accessibility are limited but include
a nationwide geodemographic ‘Internet User Classification’ created by Singleton et al (2020).
This work made use of exclusively transactional data, derived between 2013 and 2016. In
other work, Blank et al (2017) used small area estimation from individual-level small scale
survey data to determine the influence of demographic characteristics versus spatial
differences on 2013 internet use.

This research builds on the work of Blank et al (2017), by creating a new bespoke
classification, working with more recent and freely available data and using more complete,
nationwide survey data collected and verified by the UK Government. Longley et al (2008)
used well-known commercial geodemographic classification MOSAIC (Experian) to determine
individual levels of engagement with electronic technologies and products for marketing. This
research focusses specifically on sociodemographic factors as opposed to the narrow
economic influence. Sociodemographic factors encompass multiple dimensions of the
population (including direct and indirect impacts). Thus, this research will further develop
knowledge and contemporise past works in the domain.

Currently, no existing work has explored digital accessibility using only sociodemographic
variables across Great Britain. A core focus is on the less well researched first and second
digital divides. This research sets out to identify those at greatest risk of not gaining maximum
benefit from the internet.

Digital accessibility research is increasingly important globally, with the plethora of data
generation and technological advances. The 5G network is a wireless mobile network with
increased bandwidth (Médard, 2020), higher data capacity and faster, more reliable (99.9%)
latency (time between data transfer) than its predecessor 4G (Ilderem, 2020). Since May 2019,
5G has been progressively set up across Great Britain. Banning new Huawei technology will
slow and redact some 5G access in the short term, however, 5G is still set to hold the near
future of internet connectivity (National Cyber Security Centre, 2020; UK Government, 2020b).
This nationwide digital accessibility research will help identify the types of people at greatest
impact of loss of digital access and their spatial extent, particularly important as a data source
and methodology to follow after the last UK census in 2021. Use of government administrative
data in this research could highlight accurate district-level data sources for data analysis at
national and local level for future policy decisions and target setting.

                                                3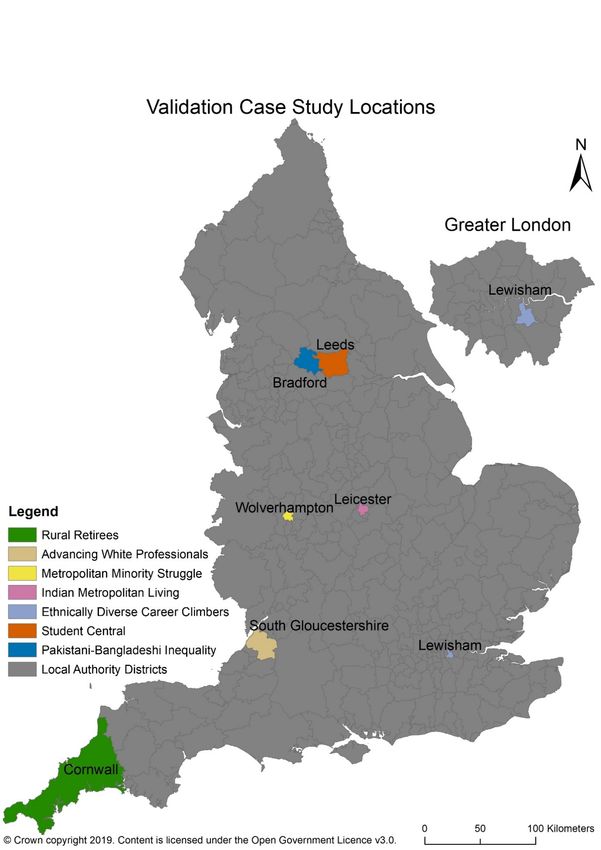
Review of Digital Accessibility
A thorough review of past related research was undertaken, exploring the current
understanding and knowledge linked to sociodemographic factors. Sociodemography is the
study of groups of the population that share characteristics (Lenormand, et al., 2015). Here,
variables that demonstrate fundamental disadvantage, both socially and demographically, can
help highlight those potentially most at risk from digital inaccessibility and exclusion.

Vicente and Gil-de-Bernabé (2010), alongside Epstein et al (2011), and White and Selwyn
(2013), suggest a more nuanced understanding of digital accessibility issues (backed by a
collective societal responsibility) could aid future government digital policies. This could also
aid advocation of the internet as a utility, a service the population cannot live without thus
short-term faults merit immediate repair. This is popular with many (e.g. Skerratt et al (2008),
Townsend et al (2013) and Philip et al (2015)) and already present in countries such as
Sweden and Finland.

Selwyn et al (2005) carried out an adult-focussed internet usage interview study which found
sociodemographic factors influencing internet-derived knowledge and in turn impacting
employment applications, job progression, health enquiries, social communication, business
operations and more. Blank et al (2020) also analysed multiple demographic factors (age,
education, income, functional literacy, gender, employment status, marital status, social
grade, ethnicity, children in household, disability) to determine nationwide internet use in the
2019 Oxford Internet Survey.

Qualifications

The most common digital access barrier identified in past work was educational
qualifications/attainment. Such qualifications indicate likely digital skills, ambition and
opportunities. A Dutch Internet Benefits survey by van Deursen and Helsper (2017) found
well-educated individuals are likely to be connected and regular internet users with advanced
internet skills and a greater quantity of positive digital experiences. Dutton and Blank (2013)
support this in a UK context through the Oxford Internet Survey, with 95% of university
graduates online compared to 40% with no educational qualifications. Those with graduate-
level qualifications, in line with National Vocational Qualification (NVQ) 4, and higher are more
adept at grasping online opportunities than those less qualified (Blank & Lutz, 2016).

The type of internet usage differs by qualification. Drawing from the Bourdieu (1977) Cultural
and Social Reproduction theory, Weber and Becker (2019) found well-educated European
adolescents use the internet more for school and educational work than entertainment.
Additionally, well-educated parents (particularly those using IT at work (Mesch & Talmud,

                                                4
2011)) encourage higher level IT activities (e.g. website creation) than their less educated,
less supported peers. A supportive environment promotes internet exploration,
experimentation and IT skills gain (Weber & Becker, 2019).
Rural digital research by Townsend et al (2013) noted UK-wide influences on internet access,
finding educated adults also gain from online employment opportunities and career
development, this being fundamental in a fluctuating economy where increasing human capital
through adaptability and retraining is vital to remain employable. Longley et al (2008), through
the UK e-Society National Classification, noted basic IT skills (defined in van Deursen et al
(2016) internet skills framework as the ability to find, select, and evaluate online information)
are considered employee responsibility and IT skills are as important as having higher
educational qualifications. Without internet, those who are less educated are restricted from
educational, employment and career development opportunities and limited in their
employment potential (typically gaining unskilled, manual work) (Townsend, et al., 2013).
Employment Status
A further factor identified as influencing digital access is employment status, often linked to
education and income. Higher qualifications often lead to higher salaried employment with
more disposable income for broadband connectivity and internet-enabled devices. High-
income users tend to carry out capital-enhancing activities and are more expressive internet
users (Blank & Lutz, 2016). In contrast, those residing where education inequality exists tend
to have income differentials and social disparities are perpetuated (Holsinger & Jacob, 2009).
Blank and Lutz’s (2016) research on internet benefits and harms in Great Britain built on
Blumler and Katz (1974) ‘Uses and Gratifications’ theory to reveal internet use satisfaction.
Findings showed young, highly educated, high income users benefit most from digital access
followed by the elderly. Although the benefits are subjective, the Uses and Gratifications theory
categorises benefit levels (e.g. goal-oriented use, fulfils needs and self-aware of reasons for
use). Education-income benefits are not definite with different socioeconomic groups having
different needs. Some benefit educationally, others by income, and many through both (Blank
& Lutz, 2016).
Xiang et al (2018) challenged findings suggesting education-income benefits do provide equal
benefit with education, a poverty reduction catalyst, promoting social mobility and producing
a skilled workforce. This paper focussed on Central Beijing education inequality. Other
research focussing on the employment, education, and internet accessibility link include:
Milanovic (2016), building on earlier work by Piketty and Saez (2003) who took a different
approach, proposing the Kuznets waves theory, where technology developments,
5globalisation and public policy cause income inequality fluctuations. Milanovic (2016) provided
evidence of the transfer from manufacturing to skill-heterogenous services (e.g. Big Data)
causing rising inequality. Links between employment, education, and internet accessibility are
established (Blank & Lutz, 2016; Milanovic, 2016). However, the majority of research
evidences these variables as providing varying benefit.
Age
Age can measure different life experiences, skills and knowledge. Longley et al (2008) noted
young adults gained internet experience when susceptible to learning and able to afford
technology. Livingstone and Helsper (2009) developed this further in their teenager-based
internet skills and self-efficacy study. Internet introduction in one context, such as work or
education, boosts spare time internet usage and exploration. Older community members and
all disadvantaged groups tend to have fewer internet-enabled devices and lower broadband
connectivity (Townsend, et al., 2014; Blank, et al., 2020). Most not having grown up using
digital devices have less internet experience, lowering online skills (instrumental rather than
experimental use) (Longley, et al., 2008). Fewer opportunities are grasped, potentially adding
financial and health burdens. Web products have efficient supply chains, cutting costs (saving
the UK £18 billion in 2009) (Kalapesi, et al., 2010). Online official health advice can promote
late-life wellness (Hargittai, et al., 2019). Online social or work network exclusion can
marginalise those unable to keep updated (Longley, et al., 2008).
Ethnicity
Multiple global ethnicity-focused internet access studies, including Chen and Wellman (2004)
and Mesch and Talmud (2011), found ethnic minorities tend to report less internet access.
More minority workers are employed in manual jobs, where internet exposure and learning IT
skills are deemed less important and are unsupported. Blank et al (2020) reinforced these
findings, adding UK minorities are more likely in disadvantaged groups. Scheerder et al (2017)
researched determinants of internet skills from 126 global journal articles and found
preconceived negative judgements of minority groups resulting from their disadvantaged
position, a leading factor in lack of internet confidence and a disincentive to internet usage.
6Research Approach
This paper adopts a seven-step structure to developing a geodemographic area-level
classification, similar to that proposed by Gibson and See (2006) and Burns et al. (2018).
Figure 1 summarises each of the seven replicable phases and the discussion that follows
provides additional contextual information.
Figure 1 Geodemographic System Framework, adapted from Gibson and See (2006, p.
214) and Burns et al (2018, p. 421).
7Phase 1: Purpose
The classification put forward in this research is the first solely sociodemographic measure of
digital accessibility for Great Britain. Guided by literature intelligence, the variables presented
in Table 1 were determined as being most effective at showing districts ‘at risk’ from digital
inaccessibility. These can be divided into two broad categories: ‘Demographic’ and ‘Social’.
Table 1: Domains, Dimensions and Measures of Digital Accessibility.
Adapted from Singleton et al (2020). Data derived from the ONS Annual
Population Survey (2019a).
Domains Dimensions Measures
Demographic Age 16-24 years
25-34 years
35-44 years
Ethnicity Mixed
Indian
Pakistani/Bangladeshi
Black
Other Minority Ethnicities
Social Qualifications National Vocational Qualification
(NVQ) 3+ (4/5 = e.g.
Undergraduate, 6 = Graduate, 7 =
Postgraduate, 8 = Doctorate)
Employment Status Unemployment
Inactive
Phase 2: Dataset
All data used in this research are open source, administrative, cover Great Britain (in full) and
are derived from the Office for National Statistics (ONS) Annual Population Survey (APS)
(2019a), Ofcom Telecom Operators Performance (2019a) and the ONS (2019b) Opinions and
Lifestyle Survey. APS is a household survey collected every quarter with circa 320,000
respondents (0.5% of the UK population). Data are added from the Labour Force Survey and
when combined have the largest coverage of any UK household survey, allowing
intergenerational statistics for small geographic areas. The survey estimates key social and
labour market variables (including employment and education) at local authority level (ONS,
2012). Data for January to December 2019 were used as part of this research (ONS, 2019a).
Ofcom is the UK regulator for communications. Performance data comprises broadband and
mobile 4G, 3G and 2G networks, from four mobile network operators (EE, O2, Three and
Vodafone) with the largest UK coverage (Ofcom, 2019b). Annual data releases are published
8alongside a report analysing current state of the UK communications infrastructure (Ofcom,
2019c). Ofcom uses Ordnance Survey (OS) AddressBase® Premium to assess broadband
coverage of individual in-use properties, which contains 44 million addresses from Local
Government National Land and Property Gazetteer, OS MasterMap address layer and Royal
Mail Postal Address File (Ofcom, 2019b). District codes and raw upload, data usage and
download data analysed are accurate to May 2019, with local authority boundary changes as
of December 2019 (Ofcom, 2019a).
The ONS Opinions and Lifestyle Survey is part of the Labour Force Survey and has collected
a wide range of UK-wide annual population data since 2011 (ONS, 2019c), with an average
of 40,000 respondents. Here, data selected relate to internet usage or non-usage. Data are to
the European Union NUTS (Nomenclature of Territorial units for Statistics) scale and use 2016
level 3 geographic boundaries, some of which cover the same geographical area as districts.
This internet usage data is from January to March 2019 (ONS, 2019c).
Use of opensource data alongside the following clear, detailed methodology enables
scientifically reproducible research to be open to scrutiny (Singleton & Longley, 2009). Non-
census data allows frequent area analysis between decadal censuses and post-2021
(Leventhal, 2016). Recent and regular data releases allow funding and resource targeting of
most spatially and temporally relevant results (Singleton, et al., 2016). Specifically,
administrative data can generally provide a wide variety of data that can be mined to extract
potentially useful information (Singleton & Spielman, 2014).
Data are aggregated to Local Authority District (317 in England), Unitary Authority (22 in
Wales) and Council Areas (32 in Scotland) level (as of December 2019) (Blank, et al., 2017).
Local Authority Districts vary between 2,300 and 1.1 million people, and include metropolitan
districts, London boroughs, non-metropolitan districts and unitary authorities. Welsh Unitary
Authority populations vary between 90,000 and 370,000 people, and Scottish Council Areas
vary between 22,000 and 650,000 people (Blank, et al., 2017). Aggregation level is referred
to as districts hereafter.
Phase 3: Pre-Processing
Following variable identification from a thorough review of contemporary academic literature,
11 variables influencing digital accessibility were collated. The number of variables were
limited to 11 to avoid noise, prevent misrepresentation of districts and reduce inaccuracies
from poorly fitting districts in clusters (Vickers & Rees, 2007).
9Prior to analysis, multiple pre-processing steps were undertaken to ensure data suitability,
using opensource software, R. Where the number of survey responses was below 500, data
was omitted to preserve confidentiality. This was only the case for identifying the number of
survey respondents who were of minority ethnicity status. However, total ethnicity was
available so missing values were able to be calculated in most cases. Where multiple data
were missing, averages were calculated following known data subtraction. Data were
transformed onto a continuous scale suitable for classification and polarity determined
(Leventhal, 2016) (Riekkinen & Burns, 2018).
Phase 4: Suitability
At this stage, data were assessed for suitability with regards to their inclusion in the
classification algorithm. Multicollinearity was evaluated (Figure 2) with highly correlating
variables further explored and consequently removed if variable impact was deemed less
important than any compounding impact on results. Retaining just one variable of a highly
correlating pair of variables enables each variable to contribute its own unique dimension in
the geodemographic classification (Lucy & Burns, 2017). An arbitrary multicollinearity
threshold of >±0.7 was selected in line with past academic research (Judge, et al., 1982;
Halkos & Tsilika, 2018).
10Figure 2 Multicollinearity – Final Eleven Variables
In Figure 2, multicollinearity is observed to ±0.7 and analysed using R. Blue indicates positivity
correlating variables. Red indicates negatively correlating variables. The darker the colour, the
stronger the correlation. Most variables are positively correlating with only Aged 35-44 years
and Inactive (employment status), NVQ 3+ and Unemployed, and Inactive and
Pakistani/Bangladeshi correlating negatively. The highest positive correlation is 0.695 (Black
and Aged 25-34 years); the highest negative correlation is -0.283 (Inactive and NVQ3+). All
variables correlate to 0.01 with 99% statistical significance and thus can be deemed high
confidence.
Variables undergo normalisation by Z-scores therefore allowing direct comparability (Vickers
#$ &
& Rees, 2007). Percentage values are transformed into Z-scores by: ! = '
. Z indicates the
standard score, ( is the observed value, ) is the sample mean and * is the sample standard
11deviation (Milligan & Cooper, 1988). Z-scores do not produce normalised data with
consistently the same scale. Adjustment of the scale enables an effective spread of outliers
and non-outlier data to be presented (Shinwell & Cohen, 2020). For this nationwide research
where there is a large dataset and outliers are likely, Z-scores tend to perform most effectively
when compared to alternative approaches, such as Principle Components Analysis or Min-
Max (0-1) scaling.
Phase 5: Clustering
This research opted to use K-Means classification as the route to partition the
multidimensional dataset. K-Means is an unsupervised, hard (crisp) partitioning clustering
algorithm that uses machine learning to group large volumes of data based on variable
similarity (MacQueen, 1967; Hartigan & Wong, 1979). K-Means has its starting seeds and the
number of clusters predetermined (Major, et al., 2018). Starting seeds highly influence final
cluster solution, therefore repeat-clustering (with randomised seeds) ensures more accurate
and valid results (Burns, 2017; Xiang, et al., 2018). K-Means is computationally fast, accurate
and sensitive to outliers (Cardot, et al., 2012; Gupta & Panda, 2018).
Guided by the literature, statistical R package, clValid, and similar previous commercial and
academic success, K-Means was deemed the most appropriate algorithm for the dataset.
Previous successful K-Means classifications (in the geodemographics domain) include the UK
2011 Area Classifications (ONS, 2016), Personicx by Acxiom (2020) and Experian MOSAIC
system (2020). The clValid package compares multiple algorithms to identify the ‘best’
clustering method (Brock, et al., 2008).
Following K-Means selection, the number of clusters required identification. Statistical
algorithms, including Gap Statistic and Clustergram, determine cluster numbers in R. All
evaluate the whole dataset (globally) rather than analysing individual pairs of clusters (locally)
to test if amalgamation improves clusters (Gordon, 1999), and all test a range of different
cluster numbers and are well suited to the 9,646 data points (de Amorim & Hennig, 2015). The
Gap Statistic explores partitions in the dip of a normalised performance plot. A suitable number
of clusters is achieved when the smallest number of clusters (where gain is not higher than
expected on the normalised performance curve) is identified (Tibshirani, et al., 2002). The Gap
Statistic works well alongside K-Means. Clustergram, also effective for non-hierarchical
clustering, plots a series of potential cluster frequency values alongside the weighted mean of
their first principal component (Wierzchoń & Kłopotek, 2017). The resultant graph shows the
relative separation of clusters. Distinctive and well-separated clusters are deemed most
suitable given their homogenous nature (Schonlau, 2002).
12In this research, the number of clusters was most accurately determined by using the Gap
Statistic approach (Tibshirani, et al., 2002) (Figure 3) and Clustergram (Schonlau, 2002)
(Figure 4). The Gap Statistic was run 500 times and Clustergram repeated 100 times, both
with different cluster ‘starting points’ each time, ensuring initial seeds were randomly allocated
and different combinations could be created (Singleton, et al., 2020).
Figure 3 Example Gap Statistic
After being run 500 times, Figure 3 suggested 6 clusters as most suitable for those specific
variables. Seven clusters also appear viable with a very similar gap statistic (~0.975) and
confidence intervals.
13Clustergram of the PCA-weighted Mean
of the K-Means Clusters vs Number of Clusters (k)
Figure 4 Example Clustergram
From Figure 4 and all subsequent repeats, 5 and 7 clusters are consistently the two highest
and most well distributed number of clusters. Seven clusters appear in both statistical methods
as a potential optimum number of clusters. Although, 7 is not the optimum chosen by the Gap
Statistic, values are very similar to the optimum, 6, which would not be selected as optimum
by the Clustergram due to poor, inconsistent distribution of Principal Components Analysis
weighted cluster means.
A seven-cluster classification was deemed most statistically suitable. Greater cluster numbers
decrease cluster-cases association strength, cases are less representative of clusters (Harris,
et al., 2005). K-Means involves an iterative process of moving one district (hereafter case)
from one cluster to another to evaluate if a move enhances the sum of squared deviations
within each cluster (Aldenderfer & Blashfield, 1984; Burns, et al., 2018). Cases are allocated
(or re-allocated) to clusters until all cases are stable in clusters and provide maximum
improvement to the cluster. Cases with similar variables group together and dissimilar
variables exist in different clusters (Kaufman & Rousseeuw, 1990). Clusters created should
represent discrete categories and reflect similar districts (Spielman & Thill, 2008). Starting
cluster centres and initial seeds can determine different solutions depending on data order,
therefore most accurate cluster solution requires running of the algorithm multiple times (here
1,000) with different initial cluster centres each time (Singleton, et al., 2016).
14K-Means Evaluation
K-Means attempts to minimise ‘within’ cluster variability and maximise ‘between’ cluster
variability (Vickers & Rees, 2007). Cluster centres and Analysis of Variance (ANOVA) F value
gauges distinctiveness and robustness of cluster-cases fit (Everitt, et al., 2011). Final cluster
centres show all classification variables. Values above zero show a variable is above the
population mean in the districts within that particular cluster. Values sub-zero, below the
population mean, show variables that are less prevalent in those districts for that particular
cluster. ANOVA F values reflect variables which provide greatest contributions to resultant
clusters, as shown in Table 2, thus highlighting effectiveness of clusters. Higher F values
indicate greater influence in dividing districts into separate clusters. Number of cases (or
districts) in each cluster also reflects cluster effectiveness in Table 3. Evenly spread values
show clusters represent a range of variable characteristics experienced in districts across
Great Britain.
Boxplot showing distance of cases from cluster centres against cluster numbers shows the
relative allocation of districts into clusters. The boxplot (Figure 5) is the final visualisation of
SPSS cluster effectiveness. Data points residing further from the mean (or outliers) show
districts that fit less suitably into clusters. In such clusters, variables are likely to be misaligned
with the majority of districts in that cluster. However, a district can be placed there as it is the
‘best fit’ of clusters available. A classification containing many outliers across multiple clusters
may suggest re-running the K-Means algorithm with more clusters may be beneficial.
Phase 6: Visualisation
Upon K-Means completion, district codes and cluster numbers were mapped in a geographical
information system (using opensource QGIS). London was mapped separately to Great Britain
showing its distinct geographical patterns. Clusters were described using pen portraits – short
summaries of distinctive sociodemographic and spatial features in each cluster.
Phase 7: Validation
The classification was validated by matching case (district) codes to Ofcom (2019a)
broadband performance dataset and the ONS Internet Users (2019b) dataset. Nationwide
Ofcom upload and download data were compared against the Great Britain classification
results to see actual areas where low upload and download speeds were present. ONS
(2019b) Internet Usage data validated specific case studies representing each of the clusters.
Linking the final classification to other datasets also corroborates classification success given
how additional data can improve discrimination between districts (Longley, et al., 2008). Areas
15where download or upload speeds are slow or where internet usage is already low could
identify at-risk internet inaccessibility areas.
A K-Means geodemographic classification was deemed most suitable for the 11 literature-
guided sociodemographic variables. Overall statistics, the Gap Statistic and Clustergram,
assessed the optimum number of clusters as 7. Greater London, known as being
geographically and socio-demographically distinctive, was mapped separately to Great
Britain. Methods were run hundreds of times to ensure reliable results. Findings were mapped
to show spatial extent and allow validation with datasets from well-regarded organisations,
Office for National Statistics and Ofcom.
16Analysis: Digital Accessibility Classification
Figure 6 Great Britain Digital Accessibility 2019 Classification Map with Greater London inset
17The final digital accessibility classification (Figure 6) has nationwide and district level
differences. Most ‘Rural Retirees’ are coast-based, whilst all other clusters tend to be inland.
‘Rural Retirees’ and ‘Advancing White Professionals’ cover the majority of Great Britain whilst
‘Student Central’ covers all major university cities, including Glasgow, Leeds and Warwick.
Regional cluster groupings are present, particularly in Wales, the English-Scottish border and
London. At district level, some are grouped with others nearby, notably the largely Northern
England at-risk ‘Pakistani-Bangladeshi Inequality’ cluster and the ‘Ethnically Diverse Career
Climbers’ cluster. Other clusters appear individually at specific locations such as the ‘Student
Central’ cluster, ‘Metropolitan Minority Struggle’ and ‘Indian Metropolitan Living’.
London is known to be socio-economically and demographically distinct to the remainder of
the country, hence why London is mapped separately. Dean et al (2012) found London and
the South East to be the most prosperous and ‘wired’ parts of the country with regards to
connectivity, and later research by Dutton and Blank (2013) supported this, finding that
regional Internet use varies from 60% in the North East, 71% in Wales to 86% in London and
83% in the South East, in the 2013 Oxford Internet Survey. In Figure 6, London is very clearly
distinct in the classification, containing the majority of ‘Indian Metropolitan Living’ and
‘Ethnically Diverse Career Climbers’ clusters.
The Great Britain population is a mix of different sociodemographic groupings and divides
(ONS, 2019a), and thus the classification provides a good district level representation. District
level data also matches the level of UK Government statistics; therefore, results are easily
transferable into policy (Grupp & Mogee, 2004) and match census results, potentially providing
further future validation. District level is a finer spatial resolution than other coarse scales, e.g.
Nomenclature of Territorial Units for Statistics (NUTS) level where large significantly different
socioeconomic and demographic cities are merged (Longley, 2012). However, it is important
to note that no spatial scale is ever representative of every individual. Presumption of
individual characteristics about where they live from large scale results defines the ecological
fallacy (Voas & Williamson, 2002). Classification outputs repositioned out of their original
spatial context fall into the modifiable areal unit problem (Openshaw & Wymer, 1995). Policy
leaders must be aware of aggregated data, underlying variables or spatial patterns at the
original spatial extent when creating policies, to avoid potentially inaccurate presumptions
(Riekkinen & Burns, 2018).
18Pen Portraits
Presumed below are pen portrait (qualitative descriptions) of each of the seven clusters as
shown in Figure 6.
Cluster 1 - Rural Retirees
All groups are based on literature-guided sociodemographic variables from Table 1. This
group (Figure 7) has higher majority white ethnicity, generally based in coastal and rural areas
with a large share of residents > 44 years old, inactive and unemployed. The proportion of
those of Pakistani-Bangladeshi and Indian ethnicity is lowest here and in the Advancing White
Professionals cluster. The majority of Great Britain aligns in Rural Retirees and Advancing
White Professionals clusters. Rural retiree areas include much of Wales, the Scottish-English
border, Norfolk-Suffolk coast and Cornwall.
Cluster 2 - Advancing White Professionals
The Advancing White Professionals group (Figure 8) comprises of middle-aged working
professionals typically aged between 35 and 44 years old, and above. This cluster has an
above average proportion of well-educated residents with > NVQ3+ qualifications residing
inland and a large proportion active or employed. The majority of Great Britain fall into this and
the Rural Retirees cluster. Advancing White Professionals areas include the Scottish
Highlands and Islands, and much of central Southern England.
19Figure 7 Rural Retirees Profile
Figure 8 Advancing White Professionals Profile
20Cluster 3 - Metropolitan Minority Struggle
This group (Figure 9), scattered in small clusters across England, are at risk of digital
inaccessibility. Pakistani/Bangladeshi, Black and Indian ethnicities are above average in the
population. Residents are more likely aged between 25 to 44 years old, currently inactive or
unemployed with qualifications lower than NVQ3+. Metropolitan Minority Struggle areas
include Birmingham, Wolverhampton and North East London.
Cluster 4 - Indian Metropolitan Living
Within this group (Figure 10), the highest proportion of residents are of Indian ethnicity with a
high proportion also from other minority ethnic groups (other than Mixed, Black and Pakistani-
Bangladeshi), with similar proportions to the Ethnically Diverse Career Climbers cluster. Many
in the group are aged 35-44 years old and are inactive in their employment searching. This
cluster will likely also require digital access help. Indian Metropolitan Living areas include
Southern England and include Hillington, Leicester and West London.
21Figure 9 Metropolitan Minority Struggle Profile
Figure 10 Indian Metropolitan Living Profile
22Cluster 5 - Ethnically Diverse Career Climbers
This group (Figure 11) has an above average mix of Black, Mixed and other minority ethnic
groups, except Pakistani-Bangladeshi and Indian ethnicity which are less prevalent in this and
the Student Central cluster. A large proportion of residents are aged 35 to 44 years and are
well-educated, with most awarded NVQ3+ qualifications. Ethnically Diverse Career Climbers
areas include Milton Keynes and much of North and East central London.
Cluster 6 - Student Central
The Student Central group (Figure 12) contains above average unemployed and inactive
residents with the highest above average proportion of 16 to 24-year olds across all clusters.
Those aged 25 to 34 years are also above average. A mix of all majority and minority
ethnicities exists with none significantly more dominant. Student Central areas include Leeds,
Lancaster, Warwick and Edinburgh.
23Figure 11 Ethnically Diverse Career Climbers Profile
Figure 12 Student Central Profile
24Cluster 7 - Pakistani-Bangladeshi Inequality
Another at-risk digital accessibility group (Figure 13) is the Pakistani-Bangladeshi Inequality
cluster. Here areas have above average residents aged 25 to 34 years old and the highest
proportion of residents of Pakistani-Bangladeshi ethnicity. Most do not have qualifications
surpassing NVQ3+ and are inactive and unemployed. Internet access could potentially aid
employment prospects. Pakistani-Bangladeshi Inequality areas generally located in Northern
England, including Bradford, Oldham and Luton, with Tower Hamlets the only Southern
district.
25Figure 13 Pakistani-Bangladeshi Profile
26Cluster Effectiveness
When analysing cluster outputs, the ANOVA F number, number of cases in each cluster and
boxplots are known determiners of cluster effectiveness.
Table 2: ANOVA F Results
Z-Scored Variables F
Unemployed 28.5
Inactive 42.8
Mixed 52.0
Indian 125.1
Pakistani/Bangladeshi 162.9
Black 90.8
Other Minority Ethnic Groups 103.5
Aged 16-24 years 136.2
Aged 25-34 years 67.6
Aged 35-44 years 51.8
NVQ3+ 45.0
The ANOVA F value denotes which variables contribute most to the resultant clusters
(Sarstedt & Mooi, 2019). In Table 2, all F values are high, have similar values, averaging 82.4,
and have a maximum variation of 134.4, which shows all variables contribute to cluster
categorisation and no single variable dominates, nor do any variables offer little or no
discrimination. The highest contributing variables are Pakistani/Bangladeshi, Indian, other
minority ethnic groups and those aged 16 to 24 years. The lowest contributing variables are
unemployed, inactive, National Vocational Qualifications (NVQ) 3+, aged 35 to 44 years and
Mixed ethnicity.
27Table 3: Number of Cases/ Districts in each Cluster
Cluster Cases
Rural Retirees 137
Advancing White Professionals 151
Metropolitan Minority Struggle 9
Indian Metropolitan Living 4
Ethnically Diverse Career Climbers 25
Student Central 38
Pakistani-Bangladeshi Inequality 6
Similarities in mean cluster centre distances (particularly clusters 4, 6 and 7) and extreme
values exist (Figure 5). Table 3 highlights where differences exist between clusters in terms
of sociodemographic characteristics and distribution of individual districts within clusters.
Cluster 2 has the greatest number of districts, 147 more than the lowest number of districts in
Cluster 4. The first two clusters contain the largest quantity of districts. Although an even
spread of districts in clusters is optimum (Sarstedt & Mooi, 2019), districts across Great Britain
are likely to have variation and some characteristics will be present in more districts than
others due to the changing sociodemographic nature of this research. All 370 districts across
England, Scotland and Wales are accounted for effectiveness (Everitt, et al., 2011).
28Figure 5 Digital Accessibility Classification Boxplo
29Figure 5 (boxplots) denotes overall cluster effectiveness. The mean cluster centre distances
vary between 1.5 and 3.5. Most (3 out of 7 clusters) have mean cluster centre distances
between 2.1 and 2.5. Cluster centres differ as every district in each cluster is likely to have
differing levels of each of the 11 sociodemographic variables. Clusters form when districts
have sufficiently similar variable levels to group (Kaufman & Rousseeuw, 1990).
Clusters 1, 2, 6 and 7 have outliers, 3, 4 and 5 do not. Cluster 2 has the most outliers and the
highest overall outlier at 6.7. Clusters 1 and 6 contain the most variation, with the highest
upper extreme and lowest lower extreme values, perhaps unsurprising since retirees and
students are likely a diverse mix of people. Despite these variations, overall mean distances,
extremes and outliers tend to be relatively low, a sign of better district-cluster suitability.
Clusters 3, 4 and 7 represent poorly educated, inactive or unemployed residents of minority
ethnicities, most at risk of digital inaccessibility.
Analysis of variable groupings and cluster effectiveness imply clusters at greatest risk of digital
inaccessibility are ‘Metropolitan Minority Struggle’, ‘Indian Metropolitan Living’ and ‘Pakistani-
Bangladeshi Inequality’. Those in clusters at least risk of digital inaccessibility are ‘Rural
Retirees’, ‘Advancing White Professionals’, ‘Ethnically Diverse Career Climbers’ and ‘Student
Central’.
External Validation
To evaluate the digital accessibility classification and validate pen portraits, Great Britain-wide
Ofcom (2019a) Telecommunications Operator Performance data, followed by cluster case
study-specific analysis with ONS (2019b) Internet Users data was undertaken. Ofcom data
refers to wireless mobile internet access, a good access indicator where wired is unavailable.
Download and upload speed, used in calculating internet speed, was used at district level
using all internet line types for validation. Download speed indicates speed data is obtainable
from a server (e.g. video streaming), whereas upload speed determines how fast data is sent
to others (e.g. sending emails) (Riddlesden & Singleton, 2014).
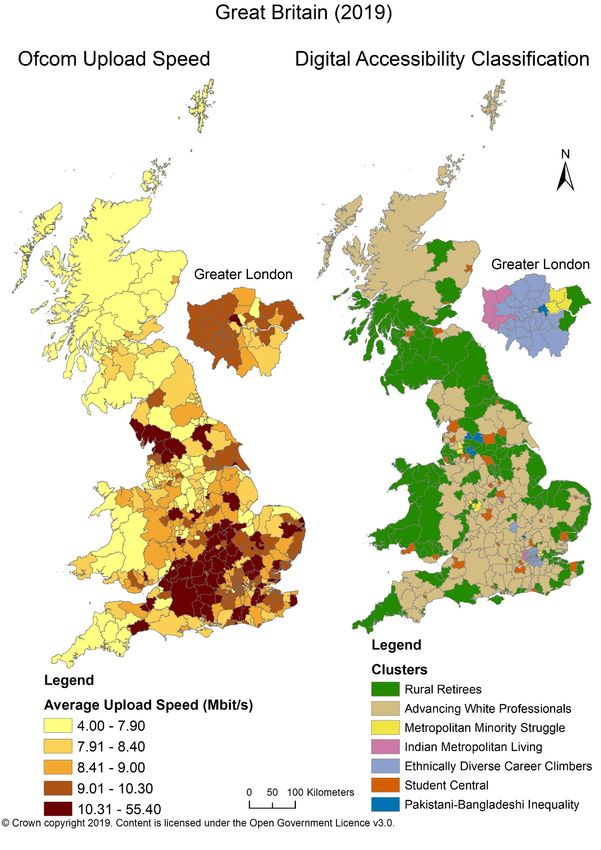
304.4.1 Ofcom Upload Performance
Figure 14 Ofcom upload speed compared against the Digital Accessibility Classification
Figure 14 shows Ofcom (2019a) average upload speed alongside the Digital Accessibility
Classification. Great Britain average upload speed is ‘decent’ at 10 Mbit/s (Ofcom, 2019c).
31Highest upload speeds (> 10.31 Mbit/s) follow the ‘Advancing White Professionals’ cluster in
locations including Wiltshire, West Oxfordshire and Mid-Suffolk. Lowest upload speeds (< 7.90
Mbit/s) follow the ‘Rural Retirees’ cluster in locations including mid-Wales, Cornwall and the
Scottish Highlands. Clusters deemed to be at-risk from digital accessibility also show the
lowest upload speeds and cover areas including Bradford (‘Pakistani-Bangladeshi Inequality’
cluster), Wolverhampton (‘Metropolitan Minority Struggle’) and Leicester (‘Indian Metropolitan
Living’). Those in the ‘Ethnically Diverse Career Climbers’ and ‘Student Central’ clusters show
a range of high upload speeds, the majority > 9.01 Mbit/s, the second highest upload speed
range. Outside of London in Milton Keynes the highest upload speeds are present, within
Greater London upload speeds vary. London is geographically and demographically distinct
(Dean, et al., 2012). Therefore, analysis and validation are focussed on the nationwide results
rather than London-centric differences.
324.4.2 Ofcom Download Performance
Figure 15 Ofcom telecommunication operator download speed compared against the Digital
Accessibility Classification
33Figure 15 shows Ofcom (2019a) average download speed alongside the Digital Accessibility
Classification. Great Britain’s average download speed is ‘superfast’ at 58 Mbit/s (Ofcom,
2019c). Most of the country accesses the lowest average download speeds between 24.40
Mbit/s and 42.50 Mbit/s, thus determining clear cluster differences. Smaller spatial scale case
study analysis would highlight these differences more clearly. In not at-risk areas similarities
exist with ‘Rural Retirees’ experiencing the lowest upload and download speeds (< 42.50
Mbit/s). All other not at-risk clusters have high, above average download speeds. All in the
Student Central cluster have high speeds above 54.91 Mbit/s. The ‘Ethnically Diverse Career
Climbers’ cluster has higher speeds, averaging 67.40 Mbit/s across areas. Speeds for the
‘Advancing White Professionals’ vary but the majority surpass 54.91 Mbit/s.
At-risk area download speeds vary, some show above the Great Britain average and some
below average. ‘Indian Metropolitan Living’ and ‘Metropolitan Minority Struggle’ have high
download speeds between 67.21 and 78.30 Mbit/s. Pakistani-Bangladeshi areas vary either
side of the Great Britain average between 54.91 and 67.20 Mbit/s. One third of areas are
below the Great Britain average.
Ofcom data validates the classification nationwide. Generally, assumptions are validated: rural
clusters and socio-demographically disadvantaged clusters have less digital access.
However, some variation exists, particularly clusters in cities. Those disadvantaged in at-risk
clusters, as in Xiang et al (2018) Central Beijing educational inequality work, should be
validated further using case studies (Table 4) enhancing clarification and pinpointing areas
within largely urban clusters most requiring additional digital access help.
34Case Studies
Figure 16 Case study locations
Figure 16 presents one stereotypical district from each Classification cluster as seen in the
ONS APS Dataset (2019a).
35Table 4: Rank of UK Internet Users using Example At-Risk and
Not At-Risk areas from Digital Inaccessibility Classification.
Derived from ONS (2019b)
Digital Accessibility Used in Last Never Used/ 3+ months
Risk 3 months since use
Cornwall 25th 29th
Not At Risk
South
12th 42nd
Gloucestershire
Lewisham 15th 99th
6th
Leeds 64th
Bradford 45th 36th
At Risk
Leicester 73rd 66th
Wolverhampton 138th 23rd
There are 174 total areas in the NUTS scale.
Table 4 presents case study districts ranked by recent internet usage. ONS internet usage
data is to a NUTS level scale, a coarser spatial scale and not equivalent to districts (Longley,
2012). Generally, this would not be usable as validation. However, the cluster case studies
have the same physical geographic boundaries thus results are relatively comparative.
Table 4 highlights the difference in internet usage by at-risk and not at-risk areas. The not at-
risk ‘Ethnically Diverse Career Climbers’ cluster in Lewisham has the lowest ‘never used’ or
‘used over 3 months’ nationwide internet usage at 99th, most residents are connected and
regular internet users. The highest internet usage over the last 3 months is ‘Student Central’,
Leeds, at 6th. Other not at-risk clusters also have high internet usage: South Gloucestershire,
an ‘Advancing White Professionals’ cluster, has the next highest internet usage, closely
followed by ‘Ethnically Diverse Career Climbers’ in Lewisham and Cornwall, a ‘Rural Retirees’
cluster. All are within the top 25 internet users.
36In contrast, at-risk areas are ranked lower in internet usage over the last 3 months.
Wolverhampton, a ‘Metropolitan Minority Struggle’ cluster, is ranked lowest for internet usage
in the last 3 months against the other case study areas and ranked 138th out of 174 UK areas.
Wolverhampton is ranked highest regionally and nationwide in the at-risk clusters for those
who have never accessed the internet or not accessed in over 3 months. Leicester, an ‘Indian
Metropolitan Living’ cluster, has next lowest 3-month internet usage followed by Bradford.
Clear differences exist between case study clusters. At-risk clusters have more residents not
having used the internet and the lowest level of internet users in the last 3 months.
‘Metropolitan Minority Struggle’, ‘Indian Metropolitan Living’ and ‘Pakistani-Bangladeshi
Inequality’ clusters are at greatest risk of digital inaccessibility in the Digital Accessibility
Classification. This research is further verified by Ofcom upload and download speeds and in
specific UK Internet Usage case studies. The Great Britain upload speeds mapped alongside
the classification supports several classification findings. A physical digital divide exists with
‘Rural Retirees’ receiving the slowest upload speeds and urban ‘Advancing White
Professionals’ receiving the highest upload speeds. Sociodemographic differences exist with
all disadvantaged clusters associated with digital inaccessibility, obtaining the lowest upload
speeds. By contrast, all privileged clusters access the highest upload speeds. Findings are
validated across Great Britain. However, variation does exist in London where upload speeds
vary and districts are not consistent with the digital accessible-inaccessible cluster divisions.
Validation of download speeds is less definitive with the majority of speeds across Great
Britain relatively low. Clear, immediate differences between classifications deem digital
accessible and inaccessible clusters difficult to determine. The physical access division exists
to an extent with Metropolitan clusters (‘Indian Metropolitan Living’ and ‘Metropolitan Minority
Struggle’) generally having high download speeds. Sociodemographic cluster divisions are
less clear, with variations in download speeds. For instance, one-third of the digitally
inaccessible Pakistani-Bangladeshi cluster has low download speeds, below the Great Britain
average. The lack of clear-cut validations among all clusters in Figure 15 are in part due to the
wide spatial scale the Great Britain download speeds cover. The additional case study specific
validation further clarifies classification findings.
Ranked UK internet users (Table 4) further corroborate classification findings. Digitally
inaccessible clusters correspond with areas in Table 4 with fewer regular internet users,
greater periods between internet use and more residents who have never used the internet
before. The reverse applied for people in clusters deemed to have greater digital accessibility.
37Conclusion
To conclude, this innovative, solely sociodemographic geodemographic Digital Accessibility
Classification highlights districts across Great Britain at-risk and not at-risk from digital
inaccessibility. Lack of effective digital access in disadvantaged districts can impact
employment, health, education and more. This classification surpasses previous digital access
studies as data specifically highlights those disadvantaged. The data is the most recent
release, open source and covers Great Britain and the methodology is transparent, allowing
scrutiny.
Nationwide and case study validations have supported the literature-guided Classification
findings. Upload speed validation supports physical digital access divisions impacting rural
areas with low internet speeds, particularly in the Scottish Highlands, Mid-Wales, the Scottish
borders and in the South West of England. Distinct differences exist between at-risk and not
at-risk clusters. Case-study specific classification validation against internet usage supports
that residents who experience low upload speeds, low internet usage and who have not used
the internet in over 3 months (if connected to the internet at all), align strongly with internet
inaccessibility clusters from the Digital Accessibility classification. These residents, found in
the ‘Metropolitan Minority Struggle’, ‘Indian Metropolitan Living’ and ‘Pakistani-Bangladeshi
Inequality’ clusters, exhibit above average sociodemographic variables associated with
disadvantage. By contrast, in districts where residents receive high upload speeds, high
internet usage and have a low proportion of people who have never used the internet,
privileged sociodemographic variables are present. These areas not requiring targeted digital
access help comprise the ‘Advancing White Professionals’, ‘Rural Retirees’, ‘Student Central’
and ‘Ethnically Diverse Career Climbers’ clusters.
Classification Limitations
Statistical Limitations
Statistics to determine the number of clusters, the Gap Statistic and Clustergram were run 500
and 100 times respectively. Number of iterations was determined from previous
geodemographic classification literature (Xiang, et al., 2018; Singleton, et al., 2020). For the
K-Means classification this could be increased, however, this is unlikely to change the number
of clusters identified as most suitable nor the K-Means classification F number, number of
cases per cluster or any other outcomes.
38Upload Validation Limitations
Upload speed validation supports overall classification findings. Greater London variations do
not consistently match against cluster divisions; however, London is known to be
demographically distinct (Dean, et al., 2012). Rerunning of the classification to analyse specific
locations, such as London, may further distinguish differences.
Additional rerunning at a smaller spatial scale (e.g. postcode) could enable more specific
digital access and resource targeting. Ofcom validation data is freely available at postcode
level, however ONS data is not. Accessing secure ONS data to postcode level would lead to
more specific spatial analysis, however without all data being freely, publicly available the
classification cannot be scrutinised in-depth. Yet with postcode level ONS data released
publicly, individuals most socially disadvantaged and vulnerable could potentially be identified
and be at-risk from targeting by commercial and criminal organisations. This is the overarching
reason for maintaining data to district level, allowing a high spatial resolution over Great Britain
while being able to highlight specific districts at-risk from digital inaccessibility.
Download Validation Limitations
Download speed validation less definitively supports classification findings. There is support
for a physical digital access divide with higher download speeds in Metropolitan clusters
compared to generally rural-based clusters. However, download speeds are low across the
majority of Great Britain, specific differences between sociodemographic digital accessible
and inaccessible clusters are difficult to determine. Specific case study validation strengthens
findings.
Internet User Validation Limitations
The case study validation used data from a NUTS level Internet User survey. Generally, this
would not be comparable with the district level ONS data for the classification. NUTS has a
coarser spatial scale than district. However, for these case studies, the same physical
geographic boundary exists. Other case studies may not be comparable at the same
geographic level. Care must be taken if this validation is required for other areas.
39Classification Reusability
Short-Term Reusability
The Digital Accessibility research identifies at-risk clusters and their spatial extent to district
level, which should aid future government policy. Districts requiring additional help could be
targeted. Locations of inaccessibility are places where future infrastructure planning (e.g. 5G
masts) or computer skills training would be beneficial. The sociodemographic variables
selected are multidimensional, capturing key parts of society.
Longer Term Reusability
The open source publicly available data and clear, transparent methodology used have
enabled this in-depth analysis and break down of the classification. Methodology transparency
allows the classification to be updated when new data releases are available and to sharper
spatial scales using finer sociodemographic variable data, if local classifications are required
to identify at-risk postcode zones for local councils. Data backlog and resource reallocation
due to the Coronavirus pandemic have already seen ONS (2020) data releases delayed. The
aforementioned delay, alongside what is expected to be the final nationwide census in 2021
means that this Digital Accessibility classification, a measure of social disadvantage and digital
inaccessibility, is an important asset. It is perhaps one of the most up to date
sociodemographic-focussed data classifications for a prolonged period, in a time when those
who are already disadvantaged require the greatest support.
Summary
The Digital Accessibility Classification successfully pinpoints districts across Great Britain
requiring additional help to get connected to the internet or help gaining computer skills. Skill
and knowledge improvement allow the internet to be used effectively to provide benefit and
opportunities. In Great Britain, places including Bradford, Wolverhampton and Leicester are
within the Pakistani-Bangladeshi Inequality, Indian Metropolitan Living and Metropolitan
Minority Struggle clusters that require additional help. A total of 19 districts require immediate
help overcoming the sociodemographic impacts of digital inaccessibility. Specific
sociodemographic variables tend to be associated with social disadvantage and digital
inaccessibility. It is these variables which local and national government need to focus on and
tailor solutions towards. The entire population, regardless of age, ethnicity, employment status
and qualifications should be able to access the internet and be taught the skills to use it.
40You can also read